Microstructural Analysis and Mechanical Properties of TiMo20Zr7Ta15Six Alloys as Biomaterials

 , and
, and
Abstract
:1. Introduction
2. Materials and Methods
2.1. Samples Preparation
2.2. Surface Analysis; Microstructure
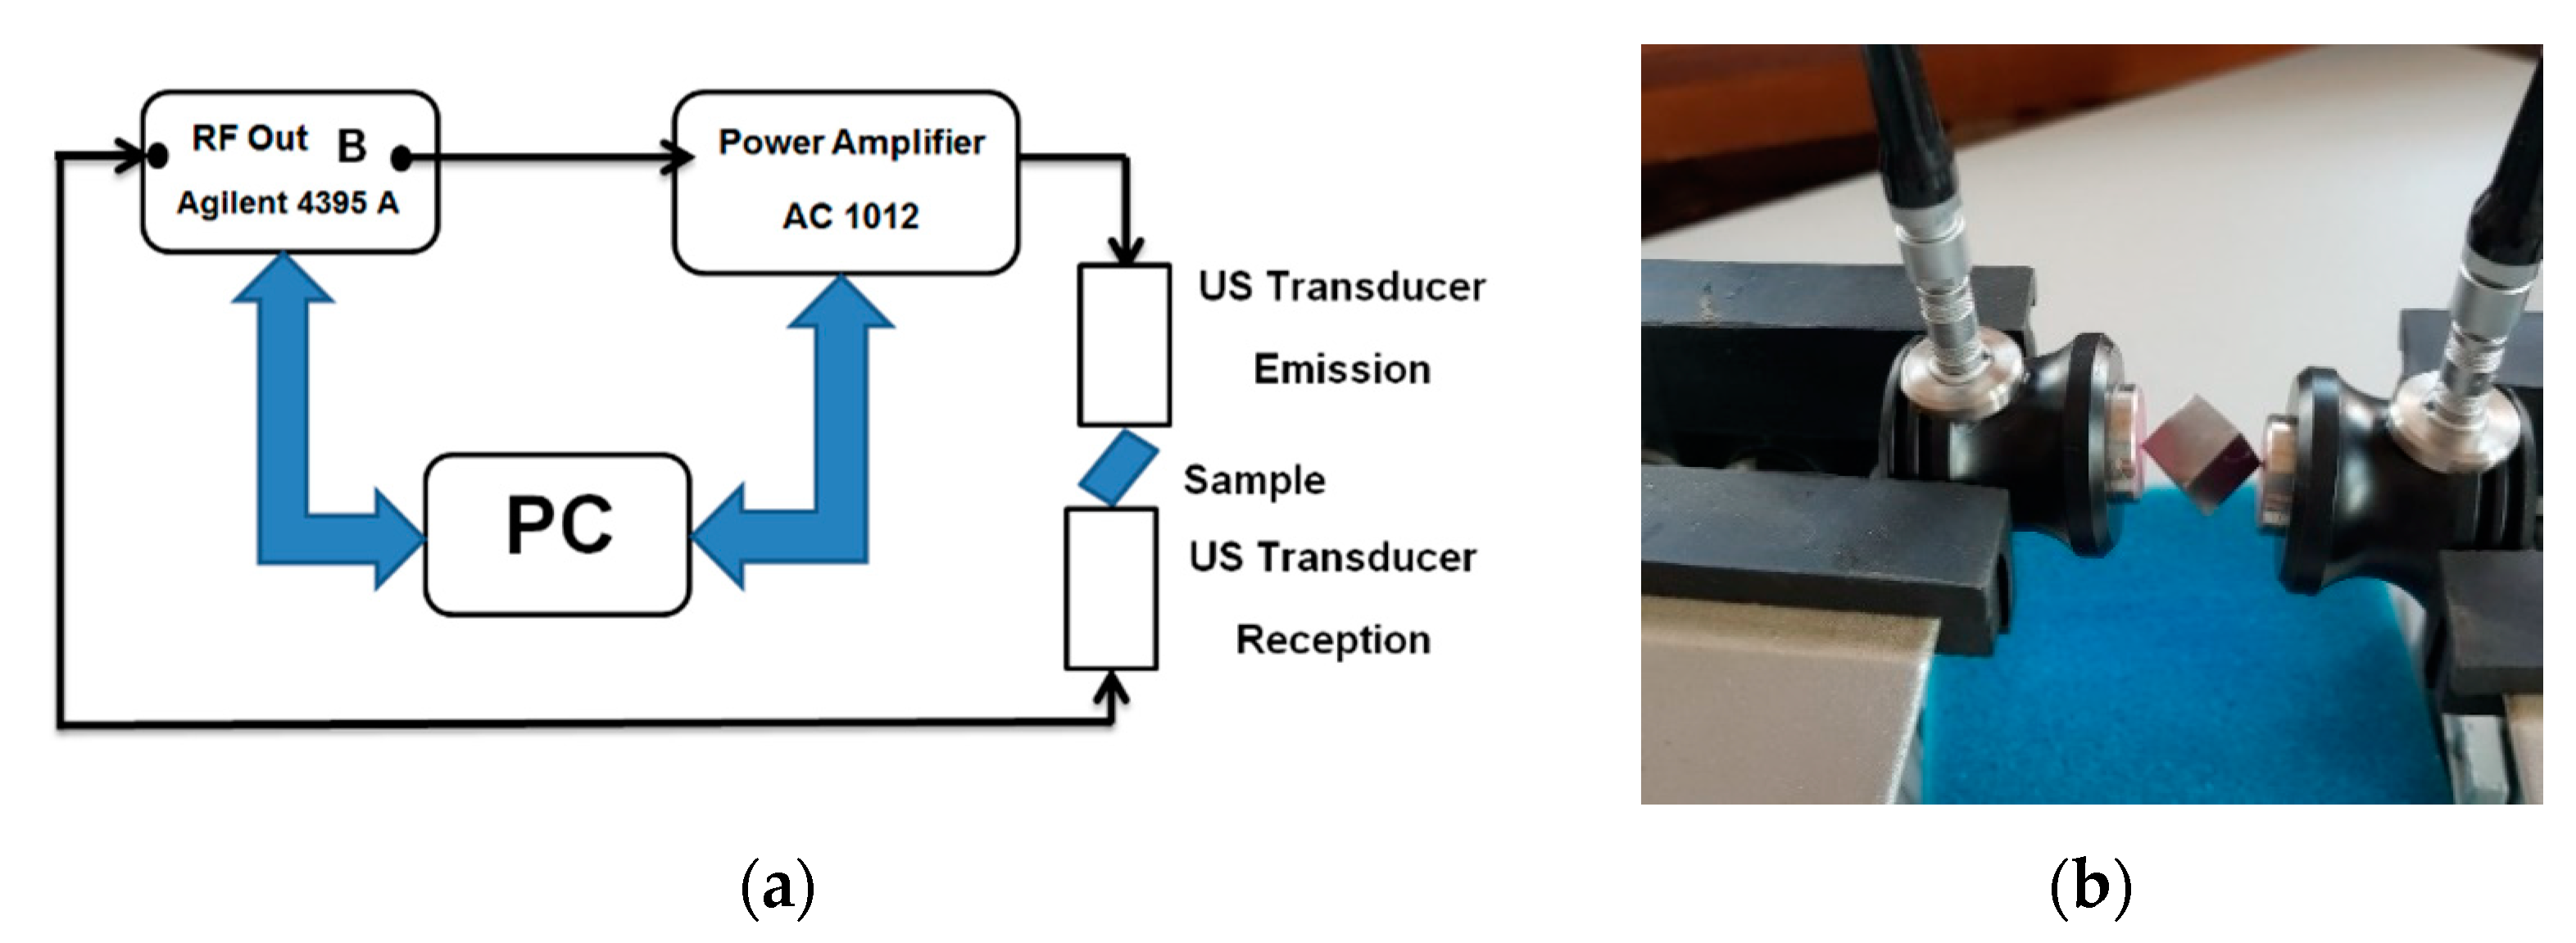
2.3. Ultrasound Measurements
2.4. Mechanical Properties
2.4.1. Resonant Ultrasound Spectroscopy (RUS)
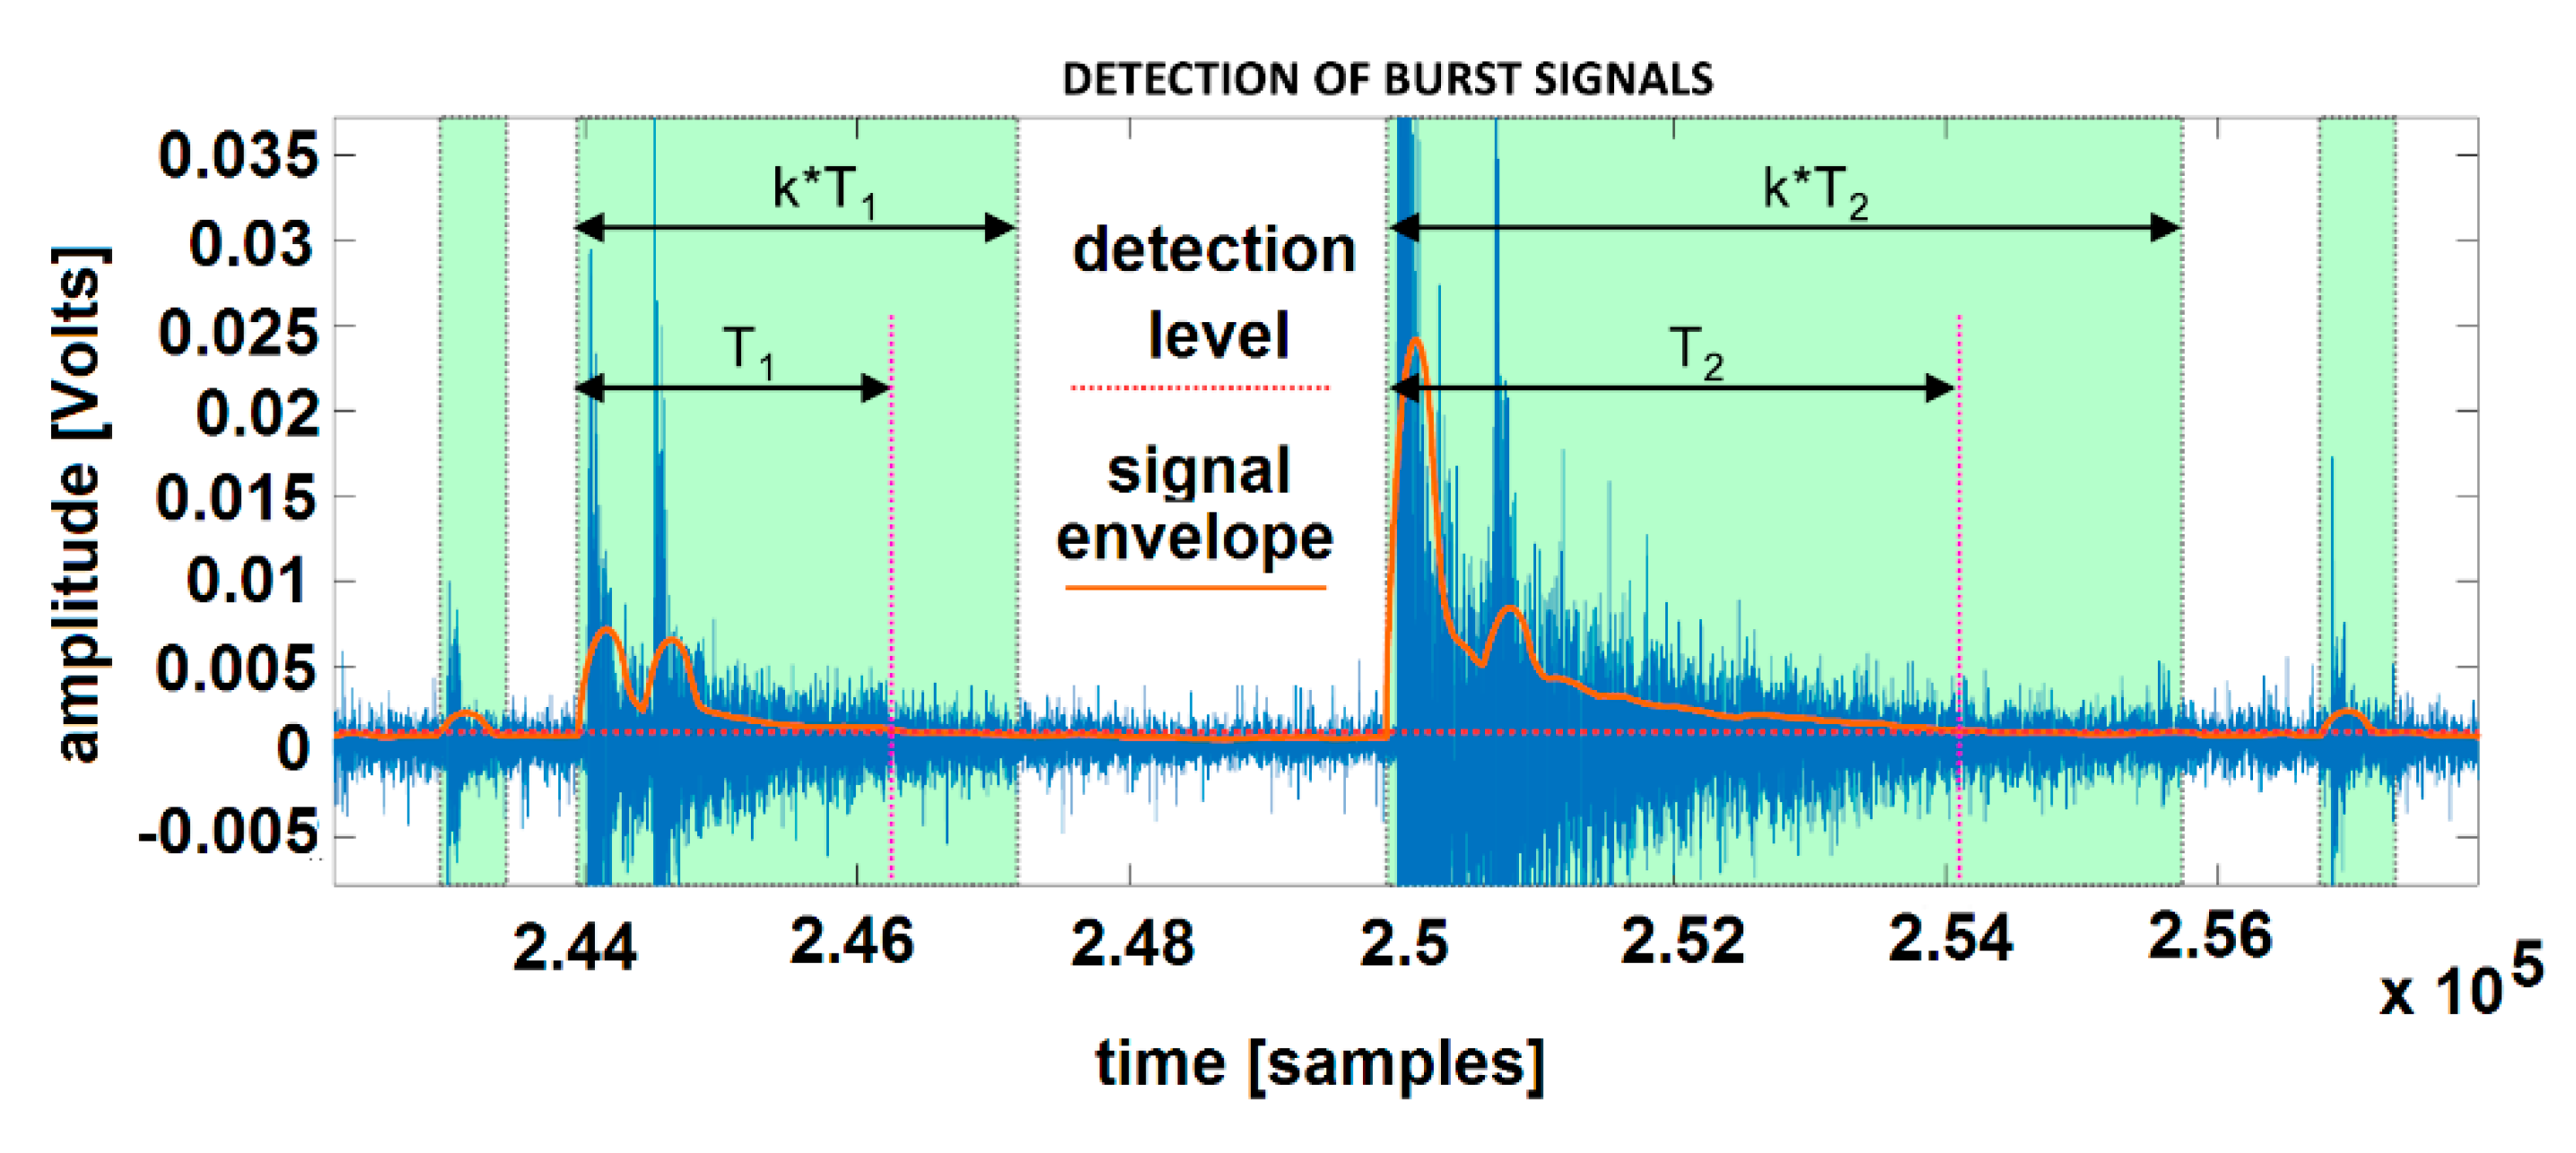
2.4.2. Acoustic Emission (AE)
3. Results and Discussions
3.1. Characterization of the Samples
3.1.1. Mechanical Properties of Studied Alloys
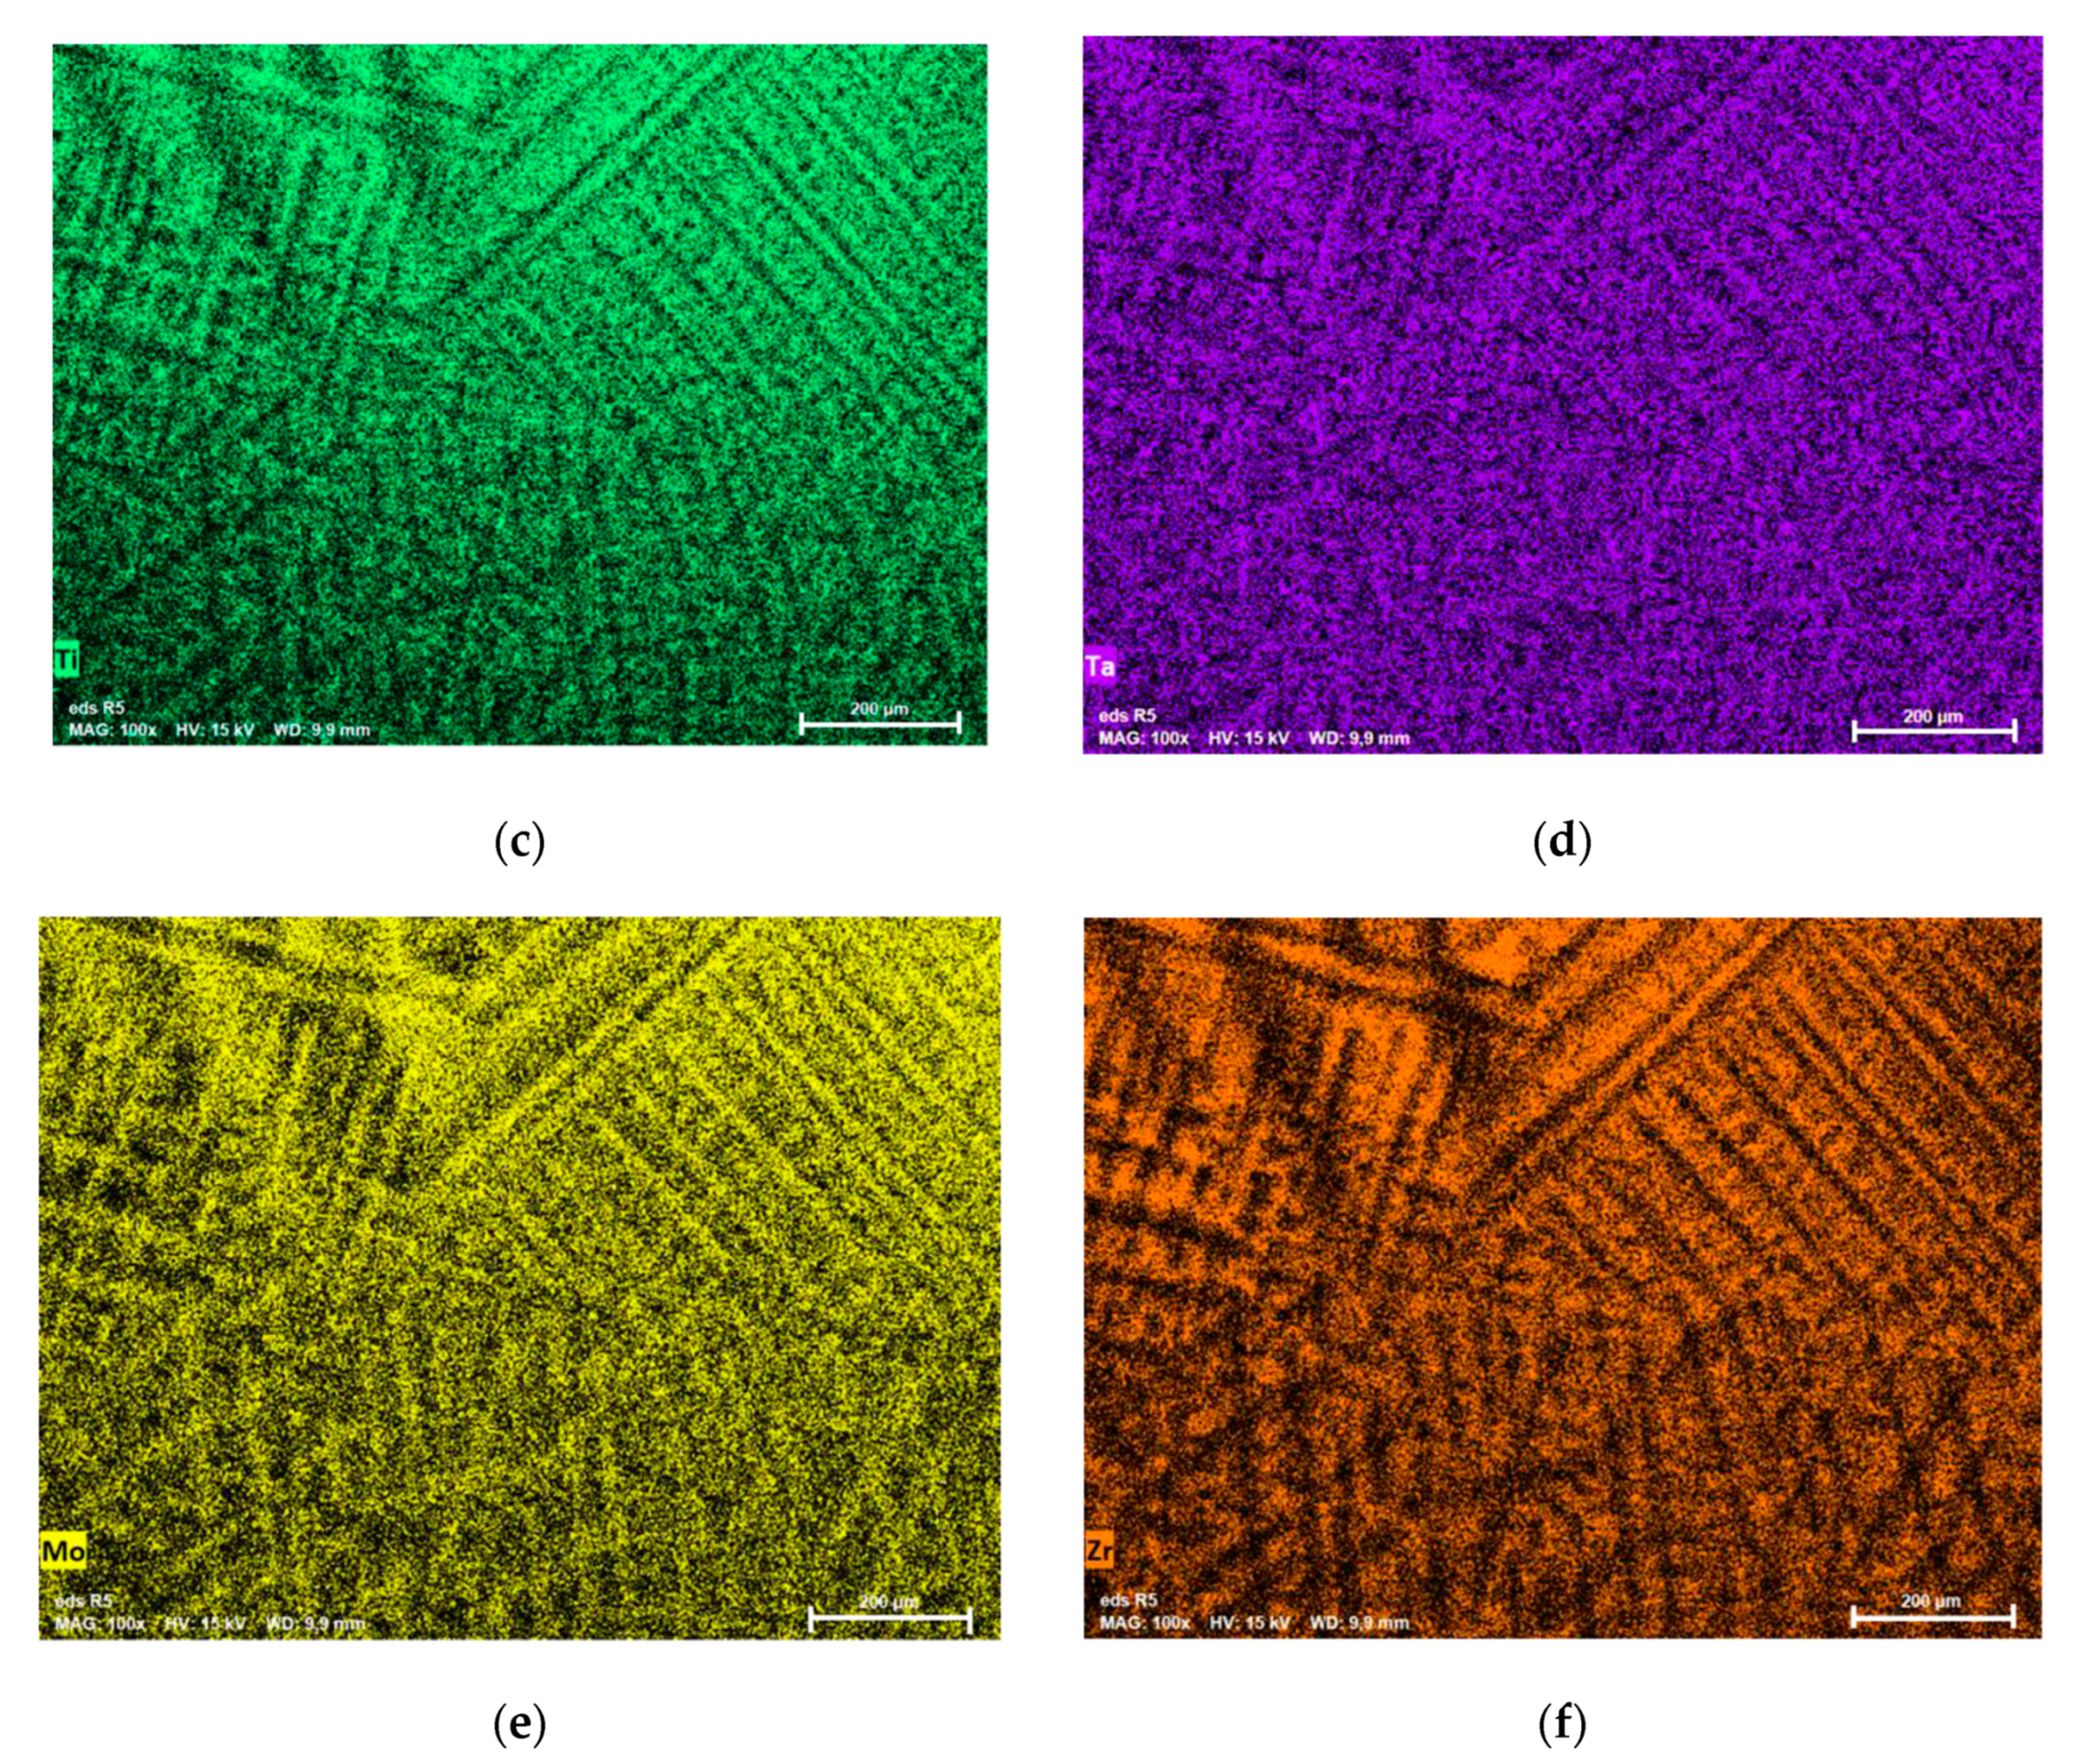
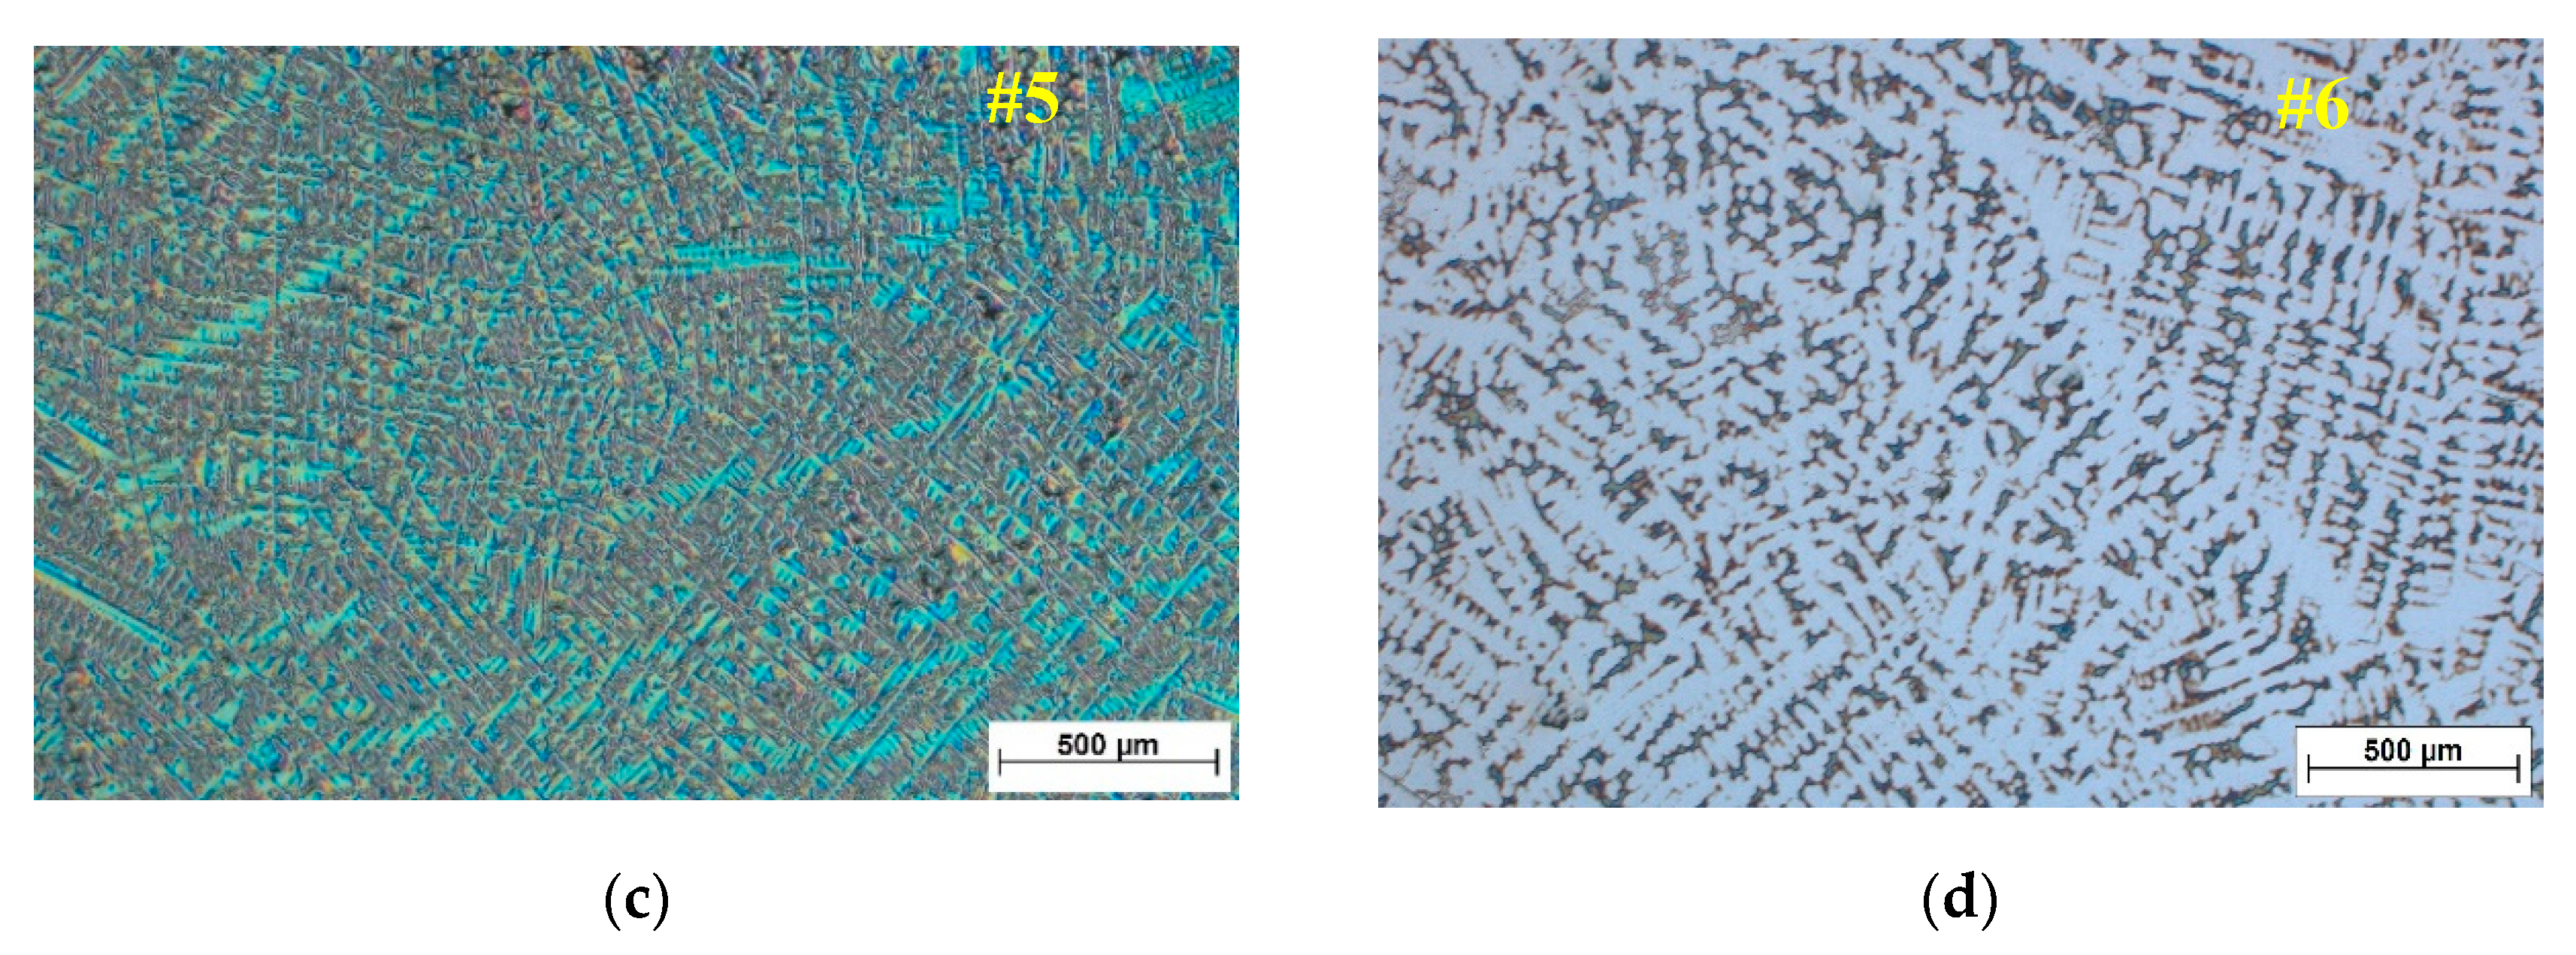
3.1.2. Microstructure of Studied Alloys
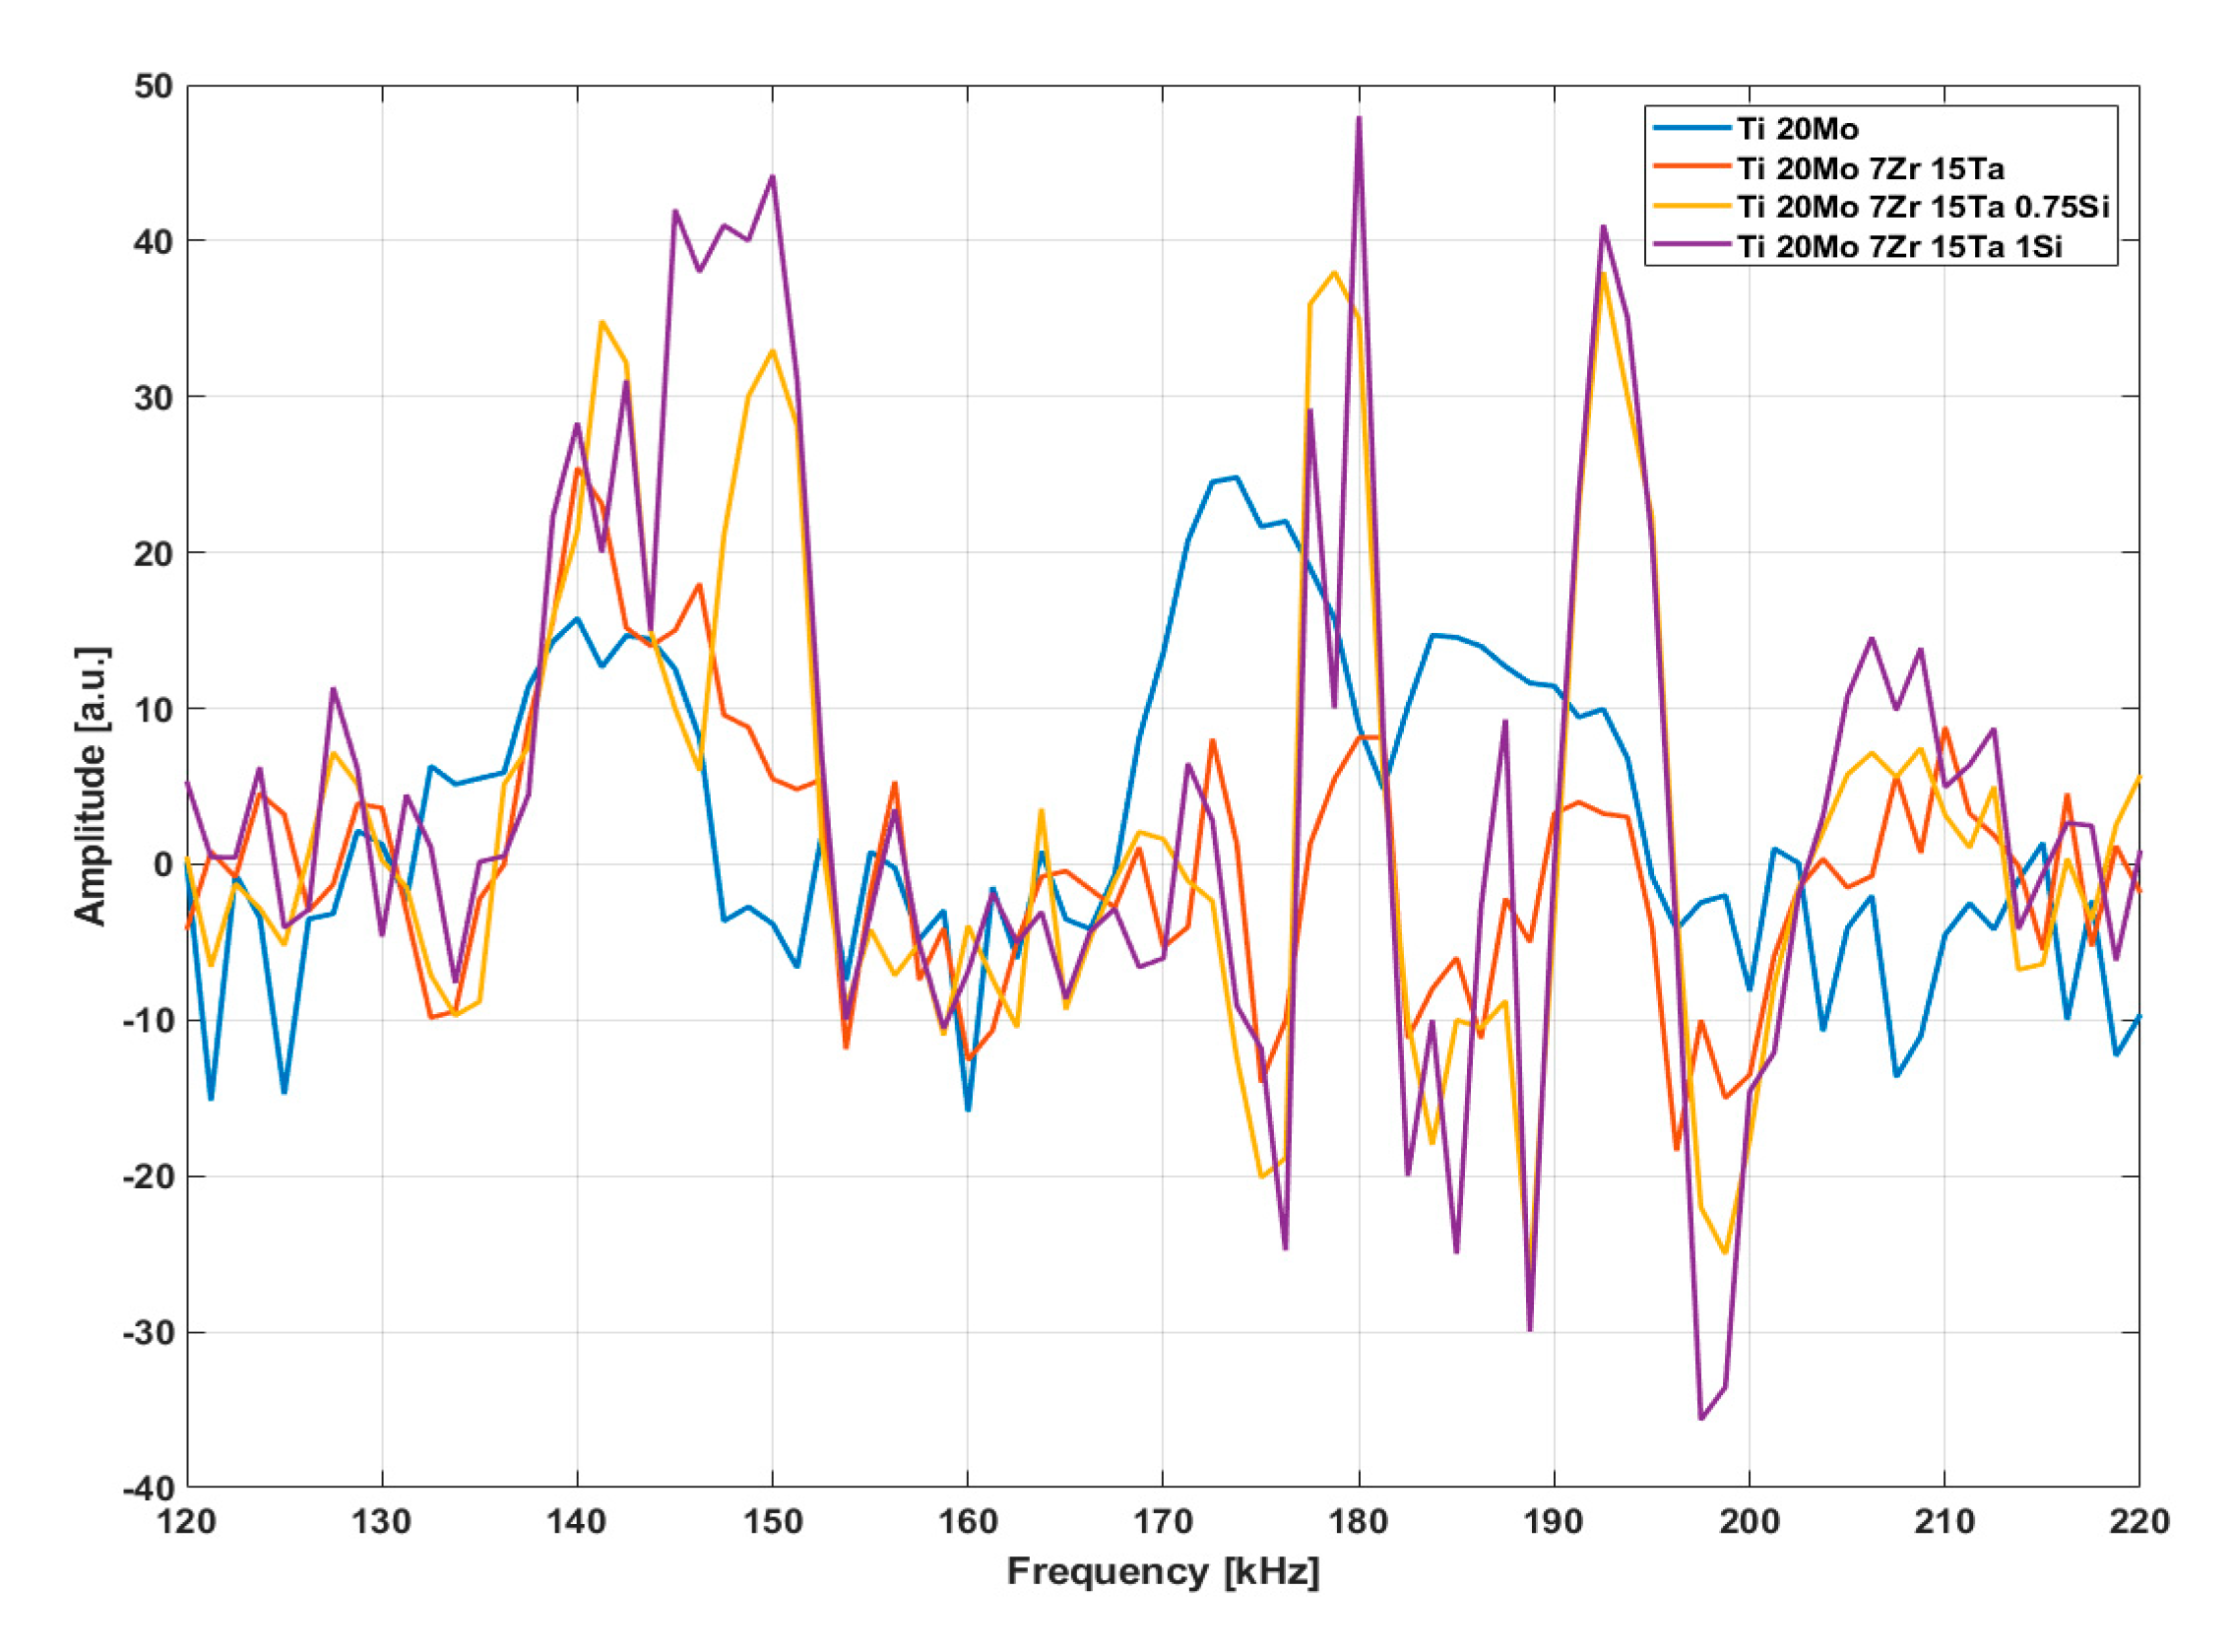
3.2. RUS for Elasticity Measurements
3.3. AE Response During Compressive Test
4. Conclusions
Author Contributions
Funding
Conflicts of Interest
References
- Food Drug Administration. Biological Responses to Metal Implants; Food Drug Administration: Silver Spring, MD, USA, 2019. [Google Scholar]
- Ryu, D.J.; Ban, H.Y.; Jung, E.Y.; Sonn, C.H.; Hong, D.H.; Ahmad, S.; Gweon, B.; Lim, D.; Wang, J.H. Osteo-Compatibility of 3D Titanium Porous Coating Applied by Direct Energy Deposition (DED) for a Cementless Total Knee Arthroplasty Implant: In Vitro and In Vivo Study. J. Clin. Med. 2020, 9, 478. [Google Scholar] [CrossRef] [PubMed] [Green Version]
- Bai, W.; Xu, G.; Tan, M.; Yang, Z.; Zeng, L.; Wu, D.; Liu, L.; Zhang, L. Diffusivities and atomic mobilities in bcc Ti-Mo-Zr alloys. Materials 2018, 11, 1909. [Google Scholar] [CrossRef] [PubMed] [Green Version]
- Dryburgh, P.; Patel, R.; Pieris, D.M.; Hirsch, M.; Li, W.; Sharples, S.D.; Smith, R.J.; Clare, A.T.; Clark, M. Spatially resolved acoustic spectroscopy for texture imaging in powder bed fusion nickel superalloys. In Proceedings of the 45th Annual Review of Progress in Quantitative Nondestructive Evaluation, AIP Conference Proceedings, Burlington, VT, USA, 15–19 July 2018; AIP Publishing LLC: Melville, NY, USA, 2019; Volume 38. [Google Scholar]
- Cambiaghi, A. Biological Evaluation of Medical Devices as an Essential Part of the Risk Management Process: Updates and Challenges of ISO 10993-1; Eurofins Group: Luxembourg, 2018. [Google Scholar]
- ISO 10993-1. Biological Evaluation of Medical Devices—Part 1: Evaluation and Testing within a Risk Management Process; International Organization for Standardization: Geneva, Switzerland, 2018. [Google Scholar]
- Hegyeli, R.J. Limitations of current techniques for the evaluation of the biohazards and biocompatibility of new candidate materials. J. Biomed. Mater. Res. 1971, 5, 1–14. [Google Scholar] [PubMed]
- Rack, H.J.; Qazi, J.I. Titanium alloys for biomedical applications. Mater. Sci. Eng. C 2006, 26, 1269–1277. [Google Scholar] [CrossRef]
- Villars, P.; Prince, A.; Okamoto, H. Handbook of Ternary Alloy Phase Diagrams; ASM International: Almere, The Netherlands, 1995; Volume 10, p. 13621. [Google Scholar]
- Mao, Y.; Li, S.; Zhang, J.; Peng, J.; Zou, D.; Zhong, Z. Microstructure and tensile properties of orthorhombic Ti–Al–Nb–Ta alloys. Intermetallics 2000, 8, 659–662. [Google Scholar] [CrossRef]
- Zhang, L.C.; Chen, L.Y. A review on biomedical titanium alloys: Recent progress and prospect. Adv. Eng. Mater. 2019, 21, 1801215. [Google Scholar] [CrossRef] [Green Version]
- Li, Y.; Yang, C.; Zhao, H.; Qu, S.; Li, X.; Li, Y. New developments of Ti-based alloys for biomedical applications. Materials 2014, 7, 1709–1800. [Google Scholar] [CrossRef] [Green Version]
- Geetha, M.; Singh, A.K.; Asokamani, R.; Gogia, A.K. Ti based biomaterials, the ultimate choice for orthopaedic implants–A review. Prog. Mater. Sci. 2009, 54, 397–425. [Google Scholar] [CrossRef]
- Savin, A.; Vizureanu, P.; Prevorovsky, Z.; Chlada, M.; Krofta, J.; Baltatu, M.S.; Istrate, B.; Steigmann, R. Noninvasive Evaluation of Special Alloys for Prostheses Using Complementary Methods. MS&E 2018, 374, 012030. [Google Scholar]
- Sandu, A.V.; Baltatu, M.S.; Nabialek, M.; Savin, A.; Vizureanu, P. Characterization and mechanical properties of new TiMo alloys used for medical applications. Materials 2019, 12, 2973. [Google Scholar] [CrossRef] [PubMed] [Green Version]
- Savin, A.; Craus, M.L.; Bruma, A.; Novy, F.; Minarik, P.; Jabor, M.; Malo, S.; Steigmann, R.; Vizureanu, P.; Harnois, C.; et al. Material properties mapping using complementary methods in titanium alloys TiMoSi used in medical application. In Low-Dimensional Materials and Devices; International Society for Optics and Photonics: Bellingham, WA, USA, 2020; p. 114650Z. [Google Scholar]
- Trincă, L.C.; Mareci, D.; Solcan, C.; Fântânariu, M.; Burtan, L.; Vulpe, V.; Hriţcu, L.D.; Souto, R.M. In vitro corrosion resistance and in vivo osseointegration testing of new multifunctional beta-type quaternary TiMoZrTa alloys. Mat. Sci. Eng. C 2019, 108, 110485. [Google Scholar] [CrossRef]
- Kuroda, D.; Niinomi, M.; Morinaga, M.; Kato, Y.; Yashiro, T. Design and mechanical properties of new β type titanium alloys for implant materials. Mat. Sci. Eng. A 1998, 243, 244–249. [Google Scholar] [CrossRef]
- Zhao, G.H.; Liang, X.Z.; Kim, B.; Rivera-Díaz-del-Castillo, P.E.J. Modelling strengthening mechanisms in beta-type Ti alloys. Mat. Sci. Eng. A 2019, 756, 156–160. [Google Scholar] [CrossRef]
- Inaekyan, K.; Brailovski, V.; Prokoshkin, S.; Pushin, V.; Dubinskiy, S.; Sheremetyev, V. Comparative study of structure formation and mechanical behavior of age-hardened Ti–Nb–Zr and Ti–Nb–Ta shape memory alloys. Mater. Charact. 2015, 103, 65–74. [Google Scholar] [CrossRef]
- Kudrman, J.; Fousek, J.; Brezina, V.; Míková, R.; Vesely, J. Titanium alloys for implants in medicine. Kov. Mater. 2007, 45, 199. [Google Scholar]
- Correa, D.R.N.; Vicente, F.B.; Araújo, R.O.; Lourenço, M.L.; Kuroda, P.A.B.; Buzalaf, M.A.R.; Grandini, C.R. Effect of the substitutional elements on the microstructure of the Ti-15Mo-Zr and Ti-15Zr-Mo systems alloys. J. Mater. Res. Tech. 2015, 4, 180–185. [Google Scholar] [CrossRef] [Green Version]
- Karimi-Sibaki, E.; Kharicha, A.; Wu, M.; Ludwig, A.; Bohacek, J. A Parametric Study of the Vacuum Arc Remelting (VAR) Process: Effects of Arc Radius, Side-Arcing, and Gas Cooling. Metall. Mater. Trans. B 2020, 51, 222–235. [Google Scholar] [CrossRef] [Green Version]
- ASTM E2001-18. Guide for Resonant Ultrasound Spectroscopy for Defect Detection in Both Metallic and Non-Metallic Parts; ASTM International: West Conshohocken, PA, USA, 2018. [Google Scholar]
- Stráský, J.; Harcuba, P.; Václavová, K.; Horváth, K.; Landa, M.; Srba, O.; Janeček, M. Increasing strength of a biomedical Ti-Nb-Ta-Zr alloy by alloying with Fe, Si and O. J. Mech. Behav. Biomed. 2012, 71, 329–336. [Google Scholar] [CrossRef]
- Liu, G.; Maynard, J.D. Measuring elastic constants of arbitrarily shaped samples using resonant ultrasound spectroscopy. J. Acoust. Soc. Am. 2012, 131, 2068–2078. [Google Scholar] [CrossRef]
- BS EN 13554. Non-Destructive Testing-Acoustic Emission Testing-General Principles; British Standard Institution Group: London, UK, 2011. [Google Scholar]
- BS EN 1330-9. Non-Destructive Testing. Terminology. Terms Used in Acoustic Emission Testing; British Standard Institution Group: London, UK, 2017. [Google Scholar]
- ASTM E1316-18a. Standard Terminology for Nondestructive Examinations; ASTM International: West Conshohocken, PA, USA, 2018. [Google Scholar]
- ASTM E1932-12. Standard Guide for Acoustic Emission Examination of Small Parts; ASTM International: West Conshohocken, PA, USA, 2017. [Google Scholar]
- Ereifej, N.; Silikas, N.; Watts, D.C. Initial versus final fracture of metal-free crowns, analyzed via acoustic emission. Dent. Mater. 2008, 24, 1289–1295. [Google Scholar] [CrossRef]
- Mavrogordato, M.; Taylor, M.; Taylor, A.; Browne, M. Real time monitoring of progressive damage during loading of a simplified total hip stem construct using embedded acoustic emission sensors. Med. Eng. Phys. 2011, 33, 395–406. [Google Scholar] [CrossRef]
- Cormier, J.M.; Manoogian, S.J.; Bisplinghoff, J.; McNally, C.; Duma, S. The use of acoustic emission in facial fracture detection. Biomed. Sci. Instrum. 2008, 44, 147–152. [Google Scholar] [PubMed]
- ASTM. E384: Standard Test Method for Knoop and Vickers Hardness of Materials; ASTM International: West Conshohocken, PA, USA, 2012; pp. 1–43. [Google Scholar]
- Sakaguchi, N.; Niinomi, M.; Akahori, T.; Takeda, J.; Toda, H. Effect of Ta content on mechanical properties of Ti–30Nb–XTa–5Zr. Mater. Sci. Eng. C 2005, 25, 370–376. [Google Scholar] [CrossRef]
- Lide, D.R. (Ed.) CRC Handbook of Chemistry and Physics; CRC Press: Boca Raton, FL, USA, 2004; Volume 85. [Google Scholar]
- Morinaga, M.; Kato, M.; Kamimura, T.; Fukumoto, M.; Harada, I.; Kubo, K. Theoretical Design of Beta-Type Titanium Alloys. In Titanium’92: Science and Technology; The Minerals, Metals & Materials Society: Pittsburgh, PA, USA, 1993; pp. 217–224. [Google Scholar]
- Biesiekierski, A.; Wang, J.; Gepreel, M.A.H.; Wen, C. A new look at biomedical Ti-based shape memory alloys. Acta Biomater. 2012, 8, 1661–1669. [Google Scholar] [CrossRef] [PubMed]
- Ehtemam-Haghighi, S.; Cao, G.; Zhang, L.C. Nanoindentation study of mechanical properties of Ti based alloys with Fe and Ta additions. J. Alloys Compd. 2017, 692, 892–897. [Google Scholar] [CrossRef]
- Ehtemam-Haghighi, S.; Liu, Y.; Cao, G.; Zhang, L.C. Influence of Nb on the β→α martensitic phase transformation and properties of the newly designed Ti–Fe–Nb alloys. Mater. Sci. Eng. C 2016, 60, 503–510. [Google Scholar] [CrossRef] [PubMed] [Green Version]
- Li, C.; Lee, D.G.; Mi, X.; Ye, W.; Hui, S.; Lee, Y. Phase transformation and age hardening behavior of new Ti–9.2 Mo–2Fe alloy. J. Alloys Compd. 2013, 549, 152–157. [Google Scholar] [CrossRef]
- Laheurte, P.; Prima, F.; Eberhardt, A.; Gloriant, T.; Wary, M.; Patoor, E. Mechanical properties of low modulus β titanium alloys designed from the electronic approach. J. Mech. Behav. Biomed. 2010, 3, 565–573. [Google Scholar] [CrossRef]
- Nagase, T.; Todai, M.; Hori, T.; Nakano, T. Microstructure of equiatomic and non-equiatomic Ti-Nb-Ta-Zr-Mo high-entropy alloys for metallic biomaterials. J. Alloys Compd. 2018, 753, 412–421. [Google Scholar] [CrossRef]
- Visscher, W.M.; Migliori, A.; Bell, T.M.; Reinert, R.A. On the normal modes of free vibration of inhomogeneous and anisotropic elastic objects. J. Acoust. Soc. Am. 1991, 90, 2154–2162. [Google Scholar] [CrossRef]
- Migliori, A.; Maynard, J.D. Implementation of a modern resonant ultrasound spectroscopy system for the measurement of the elastic moduli of small solid specimens. Rev. Sci. Instrum. 2005, 76, 121301. [Google Scholar] [CrossRef] [Green Version]
- Landau, L.D.; Lifshitz, E.M. Theory of Elasticity, 3rd ed.; Pergamon Press: London, UK, 1986. [Google Scholar]
- Zadler, B.J.; Le Rousseau, J.H.; Scales, J.A.; Smith, M.L. Resonant ultrasound spectroscopy: Theory and application. Geophys. J. Int. 2004, 156, 154–169. [Google Scholar] [CrossRef]
- Balakirev, F.F.; Ennaceur, S.M.; Migliori, R.J.; Maiorov, B.; Migliori, A. Resonant ultrasound spectroscopy: The essential toolbox. Rev. Sci. Instrum. 2019, 90, 121401. [Google Scholar] [CrossRef] [PubMed] [Green Version]
- Leisure, R.G. Ultrasonic Spectroscopy: Applications in Condensed Matter Physics and Materials Science; Cambridge University Press: Cambridge, UK, 2017. [Google Scholar]
- Flynn, K.; Radovic, M. Evaluation of defects in materials using resonant ultrasound spectroscopy. J. Mater. Sci. 2011, 46, 2548–2556. [Google Scholar] [CrossRef]
- Drozdenko, D.; Bohlen, J.; Yi, S.; Minárik, P.; Chmelík, F.; Dobroň, P. Investigating a twinning–detwinning process in wrought Mg alloys by the acoustic emission technique. Acta Mater. 2016, 110, 103–113. [Google Scholar] [CrossRef]


| Sample | Composition | Density ρ [g/cm3] | Young Modulus E [GPa] | Shear Modulus G [GPa] | Poisson Ratio ν | Cl [m/s] | Ct [m/s] | HV0.5 |
|---|---|---|---|---|---|---|---|---|
| #1 | TiMo20 | 5.126 ± 0.004 | 109.23 ± 1.037 | 40.15 ± 0.329 | 0.36 | 5993 ± 0.7 | 2799 ± 0.5 | 278 ± 1.2 |
| #2 | TiMo20Si0.75 | 5.078 ± 0.006 | 111.51 ± 0.898 | 41.30 ± 0.304 | 0.35 | 5993 ± 0.5 | 2852 ± 0.4 | 339 ± 0.8 |
| #3 | TiMo20Zr7Ta15 | 7.049 ± 0.009 | 91.18 ± 0.248 | 32.61 ± 0.692 | 0.39 | 5222 ± 0.4 | 2151 ± 0.5 | 388 ± 1.7 |
| #4 | TiMo20Zr7Ta15Si0.5 | 6.845 ± 0.009 | 89.03 ± 0.456 | 31.87 ± 0.640 | 0.39 | 5210 ± 0.4 | 2158 ± 0.3 | 337 ± 1.1 |
| #5 | *TiMo20Zr7Ta15Si0.75 | 5.404 ± 0.001 | 69.11 ± 0.478 | 24.70 ± 0.260 | 0.39 | 5215 ± 0.4 | 2138 ± 0.4 | 354.8 ± 1.9 |
| #6 | TiMo20Zr7Ta15Si1.0 | 6.868 ± 0.005 | 78.78 ± 0.297 | 27.91 ± 0.276 | 0.41 | 5191 ± 0.5 | 2016 ± 0.4 | 356 ± 0.9 |
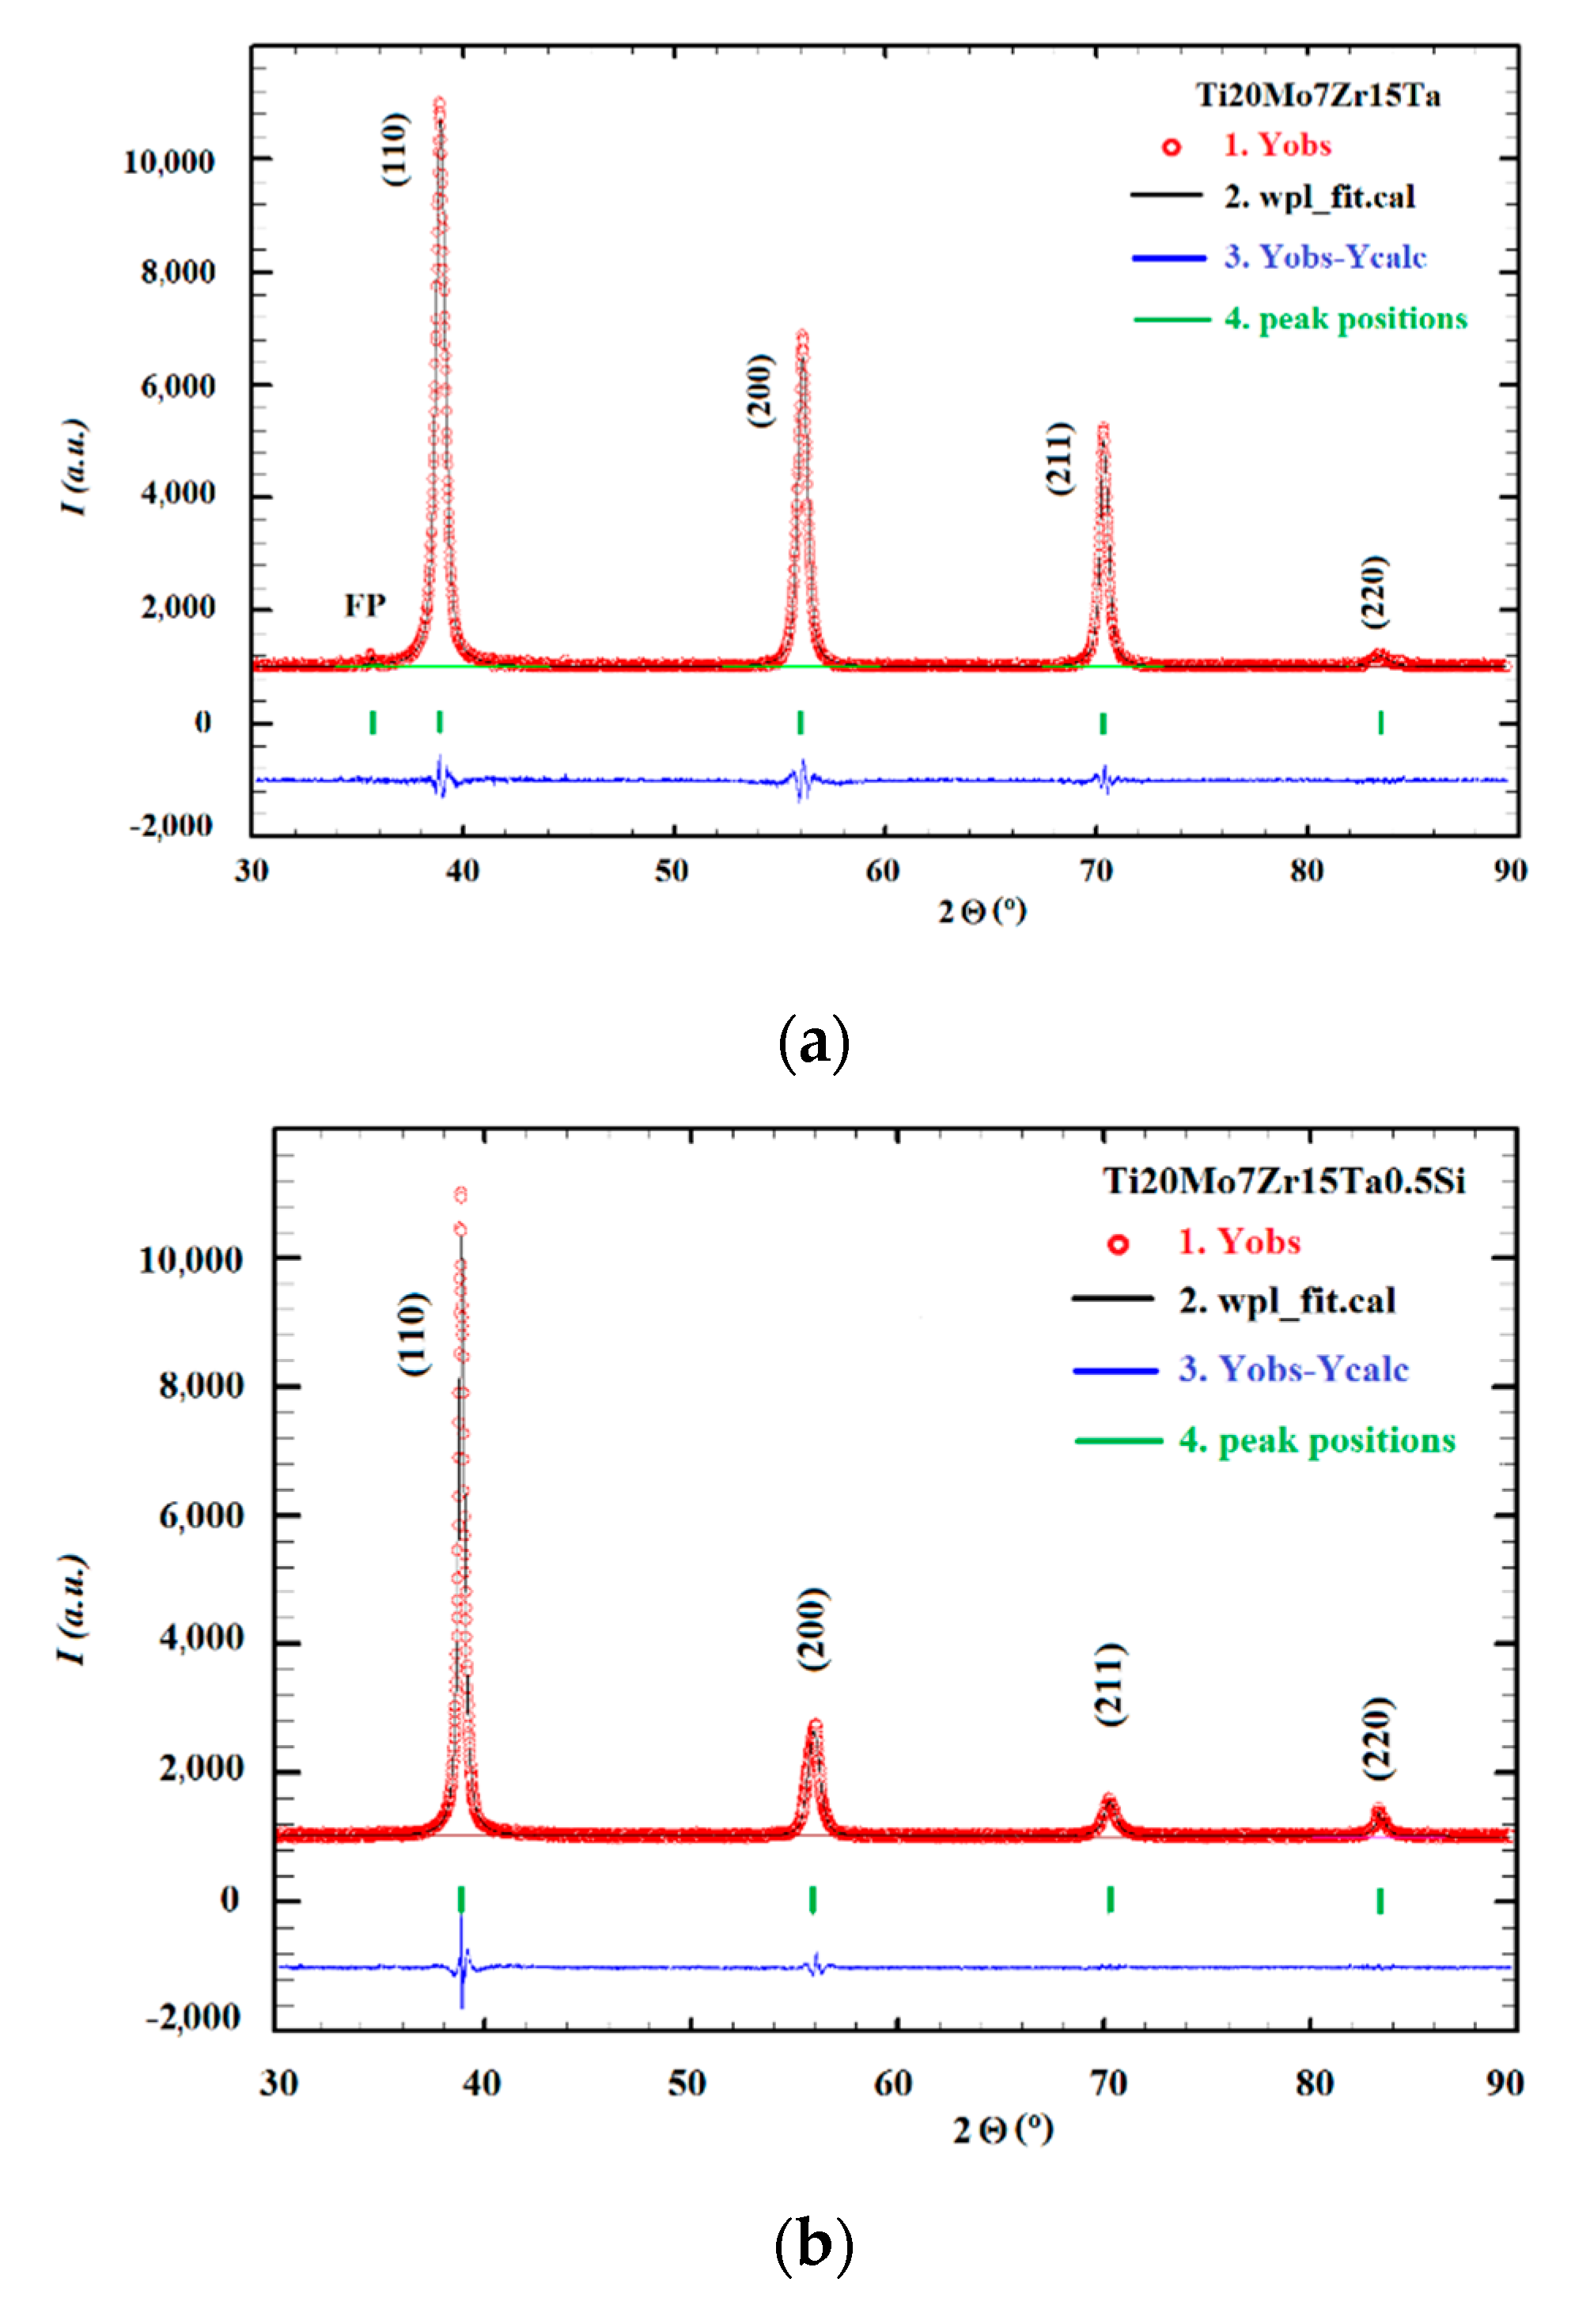
| Sample | (x) Mass Concentration | a = b= c * (Å) | V (Å3) | D (Å) ** | [ε ***] | Bo | Md (eV) | ρ *** (g/cm3) |
|---|---|---|---|---|---|---|---|---|
| #3 | 0.0 | 3.2785 | 35.239 | 204 | 0.001427 | 2.918 | 2.396 | 5.964 |
| #4 | 0.50 | 3.2804 | 35.300 | 339 | 0.000844 | 2.917 | 2.395 | 5.931 |
| #5 | 0.75 | 3.2818 | 35.346 | 790 | 0.000630 | 2.917 | 2.395 | 5.894 |
| #6 | 1.00 | 3.2663 | 34.847 | 437 | 0.000967 | 2.916 | 2.394 | 5.952 |
| Sample | acalc * (Å) | ρ ** (g/cm3) | |||||
|---|---|---|---|---|---|---|---|
| #3 | 76.70 | 13.20 | 4.90 | 5.20 | 0 | 3.2714 | 6.003 |
| #4 | 75.69 | 13.14 | 4.84 | 5.22 | 1.12 | 3.26620 | 6.008 |
| #5 | 74.68 | 13.07 | 4.81 | 5.20 | 2.23 | 3.2551 | 6.041 |
| #6 | 73.69 | 13.01 | 4.79 | 5.18 | 3.33 | 3.2477 | 6.055 |
Publisher’s Note: MDPI stays neutral with regard to jurisdictional claims in published maps and institutional affiliations. |
© 2020 by the authors. Licensee MDPI, Basel, Switzerland. This article is an open access article distributed under the terms and conditions of the Creative Commons Attribution (CC BY) license (http://creativecommons.org/licenses/by/4.0/).
Share and Cite
Savin, A.; Craus, M.L.; Bruma, A.; Novy, F.; Malo, S.; Chlada, M.; Steigmann, R.; Vizureanu, P.; Harnois, C.; Turchenko, V.; et al. Microstructural Analysis and Mechanical Properties of TiMo20Zr7Ta15Six Alloys as Biomaterials. Materials 2020, 13, 4808. https://doi.org/10.3390/ma13214808
Savin A, Craus ML, Bruma A, Novy F, Malo S, Chlada M, Steigmann R, Vizureanu P, Harnois C, Turchenko V, et al. Microstructural Analysis and Mechanical Properties of TiMo20Zr7Ta15Six Alloys as Biomaterials. Materials. 2020; 13(21):4808. https://doi.org/10.3390/ma13214808
Chicago/Turabian StyleSavin, Adriana, Mihail Liviu Craus, Alina Bruma, František Novy, Sylvie Malo, Milan Chlada, Rozina Steigmann, Petrica Vizureanu, Christelle Harnois, Vitalii Turchenko, and et al. 2020. "Microstructural Analysis and Mechanical Properties of TiMo20Zr7Ta15Six Alloys as Biomaterials" Materials 13, no. 21: 4808. https://doi.org/10.3390/ma13214808