Article

Genome-Wide DNA Methylation in Policemen Working in Cities Differing by Major Sources of Air Pollution

1
Department of Genetic Toxicology and Epigenetics, Institute of Experimental Medicine CAS, Videnska 1083, 142 20 Prague 4, Czech Republic
2
Department of Nanotoxicology and Molecular Epidemiology, Institute of Experimental Medicine CAS, Videnska 1083, 142 20 Prague 4, Czech Republic
3
Centre for Epidemiological Research, Faculty of Medicine, University of Ostrava, Syllabova 19, 703 00 Ostrava, Czech Republic
4
Veterinary Research Institute, Hudcova 296/70, 621 00 Brno, Czech Republic
*
Author to whom correspondence should be addressed.
Int. J. Mol. Sci. 2022, 23(3), 1666; https://doi.org/10.3390/ijms23031666
Submission received: 9 January 2022 / Revised: 27 January 2022 / Accepted: 28 January 2022 / Published: 31 January 2022
(This article belongs to the Special Issue Toxicogenomics and Molecular Markers in Pollution)

Abstract

:
DNA methylation is the most studied epigenetic mechanism that regulates gene expression, and it can serve as a useful biomarker of prior environmental exposure and future health outcomes. This study focused on DNA methylation profiles in a human cohort, comprising 125 nonsmoking city policemen (sampled twice), living and working in three localities (Prague, Ostrava and Ceske Budejovice) of the Czech Republic, who spent the majority of their working time outdoors. The main characterization of the localities, differing by major sources of air pollution, was defined by the stationary air pollution monitoring of PM2.5, B[a]P and NO2. DNA methylation was analyzed by a genome-wide microarray method. No season-specific DNA methylation pattern was discovered; however, we identified 13,643 differentially methylated CpG loci (DML) for a comparison between the Prague and Ostrava groups. The most significant DML was cg10123377 (log2FC = −1.92, p = 8.30 × 10⁻⁴) and loci annotated to RPTOR (total 20 CpG loci). We also found two hypomethylated loci annotated to the DNA repair gene XRCC5. Groups of DML annotated to the same gene were linked to diabetes mellitus (KCNQ1), respiratory diseases (PTPRN2), the dopaminergic system of the brain and neurodegenerative diseases (NR4A2). The most significant possibly affected pathway was Axon guidance, with 86 potentially deregulated genes near DML. The cluster of gene sets that could be affected by DNA methylation in the Ostrava groups mainly includes the neuronal functions and biological processes of cell junctions and adhesion assembly. The study demonstrates that the differences in the type of air pollution between localities can affect a unique change in DNA methylation profiles across the human genome.

1. Introduction

Long-term exposure to air pollutants has an adverse health impact and affects the genome and epigenome [1]. DNA methylation is one of the most studied epigenetic mechanisms that regulates gene expression and affects genome stability [2]. DNA methylation can serve as a useful biomarker of exposure, and an analysis of DNA methylation gives a better understanding of the effects of environmental exposure, as well as the role of epigenetic mechanisms, on human health [3,4]. CpG loci, as significant biomarkers of exposure, were summarized in a recent review [5]; they were further identified as a biomarker of tobacco smoke exposure in adults [6] and in smoking pregnant women [7,8], and were linked with alcohol consumption [9]. CpG loci were also found as environmental biomarkers for cumulative exposure to lead [10].
There is a wide range of methodological approaches for measuring the level of DNA methylation. A commonly used method is quantitative global DNA methylation, which represents an effective, fast and cheap solution [11,12]. However, this method cannot distinguish between important hypo- and hypermethylated sites. Other methods are used in epigenome-wide association studies (EWAS) [13]; these are currently mostly based on gene-specific genome-wide DNA methylation (microarray approaches).
The effect of air pollution was widely studied in children, who are more sensitive than adults, and in newborns, to clarify the effect of prenatal exposure [14,15]. In these studies, the authors found an association between prenatal exposure to NO2 and particulate matter (PM) and significant CpG loci that regulate activity of genes associated with asthma and other pulmonary diseases. DNA methylation alterations induced by benzo(a)pyrene (B[a]P) contributed partially to abnormal DNA methylation in air pollution-related lung cancer samples. These changes may affect the development and progression of lung cancer [16].
Czech studies focused on the impact of air pollution on the human genome have a long tradition [17]; a contributory factor is that one of the air pollution hot-spots in Europe is situated in the Moravian-Silesian district, in particular in the Ostrava region. In Ostrava, the highest concentrations of B[a]P and fine PM < 2.5 µm (PM2.5) recorded in the Czech Republic are consistently being detected [18]. Thus, inhabitants of this locality have often been studied in molecular epidemiological research [19]. DNA methylation profiles were examined in asthmatic and healthy children [20]. Whole-genome gene expression was assessed in newborns from districts with different levels of air pollution [21], and city policemen [22,23] who worked in cities with different concentrations of air pollutants. The assessment of cancerogenic risk after the ambient air inhalation in inhabitants of industrial and non-industrial localities was also performed [24]. In the city of Ostrava, depending on the locality, the prevalence of respiratory diseases, such as asthma, or recurrent airway inflammation, is higher than the national average [25,26,27].
This study is a continuation of a long-term research project on air pollution’s impact on the human genome. In this part, using microarray EPIC BeadChips (Illumina), we evaluated the genome-wide gene-specific DNA methylation in city policemen from three localities in the Czech Republic: Ostrava, Prague and Ceske Budejovice (CB). The study can be regarded as both an occupational and environmental exposure investigation because the city policemen were living in the study localities and, simultaneously, they spent most of their working time outdoors, where they were mostly exposed to engine emissions from car traffic, and to pollutants from local industry. Here, we aimed to find specific DNA methylation patterns based on the quantitative data of the annotated 856,865 CpG sites, which could be characterized by work and life in environments affected by different types of air pollution.

2. Results

2.1. Characteristics of Study Subjects

The data on 125 city policemen (250 samples) were obtained from detailed questionnaires describing personal information, exposure history and lifestyle factors. All subjects were nonsmoking males, who had been residents in the study cities for at least 3 years. Table 1 shows the most important data, characterizing the potential differences between the groups. The age spectrum of policemen covered the entire productive age, ranging from 21 to 63 years. No differences (ANOVA, p = 0.61) in age between the city groups were observed (40.4 vs. 39.4 vs. 38.0, respectively). The BMI of subjects covered normal weight to obese with similar distributions in all localities. Mean values were almost identical for all study localities (28.6 vs. 28.4 vs. 28.2, respectively) and without statistical significance (ANOVA, p = 0.85). In the last row of Table 1, the occupation duration is shown. Most of the subjects had a long occupation history as city policemen, with no significant differences between localities (ANOVA, p = 0.13; mean values are 13.94 vs. 11.78 vs. 10.22, respectively). Only six subjects in Prague, four subjects in Ostrava and four subjects in CB, have worked as policemen for less than 2 years and they have all completed at least secondary education. The health data in the questionnaires showed that all policemen were of normal health without specific dietary issues or excessive alcohol consumption.

2.2. Air Pollution Monitoring

The concentrations of air pollutants (Table 2A), used for the characterization of the air pollution in the study cities in the three-month period before sample collection, were obtained from the Czech Hydrometeorological Institute (CHMI; Annual tabular overview). Further details regarding measuring frequencies and stations are described in Section 4.2.
In Ostrava, the concentrations of PM2.5 were the highest during both seasons compared to other localities (p < 0.05 for Ostrava vs. others). Interestingly, the concentrations of PM2.5 in Prague and CB were comparable (p = 0.42 and p = 0.15 for winter and summer, respectively).
The concentrations of B[a]P did not significantly differ between Ostrava and Prague in winter (p = 0.29). However, it was not the mean but rather the median in the Ostrava and Prague winter that showed a greater difference (2.6 vs. 1.6). We found a significant difference between Ostrava and Prague in summer (p < 0.05), and also between Ostrava and CB (p < 0.05 for both seasons).
There were no differences in the NO2 concentrations in winter between Ostrava and other localities (p = 0.38 and p = 0.05 for Prague and CB, respectively). However, during the summer season, significant differences were found in all localities (p < 0.05 for both Ostrava vs. Prague and Ostrava vs. CB). The highest NO2 concentration was observed in Prague in summer.
For a broader comparison of long-term exposure, we summarized the mean annual concentrations of these air pollutants in the last four years (Table 2B).
The concentrations of pollutants were relatively stable over the years. In 2019, the lowest levels of air pollution were noted in all cities compared to previous years. The differences between the localities correspond with the data shown in Table 2A. The highest concentrations of NO2 were detected in Prague when compared with Ostrava.

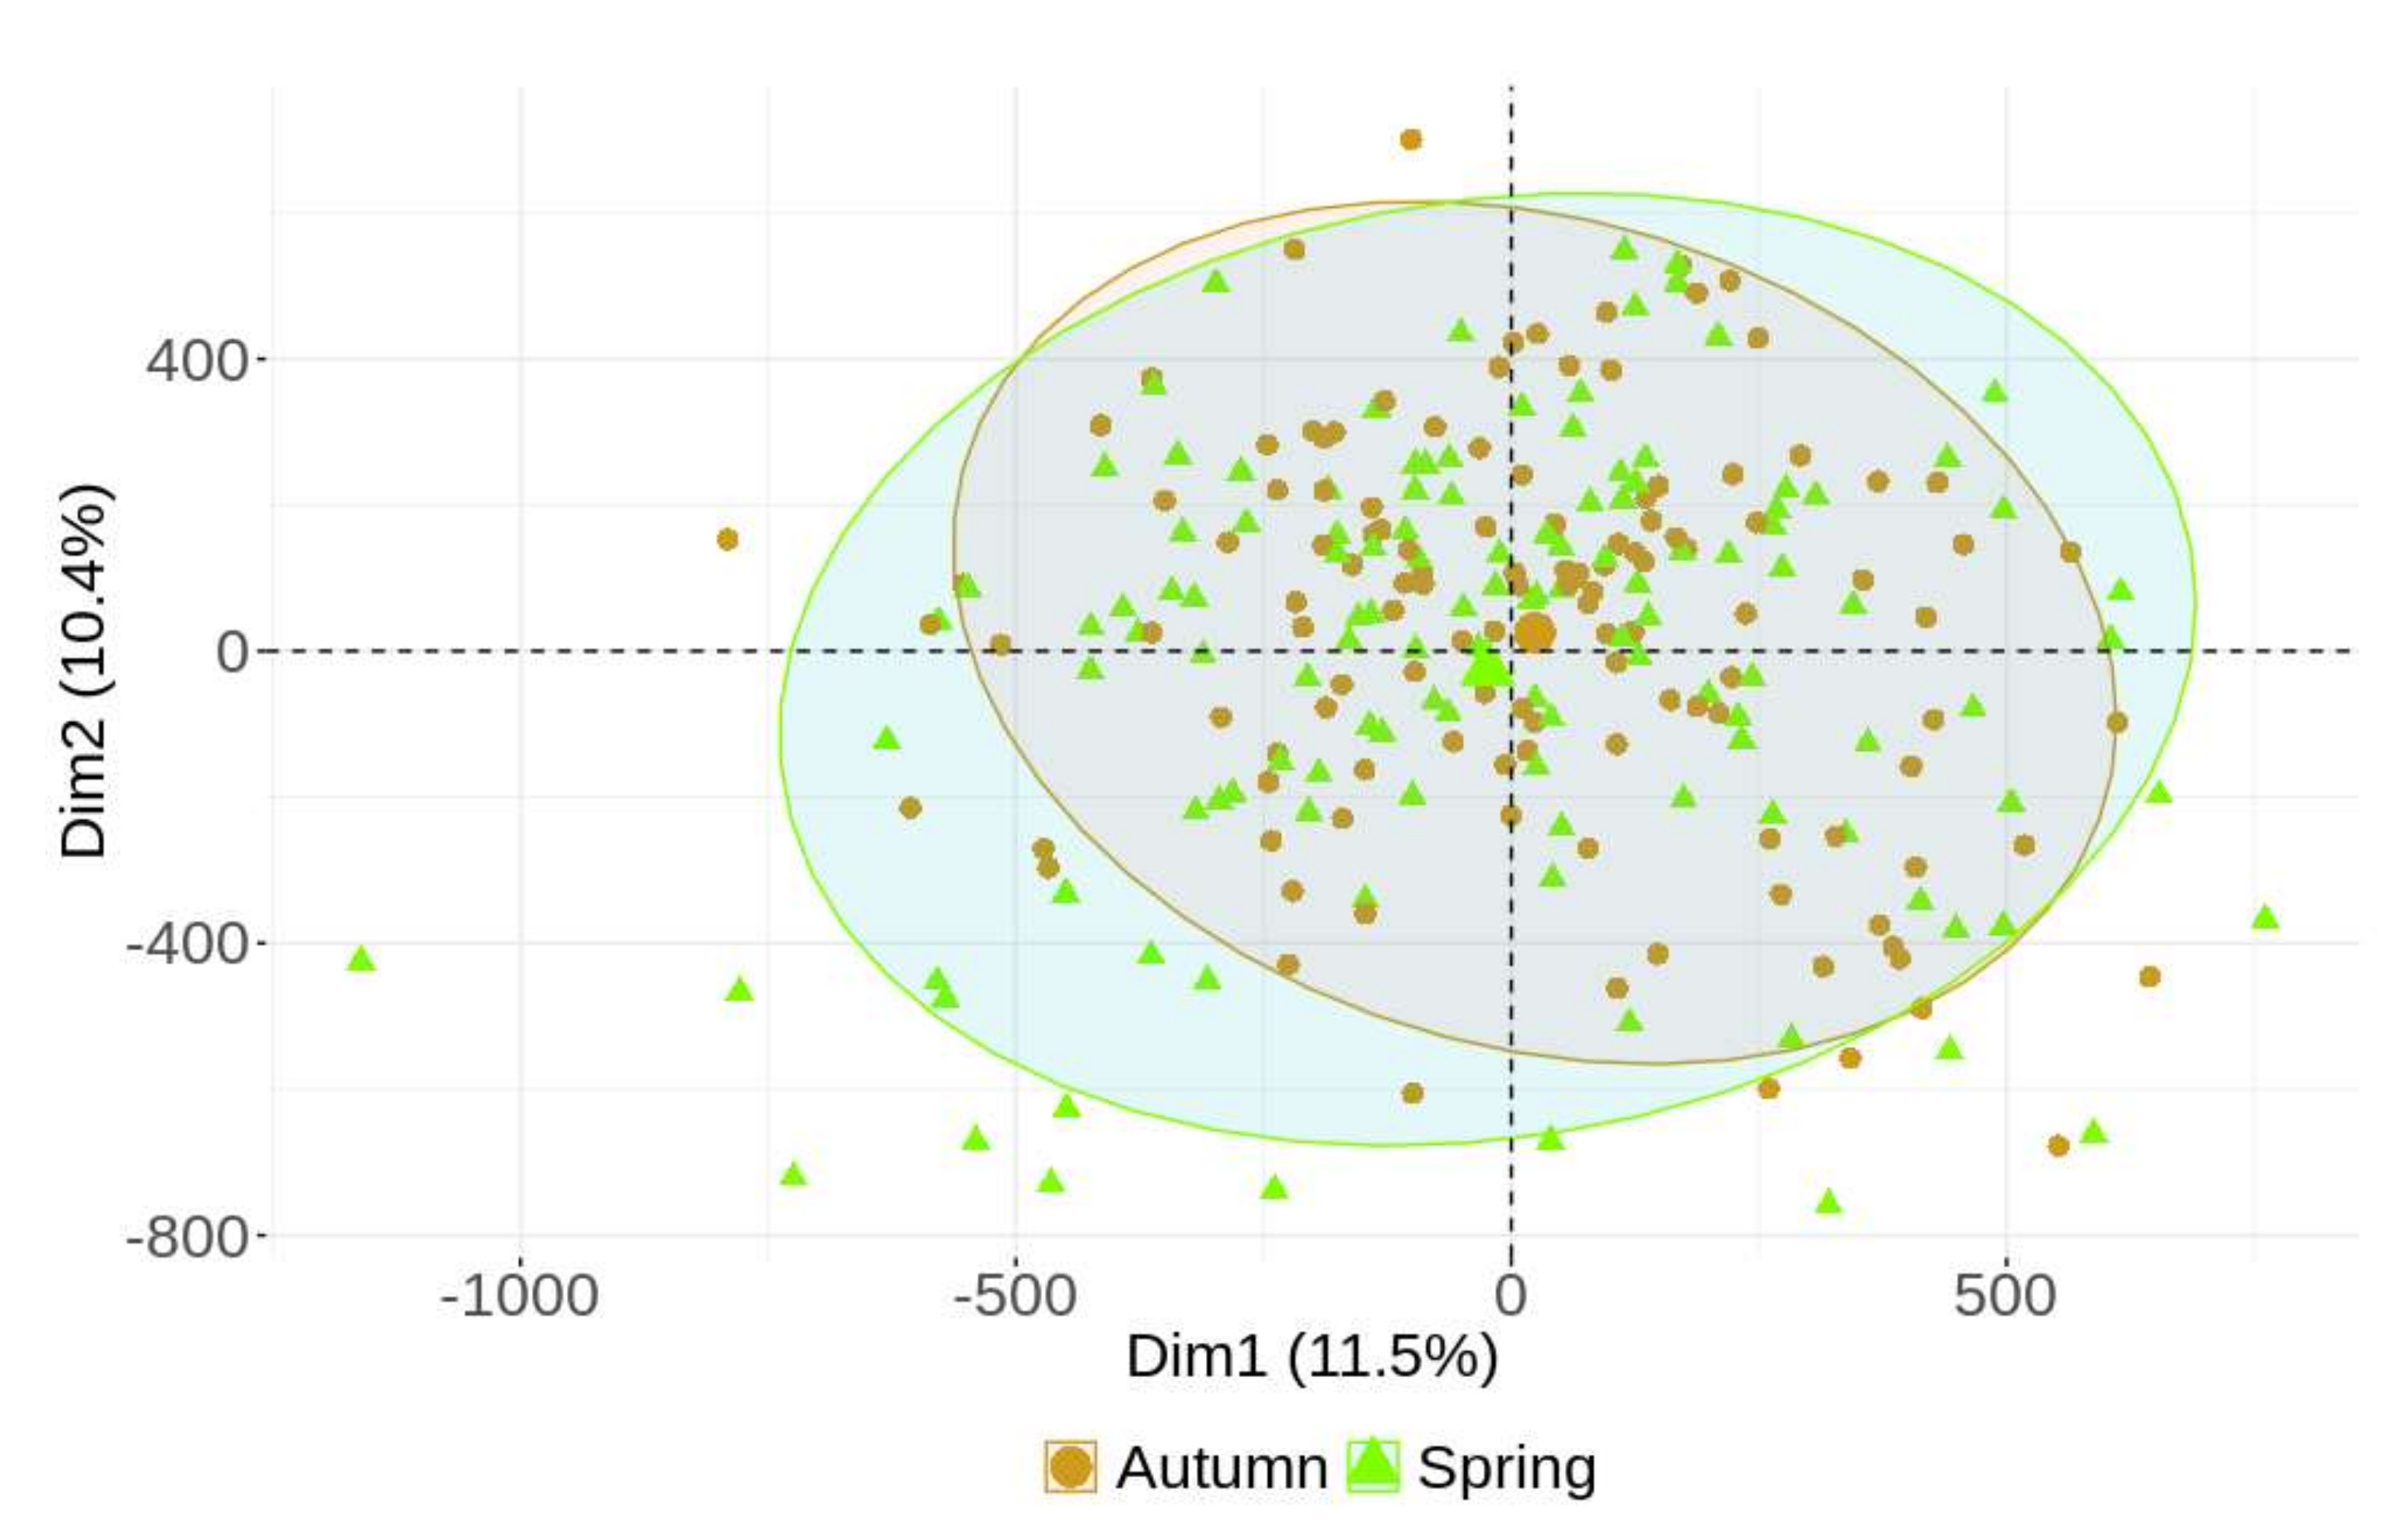
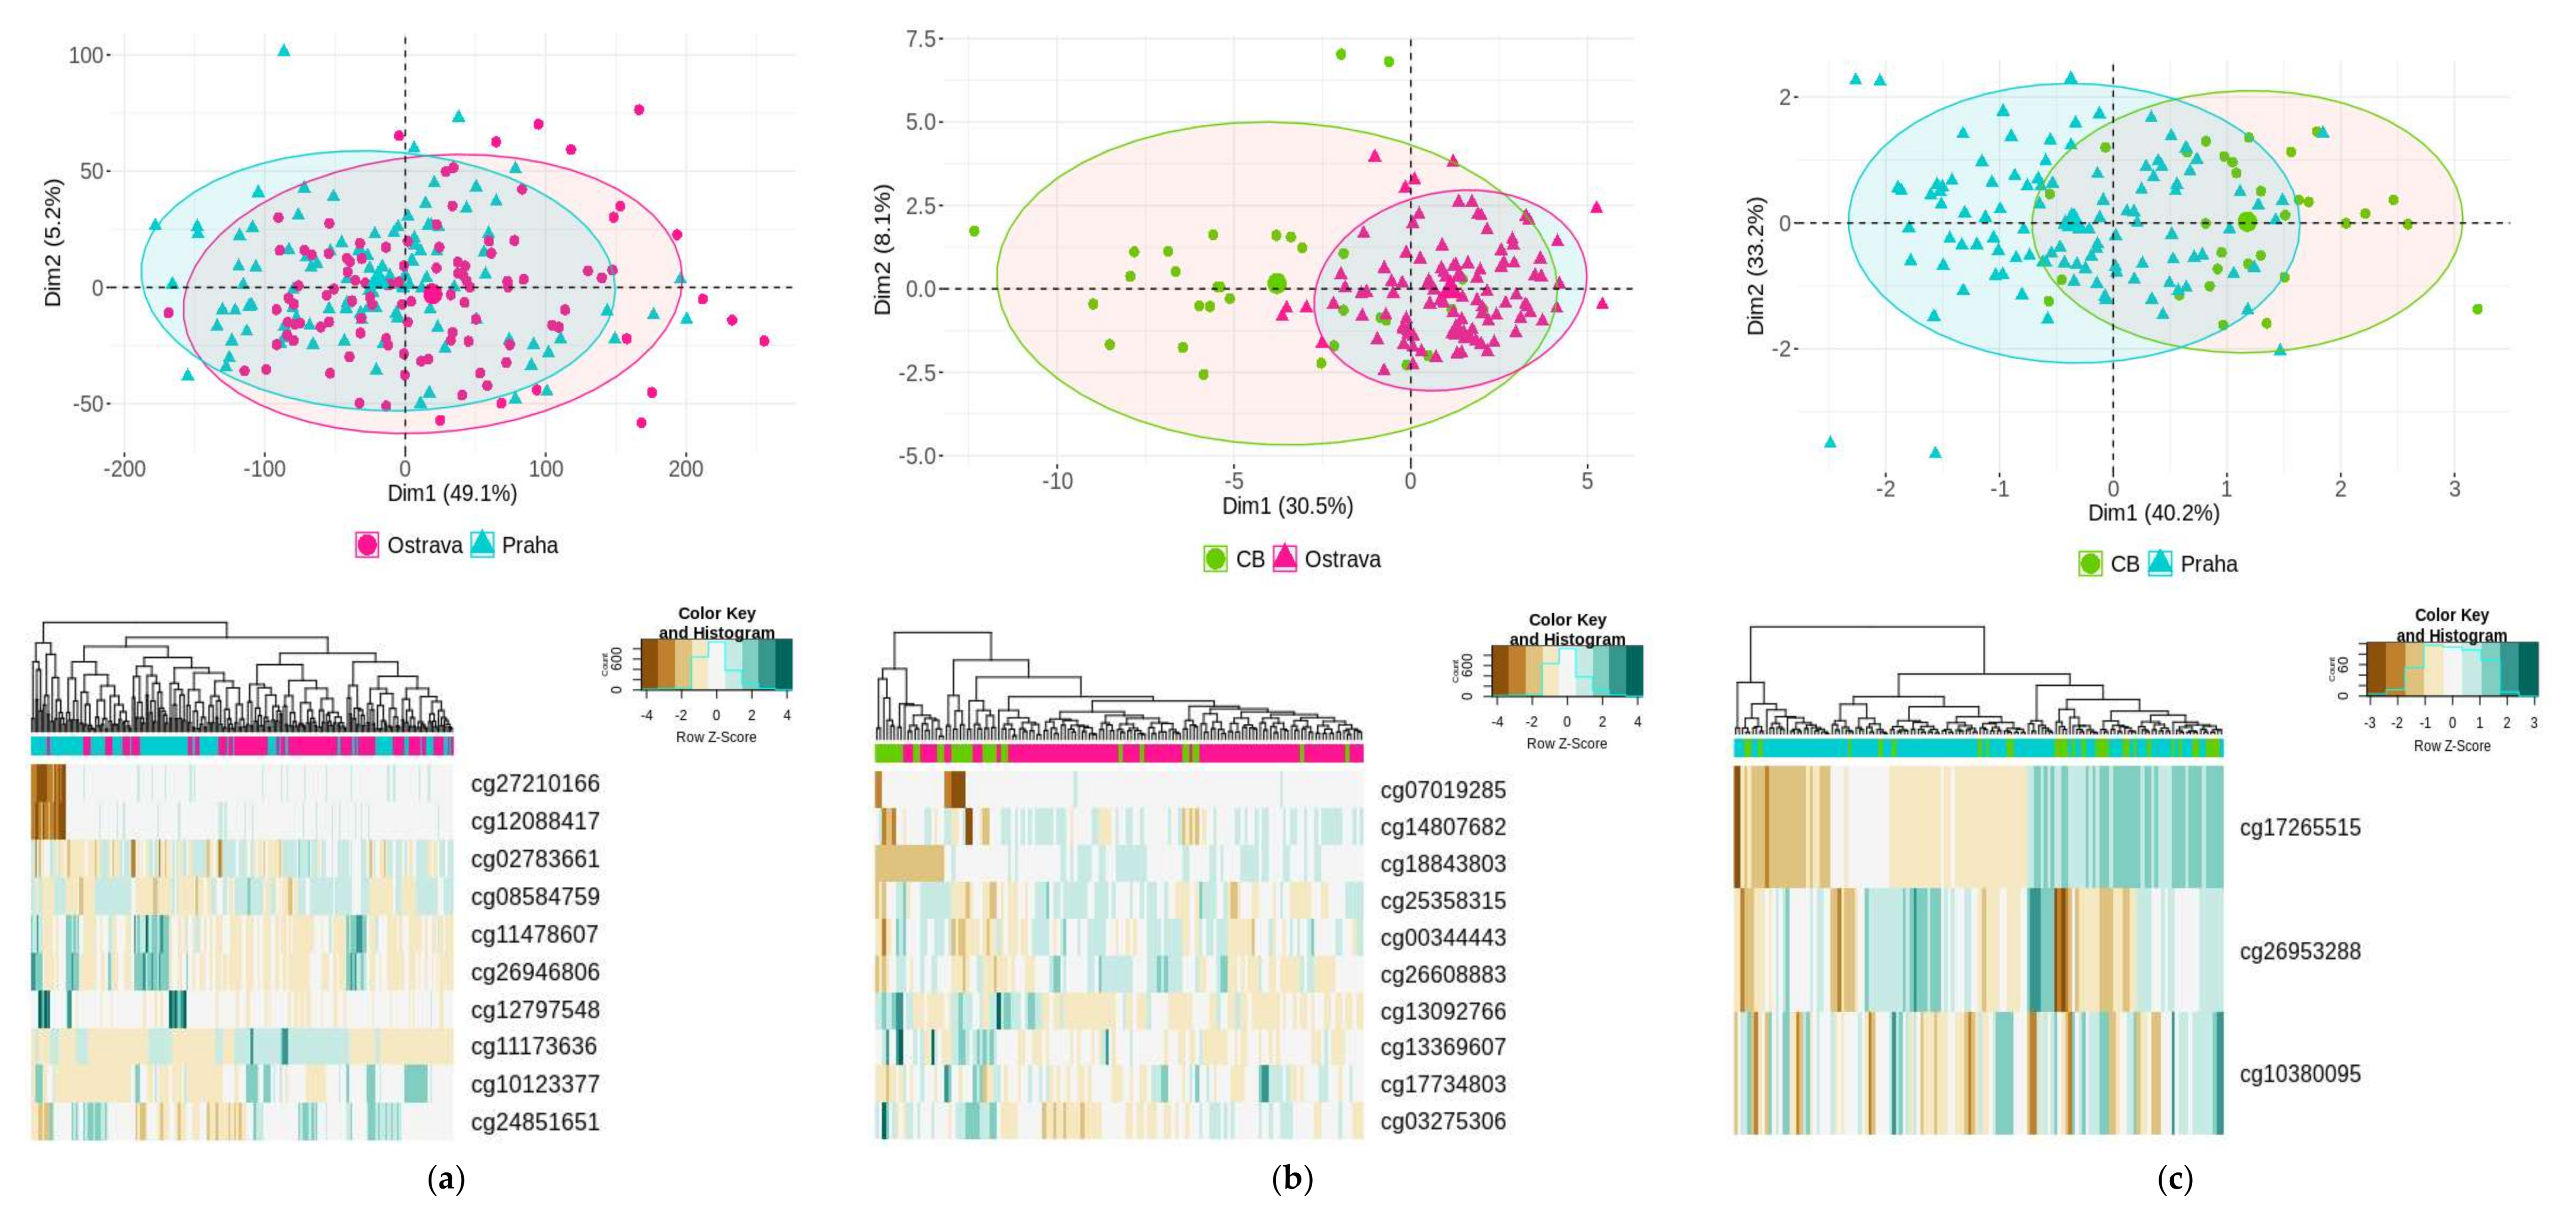
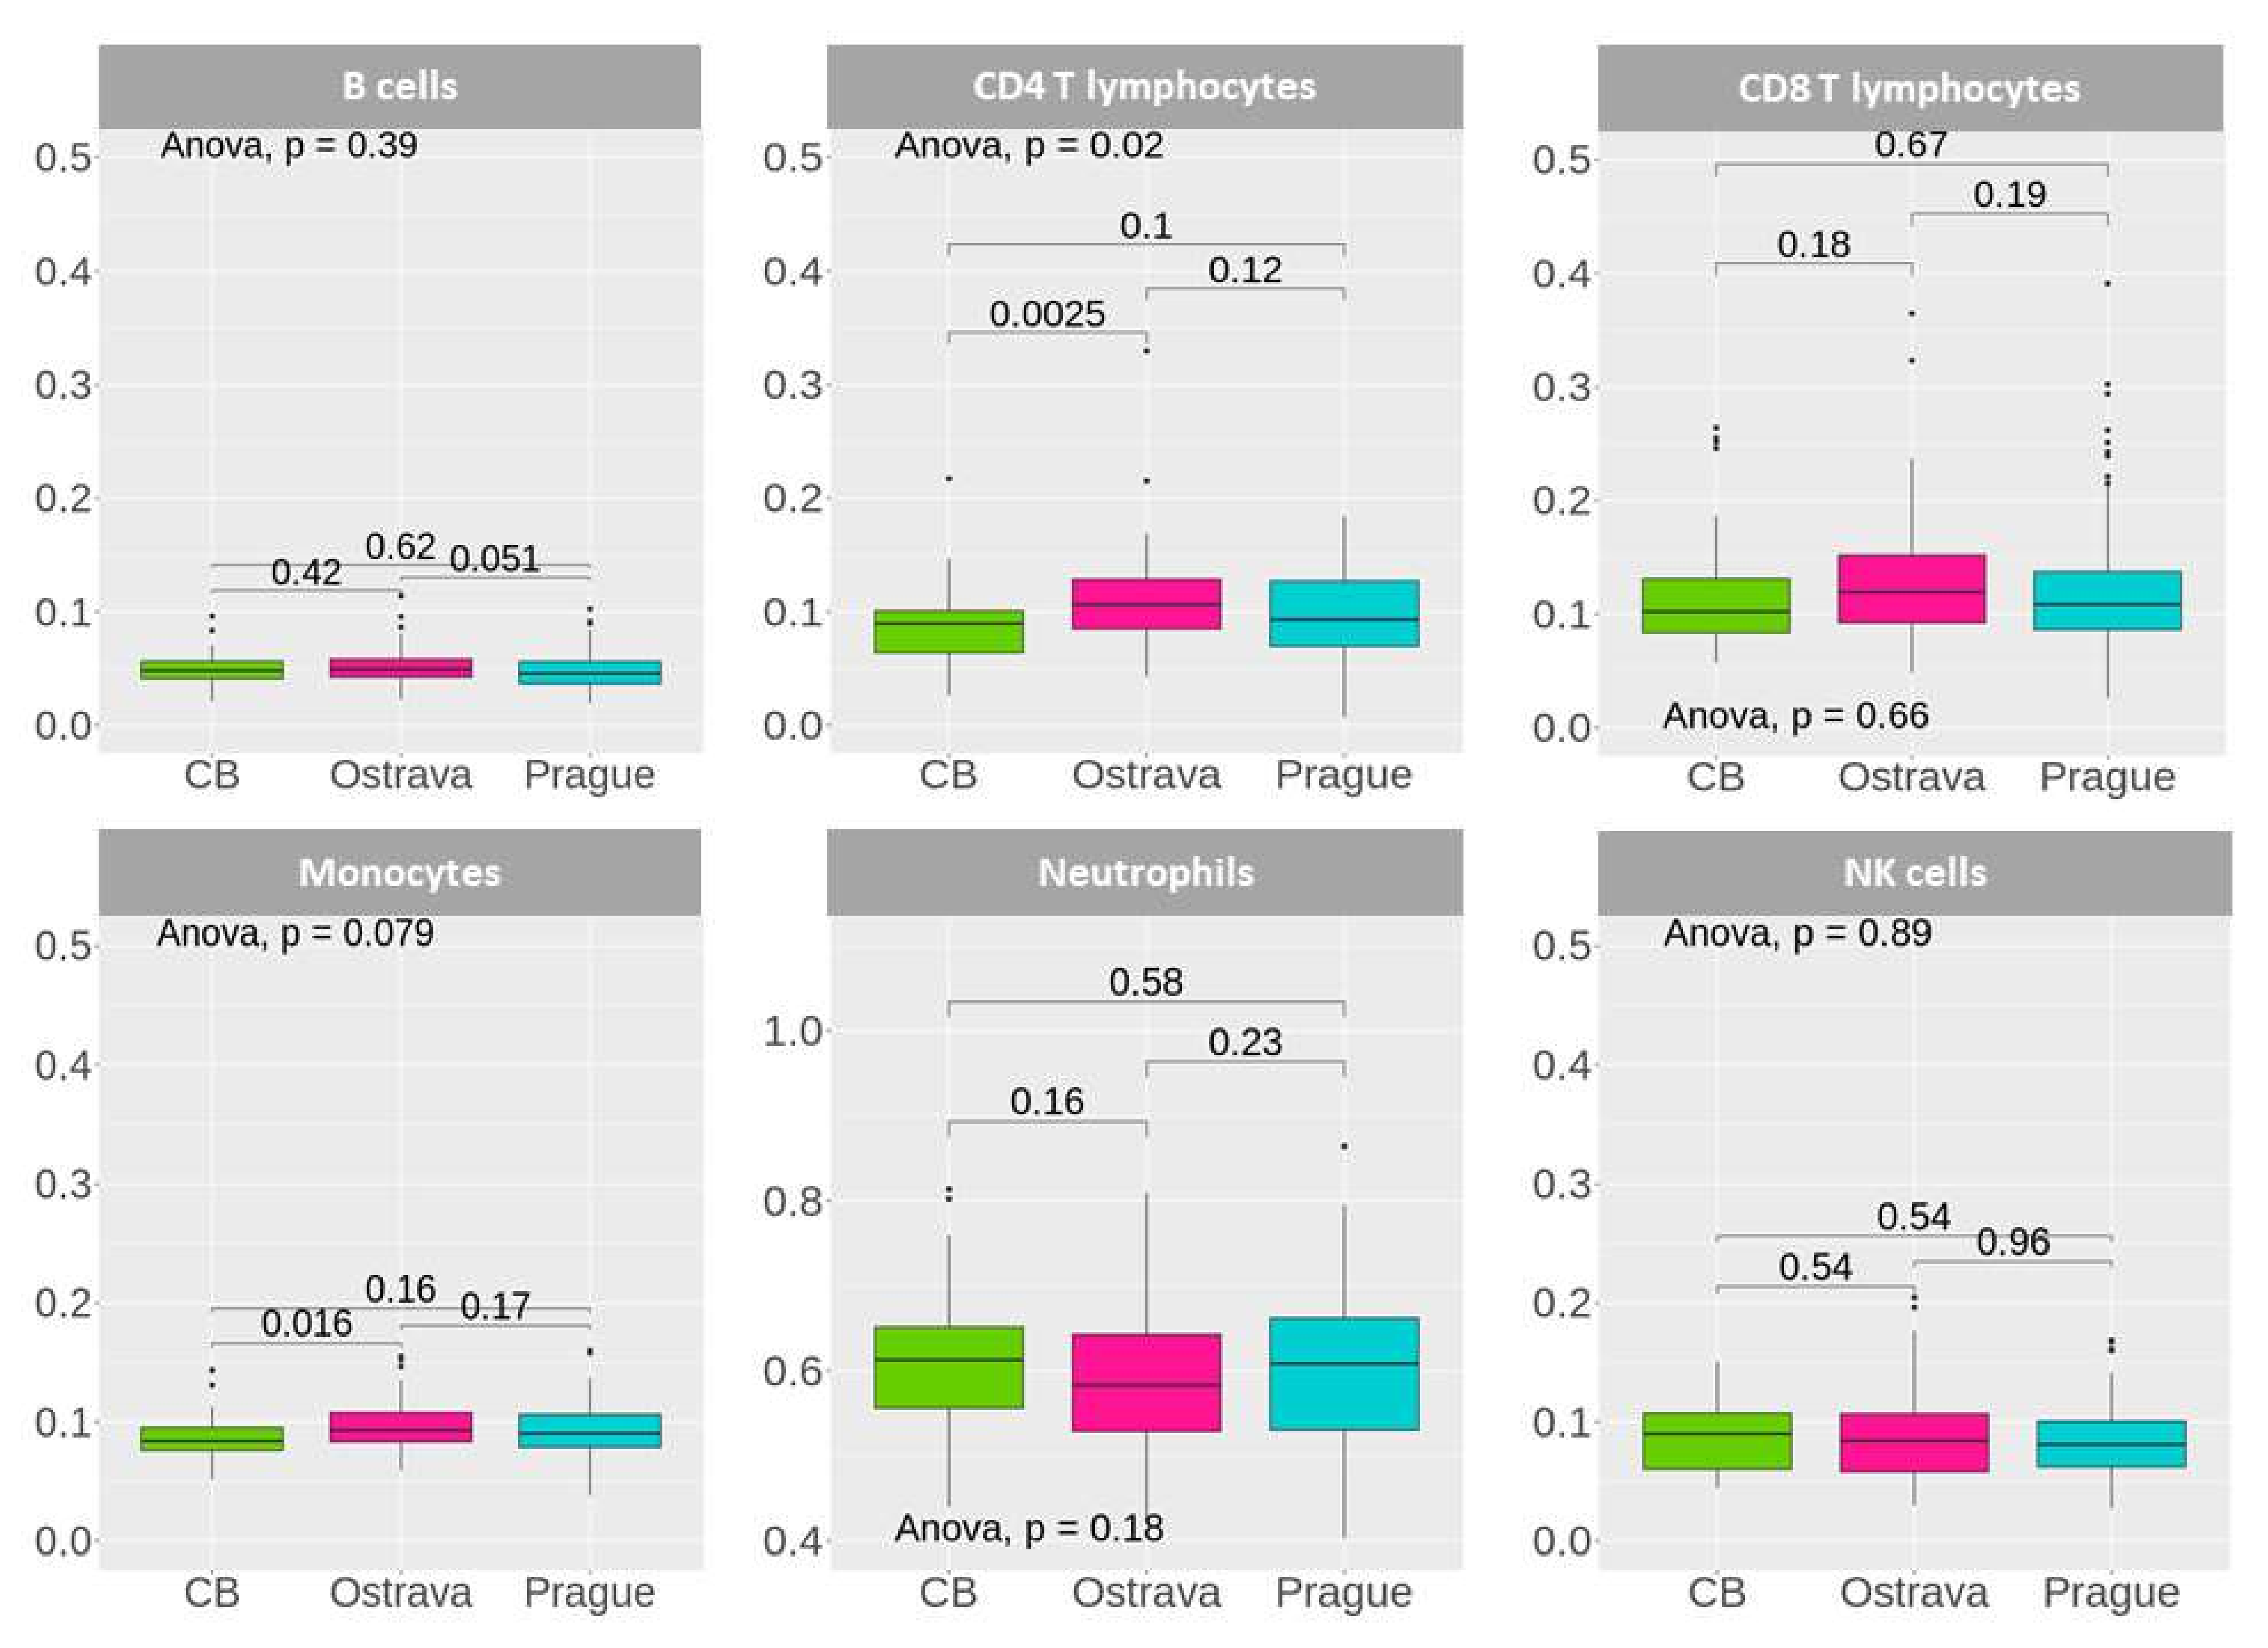
2.3. General DNA Methylation Profiling

First, we analyzed the proportion of blood cell types in samples grouped to localities to exclude the possible effects of sample collection. The results are shown in Figure A1 (Appendix A). The proportion of B cells, Tc cytotoxic cells (CD8T), neutrophils and natural killer cells had a stable, comparable profile in all groups. The results for the proportion of monocytes were on the border of significance. We found a significant variance (p < 0.05) in Th helper cells (CD4T) between Ostrava and CB. Due to the low number of samples from CB, we decided not to correct this discrepancy.
Before comparing DNA methylation profiles between the three localities (Ostrava, Prague and CB), we verified the effect of season (regardless of locality, N = 125 for each season) on the differences in DNA methylation. We did not observe any season-specific clustering of DNA methylation profiles, nor did we detect any differentially methylated CpG loci (DML) (Figure 1).
We used all 250 samples from both seasons for the comparison of DNA methylation profiles between localities. Based on the results of air pollution monitoring, Ostrava was considered as a polluted locality, while Prague and CB were used as control regions, although the localities have specific air quality profiles given by various sources of air pollution (Table 2A,B). The comparison was set on (a) Ostrava–Prague; (b) Ostrava–CB and (c) Prague–CB.
The results of the DNA methylation pattern clustering, analyzed by PCA, and the cluster heatmap applied on significant DML for all compared groups, are shown in Figure 2.
A total of 13,643 CpG loci (FDR, p < 0.01) were significantly differentially methylated (8859 hypermethylated and 4784 hypomethylated) when samples of (a) Ostrava–Prague were compared. A total of 31 CpG loci (FDR, p < 0.01) differed in samples of (b) Ostrava–CB (22 hypermethylated and 9 hypomethylated), while only 3 DML (FDR, p < 0.01) were found in samples of (c) Prague–CB (1 hypermethylated and 2 hypomethylated).
The CpG loci shown in Figure 2 were summarized in a basic overview, consisting of their relation to CpG islands (open sea, island, N/S shore and N/S shelf), a localization of the chromosome, a reference gene, and a level of significance (presented in Table 3). From these loci, two (cg12088417 and cg27210166) for group (a) were hypomethylated, potentially affecting RPTOR, a gene encoding the regulatory-associated protein of MTOR complex 1. Strongly hypermethylated CpG locus (cg18843803, log2FC = 1.95), which can affect the protein-coding gene TSHZ3 (teashirt zinc finger homeobox 3), was identified in group (b). Only three differentially methylated loci were found in group (c). Strong hypomethylation of cg17265515 (log2FC = −1.59) can regulate the gene ERICH1 (glutamate-rich 1). All DML are listed in Table S1.
We mostly found a different proportion of DML in CpG islands in group (b) compared to all evaluated CpG. In group (a), there were more Open Sea loci than in all evaluated CpG.
In group (a), in which we could annotate methylation regions, the location of DML was characterized in relation to putative promoter regions, 3′UTR, exons, introns, etc. We detected a three-times-higher frequency of DNA methylation in the promoter regions than in all annotated genomic regions (Figure 3C). All proportions are shown in Figure 3A–C.

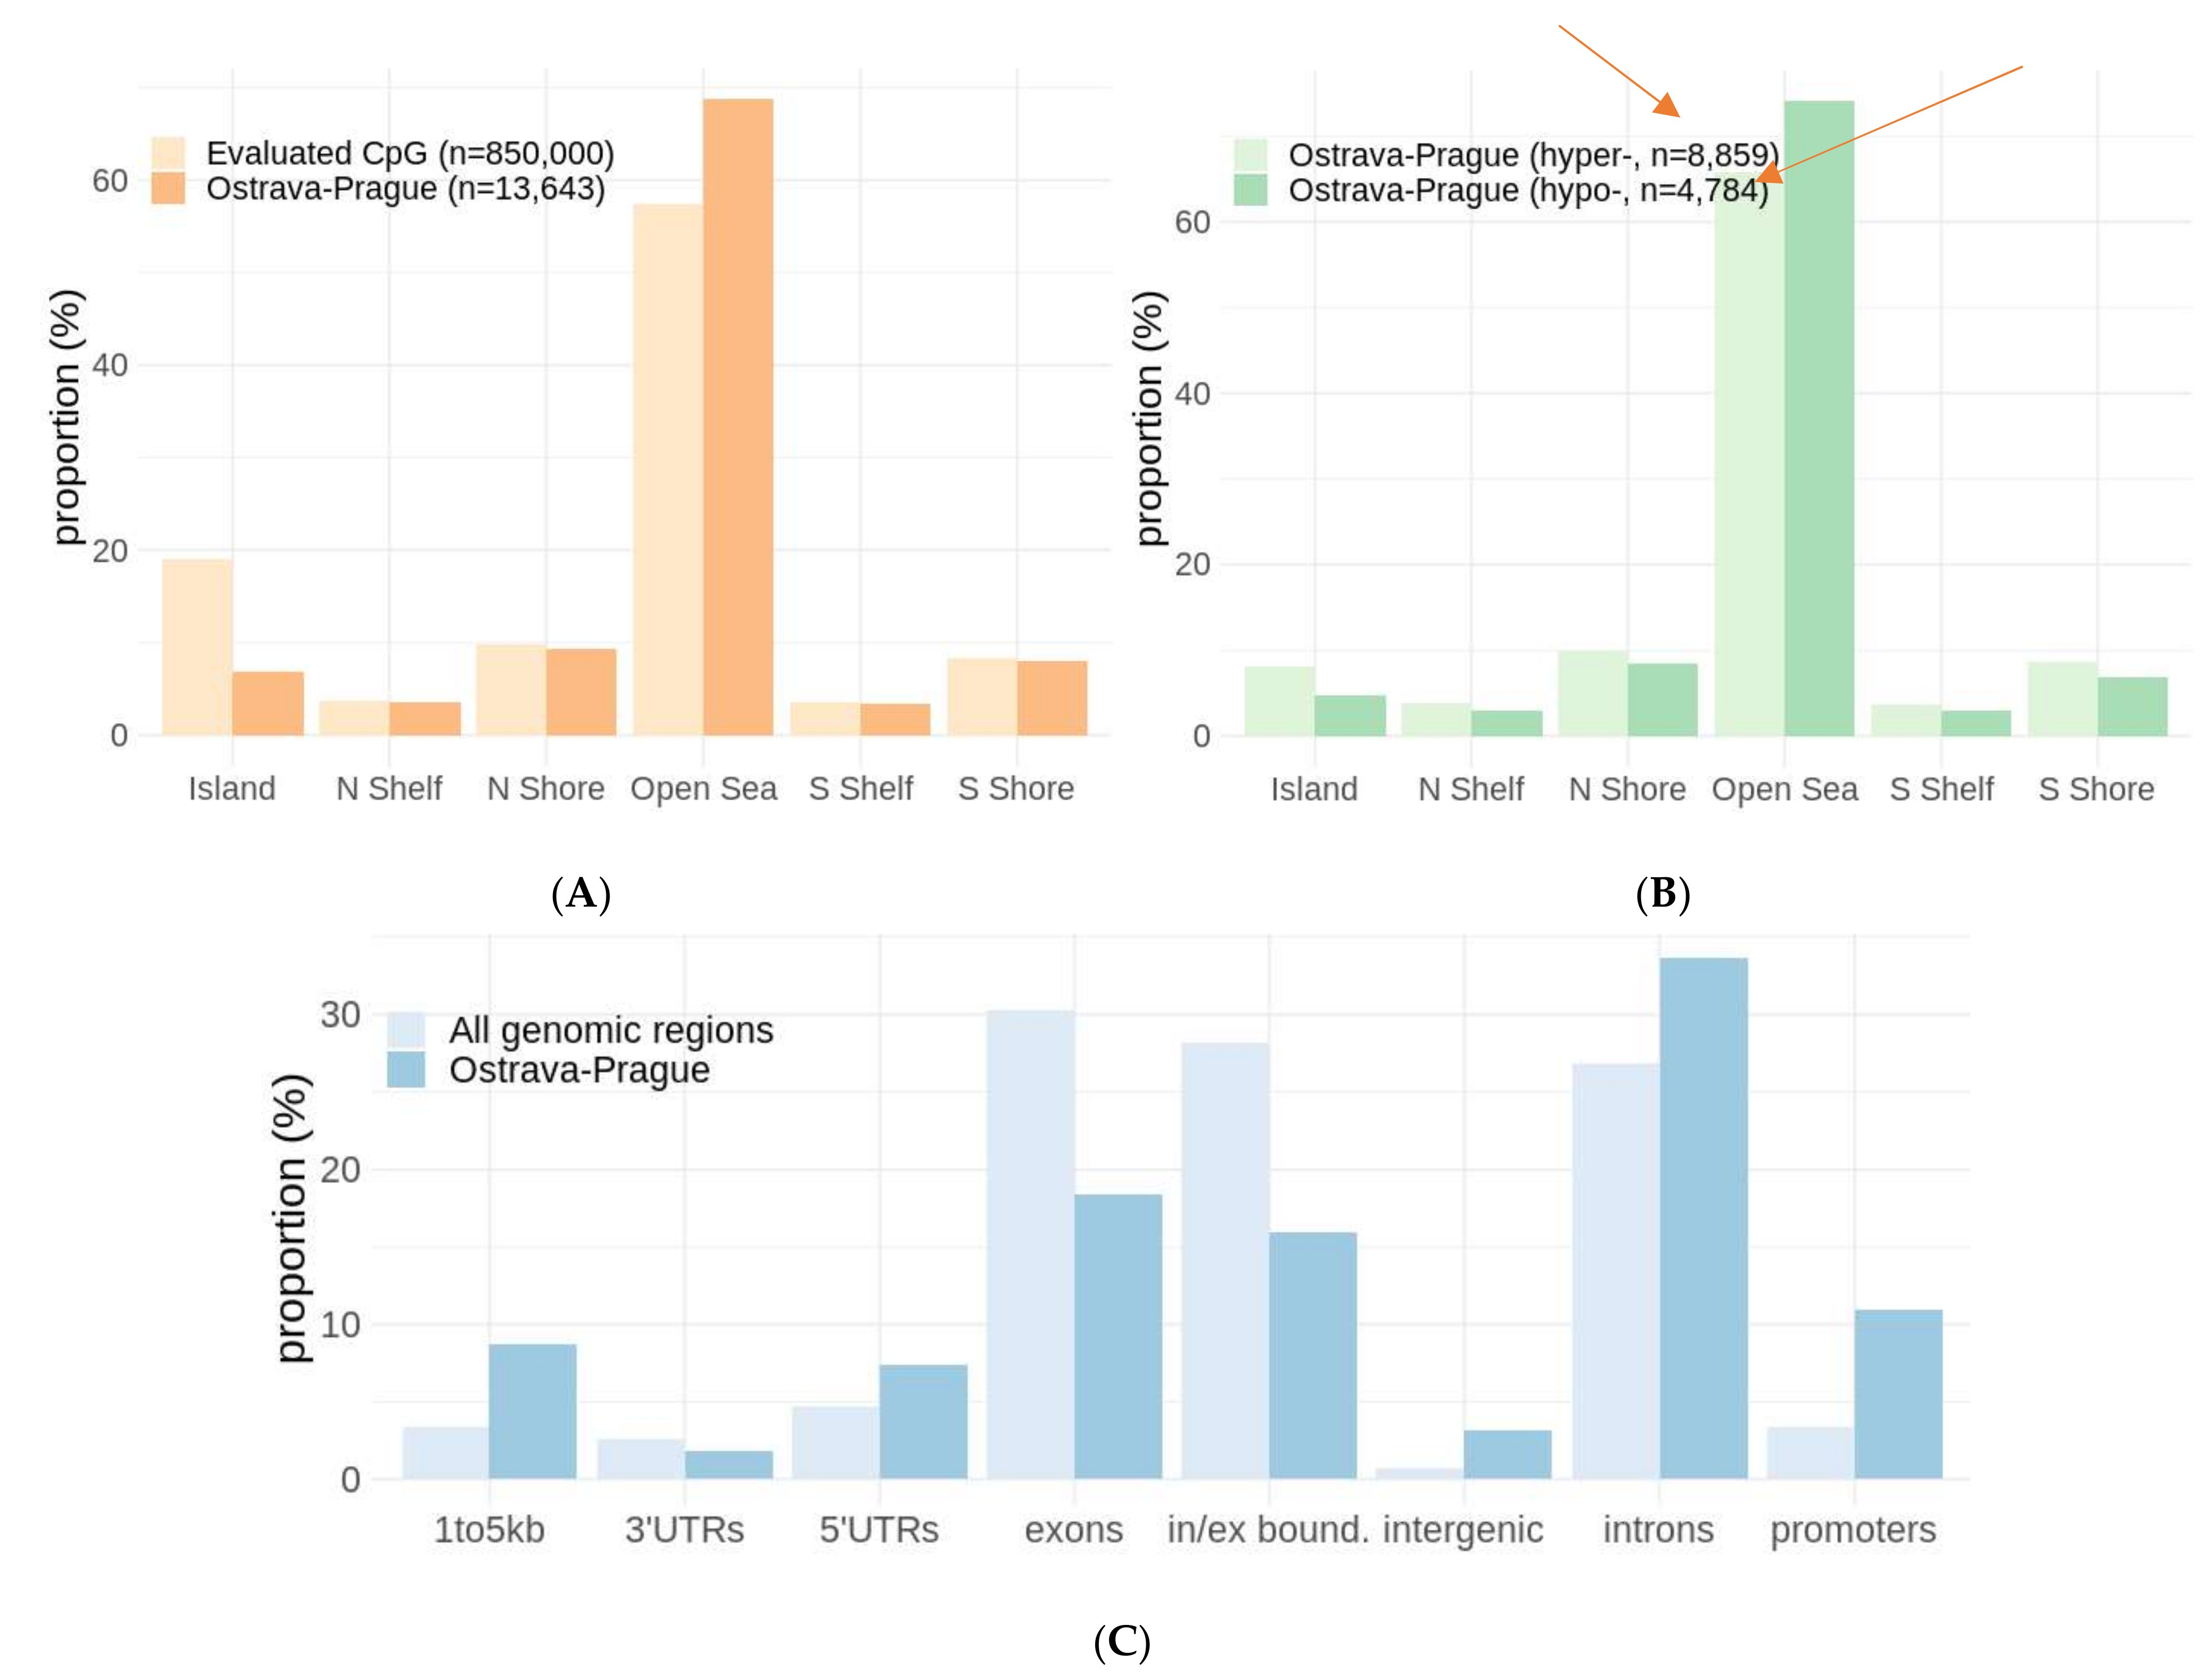
2.4. Differentially Methylated Groups of Loci and Geneset Enrichment

For the Ostrava–Prague comparison, we detected differentially methylated groups (DMG) with numerous DML. DMG with more than seven CpG are listed in Table S2. Some of those located in Island/Shore regions with high relevance to health impacts are shown in Table 4A and discussed in Section 3. For further analysis, we selected groups with more than 15 CpG sites (Table 4B). A total of 20 CpG sites were annotated to the RPTOR gene, which is also shown in Table 3, with the most differentially hypomethylated loci (cg12088417, cg27210166). The COL23A1 encodes a transmembrane nonfibrillar collagen. It is potentially regulated by 17 DML, of which 15 are hypermethylated. We also found the 16 CpG loci annotated to the gene that plays a key role in cardiac action potential (KCNQ1). PTPRN2, annotated to 16 mostly hypomethylated DML, encodes the tyrosine phosphatase, a major islet autoantigen in type-1 diabetes.
For 13,643 CpG loci in the Ostrava–Prague comparison, 5881 genes were annotated (based on ETREZID). These genes were used for gene ontology and gene set enrichment (Figure 4A,B). We obtained significant Kyoto Encyclopedia of Genes and Genomes (KEGG) pathways with more than 50 potentially regulated genes in pathways (Figure 4A), among which signaling cascades prevail. The significant potentially affected pathways (adj. p-value < 0.01) with the highest number of genes were the PIK3A-Akt signaling pathway (hsa04151, 126 genes) and the MAPK signaling pathway (hsa04010, 110 genes). The most significant pathway (adj. p-value = 1.45 × 10⁻⁶) was Axon guidance (hsa04360, 86 genes). The genes usually formed an overlap of several biological pathways, creating higher functional units—biological processes. Functional clusters (Figure 4B) based on measuring distances between the genes were formed mainly for adherens junction assembly and neuronal functions and development, which covered more than 100 regulated genes in each individual process. Other significant pathways (adj. p-value < 0.05) are summarized in Table S3.

3. Discussion

We report the unique study of gene-specific genome-wide DNA methylation profiles in 125 policemen working in cities in the Czech Republic with various types of air pollution. The assessment of the effect of air pollution is not straightforward; therefore, we tried to reduce the impact of lifestyle factors as much as possible by selecting similar cohorts (Table 1). The study is part of a complex project, “Healthy Aging in an Industrial Environment”, the main aim of which is to find specific biochemical, genetic and epigenetic biomarkers of effect, mainly caused by air pollution exposure in different localities and in various population groups. In policemen, we sampled the same cohort in two rounds (in spring and in autumn, at the end of the winter and summer seasons, respectively). The experimental design, based on the analysis of different seasons in Ostrava policemen, was used in a recent study of semen quality and sperm DNA integrity [30]. The authors showed that sperm chromatin damage and the percentage of immature sperm were highly sensitive to air pollution. We also assessed the effect of seasons on DNA methylation patterns, but as no effect and no differentially methylated loci were detected (Figure 1), we included all samples of the policemen (N = 250) in the analysis. We hypothesize that the short-term effects of different levels of air pollution in individual seasons do not influence the DNA methylation pattern. This assumption is based on the fact that there are periods in human life when DNA methylation profiles are susceptible to change (prenatal, early childhood and older age) [31], while DNA methylation is generally relatively stable. On the other hand, another study described the effects of a 24-h short-term exposure to PM2.5 on genome-wide DNA methylation, using the same platform (Illumina Infinium Human Methylation EPIC BeadChip) that we applied in our study [4]. However, the authors used controlled indoor exposure for a short time, and they detected only a small number of DML.
For the characterization of localities and impact of air pollution on DNA methylation patterns, we compared three pollutants in the three-month period before both sampling points, as in a previous study [20]. Moreover, we used annual mean concentrations for four consecutive years. In Ostrava, the highest levels of PM2.5 and B[a]P were detected, while PM2.5 concentrations were comparable in Prague and CB. No differences in NO2 concentrations in winter were observed between Ostrava and the other two localities. The highest long term annual mean concentrations of NO2 were identified in Prague, where the traffic intensity and NO2 levels along/near roads showed positive correlation [32]. The authors of this study used passive samplers at 65 locations in Prague, and found that 32% of locations exceeded the EU annual limit of 40 µg/m3.
We concluded that the localities were mostly characterized by diverse types of air pollution, rather than by high differences in the concentration of air pollutants. The main cause of air pollution in Prague is road traffic, where intensities exceed all other cities in the Czech Republic. Ostrava is characterized by common winter inversions; the city is located close to the Polish border with heavy industry and coal mines producing high levels of air pollutants, along with local industrial emissions. However, air quality in the city has shown an improving trend over the last decades [18].
By comparing the proportion of blood cell types, we found a significant variance in CD4T between the Ostrava and CB samples (Appendix A). We hypothesize that the discrepancies between the groups may be related to low sample numbers in CB. On the other hand, the differences in cell proportion can also be an important regulatory mechanism in response to the environment [33,34].
After merging the sampling periods and through the analysis of 250 samples, we found 13,643 CpG loci for the Ostrava–Prague comparison. Only 31 DML were detected for the Ostrava and CB comparison; we further observed three DML when the Prague and CB samples were compared. We detected almost twice the hypermethylated DML than hypomethylated ones, and a three-times-higher frequency of promoter methylation than in all the annotated genomic regions. The loci in promoters are more biologically significant with the potential to affect gene expression [35].
Our previous study was focused on the whole-genome gene expression response to long-term exposure to air pollution in men from Ostrava and Prague during several seasons [22]. Although no clear relationship between concentrations of air pollutants and gene expression profiles was found, the reduced gene expression was observed in the Ostrava men compared to the controls. In the Ostrava cohort, an increased expression of XRCC5 was found [23]. XRCC5 encodes the protein Ku80, a key player of the DNA repair mechanism NHEJ, in which it binds the DNA breaks [36]. In this study, we found the two hypomethylated loci (cg23433242 and cg01633232; Table S1) annotated to XRCC5. Regardless of whether we found differential DNA methylation in other NHEJ genes as in [23], we can hypothesize that epigenetic modification of a single gene might be sufficient to affect DNA repair functions [37].
Comparing Ostrava and Prague, the most hypomethylated DML was found to be CpG locus cg10123377. This CpG locus was also found in the study of patients with systematic lupus erythematosus in CD8T+ cells [38]. Two of the hypermethylated loci (cg11478607 and cg26946806) located in Island and S Shore, respectively, are annotated to the GSTT1-encoding xenobiotic metabolizing enzyme, which plays an important role in human carcinogenesis [39] and impacts the markers of genotoxicity [40]. Single-nucleotide polymorphisms (SNPs) in GSST1 were widely studied in relation to the interaction effects of long-term air pollution exposure on the risk of acute myocardial infarction and hypertension, with high susceptibility to air pollution being a promoter of coronary vulnerability [41].
Comparing Ostrava and CB, we found the strongly hypermethylated CpG locus (cg18843803), which can affect the protein-coding gene TSHZ3. This gene controls the development of diverse components of the circuitry required for breathing. The protein Teashirt 3 regulates the development of neurons involved in both the respiratory rhythm and airflow control [42]. The reduced expression of this gene and the consequent caspase upregulation may be correlated with the progression of Alzheimer’s disease [43].
In more detail, we focused on groups of differentially methylated loci annotated to the same gene in Ostrava samples, compared to the Prague samples (above seven CpG in Table S2; and a selection of genes with the highest proportion of groups of DML in Table 4A,B).
The highest number of groups of DML was annotated to the RPTOR gene (N = 20). RPTOR is a key component in mTOR pathway, a cell-signaling pathway commonly deregulated in human cancer, which plays roles in mRNA translation, autophagy, cell growth and immune responses (it restricts proinflammatory and promotes an anti-inflammatory response) [44,45]. RPTOR responds to nutrient and insulin levels to regulate cell growth [46]. The deregulation of this gene and pathway is associated with various human diseases, including cancer and diabetes [47,48]. The mTOR pathway (hsa04150) was also found among the significantly affected KEGG pathways (Table S3) that contain 59 genes which are potentially regulated by DML.
DMG, with the second highest number of DML, regulates COL23A1. Collagen XXIII is considered as a biomarker for the detection and recurrence of non-small-cell lung carcinoma and the reappearance of prostate cancer [49,50]. A total of 16 CpG loci, mostly hypermethylated, are annotated to the KCNQ1 gene, which encodes the voltage-gated potassium channel required for the repolarization phase of the cardiac action potential [51]. A hypermethylation of KCNQ1 is associated with poor semen parameters or male infertility [52]. Another study showed, by identifying temporal differences in the imprinting status and methylation effects, that the intronic KCNQ1 locus mediates susceptibility to type-2 diabetes [53]. A major autoantigen associated with insulin-dependent diabetes mellitus [54], PTPRN2 (protein tyrosine phosphatase), was identified for the 16 mostly hypomethylated CpG loci. Methylation in PTPRN2 is associated with childhood asthma and chronical obstruction pulmonary disease in adulthood [55], and it is also related to residential proximity to major roadways in the placenta samples of pregnant women [56].
Nine hypermethylated CpG loci in the Shore/Island region regulate NR4A2, a member of the nuclear receptor family of intracellular transcription factors (adopted from GeneCards). NR4A2 plays a key role in the maintenance of the dopaminergic system of the brain [57], and it is also highly expressed in peripheral blood leukocytes [58]. NR4A2 is involved in autoimmune and neurodegenerative diseases, especially in Parkinson’s disease, where the reduced expression of this gene in peripheral blood can be considered as a potential biomarker for diagnosis, and a promising approach to therapy [59,60,61,62]. Another nine hypermethylated CpG sites can reduce the expression of CDK2AP1, which encodes cyclin-dependent kinase 2 (CDK2), which is important in the reducing of cell proliferation, contributes to cell cycle termination, and is a known tumor suppressor [63].
The most significantly affected pathway, the Axon guidance (hsa04360), contains 86 potentially regulated genes. Changes in the expression or function of these proteins might induce pathological changes in neural circuits that predispose to, or cause, neurological diseases [64]. Several of the genes in this pathway, which were found close to demethylated loci, were identified in patients with early-onset Alzheimer’s disease [65]. The largest cluster presented in Figure 4B gathered the most significant biological processes, with considerable potential gene regulation in neuronal functions. The second firm cluster includes the functions of cell junctions and adhesion assembly. These biological functions are potentially affected by DNA methylation in the Ostrava sample groups compared to Prague.
This study is first that involved a large set of policemen from different air-polluted cities, in whom genome-wide gene-specific DNA methylation was evaluated. It is well known that DNA methylation is a useful biomarker of prior environmental exposure and future health outcomes. However, it can be also affected by many factors of lifestyle and lifetime exposure. Although we could not determine all these factors and separate a specific role of air pollution, we identified the potential biomarkers that will be further studied. For a follow-up study, we have extensive questionnaire data of the complete exposure history of every individual, which will be linked with DNA methylation results to obtain more comprehensive outcomes in this molecular-epidemiological study.

4. Materials and Methods

4.1. Study Subjects

The study subjects were 125 male city policemen working in three cities in the Czech Republic (Prague, N = 55; Ostrava, N = 54; CB, N = 16), all involved in the project in two rounds in 2019: spring (March/April) and autumn (September/October). The cohorts of policemen were chosen as groups that spend most of their working time outdoors. Different cities are characterized, among other factors, by different levels and types of air pollution. Prague is the capital of the Czech Republic and its most densely populated area. Road traffic most significantly contributes to the level of air pollution in Prague. Ostrava is the third largest city, with a long history of coal mining and heavy industry. To date, the Ostrava region is known as one of the European hot spots of air pollution due to its geographical location close to the industrial region of Poland, frequent inversions in winter, heavy traffic and local industrial emissions. The third city, CB, was usually selected as a control locality in our previous studies [21,66,67], due to its close proximity to the Sumava National Park and the large agricultural area in the district (more details given in Table 1).

4.2. Air Pollution Monitoring

Daily concentrations of selected air pollutants (PM2.5, B[a]P and NO2) during both three-month periods before sampling (winter and summer), as well as the annual averages from 2016 to 2019, were obtained from the Annual tabular overview, CHMI (http://portal.chmi.cz/?l=en (accessed on 27 January 2022)). Data were acquired by automatic air pollution monitoring in each city. The stations were located representatively for patrol activities of city policemen. In the city of Ostrava, we used the main CHMI station in Ostrava–Poruba located in a residential area close to a gas station. In Prague 5, we selected two stations: for B[a]P and NO2 monitoring, a station in Prague–Reporyje was situated in a school garden; for PM2.5, a station was placed in Prague–Stodulky in a housing estate. In CB, the stations were located in urban and residential areas. The measurement frequency was daily in the case of PM2.5 and NO2. For B[a]P, the data were obtained twice a week.

4.3. DNA Methylation Analysis

A total of 250 samples of the venous blood of 125 policemen (every policeman provided samples in two sampling periods) were collected into vacuettes containing ethylenediaminetetraacetic acid (EDTA), and frozen at −20 °C for later use. Genomic DNA (gDNA) was extracted using Miller’s salting out method [68]. gDNA (1000 ng) was treated overnight with sodium bisulfite using the EZ DNA Methylation Kit (Zymo Research, Irvine, CA, USA) for the conversion of unmethylated cytosines to uracils, while methylated cytosines remained unchanged. The bisulfite-converted DNA (BCD) samples were stored at −20 °C until use. BCD was processed using the Infinium Methylation EPIC Kit (Illumina, San Diego, CA, USA) according to the manufacturer’s protocol (Infinium HD Methylation Assay Protocol) including enzymatic fragmentation, precipitation and hybridization, followed by BeadChip washing and staining. Each BeadChip consisted of 8 samples. The chips allowed the detection of over 850,000 methylation sites per sample across the genome at single-nucleotide resolution. The methylation status at each CpG site, scanned by the iScan System (Illumina, San Diego, CA, USA), was estimated by measuring the intensity of the pair of methylated and unmethylated probes.

4.4. Statistical Analysis

The descriptive statistics of epidemiological data from questionnaires (age, BMI, exposure history), air pollution (differences in concentrations) and cell type proportion, were carried out using R-stats. Depending on the distribution of the data, the t-test or the nonparametric Mann–Whitney Sum U-test was used for the comparison of individual groups and ANOVA was used for factor analysis. All advanced statistical analyses related to methylation were processed using scripting in an R environment.
Raw microarray data were downloaded as idat files, imported to the R environment and processed with the minfi package [69]. Data were normalized using the quantile method. A series of filtering was performed. Probes with SNPs at CpG sites and the cross-reactive probes were also excluded to obtain the resulting number of 794,441 probes [70]. We estimated associations between principal components and slide factors, and used the Combat function (sva package) for batch correction [71].
Beta values for the determination of the level of methylation as the ratio of the fluorescent signals from the methylated vs. unmethylated sites were also calculated using the minfi package. Preprocessing analyses were performed to study the distribution of beta values and the variation of methylation across all samples.
PCA was performed to identify the variance using covariance matrix, and to detect the potential effects of season and locality. We identified differentially methylated loci using the top Table function (limma package) [72]. For multiple testing of the false discovery rate (FDR), the p-values for the contrast of interest were adjusted to be below <0.01, which is regarded to be the most appropriate for microarray analysis [73].
The proportions of genomic regions to gene positions were analyzed using the annotatr package [74]. An annotation of the CpG site to ENTREZID, plots of the KEGG pathways and an enrichment map were obtained using clusterProfiler package v4.0 [75]. The proportions of blood cell types presented in Appendix A were calculated using the ENmix package [76].

5. Conclusions

This study focused on the comparison of DNA methylation profiles in city policemen working and living in localities that differ in terms of major sources of air pollution. The sampling was conducted repeatedly in two seasons (spring and autumn in the same year). The obtained results clearly demonstrated that there was no effect of season, which corresponds with relatively slow changes in DNA methylation settings in adults. On the other hand, the effects of the different localities with various exposure profiles were clearly visible. For genetic toxicology, the results indicating differences in xenobiotics metabolism and repair and neurodevelopment pathways can be considered the most significant. However, the associations of DNA methylation changes with various diseases, particularly diabetes mellitus or neurodegenerative or respiratory diseases, are often reported. Our observations support the hypothesis that epigenome modification is an effective process for the optimal management of the genome function in response to various types of environments, but it is also a risk factor for future disease development.

Supplementary Materials

The following supporting information can be downloaded at: https://www.mdpi.com/article/10.3390/ijms23031666/s1.

Author Contributions

Conceptualization, K.H. and A.R.; methodology—recruitment, J.R., R.J.S., A.R., K.H., A.P., A.M. and A.A.; methodology—DNA methods, H.M., K.H. and I.C.; formal analysis, K.H.; data curation, K.H.; writing—original draft preparation, K.H.; writing—review and editing, K.H., A.R., J.T., P.R.J. and R.J.S.; visualization, K.H.; project administration, J.T., V.J. and R.J.S.; funding acquisition, V.J., J.T. and R.J.S. All authors have read and agreed to the published version of the manuscript.

Funding

This work was supported by the European Regional Development Fund under the Healthy Aging in Industrial Environment HAIE grant (CZ.02.1.01/0.0/0.0/16_019/0000798). It was also funded by the Ministry of Education, Youth and Sports of the Czech Republic (Research Infrastructure NanoEnviCZ, LM2018124) and The European Union-European Structural and Investments Funds in the frame of the Research Development and Education-project Pro-NanoEnviCz operational program (Project No. CZ.02.1.01/0.0/0.0/16_013/0001821).

Institutional Review Board Statement

All participants signed an informed consent form and had the opportunity to withdraw their participation at any time during the study, in accordance with the Helsinki II declaration. The study was approved by the ethical committee of the Institute of Experimental Medicine CAS in Prague, approval number: 2018/09.

Informed Consent Statement

Informed consent was obtained from all subjects involved in the study.

Acknowledgments

We would like to thank all the policemen for their participation in the study. We also appreciate the technical and laboratory staff (Vera Brezinova, Jolana Vankova, Zuzana Novakova, Vlasta Svecova and Olga Stverakova) for their support working on recruitment, questionnaires and the sampling of biological materials.

Conflicts of Interest

The authors declare no conflict of interest.

Abbreviations

3′UTR3′ Untranslated region
B[a]P Benzo(a)pyrene
BCD Bisulfite-converted DNA
BMI Body mass index
CB Ceske Budejovice
CpG Cytosine-phosphate-Guanine dinucleotide
DMLDifferentially methylated loci
DMGDifferentially methylated groups of loci
EDTAEthylenediaminetetraacetic acid
gDNAGenomic DNA
EWAS Epigenome-wide association study
FDR False discovery rate
KEGG Kyoto Encyclopedia of Genes and Genomes
NHEJNon-homologous end joining
PCA Principal component analysis
PMParticulate matter
PM2.5 Particulate matter less than 2.5 µm in diameter
SNPsSingle-nucleotide polymorphisms

Appendix A

Figure A1. T lymphocytes—Th helper cells; CD8 T lymphocytes—Tc cytotoxic cells; NK cells—natural killer cells (between CB, Ostrava and Prague samples).
Ijms 23 01666 g0a1

References

  1. Rider, C.F.; Carlsten, C. Air Pollution and DNA Methylation: Effects of Exposure in Humans. Clin. Epigen. 2019, 11, 131. [Google Scholar] [CrossRef] [PubMed]
  2. Curradi, M.; Izzo, A.; Badaracco, G.; Landsberger, N. Molecular Mechanisms of Gene Silencing Mediated by DNA Methylation. Mol. Cell. Biol. 2002, 22, 3157–3173. [Google Scholar] [CrossRef] [PubMed]
  3. Baccarelli, A.; Wright, R.O.; Bollati, V.; Tarantini, L.; Litonjua, A.A.; Suh, H.H.; Zanobetti, A.; Sparrow, D.; Vokonas, P.S.; Schwartz, J. Rapid DNA Methylation Changes after Exposure to Traffic Particles. Am. J. Respir. Crit. Care Med. 2009, 179, 572–578. [Google Scholar] [CrossRef] [PubMed]
  4. Li, H.; Chen, R.; Cai, J.; Cui, X.; Huang, N.; Kan, H. Short-Term Exposure to Fine Particulate Air Pollution and Genome-Wide DNA Methylation: A Randomized, Double-Blind, Crossover Trial. Environ. Int. 2018, 120, 130–136. [Google Scholar] [CrossRef] [PubMed]
  5. Nwanaji-Enwerem, J.C.; Colicino, E. DNA Methylation-Based Biomarkers of Environmental Exposures for Human Population Studies. Curr. Environ. Health Rep. 2020, 7, 121–128. [Google Scholar] [CrossRef]
  6. Zeilinger, S.; Kühnel, B.; Klopp, N.; Baurecht, H.; Kleinschmidt, A.; Gieger, C.; Weidinger, S.; Lattka, E.; Adamski, J.; Peters, A.; et al. Tobacco Smoking Leads to Extensive Genome-Wide Changes in DNA Methylation. PLoS ONE 2013, 8, e63812. [Google Scholar] [CrossRef] [PubMed]
  7. Joubert, B.R.; Håberg, S.E.; Nilsen, R.M.; Wang, X.; Vollset, S.E.; Murphy, S.K.; Huang, Z.; Hoyo, C.; Midttun, Ø.; Cupul-Uicab, L.A.; et al. 450K Epigenome-Wide Scan Identifies Differential DNA Methylation in Newborns Related to Maternal Smoking during Pregnancy. Environ. Health Perspect. 2012, 120, 1425–1431. [Google Scholar] [CrossRef]
  8. Reese, S.E.; Zhao, S.; Wu, M.C.; Joubert, B.R.; Parr, C.L.; Håberg, S.E.; Ueland, P.M.; Nilsen, R.M.; Midttun, Ø.; Vollset, S.E.; et al. DNA Methylation Score as a Biomarker in Newborns for Sustained Maternal Smoking during Pregnancy. Environ. Health Perspect. 2017, 125, 760–766. [Google Scholar] [CrossRef]
  9. Liu, C.; Marioni, R.E.; Hedman, Å.K.; Pfeiffer, L.; Tsai, P.-C.; Reynolds, L.M.; Just, A.C.; Duan, Q.; Boer, C.G.; Tanaka, T.; et al. A DNA Methylation Biomarker of Alcohol Consumption. Mol. Psychiatry 2018, 23, 422–433. [Google Scholar] [CrossRef]
  10. Wright, R.O.; Schwartz, J.; Wright, R.J.; Bollati, V.; Tarantini, L.; Park, S.; Hu, H.; Sparrow, D.; Vokonas, P.; Baccarelli, A. Biomarkers of Lead Exposure and DNA Methylation within Retrotransposons. Environ. Health Perspect. 2010, 118, 790–795. [Google Scholar] [CrossRef]
  11. Boyne, D.J.; O’Sullivan, D.E.; Olij, B.F.; King, W.D.; Friedenreich, C.M.; Brenner, D.R. Physical Activity, Global DNA Methylation, and Breast Cancer Risk: A Systematic Literature Review and Meta-Analysis. Cancer Epidemiol. Biomark. Prev. 2018, 27, 1320–1331. [Google Scholar] [CrossRef] [PubMed]
  12. Maghbooli, Z.; Hossein-Nezhad, A.; Adabi, E.; Asadollah-Pour, E.; Sadeghi, M.; Mohammad-Nabi, S.; Zakeri Rad, L.; Malek Hosseini, A.-A.; Radmehr, M.; Faghihi, F.; et al. Air Pollution during Pregnancy and Placental Adaptation in the Levels of Global DNA Methylation. PLoS ONE 2018, 13, e0199772. [Google Scholar] [CrossRef] [PubMed]
  13. Flanagan, J.M. Epigenome-Wide Association Studies (EWAS): Past, Present, and Future. Methods Mol. Biol. 2015, 1238, 51–63. [Google Scholar] [CrossRef] [PubMed]
  14. Gruzieva, O.; Xu, C.-J.; Breton, C.V.; Annesi-Maesano, I.; Antó, J.M.; Auffray, C.; Ballereau, S.; Bellander, T.; Bousquet, J.; Bustamante, M.; et al. Epigenome-Wide Meta-Analysis of Methylation in Children Related to Prenatal NO2 Air Pollution Exposure. Environ. Health Perspect. 2017, 125, 104–110. [Google Scholar] [CrossRef] [PubMed]
  15. Gruzieva, O.; Xu, C.-J.; Yousefi, P.; Relton, C.; Merid, S.K.; Breton, C.V.; Gao, L.; Volk, H.E.; Feinberg, J.I.; Ladd-Acosta, C.; et al. Prenatal Particulate Air Pollution and DNA Methylation in Newborns: An Epigenome-Wide Meta-Analysis. Environ. Health Perspect. 2019, 127, 57012. [Google Scholar] [CrossRef]
  16. Jiang, C.-L.; He, S.-W.; Zhang, Y.-D.; Duan, H.-X.; Huang, T.; Huang, Y.-C.; Li, G.-F.; Wang, P.; Ma, L.-J.; Zhou, G.-B.; et al. Air Pollution and DNA Methylation Alterations in Lung Cancer: A Systematic and Comparative Study. Oncotarget 2016, 8, 1369–1391. [Google Scholar] [CrossRef]
  17. Sram, R.J.; Benes, I.; Binkova, B.; Dejmek, J.; Horstman, D.; Kotesovec, F.; Otto, D.; Perreault, S.D.; Rubes, J.; Selevan, S.G.; et al. Teplice Program—The Impact of Air Pollution on Human Health. Environ. Health Perspect. 1996, 104, 699–714. [Google Scholar]
  18. Jirik, V.; Machaczka, O.; Miturova, H.; Tomasek, I.; Slachtova, H.; Janoutova, J.; Velicka, H.; Janout, V. Air Pollution and Potential Health Risk in Ostrava Region—A Review. Cent. Eur. J. Public Health 2016, 24, S4–S17. [Google Scholar] [CrossRef]
  19. Sram, R.J.; Milcova, A.; Pastorkova, A.; Rossner, P.; Rossnerova, A.; Schmuczerova, J.; Spatova, M.; Svecova, V.; Topinka, J. European Hot Spot of Air Pollution by PM2.5 and Bap: Ostrava, Czech Republic. Epidemiology 2011, 22, S232. [Google Scholar] [CrossRef]
  20. Rossnerova, A.; Tulupova, E.; Tabashidze, N.; Schmuczerova, J.; Dostal, M.; Rossner, P.; Gmuender, H.; Sram, R.J. Factors Affecting the 27K DNA Methylation Pattern in Asthmatic and Healthy Children from Locations with Various Environments. Mutat. Res. 2013, 741–742, 18–26. [Google Scholar] [CrossRef]
  21. Honkova, K.; Rossnerova, A.; Pavlikova, J.; Svecova, V.; Klema, J.; Topinka, J.; Milcova, A.; Libalova, H.; Choi, H.; Veleminsky, M.; et al. Gene Expression Profiling in Healthy Newborns from Diverse Localities of the Czech Republic. Environ. Mol. Mutagenes. 2018, 59, 401–415. [Google Scholar] [CrossRef] [PubMed]
  22. Rossner, P.; Tulupova, E.; Rossnerova, A.; Libalova, H.; Honkova, K.; Gmuender, H.; Pastorkova, A.; Svecova, V.; Topinka, J.; Sram, R.J. Reduced Gene Expression Levels after Chronic Exposure to High Concentrations of Air Pollutants. Mutat. Res. 2015, 780, 60–70. [Google Scholar] [CrossRef] [PubMed]
  23. Rossner, P.; Uhlirova, K.; Beskid, O.; Rossnerova, A.; Svecova, V.; Sram, R.J. Expression of XRCC5 in Peripheral Blood Lymphocytes Is Upregulated in Subjects from a Heavily Polluted Region in the Czech Republic. Mutat. Res. 2011, 713, 76–82. [Google Scholar] [CrossRef] [PubMed]
  24. Jirik, V.; Tomasek, L.; Fojtikova, I.; Janoš, T.; Stanovska, M.; Gunkova, P.; Dalecka, A.; Vrtkova, A.; Sram, R.J. Lifetime Carcinogenic Risk Proportions from Inhalation Exposures in Industrial and Non-Industrial Regions. Int. J. Environ. Res. Public Health 2021, 18, 13295. [Google Scholar] [CrossRef]
  25. Libalova, H.; Dostal, M.; Sram, R.J. Study of Gene Expression in Asthmatic Children Living in Localities with Differenct Extent of Air Pollution. Ochr. Ovzduší 2011, 23, 13–17. [Google Scholar]
  26. Kratenova, J.; Zejglicova, K.; Puklova, V. Respiratory Diseases in Children in the Moravian-Silesian Region in Comparison with the Results of National Monitoring. Hygiena 2018, 63, 116–121. [Google Scholar] [CrossRef]
  27. Zejglicova, K.; Puklova, V.; Kratenova, J.; Brabec, M.; Maly, M.; Tomek, M.; Urban, F.; Kubinova, R. Prevalence of Allergic Diseases and Respiratory Disorders in Children in Relation to Air Quality in the Moravian-Silesian Region. Hygiena 2019, 64, 45–51. [Google Scholar] [CrossRef]
  28. Stirzaker, C.; Taberlay, P.C.; Statham, A.L.; Clark, S.J. Mining Cancer Methylomes: Prospects and Challenges. Trends Genet. 2014, 30, 75–84. [Google Scholar] [CrossRef]
  29. Lanata, C.M.; Chung, S.A.; Criswell, L.A. DNA Methylation 101: What Is Important to Know about DNA Methylation and Its Role in SLE Risk and Disease Heterogeneity. Lupus Sci. Med. 2018, 5, e000285. [Google Scholar] [CrossRef]
  30. Rubes, J.; Sipek, J.; Kopecka, V.; Musilova, P.; Vozdova, M. Semen Quality and Sperm DNA Integrity in City Policemen Exposed to Polluted Air in an Urban Industrial Agglomeration. Int. J. Hyg. Environ. Health 2021, 237, 113835. [Google Scholar] [CrossRef]
  31. Ferrari, L.; Carugno, M.; Bollati, V. Particulate Matter Exposure Shapes DNA Methylation through the Lifespan. Clin. Epigenet. 2019, 11, 129. [Google Scholar] [CrossRef] [PubMed]
  32. Vojtisek-Lom, M.; Suta, M.; Sikorova, J.; Sram, R.J. High NO2 Concentrations Measured by Passive Samplers in Czech Cities: Unresolved Aftermath of Dieselgate? Atmosphere 2021, 12, 649. [Google Scholar] [CrossRef]
  33. Rossnerova, A.; Izzotti, A.; Pulliero, A.; Bast, A.; Rattan, S.I.S.; Rossner, P. The Molecular Mechanisms of Adaptive Response Related to Environmental Stress. Int. J. Mol. Sci. 2020, 21, 7053. [Google Scholar] [CrossRef] [PubMed]
  34. Rossnerova, A.; Honkova, K.; Chvojkova, I.; Pelclova, D.; Zdimal, V.; Hubacek, J.A.; Lischkova, L.; Vlckova, S.; Ondracek, J.; Dvorackova, S.; et al. Individual DNA Methylation Pattern Shifts in Nanoparticles-Exposed Workers Analyzed in Four Consecutive Years. Int. J. Mol. Sci. 2021, 22, 7834. [Google Scholar] [CrossRef]
  35. Moore, L.D.; Le, T.; Fan, G. DNA Methylation and Its Basic Function. Neuropsychopharmacology 2013, 38, 23–38. [Google Scholar] [CrossRef]
  36. Lieber, M.R.; Yu, K.; Raghavan, S.C. Roles of Nonhomologous DNA End Joining, V(D)J Recombination, and Class Switch Recombination in Chromosomal Translocations. DNA Repair 2006, 5, 1234–1245. [Google Scholar] [CrossRef]
  37. Rossnerova, A.; Pokorna, M.; Svecova, V.; Sram, R.J.; Topinka, J.; Zölzer, F.; Rossner, P. Adaptation of the Human Population to the Environment: Current Knowledge, Clues from Czech Cytogenetic and “Omics” Biomonitoring Studies and Possible Mechanisms. Mutat. Res. Rev. Mutat. Res. 2017, 773, 188–203. [Google Scholar] [CrossRef]
  38. Miller, S.; Tsou, P.-S.; Coit, P.; Gensterblum-Miller, E.; Renauer, P.; Rohraff, D.M.; Kilian, N.C.; Schonfeld, M.; Sawalha, A.H. Hypomethylation of STAT1 and HLA-DRB1 Is Associated with Type-I Interferon-Dependent HLA-DRB1 Expression in Lupus CD8+ T Cells. Ann. Rheum. Dis. 2019, 78, 519–528. [Google Scholar] [CrossRef]
  39. Rebbeck, T.R. Molecular Epidemiology of the Human Glutathione S-Transferase Genotypes GSTM1 and GSTT1 in Cancer Susceptibility. Cancer Epidemiol. Biomark. Prev. 1997, 6, 733–743. [Google Scholar]
  40. Naccarati, A.; Soucek, P.; Stetina, R.; Haufroid, V.; Kumar, R.; Vodickova, L.; Trtkova, K.; Dusinska, M.; Hemminki, K.; Vodicka, P. Genetic Polymorphisms and Possible Gene-Gene Interactions in Metabolic and DNA Repair Genes: Effects on DNA Damage. Mutat. Res. 2006, 593, 22–31. [Google Scholar] [CrossRef]
  41. Levinsson, A.; Olin, A.-C.; Modig, L.; Dahgam, S.; Björck, L.; Rosengren, A.; Nyberg, F. Interaction Effects of Long-Term Air Pollution Exposure and Variants in the GSTP1, GSTT1 and GSTCD Genes on Risk of Acute Myocardial Infarction and Hypertension: A Case-Control Study. PLoS ONE 2014, 9, e99043. [Google Scholar] [CrossRef]
  42. Caubit, X.; Thoby-Brisson, M.; Voituron, N.; Filippi, P.; Bévengut, M.; Faralli, H.; Zanella, S.; Fortin, G.; Hilaire, G.; Fasano, L. Teashirt 3 Regulates Development of Neurons Involved in Both Respiratory Rhythm and Airflow Control. J. Neurosci. 2010, 30, 9465–9476. [Google Scholar] [CrossRef]
  43. Kajiwara, Y.; Akram, A.; Katsel, P.; Haroutunian, V.; Schmeidler, J.; Beecham, G.; Haines, J.L.; Pericak-Vance, M.A.; Buxbaum, J.D. FE65 Binds Teashirt, Inhibiting Expression of the Primate-Specific Caspase-4. PLoS ONE 2009, 4, e5071. [Google Scholar] [CrossRef] [PubMed]
  44. Guertin, D.A.; Sabatini, D.M. Defining the Role of MTOR in Cancer. Cancer Cell 2007, 12, 9–22. [Google Scholar] [CrossRef] [PubMed]
  45. Weichhart, T.; Säemann, M.D. The Multiple Facets of MTOR in Immunity. Trends Immunol. 2009, 30, 218–226. [Google Scholar] [CrossRef]
  46. Kim, D.-H.; Sarbassov, D.D.; Ali, S.M.; King, J.E.; Latek, R.R.; Erdjument-Bromage, H.; Tempst, P.; Sabatini, D.M. MTOR Interacts with Raptor to Form a Nutrient-Sensitive Complex That Signals to the Cell Growth Machinery. Cell 2002, 110, 163–175. [Google Scholar] [CrossRef]
  47. Blandino-Rosano, M.; Bernal-Mizrachi, E. 2124-P: Raptor Levels Are Critical in the Adaptation of Beta Cells to High-Fat Diet. Diabetes 2020, 69, 2124. [Google Scholar] [CrossRef]
  48. Ni, Q.; Gu, Y.; Xie, Y.; Yin, Q.; Zhang, H.; Nie, A.; Li, W.; Wang, Y.; Ning, G.; Wang, W.; et al. Raptor Regulates Functional Maturation of Murine Beta Cells. Nat. Commun. 2017, 8, 15755. [Google Scholar] [CrossRef]
  49. Banyard, J.; Bao, L.; Hofer, M.D.; Zurakowski, D.; Spivey, K.A.; Feldman, A.S.; Hutchinson, L.M.; Kuefer, R.; Rubin, M.A.; Zetter, B.R. Collagen XXIII Expression Is Associated with Prostate Cancer Recurrence and Distant Metastases. Clin. Cancer Res. 2007, 13, 2634–2642. [Google Scholar] [CrossRef]
  50. Spivey, K.A.; Banyard, J.; Solis, L.M.; Wistuba, I.I.; Barletta, J.A.; Gandhi, L.; Feldman, H.A.; Rodig, S.J.; Chirieac, L.R.; Zetter, B.R. Collagen XXIII: A Potential Biomarker for the Detection of Primary and Recurrent Non-Small Cell Lung Cancer. Cancer Epidemiol. Biomark. Prev. 2010, 19, 1362–1372. [Google Scholar] [CrossRef]
  51. Abbott, G.W. Biology of the KCNQ1 Potassium Channel. New J. Sci. 2014, 2014, e237431. [Google Scholar] [CrossRef]
  52. Rajender, S.; Avery, K.; Agarwal, A. Epigenetics, Spermatogenesis and Male Infertility. Mutat. Res. 2011, 727, 62–71. [Google Scholar] [CrossRef] [PubMed]
  53. Travers, M.E.; Mackay, D.J.G.; Nitert, M.D.; Morris, A.P.; Lindgren, C.M.; Berry, A.; Johnson, P.R.; Hanley, N.; Groop, L.C.; McCarthy, M.I.; et al. Insights into the Molecular Mechanism for Type 2 Diabetes Susceptibility at the KCNQ1 Locus From Temporal Changes in Imprinting Status in Human Islets. Diabetes 2013, 62, 987–992. [Google Scholar] [CrossRef] [PubMed]
  54. Lu, J.; Li, Q.; Xie, H.; Chen, Z.J.; Borovitskaya, A.E.; Maclaren, N.K.; Notkins, A.L.; Lan, M.S. Identification of a Second Transmembrane Protein Tyrosine Phosphatase, IA-2beta, as an Autoantigen in Insulin-Dependent Diabetes Mellitus: Precursor of the 37-KDa Tryptic Fragment. Proc. Natl. Acad. Sci. USA 1996, 93, 2307–2311. [Google Scholar] [CrossRef]
  55. Den Dekker, H.T.; Burrows, K.; Felix, J.F.; Salas, L.A.; Nedeljkovic, I.; Yao, J.; Rifas-Shiman, S.L.; Ruiz-Arenas, C.; Amin, N.; Bustamante, M.; et al. Newborn DNA-Methylation, Childhood Lung Function, and the Risks of Asthma and COPD across the Life Course. Eur. Respir. J. 2019, 53. [Google Scholar] [CrossRef] [PubMed]
  56. Kingsley, S.L.; Eliot, M.N.; Whitsel, E.A.; Huang, Y.-T.; Kelsey, K.T.; Marsit, C.J.; Wellenius, G.A. Maternal Residential Proximity to Major Roadways, Birth Weight, and Placental DNA Methylation. Environ. Int. 2016, 92, 43–49. [Google Scholar] [CrossRef]
  57. Sacchetti, P.; Carpentier, R.; Ségard, P.; Olivé-Cren, C.; Lefebvre, P. Multiple Signaling Pathways Regulate the Transcriptional Activity of the Orphan Nuclear Receptor NURR1. Nucleic Acids Res. 2006, 34, 5515–5527. [Google Scholar] [CrossRef]
  58. Doi, Y.; Oki, S.; Ozawa, T.; Hohjoh, H.; Miyake, S.; Yamamura, T. Orphan Nuclear Receptor NR4A2 Expressed in T Cells from Multiple Sclerosis Mediates Production of Inflammatory Cytokines. Proc. Natl. Acad. Sci. USA 2008, 105, 8381–8386. [Google Scholar] [CrossRef]
  59. Ruiz-Sánchez, E.; Yescas, P.; Rodríguez-Violante, M.; Martínez-Rodríguez, N.; Díaz-López, J.N.; Ochoa, A.; Valdes-Rojas, S.S.; Magos-Rodríguez, D.; Rojas-Castañeda, J.C.; Cervantes-Arriaga, A.; et al. Association of Polymorphisms and Reduced Expression Levels of the NR4A2 Gene with Parkinson’s Disease in a Mexican Population. J. Neurol. Sci. 2017, 379, 58–63. [Google Scholar] [CrossRef]
  60. Montarolo, F.; Perga, S.; Martire, S.; Navone, D.N.; Marchet, A.; Leotta, D.; Bertolotto, A. Altered NR4A Subfamily Gene Expression Level in Peripheral Blood of Parkinson’s and Alzheimer’s Disease Patients. Neurotox. Res. 2016, 30, 338–344. [Google Scholar] [CrossRef]
  61. Le, W.; Pan, T.; Huang, M.; Xu, P.; Xie, W.; Zhu, W.; Zhang, X.; Deng, H.; Jankovic, J. Decreased NURR1 Gene Expression in Patients with Parkinson’s Disease. J. Neurol. Sci. 2008, 273, 29–33. [Google Scholar] [CrossRef] [PubMed]
  62. Liu, H.; Wei, L.; Tao, Q.; Deng, H.; Ming, M.; Xu, P.; Le, W. Decreased NURR1 and PITX3 Gene Expression in Chinese Patients with Parkinson’s Disease. Eur. J. Neurol. 2012, 19, 870–875. [Google Scholar] [CrossRef] [PubMed]
  63. Zolochevska, O.; Figueiredo, M.L. Novel Tumor Growth Inhibition Mechanism by Cell Cycle Regulator Cdk2ap1 Involves Antiangiogenesis Modulation. Microvasc. Res. 2010, 80, 324–331. [Google Scholar] [CrossRef]
  64. Battum, E.Y.V.; Brignani, S.; Pasterkamp, R.J. Axon Guidance Proteins in Neurological Disorders. Lancet Neurol. 2015, 14, 532–546. [Google Scholar] [CrossRef]
  65. Antonell, A.; Lladó, A.; Altirriba, J.; Botta-Orfila, T.; Balasa, M.; Fernández, M.; Ferrer, I.; Sánchez-Valle, R.; Molinuevo, J.L. A Preliminary Study of the Whole-Genome Expression Profile of Sporadic and Monogenic Early-Onset Alzheimer’s Disease. Neurobiol. Aging 2013, 34, 1772–1778. [Google Scholar] [CrossRef]
  66. Ambroz, A.; Vlkova, V.; Rossner, P.; Rossnerova, A.; Svecova, V.; Milcova, A.; Pulkrabova, J.; Hajslova, J.; Veleminsky, M.; Solansky, I.; et al. Impact of Air Pollution on Oxidative DNA Damage and Lipid Peroxidation in Mothers and Their Newborns. Int. J. Hyg. Environ. Health 2016, 219, 545–556. [Google Scholar] [CrossRef]
  67. Sram, R.J.; Binkova, B.; Dostal, M.; Merkerova-Dostalova, M.; Libalova, H.; Milcova, A.; Rossner, P.; Rossnerova, A.; Schmuczerova, J.; Svecova, V.; et al. Health Impact of Air Pollution to Children. Int. J. Hyg. Environ. Health 2013, 216, 533–540. [Google Scholar] [CrossRef]
  68. Miller, S.A.; Dykes, D.D.; Polesky, H.F. A Simple Salting out Procedure for Extracting DNA from Human Nucleated Cells. Nucleic Acids Res. 1988, 16, 1215. [Google Scholar] [CrossRef]
  69. Aryee, M.J.; Jaffe, A.E.; Corrada-Bravo, H.; Ladd-Acosta, C.; Feinberg, A.P.; Hansen, K.D.; Irizarry, R.A. Minfi: A Flexible and Comprehensive Bioconductor Package for the Analysis of Infinium DNA Methylation Microarrays. Bioinformatics 2014, 30, 1363–1369. [Google Scholar] [CrossRef]
  70. McCartney, D.L.; Walker, R.M.; Morris, S.W.; McIntosh, A.M.; Porteous, D.J.; Evans, K.L. Identification of Polymorphic and Off-Target Probe Binding Sites on the Illumina Infinium MethylationEPIC BeadChip. Genom. Data 2016, 9, 22–24. [Google Scholar] [CrossRef]
  71. Leek, J.T.; Johnson, W.E.; Parker, H.S.; Jaffe, A.E.; Storey, J.D. The Sva Package for Removing Batch Effects and Other Unwanted Variation in High-Throughput Experiments. Bioinformatics 2012, 28, 882–883. [Google Scholar] [CrossRef] [PubMed]
  72. Ritchie, M.E.; Phipson, B.; Wu, D.; Hu, Y.; Law, C.W.; Shi, W.; Smyth, G.K. Limma Powers Differential Expression Analyses for RNA-Sequencing and Microarray Studies. Nucleic Acids Res. 2015, 43, e47. [Google Scholar] [CrossRef] [PubMed]
  73. Li, D.; Xie, Z.; Le Pape, M.; Dye, T. An Evaluation of Statistical Methods for DNA Methylation Microarray Data Analysis. BMC Bioinform. 2015, 16, 217. [Google Scholar] [CrossRef] [PubMed]
  74. Cavalcante, R.G.; Sartor, M.A. Annotatr: Genomic Regions in Context. Bioinformatics 2017, 33, 2381–2383. [Google Scholar] [CrossRef]
  75. Wu, T.; Hu, E.; Xu, S.; Chen, M.; Guo, P.; Dai, Z.; Feng, T.; Zhou, L.; Tang, W.; Zhan, L.; et al. ClusterProfiler 4.0: A Universal Enrichment Tool for Interpreting Omics Data. Innovation 2021, 2, 100141. [Google Scholar] [CrossRef]
  76. Houseman, E.A.; Accomando, W.P.; Koestler, D.C.; Christensen, B.C.; Marsit, C.J.; Nelson, H.H.; Wiencke, J.K.; Kelsey, K.T. DNA Methylation Arrays as Surrogate Measures of Cell Mixture Distribution. BMC Bioinform. 2012, 13, 86. [Google Scholar] [CrossRef]
Figure 1. PCA shows no differences between the spring and autumn sampling periods.
Ijms 23 01666 g001
Figure 2. General DNA methylation profiling represented by PCA and heatmaps for comparison: (a) Ostrava–Prague; (b) Ostrava–CB; (c) Prague–CB. In the heatmap, hierarchical clustering for all samples (represented by columns) for the most significant DML are shown (n = 10, n = 10, n = 3, respectively).
Ijms 23 01666 g002
Figure 3. A proportion of annotated CpG loci according to distance from CpG islands for differentially methylated sites for the Ostrava–Prague group compared to all evaluated CpG loci (A), where the highest representation of loci is in Open Sea. A resolution to hypomethylated and hypermethylated sites is comparable (B). A proportion of annotated methylated genomic regions to gene position shows a higher proportion of promoters in Ostrava–Prague annotated genomic regions than in all genomic regions (C).
Ijms 23 01666 g003
Figure 4. Gene ontology characterized by KEGG-affected pathways for genes annotated to significant CpG loci (A). The gene set enrichment map based on the distance of each gene in biological processes (B).
Ijms 23 01666 g004aIjms 23 01666 g004b
Table 1. Basic characteristics of subjects grouped according to the study locality.
Study LocalityOstravaPragueCB
Number of samples/subjects108/54110/5532/16
Age (years)40.4; 9.3
(42.0; 21–61)
39.3; 9.2
(38.0; 23–63)
38.0; 6.4
(38.0; 22–48)
Mean; SD (median; min–max)
BMI28.6; 4.1
(28.3; 20.4–44.8)
28.4; 3.9
(28.7; 19.4–36.8)
28.2; 3.7
(27.3; 23.2–41.0)
Mean; SD (median; min–max)
Occupation duration (years)13.9; 7.9
(14.0; 0.8–26.8)
11.8; 6.7
(12.0; 1.1–25.9)
10.2; 7.5
(10.0; 0.8–26.5)
Mean; SD (median; min–max)
Table 2. (A) Concentrations of selected air pollutants in study cities during the three-month period before sampling. (B) A comparison of annual mean concentrations of PM2.5, B[a]P and NO2 in all study cities in 2016–2019.
(A)
OstravaPragueCB
WinterSummerWinterSummerWinterSummer
PM2.5Mean; SD24.4; 19.111.3; 5.315.0; 13.49.1; 4.215.4; 11.99.7; 4.2
µg/m3Median
(min–max)
19.8
(2.6–101.8)
10.3
(3.6–40.5)
10.4
(1.5–57.4)
8.3
(2.0–22.2)
12.3
(1.5–47.6)
9.1
(3.3–22.2)
B[a]PMean; SD4.1; 3.30.3; 0.33.6; 3.00.1; 0.12.00; 1.010.1; 0.1
ng/m3Median
(min–max)
2.6
(0.3–13.5)
0.1
(0.0–1.3)
1.6
(0.0–16.7)
0.0
(0.0–0.5)
1.7
(0.60–5.10)
0.0
(0.0–0.9)
NO2Mean; SD19.9; 9.410.9; 3.7019.5; 8.917.9; 5.517.6; 8.29.8; 2.6
µg/m3Median
(min–max)
19.0
(4.5–51.5)
10.3
(4.4–23.2)
16.9
(4.7–47.9)
18.3
(8.3–32.9)
14.1
(4.8–44.4)
9.8
(3.4–18.3)
(B)
PM2.5 (µg/m3) 2016201720182019
OstravaMean; SD22.2; 18.321.7; 15.922.9; 18.217.4; 14.4
Prague16.5; 13.816.7; 12.2.18.0; 15.212.3; 9.9
CB18.5; 14.814.6; 10.416.0; 13.612.8; 10.4
B[a]P (ng/m3) 2016201720182019
OstravaMean; SD2.2; 0.92.5; 0.72.9; 0.92.0; 0.6
Prague *0.8; 0.30.9; 0.30.8; 0.20.7; 0.2
CB1.5; 0.51.3; 0.51.1; 0.31.2; 0.4
NO2 (µg/m3) 2016201720182019
OstravaMean; SD16.4; 15.016.2; 13.617.2; 15.415.2; 13.5
Prague #25.6; 24.031.0; 29.133.0; 31.828.6; 27.5
CB15.7; 14.215.4; 13.714.9; 13.812.9; 6.9
*# Due to incomplete data from the Prague 5 station, we used information from other stations in other districts: Prague 4 (B[a]P)—a 50 m distance from a main road; Prague 1 (NO2)—the main square in the city center.
Table 3. Description of the 10 (or 3) most DML in samples from (a) Ostrava–Prague, (b) Ostrava–CB and (c) Prague–CB.
CpG LocusChromosomeRelation to Island *Genelog2FCAdj p-Value
(a)
Ostrava–Prague
cg101233773Open Sea--−1.928.30 × 10−4
cg2485165111S ShelfCCS−1.218.53 × 10−3
cg1117363610Open SeaRP11-170M17.1−1.194.04 × 10−3
cg2721016617Open SeaRPTOR−0.902.55 × 10−3
cg0858475910IslandC10orf47−0.878.30 × 10−4
cg1208841717Open SeaRPTOR−0.867.05 × 10−4
cg0278366112S ShelfCCDC77−0.782.91 × 10−3
cg1147860722IslandGSTT10.768.62 × 10−3
cg2694680622S ShoreGSTT10.818.37 × 10−3
cg127975481Open SeaNME70.836.69 × 10−4
(b)
Ostrava–CB
cg130927662IslandBCL2L11−0.917.49 × 10−3
cg1336960719IslandSAFB2−0.635.44 × 10−3
cg0327530615Open SeaBCL2A1−0.533.63 × 10−3
cg0034444311IslandAP000797.30.537.49 × 10−3
cg253583152IslandCAPG0.573.63 × 10−3
cg148076828Island--0.577.49 × 10−3
cg177348031IslandFOXD3-AS10.627.49 × 10−3
cg2660888311IslandCALCB0.717.49 × 10−3
cg0701928510Open SeaCALML3-AS10.879.86 × 10−3
cg1884380319Open SeaTSHZ31.953.63 × 10−3
(c)
Prague–CB
cg172655158Open SeaERICH1−1.595.05 × 10−3
cg103800957Open Sea--−0.315.05 × 10−3
cg269532888S ShoreBAI10.551.48 × 10−3
Abbreviations: CCS (copper chaperone for superoxide dismutase), RP11-170M17.1 (NA), RPTOR (regulatory-associated protein of MTOR complex 1), C10orf47 (also known as PROSER2, proline- and serine-rich 2), CCDC77 (coiled-coil domain containing 77), GSTT1 (glutathione S-transferase theta 1), NME7 (NME/NM23 family member 7), BCL2L11 (BCL2-like 11), SAFB2 (scaffold attachment factor B2), BCL2A1 (bcl-2-related protein A1), AP000797.3 (NA), CAPG (capping actin protein), FOXD3-AS1 (FOXD3 antisense RNA 1), CALCB (calcitonin-related polypeptide beta), CALML3-AS1 (CALML3 antisense RNA 1), TSHZ3 (teashirt zinc finger homeobox 3), ERICH1 (glutamate-rich 1), BAI1 (adhesion G protein-coupled receptor B1); --- (out of gene).* Gene transcription is dependent on location of the CpG loci in the genome [28]. Islands are densely covered by CpG sites, mostly situated in promoters of housekeeping genes. Shores are tissue-specific regions with lower density of CpG sites, 2 kb distance from CpG islands. Shelves (2–4 kb from CpG island) and Open sea (>4 kb from CpG island) are more dynamic regions [29].
Table 4. (A) Selected DMG with high relevance to health impacts discussed in Section 3. The main importance is adopted from the Human Gene Database (genecards.org). N = number of DLM; chr = chromosome; Hypo = hypomethylated loci; Hyper = hypermethylated loci. All parameters for these DMG are shown in Table S2. (B) Selected DMG with more than 15 loci in one annotated gene.
(A)
GeneCpG ProbesAdj. p-Value (Min–Max)Importance
XRCC5
(N = 2: chr 2)
Hypo: cg23433242, cg016332325.62 × 10−3,
2.79 × 10⁻³
DNA repair–non homologous end joining (NHEJ)
NR4A2
(N = 9: chr 2)
Hyper: cg14617996, cg11209121, cg11358945, cg00194126, cg03339537, cg06101180, cg14811105, cg20570611, cg135008774.61 × 10−3

9.60 × 10⁻³
Autoimmune diseases, neurodegenerative diseases
CDK2AP1
(N = 9: chr 12)
Hyper: cg10289269, cg05760918, cg01660796, cg01247747, cg02017926, cg25326086, cg08696931, cg25630910, cg104110757.40 × 10−4

6.28 × 10⁻³
Reduction in cell proliferation, Cell cycle termination
(B)
GeneCpG ProbesAdj. p-Value (Min–Max)Importance
RPTOR
(N = 20: chr 17)
Hypo: cg12088417, cg17614805, cg27210166, cg00545580
Hyper: cg12654199, cg22386583, cg13549638, cg07856428, cg22091236, cg15230985, cg27457201, cg02675920, cg22652378, cg08129331, cg13159505, cg22255288, cg15781195, cg14343513, cg07702089, cg05098037
7.05 × 10⁻⁴

9.15 × 10⁻³
RPTOR encodes part of a signaling pathway regulating cell growth which responds to nutrient and insulin levels.
COL23A1
(N = 17: chr 5)
Hypo: cg06485308, cg02119888
Hyper: cg08862479, cg17649857, cg24705158, cg06882830, cg04686319, cg18816996, cg21871330, cg21768539, cg25153741, cg24830898, cg05206633, cg08684511, cg26994283, cg24527008, cg00561180
1.16 × 10⁻³

9.08 × 10⁻³
COL23A1 encodes a transmembrane nonfibrillar collagen. This kind of collagen has a single pass hydrophobic transmembrane domain.
KCNQ1
(N = 16: chr 11)
Hypo: cg21752270, cg00243281, cg24492694, cg06827779
Hyper: cg23762359, cg05472575, cg12141659, cg11887188, cg16465939, cg08741300, cg11700071, cg21130221, cg05438727, cg05993525, cg07618453, cg06485603
4.62 × 10⁻³

9.5 × 10⁻³
This gene encodes a voltage-gated potassium channel required for the repolarization phase of the cardiac action potential.
PTPRN2
(N = 16, chr 17)
Hypo: cg04694534, cg06679384, cg13218485, cg01726608, cg12138780, cg18395809, cg16486501, cg06649856, cg15272173, cg04799270
Hyper: cg09656639, cg26208815, cg17291423, cg23634928, cg04007350, cg02704570
2.35 × 10⁻³

7.75 × 10⁻³
Protein tyrosine phosphatase, receptor type N2 encodes a major islet autoantigen in type-1 diabetes. PTPRN2 plays an important role in the epigenetic regulation of metabolic diseases and cancers.
Abbreviations: XRCC5 (X-Ray Repair Cross-Complementing 5), NR4A2 (Nuclear Receptor Subfamily 4 Group A Member 2), CDK2AP1 (Cyclin-Dependent Kinase 2-Associated Protein 1), RPTOR (regulatory-associated protein of MTOR complex 1), COL23A1 (Collagen Type-XXIII Alpha 1 Chain), KCNQ1 (potassium voltage-gated channel subfamily Q member 1), PTPRN2 (Protein Tyrosine Phosphatase Receptor Type N2).
Publisher’s Note: MDPI stays neutral with regard to jurisdictional claims in published maps and institutional affiliations.

