Article

Caspase-1 Inhibition Impacts the Formation of Chondrogenic Nodules, and the Expression of Markers Related to Osteogenic Differentiation and Lipid Metabolism

1
Department of Physiology, University of Veterinary Sciences Brno, 612 42 Brno, Czech Republic
2
Laboratory of Odontogenesis and Osteogenesis, Institute of Animal Physiology and Genetics, Academy of Sciences, 602 00 Brno, Czech Republic
*
Author to whom correspondence should be addressed.
Int. J. Mol. Sci. 2021, 22(17), 9576; https://doi.org/10.3390/ijms22179576
Submission received: 3 June 2021 / Revised: 30 June 2021 / Accepted: 31 August 2021 / Published: 3 September 2021
(This article belongs to the Special Issue Musculoskeletal Development and Skeletal Pathophysiologies)

Abstract

:
Caspase-1, as the main pro-inflammatory cysteine protease, was investigated mostly with respect to inflammation-related processes. Interestingly, caspase-1 was identified as being involved in lipid metabolism, which is extremely important for the proper differentiation of chondrocytes. Based on a screening investigation, general caspase inhibition impacts the expression of Cd36 in chondrocytes, the fatty acid translocase with a significant impact on lipid metabolism. However, the engagement of individual caspases in the effect has not yet been identified. Therefore, the hypothesis that caspase-1 might be a candidate here appears challenging. The primary aim of this study thus was to find out whether the inhibition of caspase-1 activity would affect Cd36 expression in a chondrogenic micromass model. The expression of Pparg, a regulator Cd36, was examined as well. In the caspase-1 inhibited samples, both molecules were significantly downregulated. Notably, in the treated group, the formation of the chondrogenic nodules was apparently disrupted, and the subcellular deposition of lipids and polysaccharides showed an abnormal pattern. To further investigate this observation, the samples were subjected to an osteogenic PCR array containing selected markers related to cartilage/bone cell differentiation. Among affected molecules, Bmp7 and Gdf10 showed a significantly increased expression, while Itgam, Mmp9, Vdr, and Rankl decreased. Notably, Rankl is a key marker in bone remodeling/homeostasis and thus is a target in several treatment strategies, including a variety of fatty acids, and is balanced by its decoy receptor Opg (osteoprotegerin). To evaluate the effect of Cd36 downregulation on Rankl and Opg, Cd36 silencing was performed using micromass cultures. After Cd36 silencing, the expression of Rankl was downregulated and Opg upregulated, which was an inverse effect to caspase-1 inhibition (and Cd36 upregulation). These results demonstrate new functions of caspase-1 in chondrocyte differentiation and lipid metabolism-related pathways. The effect on the Rankl/Opg ratio, critical for bone maintenance and pathology, including osteoarthritis, is particularly important here as well.

1. Introduction

Chondrogenesis is a process of cartilage formation which plays a crucial role also in proper long bone development and elongation. Chondroblasts and chondrocytes surrounded by calcifying extracellular matrix participate at the cellular level [1]. The metabolism of lipids was shown to play an important role in the differentiation, maintenance, and health of cartilage [2]. Abnormal lipid deposition is shown to accompany several diseases including osteoarthritis (OA), the most prevalent chronic joint disorder associated with chondrocytes [3].
Cd36, the fatty acid translocase typical for hypertrophic chondrocytes, is an important molecule in lipid pathways [4]. Recently, alterations in Cd36 expression in chondrocytes were achieved after general caspase inhibition [5,6]. Caspase-1, the major pro-inflammatory cysteine protease, appears as a good candidate to mediate this effect.
Caspases, molecules traditionally associated with apoptosis and inflammation [7], are known from physiological chondrogenesis [6,8,9] as well as related pathologies [10]. The inflammatory caspase-1, originally named interleukin-1β converting enzyme, contains a caspase-recruitment domain (CARD), which enables its dimerization and thus activation [7]. Activated caspase-1 then acts as a protease, responsible for the activation of immature precursors of inflammatory cytokines, especially interleukin-1β [11]. Caspase-1 displays also other functions, including those involved in lipid and glucose metabolism [12]. The activation of caspase-1 occurs in pyroptosis, a rapid, caspase-1-dependent form of cell death. Pyroptosis is frequently induced by infected macrophages [11,13] and participates in osteoarthritis progression [10,14]. The link between lipid metabolism and caspase-1 is also supported by the fact that caspase-1-deficient mice develop obesity [15]. As such, caspase-1 is favored as a potential target molecule in clinical treatments [16].
Caspase-1 can be involved in both lipid metabolism and chondrocyte regulation, but the complexity of these processes is not yet clear. The present research was designed to contribute to a better understanding of the non-traditional engagement of caspase-1. First, the hypothesis that caspase-1 inhibition might modify Cd36 expression was tested. Then, the impact of caspase-1 inhibition on differentiation pathways of chondrocytes was identified. Finally, silencing of Cd36 siRNA was performed to investigate the effect of caspase-1 inhibition and Cd36 downregulation on the expression of Rankl and Opg as critical molecules involved in osteogenic pathways.

2. Results

2.1. Caspase-1 Is Present in Developing Growth Plate

To localize the activated caspase-1 during cartilage development, embryonic stages of mouse forelimbs E12, E15, and E18 were examined. At E12, caspase-1 was detected in the condensed mesenchyme of the future growth plate (Figure 1A). At the stage E15, caspase-1 was observed in resting (Figure 1B), proliferating (Figure 1C), and hypertrophic (Figure 1D) chondrocytes of the developing growth plate. Caspase-1 was not observed in the zone of calcifying cartilage but was activated in chondroclasts/osteoclasts penetrating the primary ossification center (Figure 1E). At the stage E18, when all zones (resting, proliferating, hypertrophic, and ossification) of the growth plate are present, caspase-1 was still activated in resting and proliferating chondrocytes (Figure 1F), but only a mild signal was observed in hypertrophic chondrocytes (Figure 1G). In the case of the ossification zone, caspase-1 was found predominantly in osteoclasts (Figure 1H).

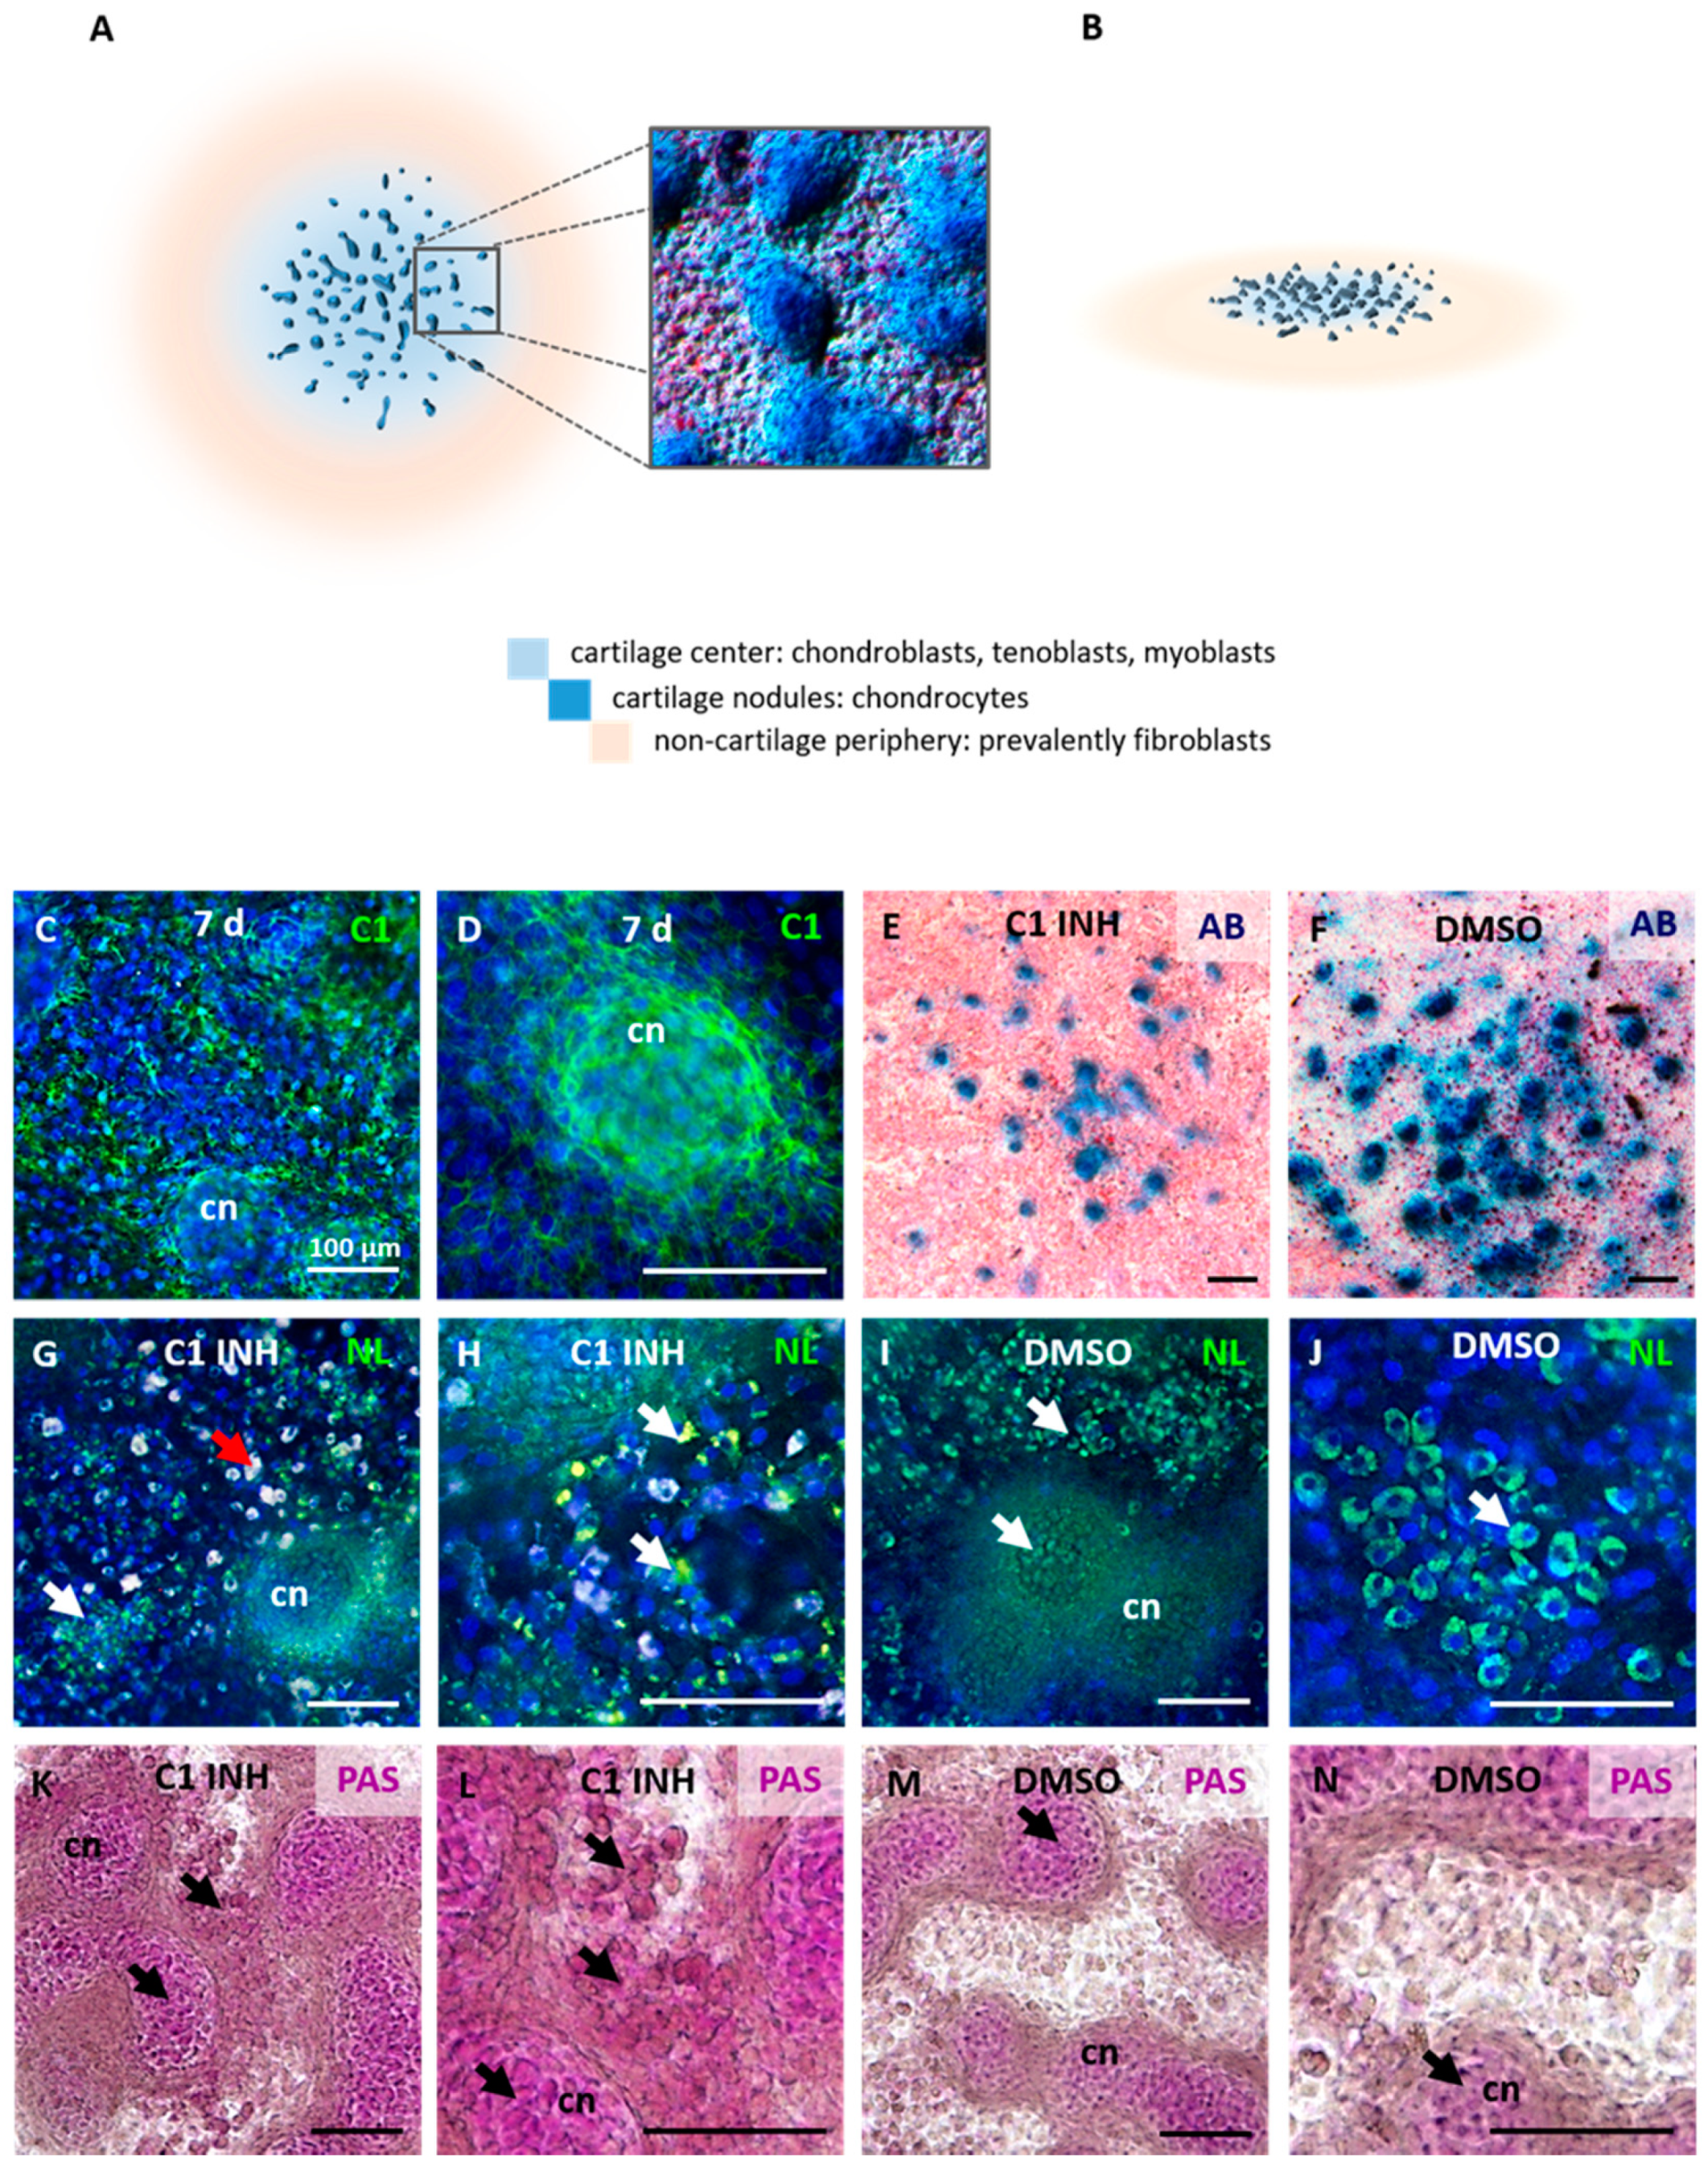
2.2. Caspase-1 Inhibition Affects the Structure of Forming Nodules in the Micromass Cultures

Micromass culture is a primary cell culture providing a 3D microenvironment for chondrogenic studies [17]. For this purpose, cells obtained from embryonic tissues (E12 front limb) were seeded as high-density spots to develop chondrogenic nodules (Figure 2A,B).
The localization of active caspase-1 by immunofluorescence demonstrated its presence in micromass cultures (Figure 2C), predominantly in the central, highly differentiated part of the nodules (Figure 2D). In experimental conditions where caspase-1 was inhibited, a lower number of nodules with reduced size was observed (Figure 2E,F). This pointed to a decreased cell differentiation within the spots.
Additionally, lipid distribution in cultures with inhibited caspase-1 was confirmed by the detection of neutral lipids (Figure 2G–J). The samples treated by caspase-1 inhibitor showed decreased lipid staining and revealed an obvious auto-fluorescent signal attributed to polysaccharide accumulation (Figure 2G). To confirm this, PAS staining was used. In both groups, PAS staining was positive in cartilaginous nodules (Figure 2K–N). Moreover, the cultures with inhibited caspase-1 displayed increased PAS staining in the regions surrounding nodules (Figure 2L).

2.3. Inhibition of Caspase-1 Affects the Expression of Cd36 and Pparg Genes Connected with Lipid Metabolism

To test whether caspase-1 can be the key cysteine protease modulating the expression of Cd36, a selective caspase-1 inhibitor was applied. For these experiments, samples from the same litter were used to take into account the effects of maternal lipid metabolism on fetal growth [18]. Expression levels of Cd36 were evaluated by qPCR along with Pparg, the master regulator of fatty acid storage and lipid/glucose metabolism. When cultured for 7 days in conditions where caspase-1 was inhibited, the expression of Cd36 increased up to 300% compared to control (Figure 3A). Similarly, the expression of Pparg increased up to 280% after caspase-1 inhibition (Figure 3B). Cd36 protein was expressed in both groups although the staining was weaker in controls (Figure 3C,D). Pparg was detected in the nuclei of cells surrounding nodules, also with a weaker signal in controls (Figure 3E,F). Notably, the localization of Pparg-positive cells overlapped with areas of lipid accumulation.

2.4. Caspase-1 Inhibition Alters the Expression of Osteogenic Genes

Along with the participation of caspase-1 in lipid metabolism, the impact of caspase-1 inhibition on osteogenic expression was investigated. A pre-designed panel of osteogenesis-related genes, including many factors essential also for chondrogenesis, was used. The chondrogenic micromasses cultured in conditions where caspase-1 was inhibited were compared to controls. The PCR array analysis revealed statistically significant changes in the expression of six genes (Figure 4). The upregulated genes were Gdf10 (Growth differentiation factor 10, fold regulation: 4.31, p = 0.019) and Bmp7 (Bone morphogenetic protein 7, fold regulation: 3.75, p = 0.029). Downregulated genes included Mmp9 (Matrix metallopeptidase 9, fold regulation: –7.5, p = 0.046), Itgam (Integrin alpha M, fold regulation: –3.62, p = 0.003), Vdr (Vitamin D receptor, fold regulation: –2.74, p = 0.031), and Tnfsf11, gene for Rankl (fold regulation: –2.24, p = 0.048).

2.5. Caspase-1 Inhibition and Cd36 Silencing Impact the Expression of Rankl and Opg in an Opposing Trend

Since Rankl was among the affected genes and the Rankl–Rank–Opg pathway is critical in cartilage and bone homeostasis, the expression of Rankl and Opg was further investigated. To specify the role of Cd36 in Rankl–Opg regulation, Cd36 RNA silencing was performed in simultaneously running cultures. After caspase-1 inhibition (causing Cd36 upregulation), Rankl expression decreased and Opg expression increased (Figure 5A,B). The expression trend at the protein level was confirmed for Rankl by immunofluorescence, showing a weak signal in caspase-1 inhibited groups (Figure 5C) while the control samples displayed positive cells (Figure 5D). Cd36 silencing decreased the expression of Cd36 to the level of 30% (p < 0.001) in treated cultures (Figure 5E). As a consequence, the expression of Pparg decreased to 60% (p = 0.02) compared to controls (Figure 5F). After Cd36 silencing (with opposite effect to caspase-1 inhibition on Cd36 expression), the expression of Rankl increased to 220% (p < 0.001) (Figure 5G), and Opg decreased to 45% (p < 0.001) (Figure 5H).

3. Discussion

Limb bud derived micromass cultures are the most common in vitro model to study chondrogenesis [17]. After one week in vitro, chondroblasts and differentiated chondrocytes were located in the central part of the micromass spot (3D nodules). The outer part of the spot as well as regions surrounding the nodules consisted of non-cartilaginous cells, primarily fibroblasts but also myoblasts and tenoblasts. Therefore, micromass cultures imitate the physiological cell interactions within tissues [19].
Cd36 is a membrane glycoprotein present on many cell types, including osteoblasts [20,21]. It is expressed also by hypertrophic chondrocytes [4]. Cd36 interferes with lipid metabolism as a multifunctional receptor for fatty acid uptake [22]. The modulation of Cd36 expression using the micromass model after general caspase inhibition has been reported earlier [5,6]. Until now, the effect of individual caspases on Cd36 expression in cartilage has not been identified. In the present investigation, caspase-1 was a hot candidate because of its engagement in lipid metabolism [12,23] and abundant caspase-1 activation, which we identified during the formation of the growth plate. Additionally, caspase-1 is associated with arthritic diseases [10,24], where both inflammation and metabolic dysbalance play a role [25]. Inflammasome, in which caspase-1 is activated, was observed in many arthritic disorders involving the production of pro-inflammatory cytokines such as Il-1β [26]. Notably, the modulation of Cd36-Pparg pathways provides attractive options for the treatment of metabolic diseases [27], where caspase-1 is also a potential target molecule [16].
The upregulation of Cd36 in samples where caspase-1 was inhibited confirmed the hypothesis that caspase-1 might be able to modulate Cd36 expression. In addition, there was a remarkable alteration in the size and number of chondrogenic nodules compared to controls. Caspase-1 inhibition also caused an abnormal accumulation of lipid droplets in the cartilage nodules and cells surrounding the nodules. The caspase-1 associated pathways in lipid metabolism include, along with interleukins, SREBS (and lipid biosynthesis), FABS (and lipid absorption and VLDL secretion), SIRT1 (and adipogenesis and insulin resistance), and others [28]. Caspase-1 regulation of glucose and lipid metabolism acts through the cleavage of glycolytic enzymes and by direct or cytokine-dependent activation of transcriptional factors [12,29].
Furthermore, the regions surrounding the nodules showed a higher incidence of PAS-positive cells indicating an increased level of polysaccharides. This might be related to the observation [12] of a low level of triacylglyceride in the circulation of caspase-1 deficient mice compared to the wild type. Analysis of Cd36 and Pparg within the micromass cultures indicated a stronger signal in chondroblasts surrounding differentiated chondrocytes in the center of the nodules. In the same region, polysaccharide droplets were detected. Taken together, our results imply that caspase-1 in chondrocytes participates in the regulation of both lipid and glucose metabolism.
To follow other functions of caspase-1 in chondrocytes, a PCR array of pre-selected markers was screened. There is not much information about the specific roles of inflammatory caspases in cell differentiation. The activation of caspase-1, so far, has been investigated in cases of myoblast and neuronal differentiation [30,31]. In caspase-1 inhibited micromass cultures, the most prominent decrease was detected in the expression of Mmp9. Although at a lower level, the same trend was observed in the expression of Vdr, which is associated with the expression of Mmps [32]. Moreover, both molecules can play a role in lipid metabolism [33,34]. Itgam, another downregulated factor after caspase-1 inhibition, participates in signaling causing reduced chondrocyte mineralization [35]. This could contribute to alterations in the phenotype of the inhibited micromasses.
Notably, all the downregulated genes contribute to the progression of osteoarthritis. Mmp9 is connected with cartilage degradation and pathologies [36,37]. Vdr polymorphisms were associated with susceptibility for primary osteoarthritis [38]. Itgam affects the severity of osteoarthritis [35]. The effect of caspase-1 inhibition on cartilage maintenance involves also the most upregulated genes, Bmp7 and Gdf10. Members of the Gdf family have been detected during cartilage formation and Gdf10 was suggested to play a role in mesenchymal condensation and chondrocyte maturation [39]. Gdf10 was also reported to attenuate the activity of Pparg [40]. Bmp7, in turn, prevents the progression of cartilage damage in a rabbit model of osteoarthritis [41]. From this point of view, caspase-1 inhibition would have a protective effect related to the progression and severity of osteoarthritis.
Caspase-1 inhibition also decreased the Rankl/Opg ratio. The Rank-Rankl-Opg is a sophisticated regulatory system for bone remodeling [42]. Osteoblastic Rankl binds to its Rank receptor expressed by osteoclastic precursors and allows for their maturation, functional differentiation, and thus bone resorption. Opg is the decoy receptor, which interferes with the Rankl–Rank interaction and favors bone apposition. Therefore, the Rankl/Opg ratio is extremely important.
Since Rankl and Opg are produced also by chondrocytes [43], these molecules are potential therapeutic targets, not only within anti-osteoporotic strategies, but also in the case of anti-osteoarthritis prediction, progression, and treatment [44,45]. In caspase-1 inhibited samples, Rankl was decreased and Opg was increased. Cd36 silencing determined that the effect could be mediated via Cd36 (upregulated in the caspase-1 treated cultures),
The present results demonstrate the activation of caspase-1 in chondrocytes in vivo as well as in in vitro systems. In the latter case, the inhibition of caspase-1 resulted in a significantly increased expression of Cd36, which, consequently, impacted the Rankl/Opg ratio in chondrogenic cultures. These findings allow for a better understanding of the protective role of caspase-1 inhibition regarding OA phenotypes [46].
The role of Cd36 in chondrocyte metabolism is not completely clear. So far, in bone, Cd36 was demonstrated as essential for proper osteoblast function since it affected the expression of some osteogenic genes such as Runx2, osterix, or osteocalcin [47]. In the cartilage, Cd36 is expressed by chondrocytes and can be associated with cartilage repair in response to inflammatory stimuli [4]. The interplay of Cd36, Pparg, and Opg can be mediated through the Erk pathway, as observed in liver cells [48] but not yet elucidated in the cartilage.
Despite the mechanism depends on the cell type, the engagement of caspase-1 in cell differentiation crystallizes. This applies to L8 cells and myeloblasts, PC12 cells and neurons, as well as adipocytes, where the differentiation process is conveyed by IL-1β signaling [28]. Recently, caspase-1 was demonstrated to promote monocyte-macrophage differentiation by repressing PPARγ [49]. This is in agreement with our observation in chondrocytes pointing to increased Pparg expression after caspase-1 inhibition. Caspase-1 regulations related to macrophages and lipid metabolism are another link between chondrocyte maintenance and disorders such as in the case of osteoarthritis [50].
Taken together, the results presented here suggest caspase-1 to be a molecule with a major impact on the regulation of cartilage development and maintenance, at least regarding inflammatory and metabolic functions. Modulations of caspase-1 activity thus open further applications including clinical trials [16].

4. Materials and Methods

4.1. Micromass Cultures

Cells for micromass cultures were obtained from mouse forelimbs at embryonic day (E) 12. Fresh post mortem limbs were removed, cut in pieces, and incubated for 1–2 h at 37 °C with Dispase (Gibco, New York, NY, USA, final activity 1 U/mL). Cells, at a concentration of 2 × 10⁷/mL, were spotted in 10 µL drops on the culture plate. The culture medium, which supports chondrogenic differentiation, was composed of DMEM (Sigma-Aldrich, Waltham, MA, USA) and Nutrient Mixture F12 (Sigma-Aldrich) in a ratio 2:3, 10% FBS (Sigma Aldrich), Penicillin/streptomycin (Sigma-Aldrich, final concentration 100 U/mL and 100 µg/mL), L-Glutamine (Sigma-Aldrich, final concentration 2 mM), β-Glycerol phosphate (Sigma-Aldrich, final concentration 10 mM), and Ascorbic acid (Sigma-Aldrich, final concentration 50 µg/mL). Cells were cultured without treatment overnight to adhere to the surface. For caspase-1 inhibition, micromasses were cultured in the presence of pharmacological inhibitor Z-WEHD-FMK (FMK002, R&D Systems, Minneapolis, MN, USA) at a concentration of 100 μM, according to the manufacturer’s recommendation and previous studies [9]. In the controls, DMSO, the inhibitor vehicle, was added. The culture medium with caspase inhibitor or DMSO was changed every second day during 6 days of culture. The experiments were performed in four biological replicates.

4.2. SiRNA Gene Silencing

Micromass cultures were prepared as described above. The next day, cells were transfected with 20 nM Stealth siRNAs set of 3 Cd36 (IDs: MSS202775, MSS202776, MSS202777 Catalog No. 1320001, Ambion, Austin, TX, USA) using Lipofectamine RNAiMAX Reagent (13778, Life Technologies, Carlsbad, CA, USA) according to the producer´s instructions. Negative Control No. 1 siRNA (Catalog No. 4390843, Ambion) was used as a control. Cells were treated for 6 days; the medium with siRNA-Lipofectamine complexes was changed every 48 h of culture.

4.3. RNA Isolation, PCR Array, Real-Time PCR

The cultured cells were harvested into 350 µL RLT lysis buffer (Qiagen, Hilden, Germany) with β-mercaptoethanol (Sigma-Aldrich). RNA was isolated by RNeasy Kit (Qiagen), mRNA was transcribed into cDNA using SuperScript VILO (Invitrogen, Waltham, MA, USA). The Osteogenesis PCR Array (PAMM-026Z, Qiagen) was used for the analysis of gene expression after caspase-1 inhibition or after Cd36 silencing in micromass cultures. The panel of housekeeping genes included: Actb, B2m, Gapdh, Gusb, and Hsp90ab1. The PCR Array format also included positive and negative controls.
Real-time PCR was performed in 10 μL of a final reaction mixture containing the one-step GB Ideal PCR Master Mix (Generi Biotech, Hradec Kralove, Czech Republic). Cd36 (Mouse Cd36, Mm00432403_m1), PPARγ (Mouse Pparg, Mm00440940_m1), Rankl (Mouse Tnfsf11, Mm00441906_m1), and Opg (Mouse Tnfrsf11b, Mm00435454_m1) expression was detected by using a TaqMan Gene Expression Assay (Thermo Fisher Scientific, Waltham, MA, USA) with normalization based on actin levels (Mouse Actb, Mm02619580_g1).

4.4. Immunofluorescence and Immunocytofluorescence

Mouse front limbs (CD1 strain) were collected as fresh post mortem samples. Stages E12, E15, and E18 were examined. Histological sections were deparaffinized in xylene and rehydrated in a gradient series of ethanol. Sections were pre-treated in citrate buffer (10 min/98 °C) for antigen retrieval and then incubated with Caspase-1 p20 (Cleaved Asp296) Antibody (PA5-99390, Thermo Fisher Scientific) overnight. The primary antibody was followed by incubation with secondary anti-rabbit antibody Alexa Fluor® 488 (Thermo Fischer Scientific, Waltham, MA, USA) for 40 min at RT. Nuclei were detected by ProLong® Gold Antifade reagent with DAPI (Thermo Fischer Scientific).
For immunocytofluorescence, micromass cultures were grown on culture glass and fixed by 4% paraformaldehyde. Primary antibodies for Caspase-1 p20 (PA5-99390, Thermo Fisher Scientific), Cd36 (PA1-16813, Thermo Fisher Scientific), Pparg (2443, Cell Signaling Technology, Danvers, MA, USA), and Rankl (PA5-110268, Thermo Fisher Scientific) were diluted in the range 1:50–1:200 and were applied overnight/4 °C. Alexa Fluor® 488 or 568 (A11034, A10037, Thermo Fischer Scientific) was diluted at 1:200 and then applied for 40 min/RT. The cytoskeleton was visualized by ActinGreenTM 488 ReadyProbesTM Reagent (Thermo Fischer Scientific), and nuclei were detected by ProLong® Gold Antifade reagent with DAPI (Thermo Fischer Scientific).

4.5. Staining of Micromass Cultures

Micromass cultures grown on glass were fixed by 4% PFA. Alcian blue and eosin staining was used for visualization of micromass structure and differentiation. Neutral lipids were detected by HCS LipidTOX™ Green Neutral Lipid Stain (H34475, Thermo Fisher Scientific) diluted 1:500 in PBS buffer and observed under a fluorescent microscope. For detection of polysaccharides, Periodic Acid-Schiff (PAS) staining was used. Fixed micromass cultures were incubated with Schiff reagent for 5 min and then counterstained by Harris hematoxylin.

4.6. Statistical Analysis

PCR Arrays data were statistically evaluated by Qiagen Gene Globe as recommended by the manufacturer (available online https://geneglobe.qiagen.com/us/analyze, accessed on 22 January 2021). Statistical significance was determined as p < 0.05, and the threshold of fold regulation was ±2. Three biological replicates were evaluated in each group. Real-time PCR expression levels were calculated using the ∆∆CT method and results were analyzed using a two-tailed t-test.

Author Contributions

E.M. designed the study, B.V. and A.R. performed experiments, H.L. and E.S. analyzed data, E.M. and B.V. wrote the manuscript, H.L. and E.S. contributed to the conception of the study. All authors have read and agreed to the published version of the manuscript.

Funding

The research was supported by the Czech Science Foundation, project GACR 19-12023S.

Institutional Review Board Statement

The experiments are a part of the approved project GACR 19-12023S.

Data Availability Statement

Not applicable.

Conflicts of Interest

The authors declare no conflict of interest.

References

  1. Berendsen, A.D.; Olsen, B.R. Bone development. Bone 2015, 80, 14–18. [Google Scholar] [CrossRef] [PubMed] [Green Version]
  2. Yang, Y.; Wei, J.; Li, J.; Cui, Y.; Zhou, X.; Xie, J. Lipid metabolism in cartilage and its diseases: A concise review of the research progress. Acta Biochim. Biophys. Sin. 2021, 53, 517–527. [Google Scholar] [CrossRef]
  3. Villalvilla, A.; Gómez, R.; Largo, R.; Herrero-Beaumont, G. Lipid transport and metabolism in healthy and osteoarthritic cartilage. Int. J. Mol. Sci. 2013, 14, 20793–20808. [Google Scholar] [CrossRef] [PubMed] [Green Version]
  4. Cecil, D.L.; Appleton, C.T.G.; Polewski, M.D.; Mort, J.S.; Schmidt, A.M.; Bendele, A.; Beier, F.; Terkeltaub, R. The pattern recognition receptor CD36 is a chondrocyte hypertrophy marker associated with suppression of catabolic responses and promotion of repair responses to inflammatory stimuli. J. Immunol. 2009, 182, 5024–5031. [Google Scholar] [CrossRef]
  5. Adamova, E.; Janeckova, E.; Kleparnik, K.; Matalova, E. Caspases and osteogenic markers—in vitro screening of inhibition impact. In Vitro Cell. Dev. Biol.-Anim. 2016, 52, 144–148. [Google Scholar] [CrossRef] [PubMed]
  6. Janečková, E.; Bíliková, P.; Matalová, E. Osteogenic Potential of Caspases Related to Endochondral Ossification. J. Histochem. Cytochem. 2018, 66, 47–58. [Google Scholar] [CrossRef]
  7. Shalini, S.; Dorstyn, L.; Dawar, S.; Kumar, S. Old, new and emerging functions of caspases. Cell Death Differ. 2015, 22, 526–539. [Google Scholar] [CrossRef] [PubMed] [Green Version]
  8. Huser, C.A.M.; Peacock, M.; Davies, M.E. Inhibition of caspase-9 reduces chondrocyte apoptosis and proteoglycan loss following mechanical trauma. Osteoarthr. Cartil. 2006, 14, 1002–1010. [Google Scholar] [CrossRef] [Green Version]
  9. Vesela, B.; Svandova, E.; Ramesova, A.; Kratochvilova, A.; Tucker, A.S.; Matalova, E. Caspase Inhibition Affects the Expression of Autophagy-Related Molecules in Chondrocytes. Cartilage 2020, 1947603520938444. [Google Scholar] [CrossRef]
  10. An, S.; Hu, H.; Li, Y.; Hu, Y. Pyroptosis Plays a Role in Osteoarthritis. Aging Dis. 2020, 11, 1146–1157. [Google Scholar] [CrossRef]
  11. Denes, A.; Lopez-Castejon, G.; Brough, D. Caspase-1: Is IL-1 just the tip of the ICEberg? Cell Death Dis. 2012, 3, e338. [Google Scholar] [CrossRef] [Green Version]
  12. Kotas, M.E.; Jurczak, M.J.; Annicelli, C.; Gillum, M.P.; Cline, G.W.; Shulman, G.I.; Medzhitov, R. Role of caspase-1 in regulation of triglyceride metabolism. Proc. Natl. Acad. Sci. USA 2013, 110, 4810–4815. [Google Scholar] [CrossRef] [Green Version]
  13. Fernandes-Alnemri, T.; Wu, J.; Yu, J.-W.; Datta, P.; Miller, B.; Jankowski, W.; Rosenberg, S.; Zhang, J.; Alnemri, E.S. The pyroptosome: A supramolecular assembly of ASC dimers mediating inflammatory cell death via caspase-1 activation. Cell Death Differ. 2007, 14, 1590–1604. [Google Scholar] [CrossRef] [PubMed]
  14. Zhang, Y.; Zheng, Y.; Li, H. NLRP3 inflammasome plays an important role in the pathogenesis of collagen-induced arthritis. Mediat. Inflamm. 2016, 2016, 9656270. [Google Scholar] [CrossRef] [PubMed] [Green Version]
  15. Wang, H.; Capell, W.; Yoon, J.H.; Faubel, S.; Eckel, R.H. Obesity development in caspase-1-deficient mice. Int. J. Obes. 2014, 38, 152–155. [Google Scholar] [CrossRef] [PubMed]
  16. Qian, J.; Fu, P.; Li, S.; Li, X.; Chen, Y.; Lin, Z. miR-107 affects cartilage matrix degradation in the pathogenesis of knee osteoarthritis by regulating caspase-1. J. Orthop. Surg. Res. 2021, 16, 40. [Google Scholar] [CrossRef] [PubMed]
  17. Mello, M.A.; Tuan, R.S. High density micromass cultures of embryonic limb bud mesenchymal cells: An in vitro model of endochondral skeletal development. In Vitro Cell. Dev. Biol.-Anim. 1999, 35, 262–269. [Google Scholar] [CrossRef] [PubMed]
  18. Herrera, E.; Ortega-Senovilla, H. Lipid Metabolism During Pregnancy and its Implications for Fetal Growth. Curr. Pharm. Biotechnol. 2014, 15, 24–31. [Google Scholar] [CrossRef]
  19. Butterfield, N.C.; Qian, C.; Logan, M.P.O. Pitx1 determines characteristic hindlimb morphologies in cartilage micromass culture. PLoS ONE 2017, 12, e0180453. [Google Scholar] [CrossRef] [Green Version]
  20. Silverstein, R.L.; Febbraio, M. CD36, a scavenger receptor involved in immunity, metabolism, angiogenesis, and behavior. Sci. Signal. 2009, 2, re3. [Google Scholar] [CrossRef] [PubMed] [Green Version]
  21. Brodeur, M.R.; Brissette, L.; Falstrault, L.; Luangrath, V.; Moreau, R. Scavenger receptor of class B expressed by osteoblastic cells are implicated in the uptake of cholesteryl ester and estradiol from LDL and HDL3. J. Bone Miner. Res. Off. J. Am. Soc. Bone Miner. Res. 2008, 23, 326–337. [Google Scholar] [CrossRef]
  22. Pepino, M.Y.; Kuda, O.; Samovski, D.; Abumrad, N.A. Structure-function of CD36 and importance of fatty acid signal transduction in fat metabolism. Annu. Rev. Nutr. 2014, 34, 281–303. [Google Scholar] [CrossRef] [PubMed] [Green Version]
  23. Mahib, M.R.; Hosojima, S.; Kushiyama, H.; Kinoshita, T.; Shiroishi, T.; Suda, T.; Tsuchiya, K. Caspase-7 mediates caspase-1-induced apoptosis independently of Bid. Microbiol. Immunol. 2020, 64, 143–152. [Google Scholar] [CrossRef] [PubMed]
  24. Joosten, L.A.B.; Netea, M.G.; Fantuzzi, G.; Koenders, M.I.; Helsen, M.M.A.; Sparrer, H.; Pham, C.T.; van der Meer, J.W.M.; Dinarello, C.A.; van den Berg, W.B. Inflammatory arthritis in caspase 1 gene-deficient mice: Contribution of proteinase 3 to caspase 1-independent production of bioactive interleukin-1beta. Arthritis Rheum. 2009, 60, 3651–3662. [Google Scholar] [CrossRef] [Green Version]
  25. Farnaghi, S.; Crawford, R.; Xiao, Y.; Prasadam, I. Cholesterol metabolism in pathogenesis of osteoarthritis disease. Int. J. Rheum. Dis. 2017, 20, 131–140. [Google Scholar] [CrossRef] [Green Version]
  26. McAllister, M.J.; Chemaly, M.; Eakin, A.J.; Gibson, D.S.; McGilligan, V.E. NLRP3 as a potentially novel biomarker for the management of osteoarthritis. Osteoarthr. Cartil. 2018, 26, 612–619. [Google Scholar] [CrossRef]
  27. Maréchal, L.; Laviolette, M.; Rodrigue-Way, A.; Sow, B.; Brochu, M.; Caron, V.; Tremblay, A. The CD36-PPARγ Pathway in Metabolic Disorders. Int. J. Mol. Sci. 2018, 19, 1529. [Google Scholar] [CrossRef] [PubMed] [Green Version]
  28. Molla, M.D.; Ayelign, B.; Dessie, G.; Geto, Z.; Admasu, T.D. Caspase-1 as a regulatory molecule of lipid metabolism. Lipids Health Dis. 2020, 19, 34. [Google Scholar] [CrossRef] [Green Version]
  29. Shao, W.; Yeretssian, G.; Doiron, K.; Hussain, S.N.; Saleh, M. The caspase-1 digestome identifies the glycolysis pathway as a target during infection and septic shock. J. Biol. Chem. 2007, 282, 36321–36329. [Google Scholar] [CrossRef] [Green Version]
  30. Vaisid, T.; Kosower, N.S.; Barnoy, S. Caspase-1 activity is required for neuronal differentiation of PC12 cells: Cross-talk between the caspase and calpain systems. Biochim. Biophys. Acta—Mol. Cell Res. 2005, 1743, 223–230. [Google Scholar] [CrossRef] [Green Version]
  31. Barnoy, S.; Kosower, N.S. Caspase-1-induced calpastatin degradation in myoblast differentiation and fusion: Cross-talk between the caspase and calpain systems. FEBS Lett. 2003, 546, 213–217. [Google Scholar] [CrossRef] [Green Version]
  32. Tetlow, L.C.; Woolley, D.E. Expression of vitamin D receptors and matrix metalloproteinases in osteoarthritic cartilage and human articular chondrocytes in vitro. Osteoarthr. Cartil. 2001, 9, 423–431. [Google Scholar] [CrossRef] [Green Version]
  33. Hernandez-Anzaldo, S.; Brglez, V.; Hemmeryckx, B.; Leung, D.; Filep, J.G.; Vance, J.E.; Vance, D.E.; Kassiri, Z.; Lijnen, R.H.; Lambeau, G.; et al. Novel Role for Matrix Metalloproteinase 9 in Modulation of Cholesterol Metabolism. J. Am. Heart Assoc. 2016, 5, e004228. [Google Scholar] [CrossRef] [Green Version]
  34. Silvagno, F.; Pescarmona, G. Spotlight on vitamin D receptor, lipid metabolism and mitochondria: Some preliminary emerging issues. Mol. Cell. Endocrinol. 2017, 450, 24–31. [Google Scholar] [CrossRef] [PubMed]
  35. Ehirchiou, D.; Bernabei, I.; Chobaz, V.; Castelblanco, M.; Hügle, T.; So, A.; Zhang, L.; Busso, N.; Nasi, S. CD11b Signaling Prevents Chondrocyte Mineralization and Attenuates the Severity of Osteoarthritis. Front. Cell Dev. Biol. 2020, 8, 1757. [Google Scholar] [CrossRef] [PubMed]
  36. Chubinskaya, S.; Kuettner, K.E.; Cole, A.A. Expression of matrix metalloproteinases in normal and damaged articular cartilage from human knee and ankle joints. Lab. Investig. 1999, 79, 1669–1677. [Google Scholar] [PubMed]
  37. Malemud, C.J.; Meszaros, E.C.; Wylie, M.A.; Dahoud, W.; Skomorovska-Prokvolit, Y.; Mesiano, S. Matrix Metalloproteinase-9 Production by Immortalized Human Chondrocyte Lines. J. Clin. Cell. Immunol. 2016, 7, 422. [Google Scholar] [CrossRef] [Green Version]
  38. González-Huerta, N.C.; Borgonio-Cuadra, V.M.; Morales-Hernández, E.; Duarte-Salazar, C.; Miranda-Duarte, A. Vitamin D receptor gene polymorphisms and susceptibility for primary osteoarthritis of the knee in a Latin American population. Adv. Rheumatol. 2018, 58, 6. [Google Scholar] [CrossRef]
  39. Cameron, T.L.; Belluoccio, D.; Farlie, P.G.; Brachvogel, B.; Bateman, J.F. Global comparative transcriptome analysis of cartilage formation in vivo. BMC Dev. Biol. 2009, 9, 20. [Google Scholar] [CrossRef] [PubMed] [Green Version]
  40. Platko, K.; Lebeau, P.F.; Byun, J.H.; Poon, S.V.; Day, E.A.; MacDonald, M.E.; Holzapfel, N.; Mejia-Benitez, A.; Maclean, K.N.; Krepinsky, J.C.; et al. GDF10 blocks hepatic PPARγ activation to protect against diet-induced liver injury. Mol. Metab. 2019, 27, 62–74. [Google Scholar] [CrossRef] [PubMed]
  41. Hayashi, M.; Muneta, T.; Ju, Y.-J.; Mochizuki, T.; Sekiya, I. Weekly intra-articular injections of bone morphogenetic protein-7 inhibits osteoarthritis progression. Arthritis Res. Ther. 2008, 10, R118. [Google Scholar] [CrossRef] [PubMed] [Green Version]
  42. Boyce, B.F.; Xing, L. Biology of RANK, RANKL, and osteoprotegerin. Arthritis Res. Ther. 2007, 9 (Suppl. S1), 1–7. [Google Scholar] [CrossRef] [PubMed] [Green Version]
  43. Kwan Tat, S.; Amiable, N.; Pelletier, J.-P.; Boileau, C.; Lajeunesse, D.; Duval, N.; Martel-Pelletier, J. Modulation of OPG, RANK and RANKL by human chondrocytes and their implication during osteoarthritis. Rheumatology 2009, 48, 1482–1490. [Google Scholar] [CrossRef] [Green Version]
  44. Upton, A.R.; Holding, C.A.; Dharmapatni, A.A.S.S.K.; Haynes, D.R. The expression of RANKL and OPG in the various grades of osteoarthritic cartilage. Rheumatol. Int. 2012, 32, 535–540. [Google Scholar] [CrossRef] [PubMed]
  45. Papadaki, M.; Rinotas, V.; Violitzi, F.; Thireou, T.; Panayotou, G.; Samiotaki, M.; Douni, E. New Insights for RANKL as a Proinflammatory Modulator in Modeled Inflammatory Arthritis. Front. Immunol. 2019, 10, 97. [Google Scholar] [CrossRef] [PubMed] [Green Version]
  46. D’Lima, D.; Hermida, J.; Hashimoto, S.; Colwell, C.; Lotz, M. Caspase inhibitors reduce severity of cartilage lesions in experimental osteoarthritis. Arthritis Rheum. 2006, 54, 1814–1821. [Google Scholar] [CrossRef]
  47. Kevorkova, O.; Martineau, C.; Martin-Falstrault, L.; Sanchez-Dardon, J.; Brissette, L.; Moreau, R. Low-Bone-Mass Phenotype of Deficient Mice for the Cluster of Differentiation 36 (CD36). PLoS ONE 2013, 8, e77701. [Google Scholar] [CrossRef] [PubMed] [Green Version]
  48. Zhang, C.; Luo, X.; Chen, J.; Zhou, B.; Yang, M.; Liu, R.; Liu, D.; Gu, H.F.; Zhu, Z.; Zheng, H.; et al. Osteoprotegerin Promotes Liver Steatosis by Targeting the ERK-PPAR-γ-CD36 Pathway. Diabetes 2019, 68, 1902–1914. [Google Scholar] [CrossRef]
  49. Niu, Z.; Tang, J.; Zhang, W.; Chen, Y.; Huang, Y.; Chen, B.; Li, J.; Shen, P. Caspase-1 promotes monocyte-macrophage differentiation by repressing PPARγ. FEBS J. 2017, 284, 568–585. [Google Scholar] [CrossRef]
  50. Chen, Y.; Jiang, W.; Yong, H.; He, M.; Yang, Y.; Deng, Z.; Li, Y. Macrophages in osteoarthritis: Pathophysiology and therapeutics. Am. J. Transl. Res. 2020, 12, 261–268. [Google Scholar]
Figure 1. A temporospatial pattern of caspase-1 activation in the developing growth plate of a mouse forelimb. Detection of caspase-1 in condensed mesenchymal cells at the stage E12 (A). Detection of caspase-1 in resting (B), proliferating (C), and hypertrophic (D) zones of the growth plate at the stage E15. Detail of activation of caspase-1 in chondroclasts/osteoclasts penetrating to the primary ossification center (E) at the stage E15. Detection of caspase-1 in resting and proliferating (F), hypertrophic, and ossification (G) zones of the growth plate at the stage E18. Caspase-1 activation in osteoclasts of ossification zone at the stage E18 (H). The positive fluorescent signal is green, nuclei are counterstained by DAPI and are blue. The white arrows point to positive hypertrophic chondrocytes. The red arrows point to positive chondroclasts/osteoclasts. mc (mesenchymal condensation), rz (resting zone of the growth plate), pz (proliferating zone), hz (hypertrophic zone), cc (calcifying cartilage), oz (ossification zone). Scale bar = 100 μm.
Ijms 22 09576 g001
Figure 2. Characterization of micromass cultures treated by caspase-1 inhibitor. Scheme of micromass cultures (A,B), showing the arrangement of chondrogenic and non-chondrogenic cells in the culture. Activation of caspase-1 in the micromass cultures (C), predominantly in the highly differentiated central part containing chondrogenic nodules (D). Alcian blue (cartilage extracellular matrix)/eosin staining of caspase-1 inhibited (E) and control (F) micromass cultures. Lipid accumulation in cultures with inhibited caspase-1 (G,H) and control cultures (I,J). PAS staining was performed on caspase-1 treated (K,L) and control samples (M,N). The white arrows point to lipid accumulation, the red arrow to polysaccharide accumulation, and the black arrows to positive PAS staining. cn (cartilage nodule), AB (alcian blue), NL (neutral lipid stain), PAS (Periodic acid–Schiff). Scale bar = 100 μm.
Ijms 22 09576 g002
Figure 3. RNA expression of Cd36 and Pparg and respective protein detection after caspase-1 inhibition in micromass cultures. Expression of Cd36 (A) and Pparg (B) in micromass cultures after 6 days of cultivation with caspase-1 inhibitor. Immunofluorescent detection of Cd36 and Pparg in micromass cultures after 6 days of cultivation with caspase-1 inhibitor (C,E) and in control (DMSO) group (D,F). The positive fluorescent signal is green, nuclei counterstained by DAPI are blue. cn (cartilage nodule). Scale bar = 100 μm.
Ijms 22 09576 g003
Figure 4. PCR array analysis of osteogenic gene expression in micromass cultures after 6 days of caspase-1 inhibition compared to control. Only osteogenic genes with statistically significant (p ≤ 0.05) changes in gene expression are showed.
Ijms 22 09576 g004
Figure 5. Expression of Rankl and Opg in caspase-1 inhibited or Cd36 silenced micromass cultures. Gene expression of Rankl (A) and Opg (B) after 6 days of caspase-1 inhibition. Immunofluorescent detection of Rankl (green) in micromass cultures after 6 days of cultivation with caspase-1 inhibitor (C) and in control micromasses (D). Expression of Cd36 (E), Pparg (F), Rankl (G), and Opg (H) after 6 days of Cd36 silencing in micromass cultures. Scale bar = 100 μm.
Ijms 22 09576 g005
Publisher’s Note: MDPI stays neutral with regard to jurisdictional claims in published maps and institutional affiliations.

