
Abstract
The separator is a critical component for the performance of alkaline water electrolysis as it ensures the ionic contact between the electrodes and prevents the product gases from mixing. While the ionic conductivity of the separator affects the cell voltage, the permeability of the dissolved product gases influences the product gas impurity. Currently, diaphragms are used as separators, the pore system of which is filled with the electrolyte solution to enable the exchange of ions. The breakthrough of the gas phase can be prevented up to a specific differential pressure. A drawback of diaphragms is the requirement of a highly concentrated electrolyte solution to maintain a high ionic conductivity. The usage of anion-exchange membranes could solve this problem. However, the long-term stability of such materials remains unproven. This study compares two pre-commercial diaphragms, an anion-exchange membrane, and an ion-solvating membrane with the state-of-the-art diaphragm ZirfonTM Perl UTP 500. Besides physical characterization, the material samples were evaluated electrochemically to determine the ohmic resistance and the product gas impurities. The results show that the thinner diaphragm outperforms the reference material and that polymer membranes can compete with the performance of the reference material.
Export citation and abstract BibTeX RIS

This is an open access article distributed under the terms of the Creative Commons Attribution 4.0 License (CC BY, http://creativecommons.org/licenses/by/4.0/), which permits unrestricted reuse of the work in any medium, provided the original work is properly cited.
Alkaline water electrolysis (AEL) is a long known technology for hydrogen production through water splitting into hydrogen and oxygen using electrical energy. In the last decades, research has become more focused on proton-exchange membrane electrolysis (PEMEL), as higher current densities are achievable. However, PEMEL electrodes require precious metals like platinum and iridium, while steel and nickel are favored materials for AEL. 1 Hence, the research for the enhancement of AEL has intensified in the last years. With a higher share of renewable energy in the power grid, AEL may be essential for load-balancing and large-scale hydrogen production. 1 However, the large-scale application demands low cost and high effectiveness. Therefore, every component of an AEL system needs to be optimized. While many studies focused on favorable electrocatalysts for lower overvoltages at the electrodes, 2–9 the interest in the development and optimization of other cell components, especially separators, has accelerated majorly in the last few years. 10–18
AEL uses an aqueous potassium hydroxide solution with approximately 30 wt.% KOH, as the electrolyte conductivity shows an optimum at this concentration at the typical operating temperatures between 50 and 80 °C. A separator is placed between the electrodes to prevent the direct mixing of the product gases inside the electrolysis cell. Asbestos was used as a diaphragm until this material was banned. In 1993 Germany restricted the usage of asbestos due to health concerns, and in 2005 asbestos was forbidden in all European countries. 19,20 Additionally, asbestos suffers from corrosion in highly alkaline solutions at elevated temperatures. 21 As a consequence, the development of new porous separators was needed. Since 1970 new materials have been evaluated to replace asbestos. 10,11,21 Promising results were achieved with materials based on polysulfone and polyphenylene sulfide. 10 However, those materials are only slightly hydrophilic, and therefore the wettability of the pore system with the electrolyte solution is low. Thus, other hydrophilic compounds like ceramics or other polymers are added to enhance the overall wettability. 10 Such composite materials combine the chemical and mechanical stability of the base materials with the beneficial properties of the functionalized materials. The most commonly known porous separator uses zirconium dioxide (ZrO2) on a polymeric basis and is marketed under the name ZirfonTM (Agfa-Gevaert N.V.). Currently, ZirfonTM Perl UTP 500 is one of the most used separators for AEL. While this material is known to provide low gas contamination and high ionic conductivity, the overall performance is strongly dependent on the detailed geometrical structure and the chemical composition. 22,23 Thus, further optimization of such porous separators is possible. Additionally, the conventional manufacturing process of separators requires specific solvents, which may be replaced by more environment-friendly alternatives. 24 Besides AEL, the separator ZirfonTM Perl UTP 500 is also used for Ni-H2 batteries, wastewater treatment, and further technologies. 11,25–29
When comparing AEL with PEMEL, the most obvious difference between the technologies is the requirement of liquid electrolyte management for AEL, while PEMEL can use deionized water for operation. Hence, many researchers try to eliminate the need for a highly concentrated electrolyte while maintaining the usage of non-precious metals as electrode materials. 30 This can be realized by the development of a suitable anion-exchange membrane (AEM), with high ionic conductivity at dilute electrolyte or even pure water. Furthermore, the membrane must provide a high crossover barrier despite a low thickness. For example, membranes carrying ionizable functional groups are designed for the operation with diluted electrolyte solutions (e.g., 1 to 10 wt.% KOH) and theoretically also for the operation with demineralized water. Mostly, anion-selective membranes for AEL contain quaternary ammonium (e.g., trimethylammonium) as the functional group, which is introduced into different polymers. 31–35 Another example of this membrane class is a membrane of a block copolymer backbone with attached 1,4-diazabicyclo[2.2.2]octane functional groups. 36 However, the ionic conductivity of this membrane type is decreased at temperatures above 50 °C. 36
AEM development is an ongoing research field, and no material developed to date clearly satisfies all requirements in terms of performance and stability. Another branch of membrane development efforts is working toward ion-solvating membranes. 12,37 Ion-solvating membranes do not provide intrinsic ionic conductivity but promote the exchange of electrolyte to facilitate ion transport within the membrane. While that will not enable the use of pure water, it could enhance the separator performance and reduce the concentration of the supporting electrolyte. A range of ion-solvating membranes based on polybenzimidazole (PBI) have already been investigated for AEL achieving comparable performance to ZirfonTM Perl UTP 500. 38,39 For example, the ionic conductivity of m-PBI is optimal at an electrolyte concentration from 20 to 25 wt.% KOH, which is already a significant reduction compared to the high electrolyte concentration, which is required when porous separators are used. 40 However, the long-term stability of m-PBI under industrial relevant process conditions is limited. 34,35,38,39 Therefore, enhanced membranes were developed, which could withstand harsher conditions. 41 Blend membranes of polysulfone with polyvinylpyrrolidone (PSU-PVP) are a new promising candidate for the implementation in AEL. 42
This study compares two pre-commercial ZirfonTM diaphragms and two membranes, the ion-exchange membrane PSEBS-CM-DBC, and the ion-solvating membrane PSU-PVP, with the state-of-the-art material ZirfonTM Perl UTP 500. In order to provide a broad overview, a physical characterization and an electrochemical characterization were performed, including the determination of the gas impurity under typical process conditions in a commercial alkaline water electrolyzer test station.
Materials and Methods
Materials
An overview of the material samples is given in Table I. The identifier Zirfon Ref represents the reference material ZirfonTM Perl UTP 500. Zirfon Eco and Zirfon Thin are pre-commercial Zirfon materials provided by Agfa. While Zirfon Eco was produced using a more environmentally compatible solvent compared to Zirfon Ref, the material properties were designed to be close to the reference material. Zirfon Thin was manufactured similar to Zirfon Eco, but with reduced thickness.
Table I. Overview of the material samples.
| Sample | Material |
|---|---|
| Zirfon Ref | ZirfonTM Perl UTP 500 |
| Zirfon Eco | ZirfonTM pre-commercial |
| Zirfon Thin | ZirfonTM pre-commercial |
| PSEBS-CM-DBC | Chloromethylated block copolymer of styrene-ethylene-butylene styrene; 1,4-Diazabicyclo[2.2.2]octane functional groups 36,43 |
| PSU-PVP | Polysulfone and polyvinylpyrrolidone blend membrane 42 |
ZirfonTM Perl UTP 500 is a polyphenylene sulfide fabric symmetrically coated with a polymer and zirconium dioxide (ZrO2) produced in a phase-inversion casting process. In a first step, a dispersion of zirconium dioxide and a polymer (e.g., polysulfone) in N-Methyl-2-pyrrolidone is coated onto the supporting material. Subsequently, the film is placed in a non-solvent bath to extract the solvent. 22,44,45
The PSEBS-CM-DBC membrane bases on a chloromethylated block copolymer of styrene-ethylene-butylene styrene (12 mol% styrene, 67 mol% ethylene and 21 mol% butylene structural units) with attached 1,4-Diazabicyclo[2.2.2]octane (DABCO) functional groups. The membrane is cast from 5 % PSEBS-CM solution in chloroform. In the final step, DABCO functional groups were introduced by PSEBS-CM immersion in DABCO 10 % solution in ethanol for seven days at 24 °C. Thus, the chloromethyl groups were replaced by the quaternary ammonium groups. Additional details of the PSEBS-CM-DBC membrane can be found in the literature. 36,43
The PSU-PVP membrane was prepared as reported elsewhere, 42 by co-casting polysulfone (PSU, Udel P3500-NT-LCD, Solvay) and polyvinylpyrrolidone (PVP, K15, Aldrich) from N,N-Dimethylacetamide (25 wt.% PSU, 75 wt.% PVP) on glass trays with an area of approximately 600 cm2. The membranes were delaminated from the glass substrate in water, further treated in water at 60 °C for 2 h, and kept fully hydrated until use.
Prior to use, the PSEBS-CM-DBC membranes were activated by the following steps: 36
- 24 h wash in demineralized water
- 2 h wash in NaOH solution (0.1 mol L−1)
- overnight storage in HCl solution (0.1 mol L−1)
- 4 h wash in NaOH solution (0.1 mol L−1)
- 24 h wash in demineralized water
The PSU-PVP membranes were immersed in an aqueous potassium hydroxide solution overnight before usage.
Physical characterization
The thickness of the materials was determined by measuring at eight different locations of the material with a thickness gauge (FD 50, Käfer GmbH) with an accuracy of 1 μm. As the other physical characterization methods require dry samples, the membranes were dried at 50 °C for approximately 60 min. In order to determine the density of the materials by pycnometry, a Pycnomatic ATC (Thermo Fisher Scientific) was used with Helium (4.6, Linde). For the diaphragms, a sample mass of 5 g was used. Due to the limited material availability of the membranes, the sample mass was adjusted to a minimum of 1 g for these samples. For obtaining accurate results, 10 measurements were carried out with a minimum of five accurate measurements within the standard deviation of 0.5 %. The given values are the arithmetic average of all valid measurements. The bubble point was determined by capillary flow porometry using a Porometer 3G (Quantachrome). A wetting fluid (Porofil, Quantachrome) was applied to a circular sample with a diameter of 17 mm. In this case, the bubble point is defined as the pressure at which a nitrogen flow of 0.1 L min−1 was detected at the instrument outlet. During the measurement, the nitrogen pressure was increased gradually from 1.28 to 6.38 bar. Therefore, the distribution of flow-through pores with a diameter between 100 and 500 nm could also be determined by this method. Mercury intrusion porosimetry was used to determine the pore size distribution in a broad range (from 3.5 nm to 100 μm). For this purpose, a Pascal 140 (0 to 4 bar) and a Pascal 440 (4 to 4000 bar) (Thermo Fisher Scientific) were used with a sample mass of 0.5 g. As the structure of the pores is unknown, a cylindrical pore shape was assumed for the extraction of the results. With the same devices, the pore size distribution and the porosity could also be determined.
Electrochemical characterization
The electrochemical characterization included the determination of the ohmic cell resistance by electrochemical impedance spectroscopy (EIS) and the evaluation of the product gas impurity at different operating conditions. After completing the electrochemical characterization, the impact of the experiments on the material stability was examined.
Electrolyzer test station
For the electrochemical characterization, a commercial electrolyzer test station E40 (Greenlight Innovation) was used. The simplified flow diagram is provided in Fig. 1. The power supply was a Sorensen XG 12-140 (Ametek) with an accuracy of ±0.2 % of the output current. The electrolyte was pumped by two Scherzinger pumps (3030-110, max. 2 L min−1) through the electrolysis cell, while the inlet temperatures (Alltemp Sensors, Thermocouple Type T, ±1 °C) and the inlet pressures (Gems Sensors & Controls, 3500 Series, ±0.1 bar) were controlled. The liquid volume flow rates were controlled by electromagnetic flow sensors (Krohne, Optiflux 4000), with a maximum deviation of 0.3 % of the sensor reading. The liquid electrolyte arrived together with the product gas bubbles in adjacent gas separators. The remaining water content was removed from the product gas stream by flow-through heat exchangers with a coolant temperature of approximately 15 °C. The gas quality of hydrogen and oxygen was analyzed with inline sensors and an online gas chromatograph (GC). The electrolyzer test station was designed to be operated with an almost equal operating pressure on the anodic and cathodic side. For this purpose, the anodic pressure level was used as the set point for the cathodic pressure.
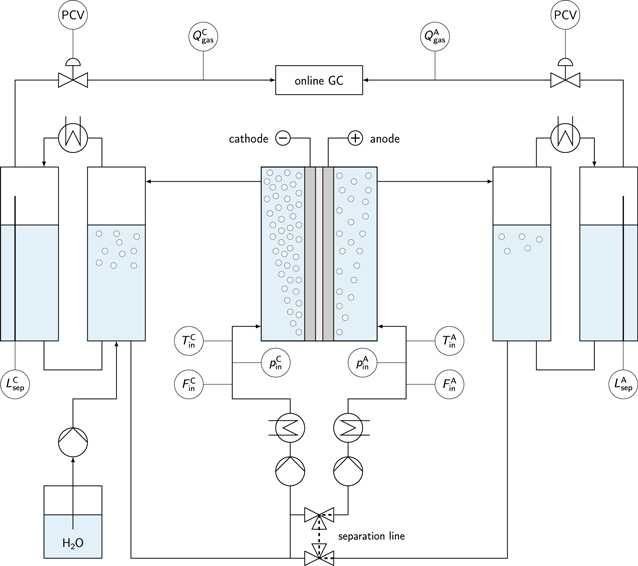
Figure 1. Flow diagram of the electrolyzer system. The electrolyte was pumped through the electrolysis cell, while the electrolyte volume flow rates ( and
and  ), the inlet pressures (
 and
and  ), the inlet temperatures (
 and
and  ), and the vessel levels (
 and
and  ) were controlled. The electrolyzer test station was able to be operated with split (separation line) or mixed electrolyte cycles by switching the two 3-way valves. Pressure control valves (PCV) were utilized to maintain a defined system pressure. Inline gas sensors (
 and
and  ) and an online GC were used to analyze the product gas contamination.
Download figure:
Standard image High-resolution imageThe gas bubble-free electrolyte was pumped back from the gas separator to the electrolysis cell inlet. The electrolyzer test station was able to operate in two different modes. In separated mode, the two 3-way valves separated both electrolyte cycles. In mixed mode, both electrolyte cycles were mixed prior to the electrolysis cell inlet. The liquid levels in the gas separators were controlled by capacitive rod probes (Vegacal 53, Vega). The consumed water was filled back by a high-precision piston pump (Scientific Systems, Inc., MX Class). As the low-pressure range of the electrolyzer test station was limited, a system pressure of 5 bar was used through all electrochemical characterization steps. Furthermore, a liquid electrolyte flow rate of 350 mL min−1 was supplied to each inlet of the electrolysis cell. The overall electrolyte volume was approximately 10 L and the electrolyte concentration was periodically measured by potentiometric titration with an automatic titrator (G20S, Mettler Toledo).
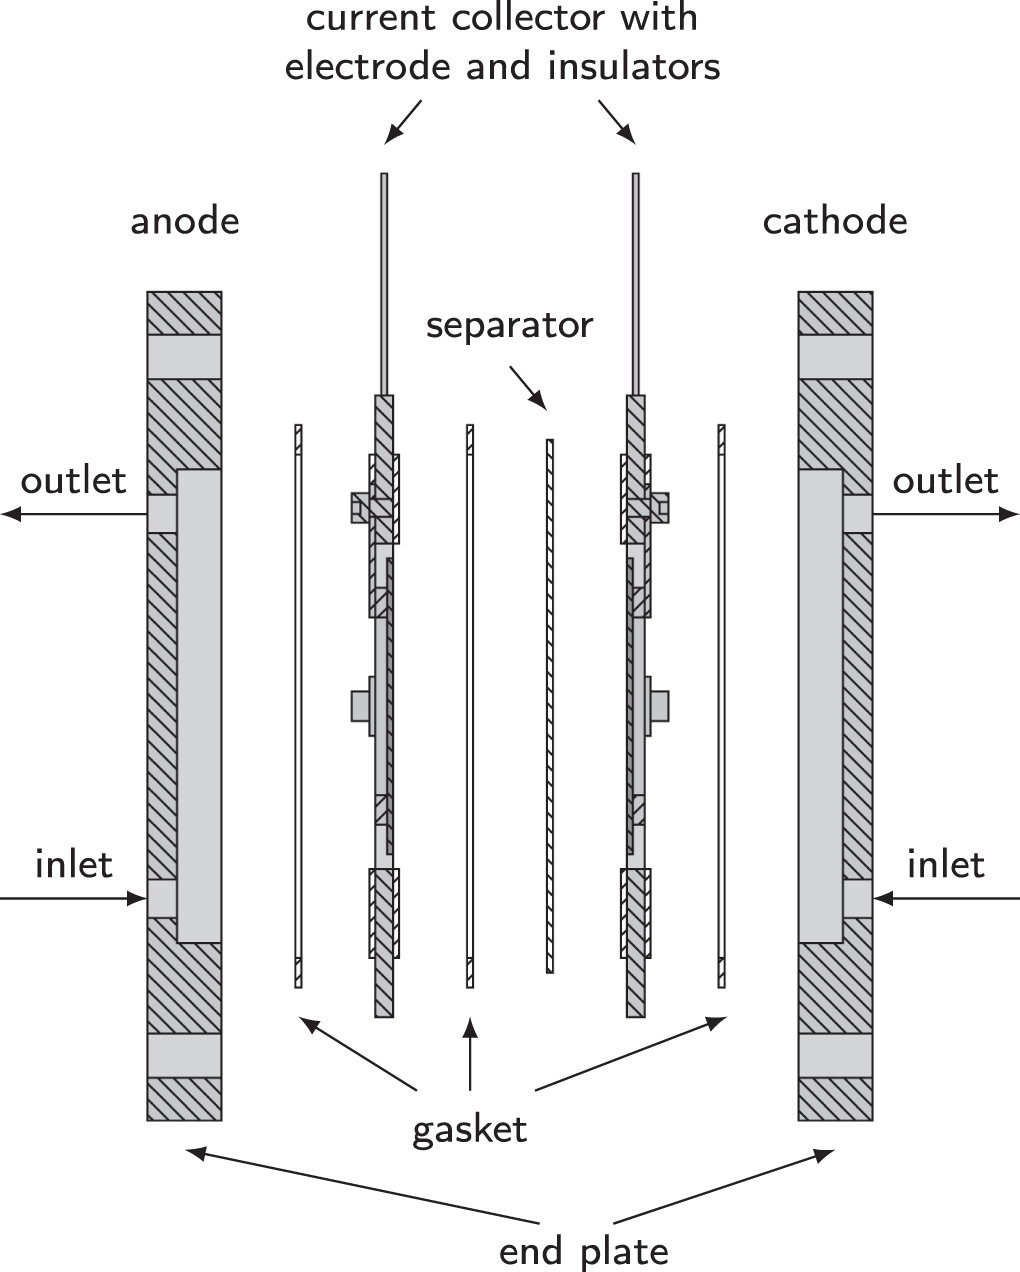
The assembly of the custom electrolysis cell is schematically shown in Fig. 2. Both end plates were made of nickel-coated stainless steel (1.4301, 304) and provide a half cell volume of approximately 300 mL. The electrolyte flowed from the inlet at the bottom to the outlet at the top. The current collectors made of stainless steel (1.4571, 316Ti) were placed onto the end plates. The surface of the current collectors was covered by additively manufactured insulators made of polypropylene (PP). The gaskets were novaflon® 200 (Frenzelit) with an outer diameter of 190 mm, an inner diameter of 170 mm, and a thickness of 1 mm. The electrodes consisted of expanded nickel (2.4068, Alloy 201) and were directly screwed onto the current collectors.
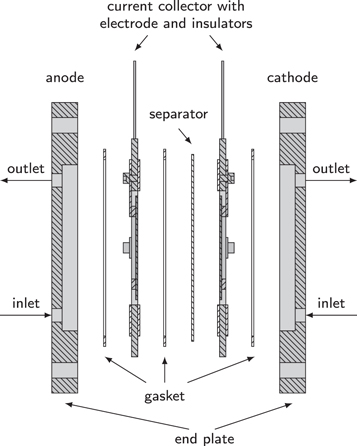
Figure 2. Cross-section view of the electrolysis cell. The end plates and the current collectors were made of stainless steel. Expanded nickel was used as electrodes with a projected area of 100 cm2. The cell was compressed during installation to achieve a minimum electrolyte gap (near zero gap).
Download figure:
Standard image High-resolution imageThe electrode structure is schematically shown in Fig. 3. The expanded nickel was 2 mm thick and had a square shape with a width and height of 100 mm, respectively, resulting in a projected area of 100 cm2. The holes were diamond-shaped with a width of approximately 8 mm and a height of roughly 4 mm. This results in an open area of 0.16 cm2 per hole. An average of 272 holes could be found on the provided electrode structure with an overall open area of 43.52 cm2. Consequently, the effective metal area of the electrode was reduced to 56.48 cm2.

Figure 3. Schematic drawing of the electrode structure. The expanded nickel provided a width and a height of 100 mm. The overall projected area was 100 cm2. The diamond-shaped holes had a width of 8 mm and a height of 4 mm. Approximately 272 holes could be found on the electrode surface. The effective electrode area reduced to 56.48 cm2.
Download figure:
Standard image High-resolution imageThe cell components were compressed during installation to provide nearly zero gap assembly. Hence, the distance between the electrodes was defined by the gasket and the insulators on the current collector surface. The separator geometry was a circle with a diameter of 180 mm and overlapped with the gasket by 5 mm on each side. Therefore, the exposed separator area was a circle with a diameter of 170 mm.
Ohmic cell resistance
The ohmic cell resistance was determined by electrochemical impedance spectroscopy (EIS) at selected temperatures between 25 and 80 °C and electrolyte concentrations of 21 ± 2 and 31 ± 2 wt.% KOH. The system pressure was controlled at 5 bar, and the electrolyte flow rate was 350 mL min−1. A hybrid EIS was performed with a Reference 3000 (Gamry Instruments) at 1 A with an amplitude of 10 mV from 100 kHz to 0.2 Hz with 10 points per decade. The hybrid EIS method is based on a galvanostatic EIS with a continuous adjustment of the AC current to optimize the measured AC voltage response. 46,47 For each material, 10 EIS measurements were performed in a sequence, and the measurement with the lowest deviation to the arithmetic mean value of all measurements was chosen for the following analysis. The software Echem Analyst (Gamry Instruments) was used to analyze the experimental data. The same gaskets were used for every cell assembly to maintain the comparability between the experiments.
Gas impurity
The stationary gas impurity with split electrolyte cycles was determined at 60 °C with an electrolyte concentration of 31 ± 2 wt.% KOH and also at 50 °C with an electrolyte concentration of 21 ± 2 wt.% KOH. All experiments were performed at a system pressure of 5 bar and the electrolyte flow rate was controlled at 350 mL min−1. The electrolyzer system was operated until steady gas impurity levels were observed (between 12 and 72 h) starting at a current density of 0.7 A cm−2 (related to the projected electrode area of 100 cm2) with decreasing steps of 0.2 A cm−2 until a current density of 0.1 A cm−2 was reached. When a maximum voltage of 2.6 V was exceeded, the experiment with this current density was skipped to protect the cell materials. Between the experiments, the electrolyte cycles were mixed for roughly 1 h to equalize the electrolyte concentration. When a gas contamination of 2 vol.% H2 in O2 (approximately 50 % of the lower explosion limit) or O2 in H2 was reached, the electrolyzer system was shut down and purged with nitrogen. 48
The oxygen in hydrogen content was measured by a Hitech Instruments G1010 Mark II, with an electrochemical sensor in the range from 0 to 10 vol.% with a resolution of ±0.01 vol.%. For the hydrogen in oxygen content, a Hitech Instruments K1550 was used. The thermal conductivity sensor detects in the range from 0 to 5 vol.% with an accuracy of ±0.1 vol.%. A gas chromatograph (Agilent, 7820A), calibrated with two test gases (0.2 vol.% and 1.0 vol.% H2 in Ar), was used to verify the inline measurements. The maximum error was previously determined to be ±0.01 vol.%. 48
Material stability
After the electrochemical characterization was completed, the effect of the experiments on the material stability of Zirfon Ref, PSEBS-CM-DBC, and PSU-PVP was evaluated by visual inspection after the cell disassembly. Besides the operating points, which were included in the electrochemical characterization, the selected materials were operated up to a temperature of 80 °C, and the electrolyte cycles were split for a longer time (up to 3 days). Depending on the applied current density (up to 0.7 A cm−2), the electrolyte concentration at the cathodic side was increased up to 40 wt.% KOH as a result of the water consumption. After this procedure, the cell was disassembled. If the material structure was intact, selected parts of the electrochemical characterization were repeated to check for degradation.
Results and Discussion
Physical characterization
Material thickness
The measured thicknesses of the material samples can be found in Table II. For the sample Zirfon Ref, a mean thickness of 491 ± 11 μm was measured. The technical datasheet of the reference material ZirfonTM Perl UTP 500 states a thickness of 500 ± 50 μm. 45 Therefore, the thickness of the sample Zirfon Ref complied with the specification. The exact thicknesses of Zirfon Eco and Zirfon Thin are for now proprietary information. While the thickness of Zirfon Eco was near the thickness of Zirfon Ref with approximately 500 μm, Zirfon Thin was considerably thinner with a thickness smaller than 250 μm. The thicknesses of the membrane materials were measured before installation in a wet state. While the sample PSEBS-CM-DBC showed a mean thickness of 217 ± 3 μm, the mean thickness of the PSU-PVP membrane was 240 ± 38 μm. Furthermore, the measurement at different spots of the sample showed values between 186 μm and 327 μm, which results in deviations of up to 37 %. This may be caused by the early stage of the manufacturing process or an inhomogeneous swelling behavior of the material in demineralized water.
Table II. Thickness, density and porosity of the material samples. The thickness was measured at eight different locations. Besides the arithmetic mean value, the standard deviation (SD), the minimum and the maximum thickness are given. The membranes were completely wetted with demineralized water when the thickness was determined. The exact thicknesses of Zirfon Eco and Zirfon Thin are confidential. Prior to the measurement of the density and the porosity, the membranes were dried.
| Sample | Thickness | Density | Porosity | ||
|---|---|---|---|---|---|
| min | mean ± SD | max | |||
| μm | μm | μm | g cm−3 | % | |
| Zirfon Ref | 478 | 491 ± 11 | 512 | 2.02 | 56 |
| Zirfon Eco | — | ≈ 500 | — | 2.02 | 55 |
| Zirfon Thin | — | < 250 | — | 2.13 | 59 |
| PSEBS-CM-DBC | 210 | 217 ± 3 | 222 | 0.98 | 9 |
| PSU-PVP | 186 | 240 ± 38 | 327 | 1.24 | 5 |
While the thickness of all Zirfon samples and PSEBS-CM-DBC did not change when dried, the material PSU-PVP contracted in length by increasing the overall thickness up to 495 μm. Dried PSU-PVP became irreversibly glass-like and cracked easily. Therefore, a complete immersion in the aqueous solvent was necessary when PSU-PVP was used.
Density and porosity
The measured densities and porosities of the materials can be found in Table II. As the density was determined by helium pycnometry, the density refers to the solid structure, including any closed porosity. The density of the reference material Zirfon Ref was 2.02 g cm−3. The same density was measured for the pre-commercial material Zirfon Eco. As Zirfon Eco is designed with properties close to Zirfon Ref, but with a modified manufacturing process, this result seems plausible. The density of Zirfon Thin was slightly higher with 2.13 g cm−3.
This phenomenon can be explained by further modification of the manufacturing process to produce thinner separators. However, the deviation from the reference material was only below 6 %. In comparison, the true density of PSEBS-CM-DBC was 0.98 g cm−3 and PSU-PVP was slightly denser with 1.24 g cm−3. Hence, all tested Zirfon materials provided a higher density than the membranes. This difference is most probably caused by the implemented zirconium dioxide which has a density between 5.68 and 6.10 g cm−3. 49 The measured density of 1.24 g cm−3 for the PSU-PVP membrane is in agreement with literature data for polysulfone. 50 As PSEBS-CM-DBC is based on various compounds, the density may be in the range of the specific densities. For example, the measured density of 0.98 g cm−3 is comparable with the density of polystyrene, which is 1.05 g cm−3. 51
The technical datasheet of the reference material ZirfonTM Perl UTP 500 states a porosity of 55 ± 10 % and the determined porosity of every tested Zirfon material is within this specification. 45 The membranes showed porosities below 10 %, which may be caused by the material compressibility. It has to be noted that the measured porosity is an effective value for the complete separator. Different local porosities may be present inside the material.
Bubble point
The results of the bubble point determination are given in Table III. Generally, the bubble point depends on the maximum size of the flow-through pores, as less pressure is necessary to reach the specification of 0.1 L min−1 nitrogen flow. The bubble point of ZirfonTM Perl UTP 500 should be 2 ± 1 bar. 45 While Zirfon Ref and Zirfon Thin showed a bubble point of 3 bar or higher, the bubble point of Zirfon Eco was only slightly above 2 bar. Zirfon diaphragms contain a skin layer with narrower pores than the internal pore structure. Therefore, the skin layer impacts the size of the flow-through pores and thus, the bubble point. 52,53
Table III. Results of capillary flow porometry and mercury intrusion porosimetry. The bubble point pressure was determined when a nitrogen flow of 0.1 L min−1 was detected. A cylindrical pore shape was assumed to extract the pore size from the data of mercury intrusion porosimetry. The membranes were dried prior to the measurement.
| Capillary flow porometry | Mercury intrusion | |||||
|---|---|---|---|---|---|---|
| porosimetry | ||||||
| Sample | Bubble point | Pore size | Average | Pore | ||
| pressure | min | mean | max | pore size | volume | |
| bar | nm | nm | nm | nm | mm3 g−1 | |
| Zirfon Ref | 3.48 | 129 | 151 | 184 | 98 | 385 |
| Zirfon Eco | 2.18 | 146 | 171 | 294 | 88 | 410 |
| Zirfon Thin | 2.98 | 130 | 152 | 215 | 75 | 385 |
| PSEBS-CM-DBC | — | — | — | — | 10 | 93 |
| PSU-PVP | — | — | — | — | 9 | 42 |
Additionally, both membrane materials were checked with the same characterization method. As no pores should exist, this was instead a material stress test up to the maximum measurement pressure of about 6 bar. On the one hand, the measurement method could be completed with the material PSEBS-CM-DBC, and no bubble-point was determined due to missing flow-through pores, and on the other hand, dried PSU-PVP was not compatible with the measurement method.
Pore size distribution
The pore size distributions were determined by capillary flow porometry and mercury intrusion porosimetry. The results can be found in Table III. Additionally, the pore size distributions of both characterization methods are displayed in Fig. 4.
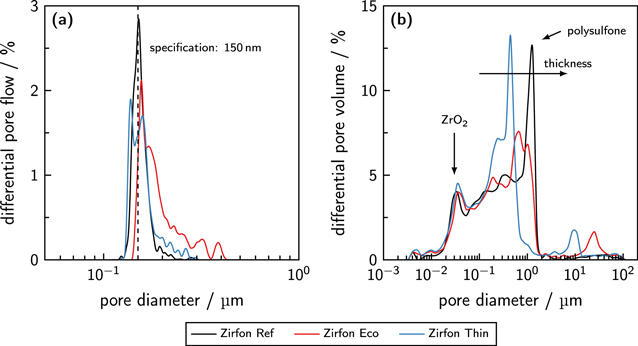
Figure 4. Pore size distributions of the porous separators. (a) Differential pore flow over the pore size (capillary flow porometry) in comparison to the mean pore diameter of 150 nm (technical specification of ZirfonTM Perl UTP 500 54 ). (b) Differential pore volume in dependence of the pore diameter (mercury intrusion porosimetry).
Download figure:
Standard image High-resolution imageThe average pore size of the reference material ZirfonTM Perl UTP 500 was published to be 150 ± 50 nm. 54 For the material sample Zirfon Ref a mean pore size of 151 nm was measured, which complies with the technical specification. Overall, the pores were in a range between 129 nm and 184 nm. With mean pore sizes between 171 nm and 152 nm, Zirfon Eco and Zirfon Thin also fulfill the official quality statements when only the mean pore size is examined. When also the minimum and maximum pore sizes are taken into account, the specification limit of pore sizes between 100 and 200 nm is exceeded by the maximum pore sizes. While the pores of Zirfon Eco ranged from 146 to 294 nm, Zirfon Thin showed pore sizes between 130 and 215 nm. As expected, the PSEBS-CM-DBC membrane showed no flow-through pores in the examined range, and the PSU-PVP material was not compatible with the measurement method. The results of mercury intrusion porosimetry are listed in Table III.
Zirfon Ref showed an average pore size of 98 nm, which is roughly a third lower than the value obtained from capillary flow porometry. When both pore size distributions are compared in Fig. 4, several differences can also be observed. While capillary flow porometry showed narrow pore size distributions for all diaphragms, mercury intrusion porosimetry determined multimodal pores size distributions with two or three characteristic peaks. For Zirfon materials, two characteristic peaks of the pore size distribution are already known. 22,55 The implemented zirconium dioxide causes a peak at approximately 30 nm, while the polysulfone structure effects pores in the range of 1 μm. The characteristic peak at roughly 30 nm was visible for Zirfon Eco and Zirfon Thin, which was expected as zirconium dioxide was also implemented in the separator structure.
While Zirfon Eco peaked at approximately 800 nm, Zirfon Thin showed a peak at roughly 400 nm. It has been reported elsewhere that thinner Zirfon diaphragms show smaller average pore diameters and that the concentration of the polymer during the manufacturing process affects the peak at 1 μm. 22,55 Furthermore, both pre-commercial materials also showed peaks above 3 μm, which may be caused by larger pores of the polysulfone structure and open pores between several separator sheets, as the material had to be cut into small pieces for this characterization method, or by the compressibility of the material. The shift of the polysulfone peak led to smaller average pore sizes for Zirfon Eco and Zirfon Thin with 88 nm and 75 nm. Despite the differences, all diaphragms showed similar mass-related pore volumes. While the reference material Zirfon Ref provided a specific pore volume of 385 mm3 g−1, Zirfon Eco provided a slightly elevated mass-related pore volume of 410 mm3 g−1. Zirfon Thin showed the same specific pore volume as Zirfon Ref.
Furthermore, the membranes were also characterized by mercury intrusion porosimetry. Both materials showed average pore sizes of approximately 10 nm. The mass-related pore volumes were in the range from 42 to 93 mm3 g−1. In addition to small pores on the membrane surface, the main pore volume might be related to the material compressibility at the high pressure applied during mercury intrusion. Consequently, both membranes can be considered as dense materials with no pores in their structure.
Electrochemical characterization
Ohmic cell resistance
The ohmic resistance of the cell setup was determined by EIS measurements. Selected impedance spectra can be found in the Supplementary Information (SI). The ohmic resistance at high frequencies Rhfr is a sum of several resistances, and therefore the ohmic separator resistance had to be extracted from this value. A simplified model assumption for this approach can be found in Fig. 5. Besides the ohmic resistance of the separator Rsep, also the resistance of the small electrolyte gap Reg between the electrodes and the separator had to be taken into account. The distances dcs and das were defined by the used gaskets and insulators. Uncompressed gaskets showed a thickness of 1 mm. However, only one gasket was placed between the electrodes, and it was compressed significantly during installation. The specified thickness of the current collector insulators was 500 μm. Owing to manufacturing deviations, a thinning at higher temperatures, and the compression, the actual thickness was smaller. Therefore, a distance of 250 μm was assumed for both sides. When the gaskets or the insulators are exchanged, then this distance may change. Hence, the same materials were used for every assembly. Furthermore, there were additional ohmic resistances Radd in this specific setup. These resistances were particularly defined by the mounting of the electrodes on the current collectors with three screws. The contact resistances were assumed to be constant for all experimental conditions and could be extracted from the measurements, as all other resistances could be defined by theoretical or experimental literature data. The electrolyte gap was assumed to be gas-free, as the EIS measurements were performed at a very low current density of 0.01 A cm−2 (relative to the projected area of the electrode), and the electrolyte was circulated through the electrolysis cell. At higher current densities, the effect of the gas bubbles can be more pronounced and should be considered.
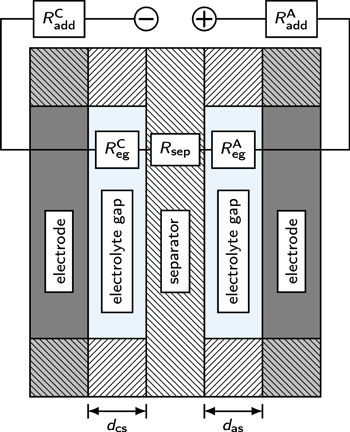
Figure 5. Model assumption for the determination of the separator resistance from the measured ohmic cell resistance. The ohmic resistance consists of the resistance of the electrolyte gaps ( and
and  ), the separator resistance (Rsep), and the setup-specific additional resistances (
 and
and  ). While the setup-specific resistances were assumed to be constant, the other resistances depended on operating temperature and electrolyte concentration. Furthermore, the electrolyte gap was assumed to be gas-free, as only a small current density was applied during the measurements.
Download figure:
Standard image High-resolution imageThe sum of all ohmic resistances in Eq. 1 represents the measured ohmic resistance at a high frequency Rhfr. While the resistance of the electrolyte gap Reg could be estimated by theoretical approaches, the separator resistance Rsep and the additional resistance Radd were free variables. 56

In literature, experimentally determined separator resistances can be found for a 500 μm thick Zirfon sheet at different temperatures with a constant electrolyte concentration of 30 wt.% KOH. 57 Thus, the data was assumed for the reference material ZirfonTM Perl UTP 500, and the additional resistance could be extracted.
The ohmic resistance of the electrolyte gap can be calculated by Eq. 2. For this, the specific electrolyte conductivity σKOH, the distances between the electrodes and the separator (dcs and das) and the cross-sectional area of the electrolyte gap Aeg need to be known. 56 The area was assumed to be the metal area of the electrode Ael (56.48 cm2), as not the complete projected area of the electrode was used due to the comparably large holes (from 4 to 8 mm) of the expanded nickel electrodes and the small interelectrode gap (approximately 1 mm). Therefore, the true effective area was between the metal area and the complete projected area. As the same assumption was used to determine the area-specific ohmic separator resistance of each material, the results are comparable with each other, which is the focus of this study.

Suitable correlations for the specific electrolyte conductivity σKOH and the density of an aqueous solution of potassium hydroxide (KOH) ρKOH can be found in literature and are shown in the SI. 58,59 Mainly, the properties of the electrolyte solution depend on the system temperature and the electrolyte concentration. Additionally, literature data was used to develop an empiric correlation for the ohmic resistance of a Zirfon separator in dependence of the operating temperature at fixed process conditions, which was used to extract the additional resistances of the specific cell setup. The correlation is also stated in the SI.
In general, the ohmic resistance Rdia of a diaphragm in Eq. 3 can be expressed by the thickness ddia, the active area Adia of the separator, the conductivity of the aqueous KOH solution σKOH, the porosity ε, and the tortuosity τ. 60 Theoretically, also the wettability of the pore system filled with the electrolyte solution has to be taken into account, as the available electrolyte volume might be reduced by inaccessible areas. 22 In this case, it was assumed that the whole pore system was wetted with the electrolyte solution.

The tortuosity τ in Eq. 4 is defined as the squared ratio of the shortest distance through the pore system Lpore and the thickness of the porous separator ddia. 61

Hence, the tortuosity of the diaphragms could be calculated using the measured values of the separator resistance. The calculation of the ohmic resistance of a dense membrane Rmem in Eq. 5 requires the membrane thickness dmem, the membrane area Amem and the ionic conductivity of the material σmem. 36

The ohmic cell resistances at different temperatures with an electrolyte concentration of 31 ± 2 wt.% KOH are shown in the SI. The setup-specific resistance Radd was calculated using literature data of a Zirfon diaphragm and the ohmic cell resistance of the experiments with Zirfon Ref. The additional resistance was quantified to 4.18 ± 0.13 mΩ. Thus, the separator resistance Rsep could be determined by subtracting the electrolyte resistance and the additional resistance. Typically, separator resistances are normalized by multiplying with the effective separator area, which leads to the area-specific separator resistance rsep in Eq. 6.

The results are shown in Fig. 6a in comparison to the literature data. 57 Note that the area-specific separator resistances relate to the metal area of the electrode.
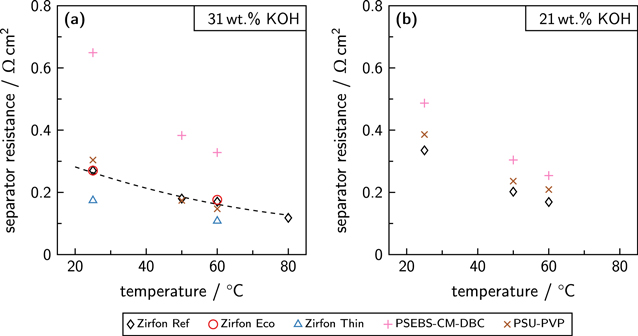
Figure 6. Area-normalized ohmic resistance of the separators in comparison to literature data (dashed line). 57 The operating conditions were a pressure of 5 bar and an electrolyte volume flow rate of 350 mL min−1. (a) Results for an electrolyte concentration of 31 ± 2 wt.% KOH. (b) Results for 21 ± 2 wt.% KOH. The area-normalized resistances were extracted by the described procedure and with the assumption that the separator area equals the metal area of the electrodes.
Download figure:
Standard image High-resolution imageIn literature, the ohmic resistance of ZirfonTM Perl UTP 500 is described to be below 0.3 Ω cm2 at 20 °C and slightly higher than 0.1 Ω cm2 at 80 °C for an electrolyte concentration of 30 wt.% KOH. 57 The experimental data of Zirfon Ref comply with the literature data. Zirfon Eco showed a very similar behavior. The resistances of Zirfon Thin were 36 % lower than the resistances of Zirfon Ref. The ohmic separator resistance of the examined diaphragms was reduced by 35 to 38 % when the temperature was increased from 25 to 60 °C, indicating the influence of the electrolyte conductivity by Eq. 3. Therefore, the absolute difference between the resistance of the diaphragms was caused by the material properties (thickness, porosity, tortuosity). While the thickness of Zirfon Thin was at least 50 % lower than the thickness of Zirfon Ref and the porosity of both materials was comparable, the tortuosity of Zirfon Thin must be higher to explain the reduction of only 36 % compared to the resistance of Zirfon Ref.
The tortuosity of the diaphragms could be determined using Eq. 3. The tortuosity of Zirfon Ref and Zirfon Eco was found to be in the range from 1.9 to 2.2. Zirfon Thin showed a tortuosity from 3.0 to 3.3. While a tortuosity between 1.4 and 1.9 was reported elsewhere for a new ZirfonTM Perl UTP 500 separator, the tortuosity increased after ageing to values ranging from 1.7 to 2.8. 60 The influence of the separator thickness on the tortuosity has also been observed previously. 22 This phenomenon may be described by the changing fraction of the skin layer. As the skin layer provides comparably small pores, the tortuosity increases when the fraction of the skin layer is larger. 22,52 Therefore, the determined tortuosities are effective values for the complete separator, and different local tortuosities are most probably present in the separator.
While the PSEBS-CM-DBC membrane showed the highest area-specific resistances at an electrolyte concentration of 31 ± 2 wt.% KOH, the PSU-PVP membrane provided nearly the same resistances as Zirfon Ref. At 50 and 60 °C, even lower resistances than the resistances of Zirfon Ref could be observed.
The ohmic cell resistances at an electrolyte concentration of 21 ± 2 wt.% KOH are listed in the SI. The separator Zirfon Ref showed the lowest resistance at those operating conditions. For the PSEBS-CM-DBC membrane, the highest ohmic cell resistances were measured. In this case, the PSU-PVP membrane caused higher resistances than Zirfon Ref at every system temperature.
The extracted area-normalized resistances can be found in Fig. 6b. While the ohmic resistance of Zirfon Ref was only slightly elevated at 60 °C compared to the values at the higher electrolyte concentration, the difference increased at lower temperatures. The switch from an electrolyte concentration of 31 ± 2 wt.% KOH to a lower concentrated electrolyte with 21 ± 2 wt.% KOH caused a 24 % higher separator resistance at a temperature of 25 °C. The area-normalized resistance of the PSEBS-CM-DBC membrane ranged from 0.487 Ω cm2 at 25 °C to 0.254 Ω cm2 at 60 °C, while the resistance of the PSU-PVP membrane was 0.386 Ω cm2 at 25 °C and 0.209 Ω cm2 at 60 °C. When comparing all normalized resistances at an electrolyte concentration of 21 ± 2 wt.% KOH, a similar temperature dependence can be observed. However, different offsets are present.
Even though the PSEBS-CM-DBC membrane showed the highest ohmic resistances, a contrary behavior to all other tested materials could be observed. While the resistance of Zirfon Ref and PSU-PVP increased at a lower electrolyte concentration, the resistance of PSEBS-CM-DBC lowered by approximately 25 %. This fact is in agreement with previously published data. 36 At a temperature of 30 °C, the ionic conductivity of PSEBS-CM-DBC is stated to be 75 mS cm−1 after storing the sample for one week in a 10 wt.% KOH solution. 36 For comparison, the experiments at 25 °C showed an ionic conductivity of 45 mS cm−1 with an electrolyte concentration of 21 ± 2 wt.% KOH and 33 mS cm−1 with a 31 ± 2 wt.% KOH solution as electrolyte. An explanation of this behavior may be the hydration of the membrane, which determines the ionic conductivity. 62 The PSU-PVP membrane showed a higher increase in ohmic resistance than Zirfon Ref when the electrolyte concentration was lowered.
Gas impurity
The results of the stationary anodic product gas impurity (H2 in O2) can be found in Fig. 7 in combination with the derived area-specific crossover flux density.
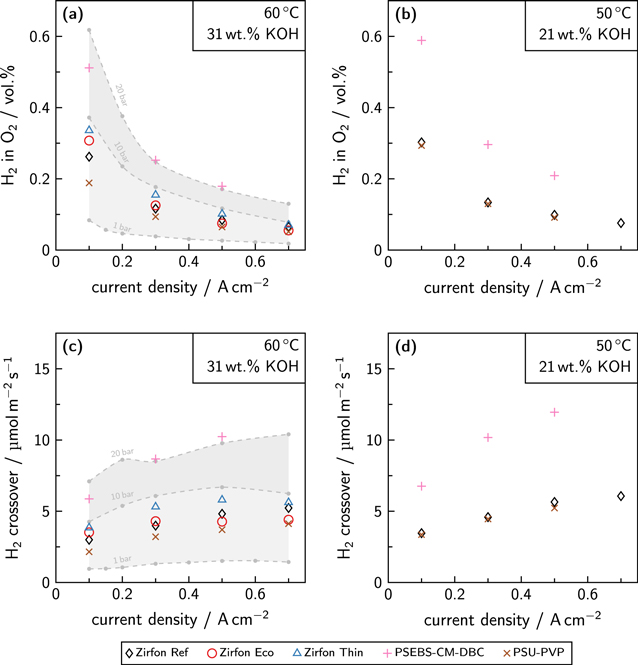
Figure 7. Anodic gas impurity and area-specific crossover flux with split electrolyte cycles at a pressure of 5 bar and an electrolyte volume flow rate of 350 mL min−1. (a) Anodic gas contamination at a temperature of 60 °C and an electrolyte concentration of 31 ± 2 wt.% KOH. (b) Anodic gas impurity at a temperature of 50 °C and an electrolyte concentration of 21 ± 2 wt.% KOH. The current density is related to the projected area of the electrodes (100 cm2). (c)/(d) Derived area-specific crossover flux. The dashed gray lines and the shaded gray areas show the results from previous experiments with ZirfonTM Perl UTP 500 at similar operating conditions. 48
Download figure:
Standard image High-resolution imageIn Fig. 7a, the anodic gas impurity at a temperature of 60 °C and an electrolyte concentration of 31 ± 2 wt.% KOH is shown. As the reference material Zirfon Ref (ZirfonTM Perl UTP 500) was used in previous studies at similar conditions in the same experimental setup, comparative values at different pressure levels are available for the anodic gas impurity. 48 The hydrogen in oxygen content of Zirfon Ref is consistent with the previous experimental data, as the measured gas impurity at 5 bar is placed between the values of 1 and 10 bar. At a low current density of 0.1 A cm−2 the gas impurity of Zirfon Ref was approximately 0.26 vol.% H2 in O2. The gas impurity decreased to a value of approximately 0.07 vol.% at a current density of 0.7 A cm−2. This trend is a general observation for the gas impurity of alkaline water electrolysis, as the higher gas production rate at high current densities dilutes the almost constant diffusive flux through the separator. 48,59 The operation with Zirfon Eco as separator led to a 15 % higher anodic hydrogen content at 0.1 A cm−2. This effect inverted for current densities above 0.3 A cm−2, and marginally lower gas impurities were measured. For Zirfon Thin, higher gas impurities could be observed. Compared to Zirfon Ref the gas impurity at 0.1 A cm−2 increased by 30 %. This difference also decreased with increasing current density. Generally, the anodic gas impurities of Zirfon Ref and Zirfon Eco were similar due to their comparable physical properties. However, some deviations could be found. The results of the stationary gas impurities of the membranes show considerable differences. While the PSU-PVP membrane caused a considerably lower anodic gas impurity than Zirfon Ref, the usage of the PSEBS-CM-DBC material led to almost doubled contamination of the anodic oxygen with hydrogen. Nonetheless, the gas impurity likewise decreased with increasing current density.
The results at a temperature of 50 °C and an electrolyte concentration of 21 ± 2 wt.% KOH can be found in Fig. 7b. When comparing the gas impurity of Zirfon Ref with the previous experimental conditions (higher temperature, higher electrolyte concentration), a slightly elevated gas contamination could be observed. This fact might be predominantly caused by the higher solubility of the product gases in a lower concentrated electrolyte solution. 63 Furthermore, the gas solubility is also affected by the lowered temperature. 64 In contrast, the diffusion coefficients of the product gases in the electrolyte solution decrease with the temperature. 65 Overall, the hydrogen in oxygen contamination ranged from 0.30 to 0.08 vol.% for Zirfon Ref. For the PSEBS-CM-DBC membrane, the gas impurities were about twice as high. The performance of the membrane PSU-PVP was comparable with the gas impurity obtained with Zirfon Ref. Even slightly lower gas contamination could be achieved. However, the difference between the results of Zirfon Ref and PSU-PVP was more pronounced at a higher electrolyte concentration.
The obtained gas impurities were used to calculate the theoretical crossover flux density. As the gas contamination with separated electrolyte cycles only results from the transport of dissolved product gas species through the separator material, the measured quantities can be used to characterize the material samples in terms of permeability. The crossover flux density  of the species i was calculated by Eq. 7.
48,59,66
of the species i was calculated by Eq. 7.
48,59,66

The overall current I is the product of the current density and the projected area of the electrode. At the anodic side, the number of exchanged electrons z equals 4, while it is 2 for the cathodic reaction. The Faraday constant F is 96485 C mol−1. Furthermore, the measured gas impurity was assumed to equal the molar fraction of the foreign product gas xi . The accessible separator area for the crossover was assumed to be a circle with a diameter of 17 cm (approximately 227 cm2).
In the Figs. 7c and 7d, the derived crossover flux density for hydrogen is shown. Literature data at similar operating conditions is displayed for comparison. 48 The crossover flux density at a temperature of 60 °C and an electrolyte concentration of 31 ± 2 wt.% KOH is placed between the expected values at 1 bar and 10 bar, and therefore complies with the literature data. Above a current density of 0.4 A cm−2, the crossover flux density reached a constant plateau, which resulted in lower gas contamination owing to the higher dilution. When a temperature of 50 °C and an electrolyte concentration of 21 ± 2 wt.% KOH was used instead, a higher crossover flux density could be observed, as it was already expected in the previous discussion of the product gas impurity. Furthermore, the constant plateau was shifted toward a higher current density. This phenomenon might also be explained by the higher solubility of the product gases in a diluted electrolyte solution.
Corresponding results for the cathodic gas impurity (O2 in H2) and the calculated crossover flux density are shown in the SI. However, the gas contamination was significantly lower (mostly below 0.15 vol.% O2 in H2 for the diaphragms) due to the stoichiometry of the reaction. The crossover flux density was approximately in the same range as for hydrogen and ranged from 50 to 100 % of this value. This fact can be explained by the lower diffusion coefficient of oxygen compared to hydrogen at the same operating conditions. 65 Furthermore, the diffusive transport of the dissolved oxygen molecules must work against the electroosmotic flow of the reaction, which occurs from the cathode to the anode. Smaller irregularities can be explained by the change of the electrolyte concentration with split electrolyte cycles. While the electrolyte concentration increased at the cathodic side due to the water consumption, the anodic electrolyte concentration was diluted by the water production. When a diaphragm was used, the electrolyzer test station balanced the vessel levels by a small overpressure on the electrolyte cycle with a higher vessel level to cause a small convective flow through the separator material. As mostly the anodic vessel level was higher than the vessel level at the cathodic side, the convective flow from the anodic to the cathodic side would result in lower anodic gas contamination and higher oxygen content at the cathodic side. Nevertheless, the electrolyte concentration is slightly equalized by this control scheme. When a dense membrane was used, the establishment of a convective flow was not possible, and therefore no overpressure was applied. However, the electrolyte concentration differed, which also slightly affected the resulting gas impurity. 63,64,67–69 Hence, small deviations of the gas impurity can be explained by these factors.
To conclude, the gas impurities of the porous diaphragms and the PSU-PVP membrane were on the same level. Especially a high electrolyte concentration was beneficial for the gas impurity obtained with PSU-PVP. Even though the used PSU-PVP membrane was only half as thick as Zirfon Ref, equal and—in some cases—lower gas contamination could be achieved. The usage of the PSEBS-CM-DBC membrane always led to higher gas impurities, which might be caused by a higher diffusivity of the dissolved product gases in the material. The higher anodic gas impurity of Zirfon Thin in comparison to Zirfon Ref can be explained by the reduced thickness and, therefore, a smaller diffusion length.
Material stability
As ZirfonTM Perl UTP 500 is the reference material and established in industrial processes, all other materials have to compete with its performance and stability. 45,53 For large-scale usage, separators should provide a long lifetime without drastic degradation. Indeed, Zirfon Ref could withstand a temperature of 80 °C and an electrolyte concentration of 40 wt.% KOH (cathodic side) during the standard testing time of several days. Other researchers also reported no degradation when a Zirfon separator was tested at a temperature of 95 °C in a highly concentrated potassium hydroxide solution (6 mol L−1) for several days. 11 The manufacturer states the lifetime of ZirfonTM Perl UTP 500 to be longer than 5 years under normal operating conditions. 54 As the distance between the electrodes and the separator was very small, some deposits on and in the separator structure could be observed. Figure 8 shows the anodic (Fig. 8a) and cathodic (Fig. 8b) side of Zirfon Ref after several weeks of use. While the anodic side was orange/brown colored, the cathodic side looked black/brown. As the electrolyte got saturated with the steel constituents during operation, a yellow shine was observed.
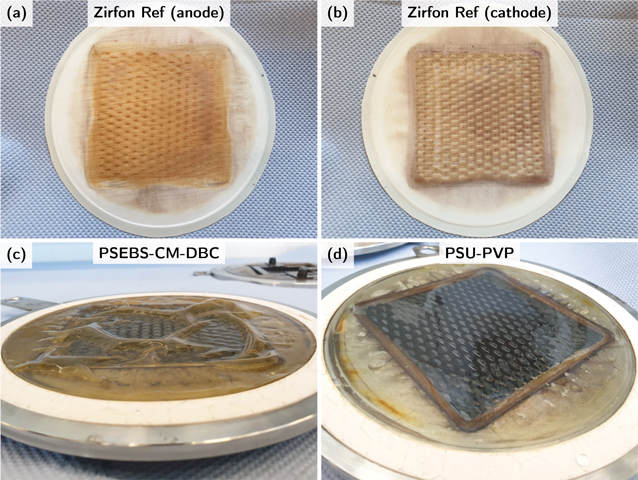
Figure 8. The material samples after several weeks of operation. (a) Anodic side of Zirfon Ref. (b) Cathodic side of Zirfon Ref. (c) PSEBS-CM-DBC membrane. (d) PSU-PVP membrane.
Download figure:
Standard image High-resolution imageHowever, no apparent detrimental effect on the overall resistance or on the gas impurity could be seen in the timeframe of the experiments. Moreover, the reinstallation of the Zirfon Ref sample led to comparable results of ohmic cell resistance and gas impurity. Only some irreversible thickness variations were present where the material was placed on the gasket. Furthermore, no swelling could be noticed when immersed in a potassium hydroxide solution. The pre-commercial materials Zirfon Eco and Zirfon Thin showed both the same material stability as Zirfon Ref during the electrochemical testing procedures up to 60 °C.
When comparing the handling of the membranes PSEBS-CM-DBC and PSU-PVP with the usage of the diaphragm Zirfon Ref, differences could be found. Before the experiment, the membranes were stored in demineralized water at room temperature. The electrochemical characterization at elevated temperatures caused the membranes to swell. This phenomenon can be seen in Fig. 8, which shows the membranes after the usage. A pronounced swelling could be observed for PSEBS-CM-DBC (Fig. 8c), while PSU-PVP (Fig. 8d) showed almost no visible swelling behavior after the experiment. However, large cell voltage fluctuations appeared with both membranes at higher current densities above 0.5 A cm−2, because gas bubbles might be accumulated and released periodically in the occurring gaps between the electrode and the membrane. This effect was damped after a reinstallation of the PSEBS-CM-DBC sample. By contrast, PSU-PVP still showed large fluctuations at higher current densities.
Therefore, the storage of the membranes at operating temperature should be considered. No negative effects could be observed for PSEBS-CM-DBC when operated up to 80 °C for several days with 21 ± 2 wt.% potassium hydroxide solution. Moreover, an operation with 31 ± 2 wt.% electrolyte solution also caused no visible degradation of the structural integrity, the ohmic cell resistance, or the gas impurity. The same statement applies to PSU-PVP, as the experiments at 50 °C and 60 °C with 21 ± 2 wt.% KOH and 31 ± 2 wt.% KOH showed no impact on its performance. Only the operation at a temperature of 80 °C resulted in structural damage. The membrane became brittle at the rim near the gasket and cracked. This problem might be caused by the drying of the material at higher temperatures.
Overall, the membranes provided sufficient material stability even at higher electrolyte concentrations. While the PSU-PVP membrane suffered from mechanical cracking when dried out, the PSEBS-CM-DBC membrane showed no adverse effects regarding the operation at temperatures up to 80 °C. However, further long-term experiments are necessary to specify the degradation effects more precisely.
Effect of the material properties on the process performance
While the performance of diaphragms depends majorly on the pore structure and the properties of the electrolyte solution, the performance of the membranes is influenced by the ionic conductivity of the membrane material and the permeability of the dissolved product gases in the polymer matrix. Furthermore, ion-solvating membranes behave more like diaphragms, as also a high electrolyte concentration is required to ensure a sufficient ionic conductivity. For selective ion-exchange membranes, a high electrolyte concentration can have a negative effect, as the hydration of the material will be lower.
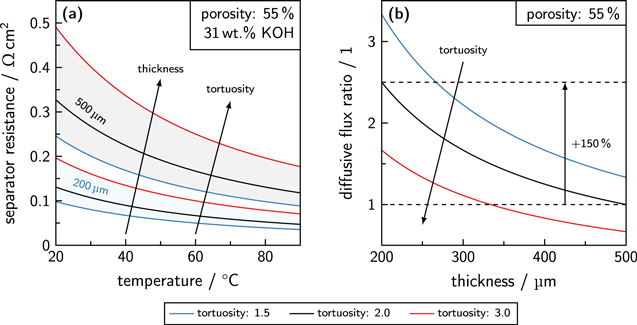
In Fig. 9a, the calculated separator resistance of diaphragms with different material properties can be found. The area-normalized separator resistance can be calculated by the Eqs. 3 and 6. The electrolyte concentration was set to 31 wt.% KOH and the porosity of the diaphragms was assumed to be constant at 55 %.
Figure 9. (a) Area-normalized ohmic separator resistances for diaphragms in dependence of the temperature. The porosity of the materials was assumed to be 55 %, while the tortuosity was varied. The electrolyte was an aqueous solution of potassium hydroxide with 31 wt.% KOH. (b) Diffusive flux through a porous separator with different tortuosities in dependence of the thickness normalized to the diffusive flux through a separator with a thickness of 500 μm and a tortuosity of 2.0.
Download figure:
Standard image High-resolution image
While the area-normalized separator resistance of the diaphragm with a thickness of 500 μm is always higher than the resistance of the separator with a thickness of 200 μm, the tortuosity has a major effect. Furthermore, the calculation results show that the absolute influence of the tortuosity is more pronounced for thicker separators and at lower temperatures, which can be explained by the longer way the hydroxide ions have to pass through a pore system with a higher tortuosity and the lower conductivity of the electrolyte solution at lower temperatures.
To evaluate the influence of the material properties on the gas impurity, the diffusive flux through the separator has to be estimated. In general, the molar flow of dissolved product gas through a diaphragm  can be described by Eq. 8.
48,59,70
can be described by Eq. 8.
48,59,70

Thus, the binary diffusion coefficients Dij of the product gases i in the liquid electrolyte j need to be known. To describe the effective diffusion, the knowledge about the porosity ε and tortuosity τ is required. Additionally, the available separator area Adia and the separator thickness ddia have to be taken into account. The driving force of this molar flow is the concentration gradient Δci of the dissolved component i between the sides.
For dense membranes, the previous approach to calculate the diffusive flow through the material can be simplified to Eq. 9. In this case, the crossover flow  depends on the effective diffusion coefficient of the species in the membrane Di,mem, which have to be determined separately.
71
depends on the effective diffusion coefficient of the species in the membrane Di,mem, which have to be determined separately.
71

In contrast to the diaphragm approach, the crossover flow cannot be described by the binary diffusion coefficients of the dissolved product gases in the electrolyte solution and not by the physical properties of a pore system.
In Fig. 9b, the calculated diffusive flux ratio through a diaphragm with different material properties is shown. The diffusive flux is raised by 150 % when the thickness is reduced from 500 to 200 μm. Additionally, the crossover flux is reduced by a higher tortuosity, as the pore structure lowers the effective diffusion of the dissolved components through the material. In this case, the influence of the tortuosity on the diffusive flux ratio is slightly larger for thinner separators.
Hence, thinner diaphragms with a high tortuosity or thicker diaphragms with a low tortuosity are a good compromise between high ionic conductivity and low gas contamination. As Zirfon type separators contain skin layers, which influence the overall pore structure and the tortuosity, this material part can be a good starting point for optimization. Moreover, the properties of the internal supporting structure could also be optimized. The experimental evaluation revealed a slightly higher tortuosity of Zirfon Thin in comparison to the other diaphragms. Besides the optimization of the tortuosity, the porosity can be adjusted for better performance, as the ionic conductivity and the diffusion coefficient are lowered by the ratio of porosity and tortuosity. 48,59,70 Recently, an enhanced Zirfon separator (ZirfonTM UTP 500+) was announced, which provides a porosity of 60 ± 5 % and therefore a lower ionic resistance can be achieved compared to ZirfonTM Perl UTP 500. 45,72
More experimental data about the effective ionic conductivity and the effective diffusion coefficients of the dissolved components in dependence of the material composition is needed to assess the effects of the material properties for the membranes in a more general way. This is especially true for ion-selective membranes as the behavior completely differs from porous separators. For ion-solvating membranes, it may be sufficient to replace the ratio of the porosity and the tortuosity with a membrane-specific reduction factor to describe the effective ionic conductivity and the effective diffusion properly.
Conclusions
This experimental study compared two pre-commercial diaphragms, an ion-selective membrane and an ion-solvating membrane with the state-of-the-art material ZirfonTM Perl UTP 500 for the implementation in alkaline water electrolysis under typical operating conditions.
The experimental evaluation showed that the thinner diaphragm (Zirfon Thin) caused lower ohmic resistances compared to its thicker counterparts (Zirfon Ref, Zirfon Eco). However, the gas impurity was slightly increased when the thinner diaphragm was used. Hence, thinner diaphragms might be favorable if the operation at higher current densities is intended, as the cell voltage will be drastically lower, and the effect of an enhanced crossover flow is damped by the high gas production rate. If the application scenario includes the operation at lower current densities or the gas purity is of utmost importance, then thicker diaphragms might be better. This argumentation is especially true for the dynamic operation with fluctuating renewable energy, as long periods of low power availability can regularly occur. However, further long-term experiments of the pre-commercial materials are necessary to validate these statements.
The pore structure of diaphragms can be optimized by adjusting the porosity or the tortuosity, whereby the latter provides a larger room for optimization. Additionally, most diaphragms contain skin layers or a supporting structure, which can be used to tune the effective material properties.
While the evaluated ion-solvating membrane (PSU-PVP) behaved like a diaphragm as a higher electrolyte concentration was beneficial for lowering both the ohmic resistance and the gas impurity, the ion-selective membrane (PSEBS-CM-DC) showed a decreased ohmic separator resistance when the electrolyte concentration was lowered. As the solubility of the product gases is higher in a lower concentrated electrolyte solution, the gas impurity increased for all tested materials. Therefore, the PSU-PVP membrane can be used as a direct replacement for diaphragms, and further optimization of the thickness and the material stability at elevated temperatures may lead to results, which clearly outperform the conventional materials. The use case of the PSEBS-CM-DBC membrane is instead for the operation with a significantly lower concentrated electrolyte solution in alkaline membrane electrolysis. Therefore, further experiments at lower electrolyte concentrations should be carried out to determine the optimum operating conditions for this material.
Finally, diaphragms can be mainly optimized by the adjustment of the thickness, the porosity, and the tortuosity, and further optimization, especially of the long-term stability, of the membranes, is required to enable their large-scale application.
Acknowledgments
This contribution is funded by the Deutsche Forschungsgemeinschaft (DFG, German Research Foundation, project numbers: 290 019 031, 391 348 959), the Technical University of Denmark (DTU), and the Innovation Fund Denmark (9067-00055B DREAME).