

Abstract
3D atomistic simulations via molecular dynamics (MD) at temperature of 0 K and 295 K (22 °C) with a high quasi-static loading rate dP/dt of 2.92 kN s−1 show that cleavage fracture is supported by surface emission of oblique dislocations  and by their subsequent cross slip to {112} planes, which increases separation of the (001) cleavage planes inside the crystal. Under the slower loading rate by a factor 5, the crack growth is hindered by twin generation on oblique planes {112} and the fracture is ductile. The MD results explain the contribution of the crack itself to the ductile-brittle transition observed in our fracture experiments on Fe-3wt%Si single crystals of the same orientation and geometry, loaded at the same rates dP/dt as in MD. The loading rates are equivalent to the cross head speed of 5 mm min−1 and 1 mm min−1 used in the experiment. The MD results also agree with the stress analysis performed by the anisotropic LFM and comply with experimental observations.
Export citation and abstract BibTeX RIS

Original content from this work may be used under the terms of the Creative Commons Attribution 4.0 licence. Any further distribution of this work must maintain attribution to the author(s) and the title of the work, journal citation and DOI.
1. Introduction
The ductile-brittle transition at cracks in bcc iron-based materials caused by temperature or by loading (strain) rate is often studied via experiments and also theoretically, because the topic is extremely important for engineering applications [1]. A broad overview concerning the influence of loading or strain rate on material properties can be found e.g. in [2], including the effect of loading rate on ductile-brittle transition and fracture toughness.
This atomistic study was motivated by our fracture experiments [3, 4] on edge notched single crystals Fe-3wt%Si (see figure 1) loaded in mode I with various cross head speeds from 0.5 mm min−1 up to 5 mm min−1, where the ductile-brittle transition was monitored at room temperature with increasing loading rate for crack orientation (001)[110] (crack plane/crack front)—see figure 2. The crack plane (001) is the most frequent cleavage plane observed in bcc iron [1]. In particular, in the first experiment [3] with crystals of length L ≈ 100 mm, an unexpected sudden brittle fracture at Griffith level was detected in the case of the longer edge crack (001)[110] with the relative ratio a/W = 0.42 (figure 1) under the highest cross head speed of 5 mm min−1. The presented new free 3D atomistic simulations using molecular dynamics (MD) technique are focused on the experiment in [3]. The simulations utilize the self-similar continuum concept from linear fracture mechanics (LFM), valid for both experimental (macro) specimens and atomistic samples (of sufficiently large dimensions), since in LFM the stress concentration depends just on relative sample dimensions such as a/W, L/W and B/W in figure 1. The previous plane strain MD simulations presented in [3] were of 2D character, where the atomic motion in x3 = [110] direction was not allowed and the dislocation emission on the slip systems oblique to the crack front was not enabled. 2D simulations in [3] resulted in cleavage fracture, accompanied just with some attempts to emit dislocations on the inclined slip systems, containing the crack front. Here we present new 3D simulations unrestricted by plane strain conditions along the crack front, i.e. with free surfaces like in experiments. Our question is how the crack itself can contribute either to ductile or to brittle behavior in dependence on the loading rate in 3D. In this paper we bring new information, presented in section 3 and briefly mentioned in the Abstract.
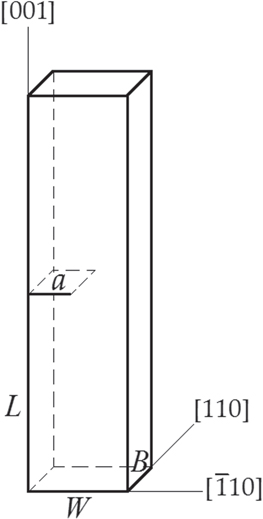
Figure 1. Scheme and orientation of the SEN specimens used in experiments and in MD.
Download figure:
Standard image High-resolution image
Figure 2. Ductile—brittle transition in fracture experiments [3, 4] with edge cracks (001)[110] loaded in mode I at room temperature: (a) Kcr versus VE (mm min−1); (b) Kcr versus strain rate (min)−1. The black points come from [3], where longer crystals of the length L ∼ 100 mm were used. The pink points come from [4], where smaller crystals of the length L ∼ 50mm were used. The transition is indicated by the dashed line.
Download figure:
Standard image High-resolution imageAll the processes generated by the crack itself (such as a rupture of atomic bonds, dislocation emission, twinning, etc) are very fast (of the order 10 ps on time scale) making it difficult (or impossible) to obtain information about these crack tip processes experimentally. However, it can be done via MD simulations. MD technique can be utilized in many areas, not only for crack problems—see e.g. reference [5] devoted to machining processes on monocrystalline copper.
As for bcc iron, our recent MD simulations were focused mostly on the ductile crack orientation ![$(\bar{1}10)[110]$](https://content.cld.iop.org/journals/2053-1591/9/3/036508/revision2/mrxac5708ieqn2.gif) that is not too sensitive to loading rate [4]. Dislocation emission presented in MD simulations [6, 7] and its thermal activation in [8] are in agreement with the corresponding continuum predictions [9–11] and comply with the experimental observations presented in [4], which is encouraging.
that is not too sensitive to loading rate [4]. Dislocation emission presented in MD simulations [6, 7] and its thermal activation in [8] are in agreement with the corresponding continuum predictions [9–11] and comply with the experimental observations presented in [4], which is encouraging.
On the other hand, a direct quantitative comparison between MD results and fracture experiments is not possible due to different strain rates, pre-existing dislocations, impurities and other defects, present in the experiments. A review paper on the capabilities and limitations of MD simulations can be found in [12]. In this paper we treat a difficult crack orientation (001)[110] that is sensitive to strain rate in fracture experiments [3, 4]–see figure 2.
As for strain rates in the classical fracture tests with quasistatic continuous loading, the monitored P - t dependencies (resulting force P versus time t) show that brittle fracture occurs within a time interval of several seconds—see e.g. figure 7 in [3] or figure 5 in [4] in the case of iron crystals. Since MD simulations need to use a very fine time step h of the order 10–14 second to secure numerical stability of Newtonian equations of motion in the atomic lattice (with interatomic distances of the order of 10–10 m), modelling of real fracture experiments via MD is impossible because of high time consumption (1014 time steps h are needed). On the other hand, the continuum theory of elasto-dynamic crack problems [13] states that a fast or slow loading is a relative term, depending on the ratio of the critical rise time Δt and the half period Tλ/2 of the basic sample vibrations. Tλ/2 in mode I depends on the sample length L (λ/2 = L). For Δt ≫ Tλ/2 , the influence of inertial forces in Newtonian equation of motion is relatively small and the loading can be considered as a quasi-static loading and vice versa, for Δt ≪ Tλ/2 , it represents an impact loading. The validity of this idea can be verified by comparing MD results with the continuum LFM solutions in two limit cases: i/ for impact loading (solved before in [14]), and ii/ for the static or quasi-static case (solved before in [6] and also presented here).
To answer our question concerning the effect of loading rate on the ductile-brittle behavior of edge cracks (001)[110], we utilize in MD the elasto-dynamic concept described above and introduce a time similarity with the fracture experiment from [3] via the relation  where index 'ex' refers to the experiment and MD to the 3D atomistic simulations. In MD, two different quasi-static loading rates 1 PH and 5 PH are treated, corresponding to cross head speed of 1 mm min−1 and 5 mm min−1 in the experiment. MD simulations were performed both at temperature of ∼ 0 K to enable a comparison with continuum solutions and at room temperature of ∼ 295 K (22 °C) to enable a comparison with experiment. Further details of MD simulations are described in section 2. The results in section 3 are discussed not only in relation to the mentioned experiment [3] and to its further post-fracture experimental analysis via transmission electron microscopy (TEM) and scanning electron microscopy (SEM) in [15] but also in relation to the recent experiments on Fe-Si single crystals presented in [16].
2. MD simulations
Crystal consists of 900 planes (001) in the direction x2 = [001] parallel to the length L in figure 1, 150 planes ![$[\bar{1}10]$](https://content.cld.iop.org/journals/2053-1591/9/3/036508/revision2/mrxac5708ieqn4.gif) in the direction x1
=
in the direction x1
= ![$[\bar{1}10]$](https://content.cld.iop.org/journals/2053-1591/9/3/036508/revision2/mrxac5708ieqn5.gif) (the width W in figure 1) and 30 planes (110) along the crack front, parallel to the direction x3
= [110] and the sample thickness B in figure 1. The total number of atoms in the atomistic sample is N = 2 025 000. The pre-existing edge-through crack of length a was created by cutting the interatomic bonds in the [001] direction along the crack faces (i.e. between layers 450 and 451). During the simulations, the interactions across the initial crack planes (001) were not allowed. The relative dimensions of the atomistic sample a/W, B/W and L/W correspond to the relative dimensions of the specimens treated in fracture experiments in [3], so that the boundary corrections factors FI
(a/W) and fI
(a/W) staying in LFM at the stress intensity factor KI
[17] and the T-stress [18, 19] are the same in MD and experiment. Note that FI
and fI
in LFM do not depend on sample length if
(the width W in figure 1) and 30 planes (110) along the crack front, parallel to the direction x3
= [110] and the sample thickness B in figure 1. The total number of atoms in the atomistic sample is N = 2 025 000. The pre-existing edge-through crack of length a was created by cutting the interatomic bonds in the [001] direction along the crack faces (i.e. between layers 450 and 451). During the simulations, the interactions across the initial crack planes (001) were not allowed. The relative dimensions of the atomistic sample a/W, B/W and L/W correspond to the relative dimensions of the specimens treated in fracture experiments in [3], so that the boundary corrections factors FI
(a/W) and fI
(a/W) staying in LFM at the stress intensity factor KI
[17] and the T-stress [18, 19] are the same in MD and experiment. Note that FI
and fI
in LFM do not depend on sample length if  which is obeyed in this study. As follows from continuum predictions in [11], a reliable description of thermal activation at dislocation emission from the crack tip in MD requires a sample thickness
  where
where  stands for Burgers vector and ao is the lattice parameter in the bcc lattice. Sample thickness in this study is B = 30 d110
, where
stands for Burgers vector and ao is the lattice parameter in the bcc lattice. Sample thickness in this study is B = 30 d110
, where  is the interplanar distance in the [110] direction along the crack front. The condition above is obeyed and the used thickness B is sufficient for a reliable description of the thermal activation, which is presented in [8] for temperature of 300 K and 600 K.
When a 3D crystal with free surfaces is generated, unresolved interatomic forces occur at the free surfaces due to missing interatomic interactions. Before loading or heating, surface relaxation in the atomistic 3D sample is performed to bring it to equilibrium and to avoid the influence of surface relaxation on the crack tip processes in subsequent simulations. This was done using the viscous damping in Newtonian equations of motion. The subsequent simulations are free, i.e. no damping is used in Newtonian equations of motion for the individual atoms.
Newtonian equations of motion for the individual atoms are solved in all 3 directions x1 , x2 x3 , using a stable time integration step h = 1 × 10–14 s, tested in [8].
For the description of the interatomic interactions an N-body potential from table 2 in [20] is used with the lattice parameter ao = 2.8665 Å and the basic elastic constants C11
= 243 GPa, C12
= 145 GPa and C44
= 116 GPa for bcc iron. The relevant surface formation energy with this potential is γ001 = 1.812 J m−2. The corresponding values of Griffith stress intensity factors calculated from the relation  are KG
= 0.9115 MPa m1/2 for plane strain and KG
= 0.835 MPa m1/2 for plane stress conditions in the atomistic samples. The anisotropic elastic coefficient C depends on crystal orientation and stress state: C = 5.198 × 10⁻¹² m2/N for plane stress and C = 4.362 × 10⁻¹² m2/N for plane strain in our case (for more details, see e.g. [6]).
are KG
= 0.9115 MPa m1/2 for plane strain and KG
= 0.835 MPa m1/2 for plane stress conditions in the atomistic samples. The anisotropic elastic coefficient C depends on crystal orientation and stress state: C = 5.198 × 10⁻¹² m2/N for plane stress and C = 4.362 × 10⁻¹² m2/N for plane strain in our case (for more details, see e.g. [6]).
The relaxed atomistic 3D sample is loaded either at temperature of ∼ 0 K (i.e. without previous heating) or at room temperature of ∼ 295 K (22 °C), i.e. with previous heating to this temperature before loading.
As mentioned in Introduction, the different loading rates in MD are introduced via the relation  The experimental elastic estimate
  where V is the displacement in the L-direction. This is calculated with Young modulus E =175.5 GPa, B ∼ 2 mm, W ∼ 10 mm, L ∼ 100 mm and for the cross head speed VE = dV/dt either 5 mm min−1 or 1 mm min−1 as in the experiment [3]–see figure 2. This elastic approach corresponds to either dP/dt = 2.92 kN s−1 (denoted as 5 PH for 5 mm min−1) or to dP/dt = 0.584 kN s−1 (denoted as 1 PH for 1 mm min−1). These values are considered to determine the loading rate (dσ/dt) in MD via relations
  where B = 30 d110
, W = 150 d110
, so that (BW)MD
= 1.8488 × 10⁻¹⁶ m2 in the atomistic samples. For example, if the longer crack in MD of length a = 64 d110
is considered, then for the ratio a/W = 0.4267 (as a/W ∼ 0.42 in [3]) we obtain from [37] the boundary correction factor FI
= 2.2454 and from the known LFM relation
where B = 30 d110
, W = 150 d110
, so that (BW)MD
= 1.8488 × 10⁻¹⁶ m2 in the atomistic samples. For example, if the longer crack in MD of length a = 64 d110
is considered, then for the ratio a/W = 0.4267 (as a/W ∼ 0.42 in [3]) we obtain from [37] the boundary correction factor FI
= 2.2454 and from the known LFM relation  we obtain Griffith stress σG
= 1.84 GPa for plane stress conditions in MD. The rise time ΔtG
needed to reach this critical level
we obtain Griffith stress σG
= 1.84 GPa for plane stress conditions in MD. The rise time ΔtG
needed to reach this critical level  with loading rate
  is given by the relation
  which represents ΔtG
= 11650 h , where h = 1 × 10–14 s is the used time step in MD. At loading level of 1 GPa we have verified that this loading (denoted as 5 PH) is quasi-static.
which represents ΔtG
= 11650 h , where h = 1 × 10–14 s is the used time step in MD. At loading level of 1 GPa we have verified that this loading (denoted as 5 PH) is quasi-static.
Loading is realized in mode I (in the x2
= [001] direction) by applying external forces  to each atom li in the 6 upper and lower BW surface layers (001) in figure 1. This distribution of external forces enables us to avoid damage at the loaded BW borders.
In thermal MD simulations, the relaxed atomic configuration is heated to an initial temperature Ti
by prescribing random atomic velocities to individual atoms according to Maxwell-Boltzmann distribution. The initial kinetic energy in the ensemble corresponds to  where kB
is the Boltzmann constant and N stands for the total number of atoms given above. During heating period, the system is not loaded, i.e. Newtonian equations are solved with zero external forces. During the time integration of Newtonian equations, the total kinetic energy Ekin = Ekin(t) and the potential energy Epot = Epot (t, 0) = Epot(t) - Epot(0) in the system fluctuate [8]. With increasing time, Ekin gradually decreases and Epot increases since the atoms deviate from their equilibrium positions and the atomic lattice is subject to thermal expansion. After some relaxation time, a steady state is reached in the system, corresponding to desired temperature T. Here T is given by Boltzmann relation for three degree of freedom
where kB
is the Boltzmann constant and N stands for the total number of atoms given above. During heating period, the system is not loaded, i.e. Newtonian equations are solved with zero external forces. During the time integration of Newtonian equations, the total kinetic energy Ekin = Ekin(t) and the potential energy Epot = Epot (t, 0) = Epot(t) - Epot(0) in the system fluctuate [8]. With increasing time, Ekin gradually decreases and Epot increases since the atoms deviate from their equilibrium positions and the atomic lattice is subject to thermal expansion. After some relaxation time, a steady state is reached in the system, corresponding to desired temperature T. Here T is given by Boltzmann relation for three degree of freedom  where
where  is the time averaged value of the total kinetic energy in the system in the steady state (see e.g. Figure 1(b) in [8]) with
  = 1.237 × 10⁻¹⁴ J and T = 295.1 K at time t = 2000 h. In statistical mechanics (thermodynamics), the heated atomistic sample in the steady state corresponds to canonical ensemble (N,V,T) with a constant number of particles N, constant temperature T and constant volume
  where α is a coefficient of thermal expansion, which for the used potential agree well with experimental data for bcc iron [21]. This character of the ensemble remains practically unchanged after loading, as presented and discussed in [8].
After heating th edge crack in MD undergoes thermal vibrations. We decided to start with external loading of the 3D atomistic sample at time step 2000 where temperature corresponds to temperature of ∼ 295 K (22 °C) and the monitored maximum crack opening displacement (COD) fluctuates around zero values. (The tests with a smaller time step of 0.5 × 10⁻¹⁴ s did not improve the results.)
Beside COD, also energy balance in the system, i.e. Epot, Ekin and the work Wext done by external forces are monitored each time step, further the crack length in the middle of the crystal (at B/2, layer 16) and the total number of interatomic interactions in the system LINT. At selected time steps, the coordinates and the local number of interatomic interactions KNT(li) are saved at all atoms for the graphical treatment of MD results. In analogy with the dependencies P—t and P—ΔL, in MD we monitor the dependencies RK—t and RK—COD each time step, where  denotes the resulting interatomic force in the direction x2
= [001] in one half of the 3D crystal in figure 1. We use our in-house MD code for 3D simulations. The graphical 3D and 2D visualization of MD results was created using commercial programming platform Matlab (R2018a, The Mathworks, Inc., MI, USA).
denotes the resulting interatomic force in the direction x2
= [001] in one half of the 3D crystal in figure 1. We use our in-house MD code for 3D simulations. The graphical 3D and 2D visualization of MD results was created using commercial programming platform Matlab (R2018a, The Mathworks, Inc., MI, USA).
3. Results and discussions
Except for the core zone where singularity occurs at crack tips or dislocation cores in continuum models, the continuum solutions should be valid at further distances from the core on a macro-scale and also on the atomic scale under equivalent boundary conditions, namely in the case of self-similar linear fracture mechanics (LFM). The comparison of LFM and MD solutions at further distances from the core zone allows us to verify the atomistic and continuum models mutually.
In section 3.1, we present the results of MD simulations at temperature of ∼ 0 K focused mainly on the comparison with continuum predictions from LFM, that do not take into account the random thermal atomic motion. The results at ∼ 0 K from section 3.1 are also needed for comparison later in the section 3.2 to assess the effect of thermal activation at room temperature.
3.1. MD results with initial temperature of 0 K and comparison with LFM predictions
3.1.1. Longer edge crack 

The comparison of the stress field by LFM and MD was performed at applied stress level of 1 GPa. The applied stress is within the linear (elastic) region of the theoretical stress—strain dependence for the potential used, presented in figure 1 in [14]. The faster linear loading 5 PH (2.92 kN s−1) showed no change in the total number of interactions LINT monitored via MD code. Stress calculations on the atomistic level were performed using the inter-planar concept presented in [22]. We stopped the linear loading at time step 6332 h at the level of σA = 1 GPa and using the critical viscous damping in Newtonian equations of motion we obtained the static atomic configuration in the 3D atomistic sample loaded in mode I. Comparison of MD static stress components Sx , Sy and T-stress on the x-axis (angle θ = 0) with the continuum predictions by anisotropic LFM [6] for the (001)[110] edge crack

is presented in figures 3(a) and (b). Here,  further
  and the function Re(μ1
μ2
) of the complex variables μ1,
μ2
depends on plane strain or plane stress state in the atomistic sample. Figure 3(c) shows the instantaneous stress component S33 from MD on the x-axis at the applied stress of 1 GPa. Here it is obvious that plane strain state with σz
> 0 prevails only in the nearest vicinity of the crack tip where the peak occurs, while in the larger part of the sample plane stress state prevails with σz
∼ 0. For that reason we consider
and the function Re(μ1
μ2
) of the complex variables μ1,
μ2
depends on plane strain or plane stress state in the atomistic sample. Figure 3(c) shows the instantaneous stress component S33 from MD on the x-axis at the applied stress of 1 GPa. Here it is obvious that plane strain state with σz
> 0 prevails only in the nearest vicinity of the crack tip where the peak occurs, while in the larger part of the sample plane stress state prevails with σz
∼ 0. For that reason we consider  valid for plane stress [35]. The boundary correction factor is
  by [37] for
  while
while  from [18, 19]. The LFM solution is denoted in figures 3(a) and (b) by lines, MD results via circles (o) and r means the distance from the crack tip on the x-axis, oriented in the
 ![$[\bar{1}10]$](https://content.cld.iop.org/journals/2053-1591/9/3/036508/revision2/mrxac5708ieqn32.gif) direction. Regarding MD, some initial stress arises at the crack front in the atomistic sample after the surface relaxation. The maximum values at the crack tip of the longer crack are
direction. Regarding MD, some initial stress arises at the crack front in the atomistic sample after the surface relaxation. The maximum values at the crack tip of the longer crack are 

 and they are relatively small in comparison with the peak values at the crack tip under the loading. The initial stresses have to be excluded when comparing MD results with LFM solution. Thus, the values from MD, noted (o) in figures 3(a) and (b), are taken as follows:
 and
and  Relation for TMD
follows from equation (1). The agreement between the static atomic stress Sx
, Sy
and the LFM components σx
, σy
is very good in the interval
Relation for TMD
follows from equation (1). The agreement between the static atomic stress Sx
, Sy
and the LFM components σx
, σy
is very good in the interval  Here
Here  is a dimensionless distance where
  As for T-stress, in the nearest vicinity of the crack tip, an anisotropic solution
  for the biaxial loading from [6] rather prevails, while the isotropic static solution
  prevails with increasing distance r/do from the crack tip toward the right free surface BL. The agreement mentioned above is not trivial; it confirms the self-similar LFM character (no information on boundary correction factors exists in MD simulations) and justifies the concept used in this study.

Figure 3. The longer edge crack a = 64 d110 . Comparison of the static stress from MD (o) with LFM solution (─) at the applied stress level of 1 GPa in the middle of the crystal (at B/2, layer 16): (a) normal stress component Sy from MD (o) versus LFM curve σy ; (b) LFM curve σx versus Sx from MD (o) and below T-stress (LFM line) versus T-stress from MD (o); (c) stress component S33 in MD during linear loading 5 PH (dP/dt = 2.92 kN s−1) at the applied stress level of 1 GPa, the peak stress is at the crack tip point.
Download figure:
Standard image High-resolution imageUnder the linear loading of 5 PH (2.92 kN s−1) up to a high stress level the crack initiation in MD was monitored already in the vicinity of the lower Griffith stress 1.84 GPa, corresponding to the Griffith stress intensity KG
= 0.835MPa m1/2 for plane stress, i.e. at  = 1.84 GPa which follows from LFM for cleavage fracture. To investigate the microscopic processes at crack initiation and to avoid discussions of dynamic effects, such as flight time corrections of the loading waves, etc, we use a quasi-static ramp loading presented in figure 13 for temperature of 295 K. In linear region, the loading rate corresponds to 5 PH (2.92 kN s−1), which means a stress rate 1.84 GPa/11650 h for our atomistic 3D specimen. At temperature of 0 K, the loading starts at t = 0 h. For t ≥ 11650 h the applied stress in MD is kept at a constant level SA = 1.84 GPa. Brittle fracture in this run is illustrated in figure 4 by overall shape of the fractured atomistic sample at the end of the simulation. The dependencies RK—time step and RK—COD in figures 5(a) and (b) show that the sample was fractured at a time step ∼ 17650 h (when RK ∼ 0) and when COD corresponds to ∼ 40 Å. The peak value RKmax = 0.336 × 10⁻⁶ N corresponds to a global critical stress in the atomistic sample
  =1.82 GPa, which agrees very well with the independent LFM prediction σG
= 1.84 GPa for cleavage fracture. This means that the peak value RKmax can be related to fracture toughness of the atomistic sample via the relation
=1.82 GPa, which agrees very well with the independent LFM prediction σG
= 1.84 GPa for cleavage fracture. This means that the peak value RKmax can be related to fracture toughness of the atomistic sample via the relation  similar to Pmax in fracture experiments. The values KMD
and
similar to Pmax in fracture experiments. The values KMD
and  are KMD
= 0.825 MPa m1/2 and GMD
= 3.54 J m−2 using the elastic stiffness coefficient C = 5.198 × 10⁻¹² m2/N for plane stress. These data are close to Griffith values KG
= 0.835MPa m1/2 and 2γ001 = 3.612 J m−2 expected for cleavage fracture. Nevertheless, graphical treatment of MD results shows that this is not a pure cleavage fracture.
are KMD
= 0.825 MPa m1/2 and GMD
= 3.54 J m−2 using the elastic stiffness coefficient C = 5.198 × 10⁻¹² m2/N for plane stress. These data are close to Griffith values KG
= 0.835MPa m1/2 and 2γ001 = 3.612 J m−2 expected for cleavage fracture. Nevertheless, graphical treatment of MD results shows that this is not a pure cleavage fracture.

Figure 4. Fracture of the atomistic sample with edge crack a = 64 d110 , loaded up to Griffith level of 1.84 GPa with loading rate 5 PH, temperature of 0 K, time step 18000.
Download figure:
Standard image High-resolution image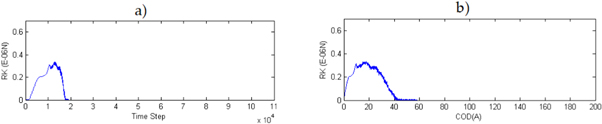
Figure 5. Development of the resulting force RK in one half of the 3D atomistic sample at temperature of 0 K under the ramp loading 5 PH with constant Griffith level SA = σG = 1.84 GPa for plane stress: (a) in dependence on time; (b) in dependence on COD up to complete fracture, where RK approaches zero values.
Download figure:
Standard image High-resolution imageThe crack was initiated in the middle layer 16 (figure 6(b)) already at time step ti
= 10978 h, while no crack advance is monitored in the first surface layer 1 in the [110] direction due to dislocation emission on  oblique slip systems, shown in figure 6(a). The situation in the last surface layer 30 is similar to layer 1. A scheme for this emission is in the right part of figure 6(a). The emission can be thought like a block like shear (BLS) process (see [23, 24]), where the upper plane (011) containing the blue crack tip atom A is rigid and the lower plane (011), containing the red atom B, is the moving plane in the direction of the Burgers vector b oriented in the
 ![$[11\bar{1}]$](https://content.cld.iop.org/journals/2053-1591/9/3/036508/revision2/mrxac5708ieqn49.gif) direction. 3D visualization of the dislocation emission from the edge crack is presented in figure 6(c) using the local numbers of interactions KNT(li) of the individual atoms li from MD with the used short ranged potential [20]. Dislocation cores in figure 6(c) are shown via the red atoms with KNT = 16, in agreement with BLS simulation of dislocation generation in perfect crystals. The atoms lying on free {110} surfaces with KNT = 10 are blue and the atoms lying on the free crack surfaces (001) with KNT = 9 are yellow. Note that the KNT numbers are valid just for the short ranged potentials, where the coordination number at one atom in the perfect bcc lattice is KNT = 14, as in our case. The coordination numbers KNT at the atoms lying on free surfaces are lower due to missing interatomic interactions.
direction. 3D visualization of the dislocation emission from the edge crack is presented in figure 6(c) using the local numbers of interactions KNT(li) of the individual atoms li from MD with the used short ranged potential [20]. Dislocation cores in figure 6(c) are shown via the red atoms with KNT = 16, in agreement with BLS simulation of dislocation generation in perfect crystals. The atoms lying on free {110} surfaces with KNT = 10 are blue and the atoms lying on the free crack surfaces (001) with KNT = 9 are yellow. Note that the KNT numbers are valid just for the short ranged potentials, where the coordination number at one atom in the perfect bcc lattice is KNT = 14, as in our case. The coordination numbers KNT at the atoms lying on free surfaces are lower due to missing interatomic interactions.

Figure 6. Crack initiation accompanied by the oblique dislocation emission  under the ramp loading 5 PH, time step 11300, temperature of 0 K : (a) detail from the first surface layer 1 in the direction [110]; on the right - a scheme for the emission, the moving atom B is red, the crack tip atom A is blue; (b) crack initiation in a middle layer 16, the original crack tip atom is blue; (c) 3D visualization of the dislocation emission and of the edge crack: dislocation cores are shown by the red color; the free {110} surfaces are blue; the free crack surfaces (001) are yellow; on the left side—a view
  towards the crack front and the left sample surfaces; on the right side—an image showing the curved crack front after the oblique dislocation emission.
Download figure:
Standard image High-resolution imageAs it follows from the geometry of the bcc lattice, the nonzero relative displacements at dislocation emission in figure 6(a) are the components  in the y = [001] direction and
  in z = [110]. The relative displacement of the lower part of the crystal with respect to the upper part is

where  and
and  for oblique slip
  In agreement with Rice model [9], we consider the emission to be complete when the relative shear displacement
  in the
 ![$[11\bar{1}]$](https://content.cld.iop.org/journals/2053-1591/9/3/036508/revision2/mrxac5708ieqn58.gif) direction reaches the value
direction reaches the value  i.e. when
  which is shown in figure 7 by the horizontal line at the level 1. Figure 7 comes from the continuous monitoring of the displacements of the two atoms A and B in MD at the lower crack face in the first surface layer (110). The time where the horizontal line 1 intersects the
  -curve from MD data is the time of the emission te
= 10836 h. This means that dislocation emission
-curve from MD data is the time of the emission te
= 10836 h. This means that dislocation emission  slightly precedes the crack initiation in the middle, i.e.
  However, figures 6(a) and (c) show that the oblique slip patterns later deviate to horizontal direction, which indicate the change of the slip plane.
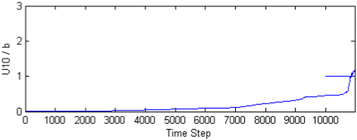
Figure 7. Time development of the relative shear displacements U10/b in MD on oblique slip system  at the free crystal surface (layer 1) during the dislocation emission at temperature of 0 K. Complete dislocation emission occurs when U10/b reaches the value 1, denoted by horizontal line.
Download figure:
Standard image High-resolution imageRecognition of slip patterns in 3D can be performed in small perfect bcc crystal via independent block like shear (BLS) simulation mentioned above. The BLS simulations are described in detail e.g. in [24] and presented here in figure 8. Figure 8(a) is related to the lower oblique pattern at the crack tip A in figure 6(a), coming from the oblique slip plane (011). The slip plane (011) in figure 8(a) intersects our observation plane (110) in the ![$[\bar{1}1\bar{1}]$](https://content.cld.iop.org/journals/2053-1591/9/3/036508/revision2/mrxac5708ieqn65.gif) direction under an angle ∼ 35° (
direction under an angle ∼ 35° ( ) with respect to the horizontal axis of crack extension. After BLS in the b direction
 ![$[11\bar{1}]$](https://content.cld.iop.org/journals/2053-1591/9/3/036508/revision2/mrxac5708ieqn67.gif) it creates the pattern shown in the middle in figure 8(a). This is the same pattern as the lower oblique slip trace in figure 6(a) after dislocation emission on the oblique plane (011). The upper slip patterns in figure 6(a) come from the mirror oblique plane
it creates the pattern shown in the middle in figure 8(a). This is the same pattern as the lower oblique slip trace in figure 6(a) after dislocation emission on the oblique plane (011). The upper slip patterns in figure 6(a) come from the mirror oblique plane  The oblique dislocation is initially emitted from the surface crack tip as a short curved dislocation that extends gradually under the shear stress on the (011) plane. When such dislocation reaches the straight screw character, parallel with the Burgers vector b =
 ![$[11\bar{1}]$](https://content.cld.iop.org/journals/2053-1591/9/3/036508/revision2/mrxac5708ieqn69.gif) shown in figure 8 (this vector lies both in the (011) and (112) slip planes), the screw dislocation may change the slip plane to (112) via the cross slip. BLS patterns arising in our observation plane (110) after the slip
shown in figure 8 (this vector lies both in the (011) and (112) slip planes), the screw dislocation may change the slip plane to (112) via the cross slip. BLS patterns arising in our observation plane (110) after the slip $](https://content.cld.iop.org/journals/2053-1591/9/3/036508/revision2/mrxac5708ieqn70.gif) are shown in figure 8(b). This slip creates a horizontal trace given by the horizontal intersection line of planes (112) and (110), parallel with the
are shown in figure 8(b). This slip creates a horizontal trace given by the horizontal intersection line of planes (112) and (110), parallel with the ![$[\bar{1}10]$](https://content.cld.iop.org/journals/2053-1591/9/3/036508/revision2/mrxac5708ieqn71.gif) direction of the crack extension. Figure 8(b) illustrates that the slip leads to separation of planes (001), which can help with cleavage along these planes. This is illustrated in figure 9 for the cracked MD sample at a later time 13000 h after the crack initiation and multiple dislocation emissions at the free WL surfaces (110). The multiple surface emissions to oblique
direction of the crack extension. Figure 8(b) illustrates that the slip leads to separation of planes (001), which can help with cleavage along these planes. This is illustrated in figure 9 for the cracked MD sample at a later time 13000 h after the crack initiation and multiple dislocation emissions at the free WL surfaces (110). The multiple surface emissions to oblique  slip systems and the subsequent cross slip of the emitted dislocations to oblique slip planes {112} in figures 9(a) and (c) causes at the interior cleavage planes (001) the mentioned separation, which assist the crack extension in the interior of the crystal—see the detail in the middle layer 16 along the crack front in figure 9(b). Again, the scheme in figure 9(b) is valid for the lower slip patterns. The upper horizontal slip patterns come from the mirror oblique plane
  The process described above is a new (unpublished) mechanism for a brittle extension of the edge crack (001)[110].
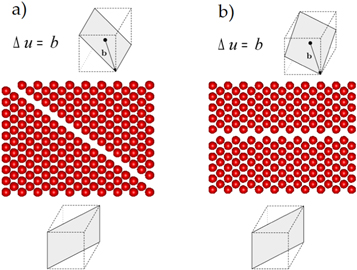
Figure 8. Recognition of slip patterns in perfect samples by the block like shear (BLS) simulations. On the left: a scheme for an oblique slip system $](https://content.cld.iop.org/journals/2053-1591/9/3/036508/revision2/mrxac5708ieqn74.gif) and the slip patterns on the observation (110) plane caused by the oblique slip. On the right: an oblique slip system
and the slip patterns on the observation (110) plane caused by the oblique slip. On the right: an oblique slip system $](https://content.cld.iop.org/journals/2053-1591/9/3/036508/revision2/mrxac5708ieqn75.gif) and the traces arising on (110) plane after the oblique slip.
and the traces arising on (110) plane after the oblique slip.
Download figure:
Standard image High-resolution image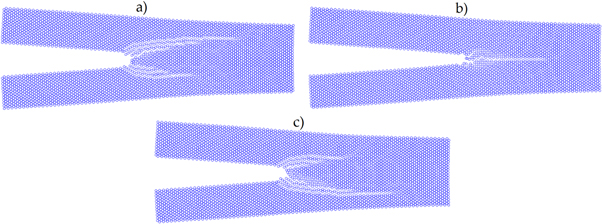
Figure 9. Crack development at time 13000 h, run 5 PH, temperature of 0 K: (a) surface layer 1—horizontal slip patterns above and below the crack comes from the cross slip of screw dislocation segments onto oblique slip systems  (b) middle layer 16—cross slip contributes to separation of the (001) planes, which facilitates fracture; (c) situation in the last surface layer 30 is opposite to layer 1.
Download figure:
Standard image High-resolution imageThe process is possible also in anisotropic LFM at Griffith level KG , where KG is considered a material parameter that does not depend on sample dimensions.
In the oblique slip system $](https://content.cld.iop.org/journals/2053-1591/9/3/036508/revision2/mrxac5708ieqn77.gif) slip stress τb
can be obtained by transformation of the stress tensor from the original coordinate system in figure 1: x1
=
slip stress τb
can be obtained by transformation of the stress tensor from the original coordinate system in figure 1: x1
= ![$[\bar{1}10],$](https://content.cld.iop.org/journals/2053-1591/9/3/036508/revision2/mrxac5708ieqn78.gif) x2
= [001], x3
= [110] into a new coordinate system: 'x1
= [011], 'x2
=
x2
= [001], x3
= [110] into a new coordinate system: 'x1
= [011], 'x2
= ![$[2\bar{1}1],$](https://content.cld.iop.org/journals/2053-1591/9/3/036508/revision2/mrxac5708ieqn79.gif) 'x3
=
'x3
= ![$[11\bar{1}]$](https://content.cld.iop.org/journals/2053-1591/9/3/036508/revision2/mrxac5708ieqn80.gif) where the component 'σ13
= τb
.
where the component 'σ13
= τb
.

Here θ ∼ 35° as described above, and the other quantities for plane stress conditions at the free surfaces (110) by [35] are: σ33
= 0, μ1
= +0.6863 + 0.9032i, μ2
= −0.6863 + 0.9032i, f12
= 0.234, f22
= 1.209, f33
= 0.715. At the nearest vicinity of the crack tip r = b/2 one obtains with KG
= 0.835MPa m1/2 for plane stress the value τb
= 16.8 GPa by LFM. This value exceeds the stress barrier τdisl
= 14.5 GPa for the slip  with the used potential. Thus, the oblique dislocation emission observed in MD is possible also by LFM. Moreover, the LFM value of 16.8 GPa is greater also by independent Frenkel prediction, where the stress barrier is
  using for shear modulus in the 〈111〉 direction the relation
As to oblique slip system ,$](https://content.cld.iop.org/journals/2053-1591/9/3/036508/revision2/mrxac5708ieqn84.gif) the plane (112) intersects the observation plane (110) under the angle θ = 0 (see figure 8(b)) and the new coordination system is 'x1
=
the plane (112) intersects the observation plane (110) under the angle θ = 0 (see figure 8(b)) and the new coordination system is 'x1
= ![$[\bar{1}10],$](https://content.cld.iop.org/journals/2053-1591/9/3/036508/revision2/mrxac5708ieqn85.gif) 'x2
= [112], 'x3
=
'x2
= [112], 'x3
= ![$[11\bar{1}].$](https://content.cld.iop.org/journals/2053-1591/9/3/036508/revision2/mrxac5708ieqn86.gif) The slip stress 'σ23
= τb
is:
The slip stress 'σ23
= τb
is:

since f22 (θ, μ1, μ2 ) = 1 for θ = 0. At the free surface where the cross slip begins, the normal stress component σ33 = 0 and the slip stress are given by a simple relation

In slip system $](https://content.cld.iop.org/journals/2053-1591/9/3/036508/revision2/mrxac5708ieqn87.gif) the Schmid factor is ∼ 0.47, thus it is larger than in the original slip system
the Schmid factor is ∼ 0.47, thus it is larger than in the original slip system $](https://content.cld.iop.org/journals/2053-1591/9/3/036508/revision2/mrxac5708ieqn88.gif) where Schmid factor is ∼ 0.41. This is a qualitative explanation why the cross slip is realized in MD. Figure 6(a) shows that the cross slip begins at the distance of about r = 8b from the crack tip under the critical level of loading KI
= KG
= 0.835MPa m1/2, which gives by LFM relations (4) and (5): τb
= 3.51 GPa. This value is larger than Peierls stress τP
∼ 2 GPa needed for motion of screw dislocation in a perfect bcc Fe crystal at temperature of ∼ 0 K, as presented in a recent comparative study [25]. On the other hand, the LFM relation (5) shows, that for the distance r = b/2 from the crack tip and the same loading KG
= 0.835MPa m1/2, the stress concentration in the
where Schmid factor is ∼ 0.41. This is a qualitative explanation why the cross slip is realized in MD. Figure 6(a) shows that the cross slip begins at the distance of about r = 8b from the crack tip under the critical level of loading KI
= KG
= 0.835MPa m1/2, which gives by LFM relations (4) and (5): τb
= 3.51 GPa. This value is larger than Peierls stress τP
∼ 2 GPa needed for motion of screw dislocation in a perfect bcc Fe crystal at temperature of ∼ 0 K, as presented in a recent comparative study [25]. On the other hand, the LFM relation (5) shows, that for the distance r = b/2 from the crack tip and the same loading KG
= 0.835MPa m1/2, the stress concentration in the $](https://content.cld.iop.org/journals/2053-1591/9/3/036508/revision2/mrxac5708ieqn89.gif) slip system is lower (τb
∼ 14 GPa) than in the slip system
slip system is lower (τb
∼ 14 GPa) than in the slip system $](https://content.cld.iop.org/journals/2053-1591/9/3/036508/revision2/mrxac5708ieqn90.gif) treated above. Moreover, the value of ∼ 14 GPa is not sufficient for a direct generation of dislocation in the slip system 〈111〉{112} where the stress barrier is τdisl
= 16.3 GPa [6] with the used potential. In other words, the anisotropy of the stress field described by LFM relations (3), (4) and (5) explains why the surface dislocations are initially generated in the oblique slip systems
treated above. Moreover, the value of ∼ 14 GPa is not sufficient for a direct generation of dislocation in the slip system 〈111〉{112} where the stress barrier is τdisl
= 16.3 GPa [6] with the used potential. In other words, the anisotropy of the stress field described by LFM relations (3), (4) and (5) explains why the surface dislocations are initially generated in the oblique slip systems  and later perform the cross slip to oblique system
  Since the atomistic results agree with LFM predictions that cover crack behavior also on macro-scale, realization of the presented micro-mechanism is probable also in macroscopic specimens.
3.1.2. Short edge crack under slower loading 1 PH

Slower loading of 1 PH (i.e. dP/dt = 0.584 kN s−1 for 1 mm min−1 in experiment) is given in MD by the relation  For the short crack we used a stress rate 4.19 GPa/132580 h that obeys the equation above, since the loaded area BW of the atomistic sample is the same as in the case of the longer crack in section 3. 1.1, i.e. (BW)MD
= 1.8488 × 10⁻¹⁶ m2. Figure 10 illustrates that the loading is sufficiently slow to achieve an agreement with the static LFM prediction at an applied stress level of 1 GPa without any damping in Newtonian equations of motion. In other words, dynamic effects in MD are negligible in this case and figure 10 confirms that the same boundary correction factors can be used for the atomistic 3D sample as predicted by LFM for macro-specimens. The other stress components have a similar character as in figure 3.
For the short crack we used a stress rate 4.19 GPa/132580 h that obeys the equation above, since the loaded area BW of the atomistic sample is the same as in the case of the longer crack in section 3. 1.1, i.e. (BW)MD
= 1.8488 × 10⁻¹⁶ m2. Figure 10 illustrates that the loading is sufficiently slow to achieve an agreement with the static LFM prediction at an applied stress level of 1 GPa without any damping in Newtonian equations of motion. In other words, dynamic effects in MD are negligible in this case and figure 10 confirms that the same boundary correction factors can be used for the atomistic 3D sample as predicted by LFM for macro-specimens. The other stress components have a similar character as in figure 3.
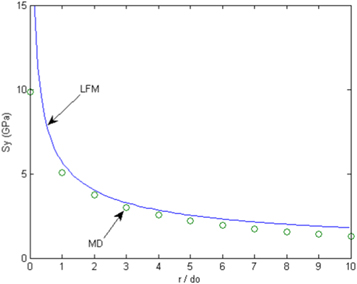
Figure 10. Short edge crack a = 46 d110
, temperature of 0 K, slow linear loading 1 PH (dP/dt = 0.584 kN s−1). Comparison of instantaneous MD results (o) at the lower applied stress of 1 GPa in front of the crack tip at distance r with the static LFM prediction (–) for the normal stress component S22 from MD and  where
where 
 from [37] and σA
= 1 GPa.
from [37] and σA
= 1 GPa.
Download figure:
Standard image High-resolution imageWith increasing linear loading 1 PH, the crack was initiated in the middle of the crystal (layer 16) at the applied stress σi
= 3.013 GPa. Corresponding stress intensity is  with FI
= 1.68 by [37] for a/W ∼ 0.3 and Gi
= 3.898 J m−2. Similar to the fast loading 5 PH in section 3.1.1 the crack initiation is accompanied by the surface dislocation emission on the oblique slip systems
with FI
= 1.68 by [37] for a/W ∼ 0.3 and Gi
= 3.898 J m−2. Similar to the fast loading 5 PH in section 3.1.1 the crack initiation is accompanied by the surface dislocation emission on the oblique slip systems  which occurs at the lower crack face at time step te
= 95394 h under applied stress σe
= 3. 0205 GPa. The corresponding stress intensity and energy release rate are Ke
= 0.868 MPa m1/2 and Ge
= 3.916 J m−2. Unlike 5 PH, by slow loading of 1 PH the prevailing type of plastic processes is oblique twinning generated by the crack itself or by the emitted oblique dislocations
which occurs at the lower crack face at time step te
= 95394 h under applied stress σe
= 3. 0205 GPa. The corresponding stress intensity and energy release rate are Ke
= 0.868 MPa m1/2 and Ge
= 3.916 J m−2. Unlike 5 PH, by slow loading of 1 PH the prevailing type of plastic processes is oblique twinning generated by the crack itself or by the emitted oblique dislocations  This is illustrated in figures 11 and 12.
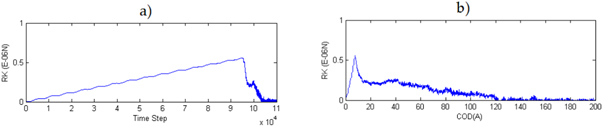
Figure 11. Resulting force RK in one half of the crystal with edge crack a = 46 d110 under slow loading 1 PH and temperature of 0 K: (a) in dependence on time step h; (b) in dependence on the crack opening displacement COD.
Download figure:
Standard image High-resolution image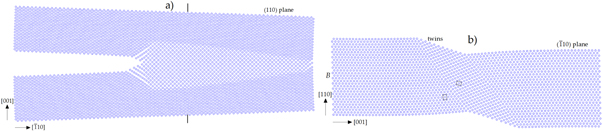
Figure 12. Oblique twinning  at the short crack a = 46 d110
during slow loading 1 PH at time step 97000 h, temperature of 0 K: (a) detail in the middle layer 16 in the standard observation plane (110); (b) detail in the perpendicular plane
at the short crack a = 46 d110
during slow loading 1 PH at time step 97000 h, temperature of 0 K: (a) detail in the middle layer 16 in the standard observation plane (110); (b) detail in the perpendicular plane  in front of the crack—cut position through the thickness B in the atomistic 3D sample is marked by vertical lines in figure 12(a).
Download figure:
Standard image High-resolution imageThe atomistic fracture curves RK—t and RK—COD are shown in figures 11(a) and (b). The atomistic sample was fractured at time tf
∼ 103300 h (when RK ∼ 0) after a relative large plastic deformation, characterized by a large final CODf
∼ 123 Å. Maximum RK corresponds to 0.56 × 10⁻⁶ N, corresponding critical stress is σMD
= RKmax/(BW)MD
= 3.029 GPa and fracture toughness of the atomistic sample is KMD
= 0.871 MPa m1/2 with GMD
= 3.942 J m−2. These values are greater than in the case of the longer crack under the fast loading 5 PH. Figure 12(a) shows a plastic zone created in front of the crack in our observation plane (110), layer 16. Figure 12(b) is a detail in a perpendicular plane  and it clearly shows that the plastic zone is caused by twinning on the oblique planes (112). No significant cross slip of the emitted dislocations to {112} planes was monitored in MD at temperature of ∼ 0 K and loading rate 1 PH. The oblique twins in front of the crack removes the LFM stress concentration at the crack, which hinders the further crack advance. The final character of fracture under slow loading 1 PH is more ductile, which illustrates the larger value of CODf
∼ 123 Å in comparison with the faster loading 5 PH, where CODf
∼ 40 Å.
and it clearly shows that the plastic zone is caused by twinning on the oblique planes (112). No significant cross slip of the emitted dislocations to {112} planes was monitored in MD at temperature of ∼ 0 K and loading rate 1 PH. The oblique twins in front of the crack removes the LFM stress concentration at the crack, which hinders the further crack advance. The final character of fracture under slow loading 1 PH is more ductile, which illustrates the larger value of CODf
∼ 123 Å in comparison with the faster loading 5 PH, where CODf
∼ 40 Å.
To assess generation of the oblique twins in the oblique slip system $](https://content.cld.iop.org/journals/2053-1591/9/3/036508/revision2/mrxac5708ieqn104.gif) by the crack itself we may use the LFM prediction (5) and consider a distance r = b = 2.4825 Å and KI
= KMD
= 0.871MPa m1/2 corresponding to RKmax mentioned above. We obtain larger slip stress τb
than the stress barrier τtwin
for twin generation presented in [24] for the used potential:
by the crack itself we may use the LFM prediction (5) and consider a distance r = b = 2.4825 Å and KI
= KMD
= 0.871MPa m1/2 corresponding to RKmax mentioned above. We obtain larger slip stress τb
than the stress barrier τtwin
for twin generation presented in [24] for the used potential:

Estimate of the stress barrier by Frenkel model  gives a reasonable value τF
= 8.4 GPa, if one considers the distance
gives a reasonable value τF
= 8.4 GPa, if one considers the distance  since 3-layers twin is the minimum for its stability [26, 27]. This short discussion shows that oblique twinning on planes {112} in front of the crack is possible also by continuum predictions, which implies its possibility also in experimental macro-specimens. Note that twins can arise also via dissociation of the core both in the case of the screw [28] and edge dislocations [29]—see e.g. Figures 9(a) and (c).
MD simulations at ∼ 0 K also show that the threshold values for emission of the oblique dislocations  and oblique twins at the crack front are somewhat different:

The threshold values can be changed by thermal activation in the system which is presented in the next section.
3.2. MD results at the room temperature and their comparison with fracture experiments
As mentioned in section 2, loading in this section starts after the previous heating at the time step 2000 h in all presented simulations at 295 K—see figure 13. In this section we will compare MD results for a longer crack a = 64 d110 under fast loading 5 PH and the short crack a = 46 d110 under slower loading 1 PH, which is relevant for fracture experiment in [3].
3.2.1. Longer edge crack under the ramp loading 5 PH, dP/dt = 2.92 kN s−1

MD simulations with initial temperature of 0 K in section 3.1 showed that the initiation of edge crack in the interior of the 3D crystal was correlated with the surface oblique emission  Since dislocation emission is a thermally activated process, we start with searching of threshold values for fracture at elevated temperature of 295 K using the ramp loading from figure 13, where the linear phase of loading corresponds to
  via the relation
  similar to simulations at 0 K. The results are summarized in table 1.
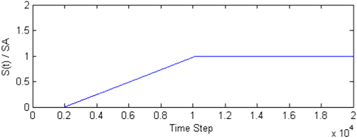
Figure 13. Scheme of the ramp loading at temperature of 295 K with loading rate 5 PH (dP/dt = 2.92 kN s−1 ) for the longer edge crack a = 64 d110 . (Under the slower loading 1 PH for the crack a = 46 d110 , the smaller slope is applied in the linear region, corresponding to dP/dt = 0.584 kN s−1). At temperature of 0K, the ramp loading starts at t = 0 h, while at 295 K it starts at t = 2000 h.
Download figure:
Standard image High-resolution imageTable 1.
MD results at temperature of (a) 295 K; (b) 0 K for the edge crack a = 64 d110
and ramp loading 5 PH (dP/dt = 2.92 kN/s) in mode I. The quantity te
/h means the dimensionless time of the dislocation emission (e)  and σe
, Ke
and Ge
are the corresponding applied stress, applied stress intensity and energy release rate at the time te
. Similarly, the quantity ti
/h is related to crack initiation (i) in the middle of the crystal (at B/2) and σi
, Ki,
Gi
are related to the applied stress, etc at this time ti
. The quantity RKm is the maximum value of the resulting interatomic force in one half of the crystal in L-direction [001] at a time tm
(preceding the emission and initiation), further
and σe
, Ke
and Ge
are the corresponding applied stress, applied stress intensity and energy release rate at the time te
. Similarly, the quantity ti
/h is related to crack initiation (i) in the middle of the crystal (at B/2) and σi
, Ki,
Gi
are related to the applied stress, etc at this time ti
. The quantity RKm is the maximum value of the resulting interatomic force in one half of the crystal in L-direction [001] at a time tm
(preceding the emission and initiation), further  and KMD,
GMD
are the LFM quantities corresponding to σMD
. The last quantities CODf
and Wf
/BW are the final crack opening displacement and work done by external (applied) forces at the time tf
of the final fracture (f) and BW is the loaded area of the atomistic sample in figure 1.
and KMD,
GMD
are the LFM quantities corresponding to σMD
. The last quantities CODf
and Wf
/BW are the final crack opening displacement and work done by external (applied) forces at the time tf
of the final fracture (f) and BW is the loaded area of the atomistic sample in figure 1.
| (a) Temperature of 295 K | |||||||||||||||
|---|---|---|---|---|---|---|---|---|---|---|---|---|---|---|---|
| dσ/dt | Emission | σe | Ke | Ge | Initiation | σi | Ki | Gi | RKm | σMD | KMD | GMD | CODf | fracture | Wf /BW |
| GPa/h | te /h | GPa | MPa m1/2 | J m−2 | ti /h | GPa | MPa m1/2 | J m−2 | 10–6 N | GPa | MPa m1/2 | J m−2 | Å | tf /h | J m−2 |
| 1.84/11650 | 12080 | 1.59 | 0.72 | 2.71 | 12212 | 1.61 | 0.73 | 2.78 | 0.414 | 2.24 | 1.015 | 5.36 | 85–90 | 22100 | 22.52 |
| 1.61/10213 | 12083 | 1.59 | 0.72 | 2.70 | 12201 | 1.61 | 0.73 | 2.77 | 0.417 | 2.26 | 1.023 | 5.44 | 85 | 23487 | 17.92 |
| 1.59/10067 | 12083 | 1.59 | 0.72 | 2.70 | 12201 | 1.59 | 0.72 | 2.70 | 0.407 | 2.20 | 0.996 | 5.16 | 80 | 23500 | 17.22 |
| 1.50/9497 | 12075 | 1.50 | 0.68 | 2.40 | 12221 | 1.50 | 0.68 | 2.40 | 0.413 | 2.23 | 1.010 | 5.30 | 100 | 30000 | 21.97 |
| 1.40/8864 | 12080 | 1.40 | 0.64 | 2.10 | 12223 | 1.40 | 0.64 | 2.10 | 0.406 | 2.20 | 0.996 | 5.16 | 78–82 | 27000 | 14.42 |
| 1.30/8231 | 12050 | 1.30 | 0.59 | 1.81 | 12215 | 1.30 | 0.59 | 1.81 | 0.420 | no fracture 50000 h, oTwins 13500 h// | |||||
| 1.25/7914 | 12092 | 1.25 | 0.57 | 1.67 | 12224 | 1.25 | 0.57 | 1.67 | 0.418 | 2.26 | 1.025 | 5.46 | 85–90 | 34000 | 11.75 |
| 1.23/7788 | 12057 | 1.23 | 0.56 | 1.62 | 12239 | 1.23 | 0.56 | 1.62 | 0.416 | 2.25 | 1.020 | 5.41 | 79 | 36400 | 12.06 |
| 1.18/7471 | 12400 | 1.18 | 0.53 | 1.47 | 12412 | 1.18 | 0.53 | 1.47 | e + i , slow crack growth// | ||||||
| 1.17/7408 | 12128 | 1.17 | 0.53 | 1.44 | : e at layer 1, gener. at layer 30; transient i// | ||||||||||
| 1.15/7281 | 16000 | 1.15 | 0.52 | 1.39 | : transient e at 16000 h, no i | ||||||||||
| 1.10/6965 | 16000 | 1.10 | 0.49 | 1.27 | : transient e at 16000 h, no i | ||||||||||
| 1.00/6332 | 1 GPa: no e, no i , quasistatic loading | ||||||||||||||
| (b) Temperature of 0 K | |||||||||||||||
| dσ/dt | Emission | σe | Ke | Ge | Initiation | σi | Ki | Gi | RKm | σMD | KMD | GMD | CODf | fracture | Wf /BW |
| GPa/h | te /h | GPa | MPa m1/2 | J m−2 | ti /h | GPa | MPa m1/2 | J m−2 | 10–6 N | GPa | MPa m1/2 | J m−2 | Å | tf /h | J m−2 |
| 1.84/11650 | 10836 | 1.71 | 0.78 | 3.135 | 10978 | 1.73 | 0.79 | 3.21 | 0.336 | 1.82 | 0.825 | 3.538 | 40 | 17650 | 8.95 |
When the constant applied stress of 1 GPa was reached during 6332 h, no dislocation emission and no crack initiation were monitored in the time interval up to 30000 h. In the case 1.1 GPa/6965 h, only one transient attempt to emit the dislocation was detected via monitoring of U10/b mentioned above. Similarly, at the level of 1.15 GPa only a transient emission was monitored. Complete emission (only at the surface layer 1) was monitored in the case 1.17 GPa/7408 h at the time step 12128 h, while in last surface layer 30 only generation of the oblique dislocation was observed. As a consequence, only a transient crack initiation was monitored in the middle layer 16. Symmetrical oblique dislocation emission  was observed at both surfaces 1 and 30 under loading 1.18 GPa/7471 h at the time 12400 h and later (at 13500 h) also the cross slip to the oblique system
  The crack growth (monitored in the middle layer 16) was slow and no fracture was monitored up to time step 30000 h. The reason is the low applied stress level and beginning of twin formation in the oblique slip systems
  Similar situation was monitored at the loading 1.20 GPa/7598 h—see table 1.
Under a higher loading 1.23 GPa/7788 h a relatively fast crack growth was monitored, accompanied by the oblique emission  and subsequent cross slip to slip systems
  i.e. the same mechanism of crack growth was monitored both at 0 K and at 295 K. This is illustrated by figure 14 for time 13500 h. When the horizontal slip traces from screw dislocations
  cross the crack plane (001) on inner layers (110) (e.g. the layers 6, 16, etc) they prepare a pre-processing zone for easy crack extension via separation of the planes (001)—see figure 14(b) where the position of the original crack tip point is denoted via the arrow. Cleavage crack extension in middle layer 16 at later time is illustrated in figure 15(a). However, generation of the oblique twinning on planes {112} was observed in front of the crack before the final fracture (figure 15(b)), unlike corresponding simulations at ∼ 0 K in section 3.1.1. When the twins reach the right free surface BL, new stress concentrators arise at free surface BL and new oblique dislocations
  are emitted from the free surface. This increases crack opening and the final phase of fracture is realized via a small plastic necking of the atomistic sample. The final phase of fracture might be influenced by the finite sample dimensions. However, it did not occur at 0 K in figure 4 under the loading 5 PH and it may not occur even at 295 K, as mentioned below.
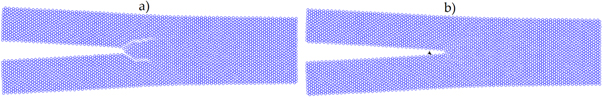
Figure 14. Atomic configuration at the crack a = 64 d110
under the ramp loading 5 PH at 295 K after the cross slip  time step 13500 h, dσ/dt = 1.23 GPa/7788 h: (a) surface layer 1; (b) middle layer 16.
Download figure:
Standard image High-resolution image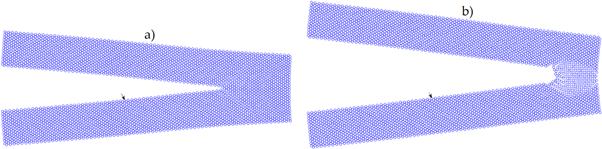
Figure 15. Crack extension in middle layer 16 at different time steps before the final fracture (ramp loading 5 PH at 295 K, a = 64 d110 , dσ/dt = 1.23 GPa/7788 h): (a) time step 28000 h; (b) 32000 h.
Download figure:
Standard image High-resolution imageOblique twins occurred in all runs 5 PH we tested at elevated temperature (see table 1), but randomly at different times, which affected the velocity and character of crack extension. The results are summarized in table 1. The largest portion of cleavage fracture was observed at the loading 1.59 GPa/10067 h and at 1.23 GPa/7788 h, which illustrates a 3D visualization of the fracture surfaces in figure 16.
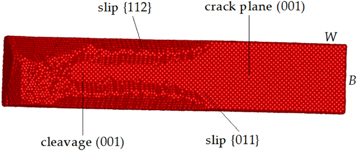
Figure 16. Fracture surface under the ramp loading 5 PH at 295 K, a = 64 d110 , 1.23 GPa/7788 h.
Download figure:
Standard image High-resolution imageTable 1 is also used to assess thermal activation in the system. As to surface dislocation emission  if we consider the transient emission under σe
= 1.1 GPa with Ge
=1.286 J m−2 = G(T) as a threshold, then we may estimate the degree m of thermal active tion from the relation:
if we consider the transient emission under σe
= 1.1 GPa with Ge
=1.286 J m−2 = G(T) as a threshold, then we may estimate the degree m of thermal active tion from the relation:
 for
for  slip system (8) by analogy with [8]. For T = 295 k and with the area per one atom
  and
and  for the emission at 0 K (see table 1) we obtain the degree of thermal activation m = 26.43. This value does not differ significantly from the prediction of
  by Rice and Beltz [11] for thermal activation of dislocation emission in bulk crystal of a metal (see the fluctuation of m-values in table 2 in [8]). If we consider the emission from both surfaces 1 and 30 under σe
= 1.18 GPa with
by Rice and Beltz [11] for thermal activation of dislocation emission in bulk crystal of a metal (see the fluctuation of m-values in table 2 in [8]). If we consider the emission from both surfaces 1 and 30 under σe
= 1.18 GPa with  then a lower value of m = 16.65 is obtained. The differences between the surface and bulk emissions are treated e.g. in [30, 31].
Table 2. Comparison of MD results under ramp loading in mode I at temperature of 295 K in mode I: the slow 1 PH (2.35 GPa/74400 h) for edge crack a = 46 d110 and the fast 5 PH (1.23 GPa/7788 h) for edge crack a = 64 d110 .
| ti /h | σi | Ki | Gi | te /h | σe | Ke | Ge | tcr /h | RKmax | σMD | KMD | GMD | tf /h | CODf | Wf /BW | a/d110 |
|---|---|---|---|---|---|---|---|---|---|---|---|---|---|---|---|---|
| GPa | MPa m ½ | J m−2 | GPa | MPa m ½ | J m−2 | 10–6 N | GPa | MPa m ½ | J m−2 | Å | J m−2 | |||||
| 76566 | 2.35 | 0.68 | 2.38 | 76400 | 2.35 | 0.68 | 2.38 | 75744 | 0.576 | 3.12 | 0.897 | 4.18 | 92000 | 103 | 41.64 | 46_1 PH |
| 12224 | 1.23 | 0.56 | 1.62 | 12057 | 1.23 | 0.56 | 1.62 | 10865 | 0.416 | 2.25 | 1.02 | 5.41 | 36400 | 79 | 12.06 | 64_5 PH |
Important factor for brittle or ductile behavior of the crack (001)[110] is the threshold for generation of the oblique twins. This generation can start as an emission of partial dislocations  with the Burgers vector b/3 and thus, we may consider thermal activation of ∼
  for bulk crystal from [11]. Using Ktwin
from relation (7), then
for bulk crystal from [11]. Using Ktwin
from relation (7), then  Using the relation
  we may derive the value of G(T), Ktwin
(T) and subsequently σtwin
= 1.32 GPa for T = 295 K. The area per 1 atom on plane {112} is
we may derive the value of G(T), Ktwin
(T) and subsequently σtwin
= 1.32 GPa for T = 295 K. The area per 1 atom on plane {112} is  Close to crack initiation we observed the oblique twins at the crack tip on the inner layer 16 under the ramp loading 1.30 GPa/8231 h at the time step 13500 h (see table 1). This caused that no fracture was monitored up to time step 50000 h. Note that a small change in loading rate to dP/dt = 3 kN s−1 improved the situation and the overall shape of the atomistic sample at the final fracture was similar to the brittle fracture in figure 4 at 0 K. Nevertheless, the inspection of fracture surfaces showed that more cleavage facets occurred in MD simulations using the standard loading rate 2.92kN s−1 (5 PH), namely the ramp loading 1.23 GPa/7788 h–see figure 16.
Table 1 shows also other differences between the simulations at 0 K and 295 K. As mentioned in section 3.1.1, the maximum of the resulting force RK in one half of the crystal physicaly represents a global resistence of the atomistic system against fracture and it occurs on the time scale in each case before the dislocation emission and crack initiation. Consequently, σMD
represents an internal critical stress available in MD at elevated temperature, KMD
is global fracture toughness in MD at elevated temperature and GMD
is the corresponding energy release rate in the heated atomistic sample. All the MD quantities are larger than σi
(or σe
), Ki
and Gi
for crack initiation, derived from external loading, due to thermal activation. The average value of GMD
at 295 K is 5.35 J m−2 and the difference  is close to an average from continuum predictions of
  and
and  for thermal activation of the oblique slip system
  and
and  This is because the brittle fracture in MD at 295 K and 0 K is associated with the mentioned slip processes.
3.2.2. Shorter edge crack under the ramp loading 1 PH, dP/dt = 0.584 kN s−1

During linear loading in time we found out that the shorter edge crack with relative ratio a/W ∼ 0.3 was initiated at the external stress of 2.35 GPa and thus for the ramp loading 1 PH we used the stress loading 2.35 GPa/74400 h by the scheme in figure 13, where the linear phase corresponds to  Similar to the fast loading 5 PH, the crack initiation was correlated with the emission of dislocations to oblique slip systems
  —see table 2. Unlike 5 PH, only one-sided cross slip to slip system
  was observed. Soon after crack initiation the oblique twins were generated—see figure 17. As a consequence, ductile fracture was monitored in MD, which illustrates figure 18 with the deformed fracture surface after the oblique twining. Such a sloping fracture surface is presented in figure 7 in [4], coming from SEM analysis of the fractured specimen No10 with the edge crack a/W ∼ 0.3 loaded slowly in mode I.
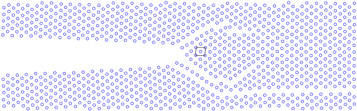
Figure 17. Generation of oblique twins (marked by square) ahead of shorter crack a = 46 d110
under the slower ramp loading 1 PH at 295 K, dσ/dt = 2.35 GPa/74400 h, time step 80000 h, surface layer 1, the horizontal slip pattern (below) comes from the cross slip 
Download figure:
Standard image High-resolution image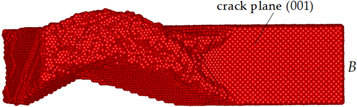
Figure 18. Fracture surface under the ramp loading 1 PH at 295 K (2.35GPa/74400 h). The original crack plane (001) is on the right. The sloping fracture surface (left bottom side of the picture) arises after the oblique twinning on {112} planes - see also figure 12(b).
Download figure:
Standard image High-resolution imageNote that the oblique twinning and oblique dislocation emission  at the edge crack (001)[110] were already briefly reported in [32], where 3D simulation of the fracture experiment [4] on the shorter SEN specimens is presented. Oblique emission
  was also reported in [23] under cyclic loading in mode I and mode II, where it resulted in crack deflections. No cross slip of the screw dislocations
  and their contribution to crack extension is reported in [23, 32].
Table 2 also includes comparison of the slow ramp loading 1 PH and the fast ramp loading 5 PH. The results presented in table 2 and the comparison of fracture surfaces in figure 18 for 1 PH and the fracture surfaces in figure 16 for 5 PH show that the slow loading 1 PH supports more oblique twinning, which lead to a ductile fracture. To verify that, we also performed MD simulations under linear loading in time, briefly presented in the next section.
3.2.3. MD results under linear loading 1 PH and 5 PH at 295 K and their comparison with experiments
As mentioned above, one disadvantage of the linear loading in time is that MD results for dislocation emission and crack initiation occurring at x-axis need to be corrected at least by flight time ![${\rm{\Delta }}{t}_{x}=(L/2)/{C}_{L[001]}$](https://content.cld.iop.org/journals/2053-1591/9/3/036508/revision2/mrxac5708ieqn147.gif) of the fastest longitudinal loading waves (CL [001]
= 5550 m s−1 [14]) from the loaded borders to the x-axis (where they are generated). In our case Δtx
= 1162 h, which is not negligible namely under faster loading 5 PH. The second disadvantage is that the high stress level before fracture makes the small 3D atomistic samples more ductile than expected in relation to experiments. Nevertheless, the initial crack behavior in the vicinity of the initiation can be described qualitatively well in relation to the experiments.
of the fastest longitudinal loading waves (CL [001]
= 5550 m s−1 [14]) from the loaded borders to the x-axis (where they are generated). In our case Δtx
= 1162 h, which is not negligible namely under faster loading 5 PH. The second disadvantage is that the high stress level before fracture makes the small 3D atomistic samples more ductile than expected in relation to experiments. Nevertheless, the initial crack behavior in the vicinity of the initiation can be described qualitatively well in relation to the experiments.
Comparison of the corrected MD results at temperature of 295 K with linear loading 1 PH and 5 PH is presented in table 3. Under linear loading the values CODf and Wf /BW are larger than those in table 2 (ramp loading) because of the larger external forces acting during linear loading. This supports more oblique twining in the atomistic samples, which leads to more ductile behavior in comparison with ramp loading. Nevertheless, the values Ki , CODf and Wf /BW presented in table 3 show that the slow loading 1 PH leads to more ductile behavior in comparison with 5 PH, which is in a qualitative agreement with fracture experiments [3, 4]. In this study it is illustrated in figures 19(a) and (b) for the linear loading 1 PH and 5 PH shortly after the crack initiation. Figure 20 shows the atomistic dependencies RK—t and RK—COD, in analogy with the experimental dependencies P—t and P—ΔL presented in [3, 4] and in other experimental studies, reviewed e.g. in [2].
Table 3. Comparison of MD results at 295 K for edge crack a = 46 d110 (a/W ∼ 0.3) under linear loading 1 PH (dP/dt = 0.584 kN/s) and for edge crack a = 64 d110 (a/W ∼ 0.42) under linear loading 5 PH (dP/dt = 2.92 kN/s).
| ti/h | σi | Ki | Gi | te/h | σe | Ke | Ge | tcr/h | RKmax | σMD | KMD | GMD | tf/h | CODf | Wf/BW | a/d110 |
|---|---|---|---|---|---|---|---|---|---|---|---|---|---|---|---|---|
| GPa | MPa m ½ | J m−2 | GPa | MPa m ½ | J m−2 | 10–6 N | GPa | MPa m ½ | J m−2 | Å | J m−2 | |||||
| 76339 | 2.35 | 0.68 | 2.37 | 76994 | 2.37 | 0.68 | 2.41 | 75812 | 0.595 | 3.22 | 0.93 | 4.45 | 89500 | 130 | 60.85 | 46_1 PH |
| 12220 | 1.43 | 0.65 | 2.18 | 12665 | 1.53 | 0.69 | 2.47 | 10865 | 0.412 | 2.23 | 1.01 | 5.30 | 21000 | 80 | 35.24 | 64_5 PH |

Figure 19. Comparison of the crack development under linear loading at 295 K in the middle layer 16 shortly after crack initiation: (a) linear loading 1 PH (dP/dt = 0.584 kN /s), time step 83000 h, dσ/dt = 4.19 GPa/132580 h, a = 46 d110 ; (b) linear loading 5 PH (dP/dt = 2.92 kN /s), time step 16000, dσ/dt = 4.19 GPa/26530 h, a = 64 d110 . The arrow denotes the original crack tip point.
Download figure:
Standard image High-resolution image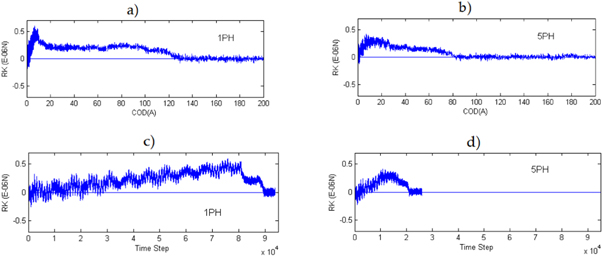
Figure 20. Comparison of the atomistic fracture dependencies at temperature of 295 K and the linear loading in time: RK—COD (a), (b) and RK—time (c), (d). The loading rate 1 PH (for 1 mm min−1) and 5 PH for (5 mm min−1) is marked inside.
Download figure:
Standard image High-resolution image
As already mentioned in Introduction, one may expect only a qualitative agreement between MD and the experimental results, not quantitative. And really, in agreement with the experimental results on bcc metals reviewed in [2], our MD curves RK—t and RK—COD with the increasing quasi-static loading rate are displaced to the left and towards the lower peak values, similar to experiments, i.e. with the increasing loading rate the fracture is faster and less ductile, or more brittle respectively. The same is valid for the ramp loading 1 PH and 5 PH that is more informative to answer our question on the contribution of the crack itself to ductile versus brittle behavior under different loading rates. The faster loading rate 5 PH leads to more brittle fracture, while the slower loading rate 1 PH to more ductile fracture, which was confirmed via inspection of the fracture surfaces in MD under the loading 1 PH (figures 18) and 5 PH (figure 16). The presented MD results comply with our experiments [3, 4] that motivated this study. The grape shape plastic zone in figure 4 from the experiment [3] and in figure 2 from [4] at the short crack a/W ∼ 0.3 under the loading rate 1 mm min−1 is similar to MD figures 12(a) and 19(a) showing the oblique twinning in front the short crack a/W ∼ 0.3 under the slow loading 1 PH. Under the fast loading 5 PH (for 5 mm min−1) such a plastic zone does arise neither in MD nor in the experiment. The average velocity of the crack growth under the ramp loading 5 PH is Vcr = 417 m s−1, as follows from table 2. If we suppose such a crack speed in the experiment [3] with the longer crack a/W = 0.422 (where W ∼ 10 mm and loading rate was 5 mm min−1), then the time needed for fracture will corresponds to about 1.4 × 10⁻⁵ s, which is too short time for monitoring the crack extension via classical optical microscope and the process seems like a sudden fracture, as observed in [3].
As discussed already in [33], qualitative comparison of MD results in pure bcc iron with the experimental results on Fe-Si single crystals is justified in the region of low Si contents (up to about 6wt%Si), where the elastic constants are practically the same as in bcc iron and thus, where the same stress and energy barriers for a given crack tip process are expected by continuum predictions, valid both on macro and atomistic level.
Slip patterns from planes {112}, created by gliding dislocations and twinning nearby and on the fracture surfaces of Fe-3wt%Si crystal No2 (with KIc = 24MPa m1/2) were reported in [15], where the post-fracture SEM and TEM analysis of the experiment [3] was done. The specimen No2 with the short edge crack a/W ∼ 0.3 was loaded with the cross head speed 1 mm min−1, which in our MD study correspond to the case 1 PH. While the fracture surface from specimen No 2 was of ductile character, under higher loading rate (5 PH in this study) prevailing cleavage character of fracture is mentioned in [15]. It complies with presented MD results for 1 PH and 5 PH at temperature of 295 K that show that at least a part of the slip processes revealed in [15] can be generated by the crack itself.
In agreement with this MD study, the activity of the slip systems on the oblique planes {011} was recently reported in [16], where tension fracture experiments with a central crack (001)[110] in thin single crystals Fe-3wt%Si were analyzed in detail via electron channeling, electron back scattering and scanning electron methods (SEM). Main contribution to the observed striations in [16] is attributed to slip patterns from the inclined slip systems  due to a larger Schmid-factor (∼0.47) for this system in comparison with the oblique systems 〈111〉{011}, where it is ∼ 0.41. Generation of blunting dislocations
  by the edge crack (001)[110] was neither observed in our MD simulations nor preferred by LFM analysis. This so-called non-Schmid behavior [34] can be explained in our case by the anisotropy of the near stress field at the crack (001)[110] presented in detail in [35]. (As mentioned in section 3.1.1, at Griffith level of loading and at the distance r = b/2 from the crack tip we obtain from equation (3) the slip stress τb
= 16.8 GPa for the slip system 〈111〉{011}, while for the inclined slip systems
by the edge crack (001)[110] was neither observed in our MD simulations nor preferred by LFM analysis. This so-called non-Schmid behavior [34] can be explained in our case by the anisotropy of the near stress field at the crack (001)[110] presented in detail in [35]. (As mentioned in section 3.1.1, at Griffith level of loading and at the distance r = b/2 from the crack tip we obtain from equation (3) the slip stress τb
= 16.8 GPa for the slip system 〈111〉{011}, while for the inclined slip systems  according to [35]: τb
= 7.59 GPa for plane strain and τb
= 5.87 GPa for plane stress conditions.) It is not in contradiction with the conclusions from [16], since the slip patterns on the inclined systems
according to [35]: τb
= 7.59 GPa for plane strain and τb
= 5.87 GPa for plane stress conditions.) It is not in contradiction with the conclusions from [16], since the slip patterns on the inclined systems  from [16] may concern pre-existing dislocations or easy twinning in the slip systems (see fig.4.14 in [1] or ref. [24, 26]). Note that the emission of blunting dislocations
  is preferred by MD and by anisotropic LFM for the crack orientation
 ![$(\bar{1}10)[110],$](https://content.cld.iop.org/journals/2053-1591/9/3/036508/revision2/mrxac5708ieqn153.gif) where the same slip systems are oriented in hard, anti-twinning direction—see [6–8] and [35]. This was confirmed experimentally e.g. in [4] and [33].
where the same slip systems are oriented in hard, anti-twinning direction—see [6–8] and [35]. This was confirmed experimentally e.g. in [4] and [33].
Recent MD simulations in fcc Nickel [36] show how fracture toughness may depend on the thickness of the 3D atomistic sample. As to bcc Fe and the edge crack (001)[110], we believe that the mentioned oblique slip processes from MD, generated by the crack itself at the free (110) surfaces (WL in figure 1), can also occur in thicker specimens of our orientation. This is possible according to the independent LFM analysis presented above and it complies with the experimental observations in [16].
4. Conclusions
From the atomistic point of view, this study brings new information on the nano-scale processes generated by the crack itself and on their kinetics. The processes are very fast (by the order 1–10 ps) and it is very difficult (or impossible) to obtain such information directly via in situ experiments.
3D atomistic simulations in bcc iron via MD technique at temperature of 295 K (22 °C) and fast loading rate 5 PH (dP/dt = 2.92 kN /s) show that the brittle fracture in mode I at a longer (a/W ∼ 0.42) edge crack (001)[110] is supported by the surface dislocation emission on oblique slip systems  and by the subsequent cross slip of the screw dislocations
  to oblique slip planes {112}. The oblique slip
  leads to separation of the cleavage planes {001} in the interior of the 3D crystal which helps cleavage fracture in the bulk crystal. This new mechanism for a fast brittle fracture at edge cracks (001)[110] occurs also at temperature of∼ 0 K and according to the authors knowledge, the result has not yet been published.
Under a slower loading rate 1 PH by a factor 5 (dP/dt = 0.584 kN /s) the growth of the shorter (a/W ∼ 0.3) edge crack (001)[110] is hindered in MD via creation of the plastic zone after oblique twinning on the oblique planes {112} and the further character of fracture is ductile.
MD results are in a qualitative agreement with our fracture experiments performed in mode I on bcc iron crystals with low content of silicon. MD results clarify the contribution of the crack itself to ductile or brittle behavior at the edge cracks (001)[110] in Fe-3wt%Si single crystals of the same crystal orientation and geometry.
MD results are consistent with the stress analysis according to anisotropic LFM and with post-fracture experimental observations.
Data availability statement
All data that support the findings of this study are included within the article (and any supplementary files).
Funding-Acknowledgments
The work was supported by the Institute Research Program RVO: 61388998, further by the projects of the Technology Agency of the Czech Republic under grant TK01030108 and of the Czech Science Foundation with grant number GA19–03282S. The work of P. Hora was supported by the European Regional Development Fund under Grant No.CZ.02.1.01/0.0/0.0/15_003/0000493 (Centre of Excellence for Nonlinear Dynamic Behavior of Advanced Materials in Engineering).
Declaration of competing interest
We declare that we do not have any commercial or associative interest that represents a conflict of interest in connection with the work submitted.
Conflict of interest
The authors declare that they have no conflict of interest.