

Abstract
Decreasing soil moisture and increasing frequency and intensity of soil drought episodes are among the frequently discussed consequences of ongoing global climate change. To address this topic, a water balance model SoilClim forced by climate reanalysis ERA5-Land was applied on a global scale to analyze the spatiotemporal variability of changes in soil moisture anomalies. The results revealed that the soil relative available water (AWR) significantly decreased on 31.1% of global non-glaciated land and significantly increased on 5.3% of such global non-glaciated land in 1981–2021. Decreasing AWR trends were detected over all continents and were particularly pronounced in South America, which experienced significant drying on more than half of the continent. The main drought 'hotspots' were identified in equatorial Africa, a large part of South America, the Midwest United States, and in a belt extending from eastern Europe to eastern Asia. A seasonal analysis of region-specific patterns further suggested drying in Europe in summer but an absence of a drying trend in winter. These results were supported by an analysis of the area affected by percentile-based drought on individual continents, revealing statistically significant increasing trends of 5th- and 10th-percentile droughts on all continents except Australia at an annual scale. Nevertheless, summer and autumn drought frequency increases were also detected in Australia. The seasonal trends were the most rapid in South America and Europe (except in winter). The distributions of AWR values, evaluated by Z scores, shifted remarkably toward drier conditions during the 2001–2021 period, particularly in South America and Asia. These results underscore the alarming increase in soil drought on a global scale, highlighting the need for effective drought management strategies.
Export citation and abstract BibTeX RIS

Original content from this work may be used under the terms of the Creative Commons Attribution 4.0 license. Any further distribution of this work must maintain attribution to the author(s) and the title of the work, journal citation and DOI.
1. Introduction
Soil drought has the potential to develop into a large-scale natural disaster affecting both natural and social systems, particularly in regions without proper management plans (Wilhite 2000). Among the many extreme weather events occurring in recent decades (Ward et al 2020), droughts have become more frequent and severe in many parts of the world (Song et al 2020). Studies analyzing past droughts or projecting future droughts on a global or continental scale use different meteorological drought indices, such as the standardized precipitation index or the standardized precipitation-evapotranspiration index (e.g. Spinoni et al 2015, 2019, Chiang et al 2021, Fuentes et al 2022, Vicente-Serrano et al 2022), which do not consider the role of soil and surface properties. The widely used Palmer drought severity index (Zhao et al 2017, Yang et al 2018) includes basic soil parameters as input (Palmer 1965). Recently used satellite-based indices such as the normalized difference vegetation index, standardized vegetation index or evaporative stress index (Anderson et al 2011, Khan and Gilani 2021, Nikraftar et al 2021) offer different approaches to monitor drought. Another tool is soil moisture modeling via hydrological and land-surface models, often used with outputs of general circulation models to assess future soil moisture changes, as was done, for example, by Samaniego et al (2018) in Europe or by Trugman et al (2018) and Berg and Sheffield (2018) globally. Although many previous studies on soil moisture have focused on a continental or regional scale (e.g. Sheikh et al 2009, Geng et al 2021), some global soil moisture analyses based on modeling are also available (e.g. Adeyemi et al 2018, Cai et al 2019). Recently, Liu et al (2023) analyzed soil moisture variability based on multiple reanalyzes.
Aside from the usage of inherent soil moisture from reanalysis, alternative approach could be to perform soil moisture modelling using independent land-surface model and soil characteristics data, with reanalysis providing only the meteorological inputs. Such an approach could substantially enhance the provision of a globally consistent understanding of soil moisture trends over past decades characterized by climate change with regionally specific intensity.
In this study, we used the SoilClim water balance model (Hlavinka et al 2011, Trnka et al 2020) to analyze soil drought and its spatiotemporal aspects on a global scale. Since its introduction in 2010, the model has been continuously developed and widely applied (Trnka et al 2015a, 2015b). Since 2014, the model represents the main pillar of the Czech Drought Monitor System (Trnka et al 2020, Interdrought 2022), and more recently, new SoilClim setups have been introduced and tested (Řehoř et al 2021), including a global version of SoilClim, which runs operationally on the ECMWF integrated forecasting system (IFS) data as a part of global soil moisture and drought monitoring effort at windy.com (2022), and it retrospectively uses the ERA5-Land reanalysis (Muñoz-Sabater et al 2021).
This setup provides a unique opportunity to study the spatiotemporal variability of soil drought on a global scale using complex soil moisture modeling at annual and seasonal (DJF: December–February, MAM: March–May, JJA: June–August, SON: September–November) resolutions.
2. Data and methods
2.1. Soil moisture modeling
The SoilClim water balance model (Hlavinka et al 2011, Trnka et al 2020, Řehoř et al 2021) considers four soil layers (0.0–0.1, 0.1–0.4, 0.4–1.0 and 1.0–2.0 m) and calculates soil moisture by comparing the inflow (water infiltration) and outflow (evapotranspiration and deep percolation) water-balance components. SoilClim is applied to each grid and accounts not only for the plant available soil water capacity within the grid but also for the type of vegetation cover, seasonal phenological development, leaf area index (LAI) dynamics, root growth and snow cover accumulation, sublimation, and melting (Trnka et al 2010, 2020, Řehoř et al 2021). The input of all meteorological variables (precipitation, temperature at 2 m, dew-point temperature at 2 m, wind speed at 10 m, and incoming shortwave radiation) consists of ERA5-Land (Muñoz-Sabater et al 2021) data with a 0.1° resolution, aggregated into daily values. Surface runoff is based on the curve number approach (Rosa et al 2012a, 2012b), and evapotranspiration is based on the dual crop coefficient approach (Raes et al 2009, Steduto et al 2009, Rosa et al 2012a, 2012b), using the LAI from ERA5-Land. Canopy height and root depth change as a function of LAI (Řehoř et al 2021). Land-use and terrain inputs were derived from ERA5-Land. Plant available water (AWR) capacity of soil was computed as the difference between field capacity and wilting point based on the inputs from SoilGrids database (Hengl et al 2014, 2017). These inputs included soil texture, organic matter and gravel content from which field capacity and the wilting point were computed using the pedotransfer functions by Saxton and Rawls (2006). SoilClim reproduces well changes in the long-term soil moisture dynamics in the topsoil as well as the trends in the reference evapotranspiration proxy (Trnka et al 2015b). The calculated volumetric soil moisture was converted into relative AWR, in which 100% represents field capacity and 0% represents the wilting point (for more details concerning the global version of the SoilClim model, see Řehoř et al 2021). Daily AWR and its anomalies during the 1981–2021 period were calculated for non-glaciated land in Africa, Asia, Australia and Oceania, Europe, North America and South America, excluding latitudes above 72° N and all of Antarctica. This study used data for the 0.0–1.0 m soil layer, which were obtained by aggregating the upper three of the four modeled layers.
2.2. Statistical methods
The daily gridded AWR data obtained from the SoilClim model were aggregated into monthly, seasonal and annual means. Linear AWR trends were calculated for each individual grid from seasonal/annual series using the nonparametric Theil–Sen regression method (Theil 1992, Sen 2012), which is robust to outliers. The statistical significance of trends was evaluated using the nonparametric Mann–Kendall test (Mann 1945, Kendall 1975) for p < 0.05.
To define soil drought, 5th and 10th percentile AWR thresholds were calculated for each grid and also each day (employing a 21 day window to smooth the annual variation) for the 1981–2010 reference period to represent severe and extreme drought conditions. The data were further aggregated for individual continents using the percentage of grid points fulfilling the 5th percentile (PD5) or 10th percentile (PD10) conditions every day. These daily percentages were further aggregated into annual and seasonal series. Theil–Sen regression with the Mann–Kendall test was then used to evaluate the trends over all continents.
Pearson correlation coefficients between AWR and temperature or precipitation series were based on monthly data aiming to preserve sufficient variability, and the effective sample size parameter (Hu and Feng 2010) based on AWR data was used to mitigate the effect of autocorrelation in AWR series. Statistical significance of correlations was evaluated at p < 0.05.
To calculate Z scores, an annual cycle was removed from the daily AWR continental averages using the mean annual cycle of AWR during the 1981–2000 reference period smoothed by a 21 day window. To determine whether the statistical distribution of Z scores changed significantly, the Kolmogorov‒Smirnov (K–S) test was applied at p < 0.05.
3. Results
On the global scale, statistically significant decreasing linear trends in AWR exceeded those with significant positive trends, with a ratio of 31.1%–5.3%. For individual continents, South America presented the most severe situation, with 53.9% experiencing a significant decrease and only 0.9% experiencing an increasing trend, i.e. more than half of this continent became substantially drier. The imbalance between the areas with decreasing and increasing soil moisture levels was striking for other continents as well but less strong than that observed for South America: Africa (40.0% decreasing to 8.3% increasing trends), Asia (31.5%–5.8%), Australia and Oceania (13.1%–1.7%), Europe (37.3%–1.2%), and North America (15.7%–6.9%). The spatial distribution of linear trends (figure 1) highlights significant 'hotspots' of decreasing trends. These were primarily located in equatorial Africa, South America, the continental US, and in a belt extending from the eastern Europe to eastern Asia. These regions have broad areas that had decreases of approximately 5% per decade. Notably, strong decreases were also found in some smaller areas, such as the Middle East. Conversely, areas with significantly increasing trends were found in western India, the Tibetan Plateau, certain parts of the arid/semiarid Africa, and Canada.

Figure 1. Linear trends (%/10 years) statistically significant at p < 0.05 in the annual and seasonal relative available water (AWR) in the 1981–2021 period.
Download figure:
Standard image High-resolution imageSeveral instances of statistically significant trends were detected in individual seasons. However, there was rarely a completely inverse trend when comparing seasons within the same region. For example, the drying hotspot in South America was more extensive in JJA and SON, while significant drying in central Africa occurred during MAM and JJA. Europe had negligible trends in DJF and the strongest decreasing trends in JJA.
Areas affected by PD10 and PD5 increased on all continents, particularly in recent years (figure 2). The largest mean annual area on all six continents was reached in the last three years, mostly in 2021 (Asia, Africa, North America) but also in 2020 (Europe, South America) and 2019 in Australia and Oceania, where the mean PD10 reached 35% of the entire continent and the PD5 area was greater than 20%. Linear trends in PD10 and PD5 areas were significantly increasing for all featured continents except for Australia and Oceania. The trends were the strongest for South America and Europe and were weaker for Australia and Oceania, North America and Africa.

Figure 2. (a) Annual mean and maximum area (mil. km2) affected by PD10 and (b) annual mean relative area (%) affected by PD10 (blue) and PD5 (red) with linear trends for Africa (AF), Asia (AS), Australia and Oceania (AU), Europe (EU), North America (NA) and South America (SA) in the 1981–2021 period. Numbers in (b) represent trends in % per 10 years, * marks statistically significant trends at p < 0.05.
Download figure:
Standard image High-resolution imageFocusing on individual seasons, areas affected by both PD10 and PD5 (figure 3) exhibited increasing linear trends that were statistically significant for all continents in JJA, SON and MAM (except for Australia and Oceania in MAM). However, trends in DJF were statistically significant only for Asia and South America (also for PD5 for North America). The linear trends for South America were notably stronger than those of other continents in DJF and SON, while in MAM and JJA, they were similarly strong for both South America and Europe. An increase in extreme PD5 drought in Europe in JJA, reached the most rapid increase rate among all PD5 trends and was particularly remarkable. However, the weakest increasing trends were detected for Africa in DJF, Australia and Oceania in MAM, and North America in JJA and SON.

Figure 3. Seasonal linear trends in PD10 (blue) and PD5 (red) areas for Africa (AF), Asia (AS), Australia and Oceania (AU), Europe (EU), North America (NA) and South America (SA) in the 1981–2021 period (trends in % per 10 years, * statistically significant at p < 0.05).
Download figure:
Standard image High-resolution imageTo analyze changes in the distribution of AWR values, Z scores of the daily AWR, averaged over individual continents, were calculated based on the 1981–2000 reference period and presented as density plots for 1981–2000, 2001–2010 and 2011–2021 (figure 4). The distributions of all six continents indicated a shift toward more widespread severe and extreme drought in the last two decades, but with very large differences between the continents. The largest shift occurred in Asia and South America, with the highest density of Z scores found at approximately −2 in the last two decades. In Africa, the variability remained similar to that in the reference period, but in the case of South America, the variability increased with Z scores commonly detected at approximately −4 during the 2011–2021 period. In Europe, the change in distribution was weak in 2001–2010 but stronger in 2011–2021, forming an unusual bimodal shape. According to the K-S test, the distributions of Z scores statistically significantly changed in both 2001–2010 and 2011–2021 in Africa, Asia, Australia and Oceania and South America. In Europe, only the 2011–2021 period was significantly different from the preceding decades, and in North America, the changes failed to reach statistical significance.
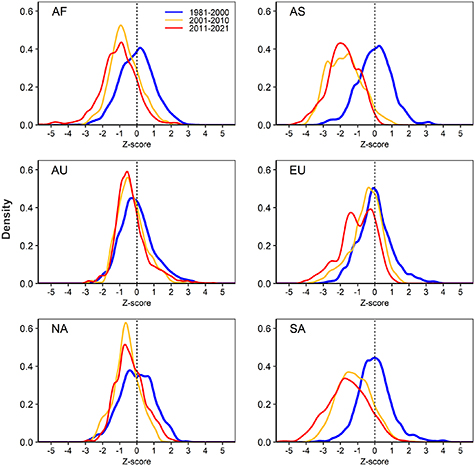
Figure 4. Z score distribution of daily AWR means for Africa (AF), Asia (AS), Australia and Oceania (AU), Europe (EU), North America (NA) and South America (SA) for the 1981–2000, 2001–2010 and 2011–2021 periods (1981–2000 reference period).
Download figure:
Standard image High-resolution imageThe bimodality of the annual Z score distribution for Europe in the 2011–2021 period can be explained using seasonal distributions (figure 5), which show a large shift in the Z scores in JJA but only a minor shift in DJF. In Australia and Oceania and North America, there is generally only a weaker shift toward drier conditions; however, decreased variability was detected here in some seasons, leading to very high maximum densities of Z scores between −1 and 0 in the last two decades. The most pronounced shifts toward drier conditions were detected in Africa in JJA, and in Asia and South America in all four seasons. Changes in the Z score distribution in these three continents were also proven to be statistically significant by the K–S test for both the 2001–2010 and 2011–2021 periods and all seasons, except for Africa in DJF during 2001–2010. On the other hand, changes in Europe and Australia and Oceania were only significant in JJA and SON in 2011–2021 (Europe) and in Australia and Oceania even during 2001–2011 in JJA. No statistically significant changes were detected for North America.
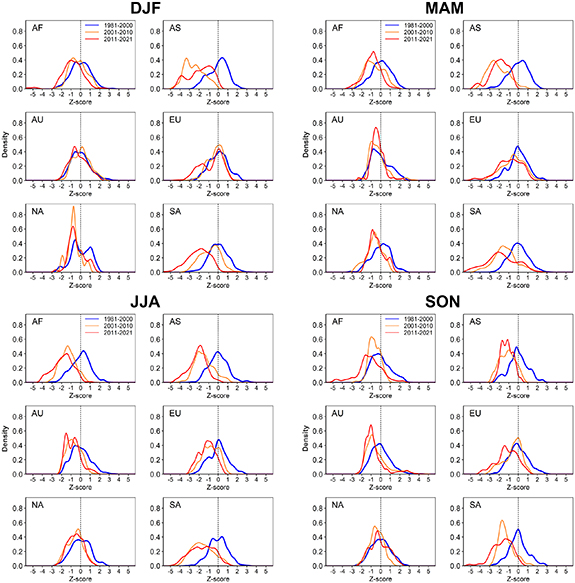
Figure 5. Seasonal Z score distributions of seasonal daily AWR means for Africa (AF), Asia (AS), Australia and Oceania (AU), Europe (EU), North America (NA) and South America (SA) in the 1981–2000, 2001–2010 and 2011–2021 periods (1981–2000 reference period).
Download figure:
Standard image High-resolution image4. Discussion
4.1. Precipitation and temperature changes
Because precipitation and potential evapotranspiration (closely related to air temperature) are the main drivers of soil moisture, gridded precipitation and temperatures were correlated with AWR for individual seasons. Correlations of AWR with precipitation totals (figure 6(a)) were positive and generally high and significant, except in extremely arid regions (particularly the Sahara Desert) with nonsignificant correlations. This result is probably connected both to the low variation in the AWR with values close to 0 and to the daily time step of the model, in which occasional rain showers will evaporate in a few hours and not cause a change in the resulting AWR. Moreover, very low correlations occurred in temperate and subarctic zones of the Northern Hemisphere in DJF and in subarctic regions in MAM and SON. The snow cover and frozen ground at these latitudes prevent precipitation from immediately infiltrating into the soil, similar to mountain regions. In the tropics, correlations were slightly lower for the wettest regions because AWR was mostly very close to 100% and therefore relatively unaffected by monthly variations in precipitation. Correlations between AWR and mean temperatures (figure 6(b)) were negative and strong, especially in tropical-wet and monsoon climates, while the situation in arid regions was the same as that for precipitation because actual evaporation was mostly limited by precipitation; thus, temperature variations had only a small effect on AWR. Very high and statistically significant negative correlations appeared in JJA in the temperate climate of the Northern Hemisphere, indicating the importance of temperatures for the origin of JJA droughts and providing an explanation of why the temperate climate zone is quickly getting drier as a result of the rapidly rising loss of moisture to the atmosphere.

Figure 6. Pearson correlation coefficients statistically significant at p < 0.05 of seasonal anomalies of relative available water (AWR) with seasonal anomalies of precipitation totals (a) and temperatures (b) in the 1981–2021 period.
Download figure:
Standard image High-resolution image
Because precipitation and temperature from ERA5-Land were crucial for this study, inherent biases of the reanalysis must be considered in interpretation of results. According to Cucchi et al (2020), who used observation- and satellite-based datasets to show biases in ERA5, not significantly different from ERA5-Land (see Muñoz-Sabater et al 2021), ERA5 generally indicates underestimation of temperature and overestimation of precipitation in high elevation above sea level, particularly in Himalayas and Andes. Absence of significant trends for those regions in our results could be influenced by this bias. However, since we focused particularly on long-term changes and used percentile-based drought definitions, constant bias in the reanalysis data should not influence results for most of the regions. This can be demonstrated in equatorial Africa and South America, which have according to Cucchi et al (2020) large variability of both positive and negative precipitation biases in the ERA5, while our results indicate large drying hotspots there without comparable level of variability in AWR trends.
4.2. Comparison with other studies
The calculated trends in AWR in our study can be compared with the results of other studies dealing with soil moisture or drought trends. For example, Spinoni et al (2019) identified Amazonia, southern South America, the Mediterranean region, Africa and northeastern China as major drought hotspots. Contrary to Spinoni et al (2019), who identified the Mediterranean region as the main European drought hotspot, this study suggests that drying trends are more severe in eastern Europe. This difference could be an effect of the different period analyzed by Spinoni et al (2019), starting 30 years earlier (1951) than our period and ending earlier in 2016, i.e. not including severe droughts from subsequent years until 2021. Additionally, Song et al (2020), analyzing the 1950–2015 period, identified eastern Europe as an area with a later turning point toward drying, i.e. in approximately 1990, while the Mediterranean region became drier earlier. Another reason for the absence of a more significant AWR decrease in the Mediterranean region may be the most rapid warming during JJA in this region (Mariotti and Dell'aquila 2012), when AWR was generally close to 0%, and further drying becomes physically impossible. However, approaches based on meteorological drought indices instead of soil moisture modeling may indicate an increase in drought while using the same input data because these models do not account for this physical limitation. The existence of significant trends in AWR (in general) is therefore more surprising because our approach does not allow for nearly as much drought accumulation compared to the meteorological drought indices.
Fuentes et al (2022) identified the continental temperate climate zone as severely affected by drought intensification along with the whole South America, but contrary to our study, they specified southwest Africa instead of the central Africa as a major hotspot. Very close to the present study are the results by Rolle et al (2022), who investigated changes in water stress and irrigation requirements in agricultural areas during 1970–2019 and determined a major water stress increases in South America, eastern Europe, eastern Asia and central Africa but a water stress decrease in India. Xu et al (2020), particularly analyzing the tropics based on satellite data for 1981–2019, agreed with our findings of rapid drying, particularly in central Africa and partially in South America. Deng et al (2020) combined both remote sensing and older reanalysis-based data for a similar period (1979–2017) to assess soil moisture trends. Their results mostly agreed with those of the present study, with the locations of drying hotspots in Europe, Asia and Africa. However, they indicated less severe drying in South America and more severe drying in North America, but they did not consider the seasonal aspect of the changes. A comparison of identified trends with projected changes in the near future also holds significance. Chiang et al (2021) proved that recent increase in drought frequency, duration, and intensity has been mainly caused by anthropogenic impacts on the climate. They concluded that both Americas, the Mediterranean, western and southern Africa, and eastern Asia have been affected the most, which partially agrees with our results. Vicente-Serrano et al (2022) studied drought trends based on meteorological drought indices in the last 120 years. They stressed South America as a drying hotspot (this agrees with our results), but their reported trends in many regions differed based on used drought index. They confirmed, that increases in drought frequency and intensity are mostly driven by increased evaporative demand and not by decreased precipitation. Liu et al (2023) used inherent soil moisture products from multiple reanalysis to assess trends in 1980–2020 period. Compared to our results, they found similar drying trends in the European and Asian temperate zones, however they did not report drying hotspot in South America or Midwestern US. The most recent IPCC report (IPCC 2021) indicated continued soil drying in South America, while in central Africa, where we have identified rapid soil drying, the report predicts a significant increase in soil moisture during the 21st century. The report also does not anticipate continued soil drying in central Asia.
As typical for any model outputs, uncertainties associated with the nature of the results cannot be ignored. For example, the module for actual evapotranspiration and soil-water content in the SoilClim model simplifies three-dimensional soil-water transport processes by using only four soil layers. SoilClim estimates of soil-moisture content are also affected by the estimated maximum plant AWR capacity for the soil layers in each grid, by considering only the dominant landcover types, together with uncertainties in ERA5-Land meteorological inputs discussed in section 4.1. Therefore, future continuation of our research could use different water balance model, soil data, meteorological inputs or more detailed landcover specific parametrization, which could involve another reanalysis and also observation-based data. Despite these limitations which may propagate into systematic biases in the simulated water fluxes and state variables, this study focuses mainly on percentile-based droughts and their trends. It is therefore likely that the impacts of these inherent systematic biases on the presented results are minimized. The findings in this study have a great potential for the following studies of soil drought drivers with regard to climate oscillations and large-scale circulation patterns, as well as for analysis potential environmental and socio-economic impacts of soil drying within indicated hotspots.
5. Conclusions
The main goal of this study was the analysis of spatiotemporal variability of changes in soil moisture anomalies and location of hotspots of soil drought intensification during the 1981–2021 period. The key results can be summarized as follows:
- (i)Almost one-third of non-glaciated land experienced statistically significant decreasing trends in AWR in the 1981–2021 period, while only 5% exhibited increasing trends. In South America, the significant decrease surpassed the 50% threshold, while in the least-affected North America and Australia and Oceania, it affected approximately 15% of their area.
- (ii)The major hotspots of soil drying included equatorial Africa, South America (except far south and northeastern shore), the Midwestern US, and a belt extending from eastern Europe to eastern Asia; all experienced AWR decreases of approximately 5% per decade.
- (iii)All continents experienced increases in PD10 and PD5 frequencies. The rate of increase was the most rapid in South America (entire year) and Europe (except for DJF). Although Australia and Oceania had the slowest increase, a remarkable drought event in 2019 resulted in an unprecedented area being affected by drought.
- (iv)A major shift toward drier conditions in the last two decades, represented by the Z score distributions of AWR values, was found, particularly in South America and Asia during the whole year and in Europe and Africa in JJA.
The study revealed significant global trends of decreasing soil moisture and increasing drought frequencies over the past 41 years, particularly concentrated within the detected hotspots. The recognized patterns underline the urgent need for targeted water resource management and climate change mitigation as well as adaptation strategies, because of far-reaching significant implications for worldwide agriculture, water security, and ecosystem health.
Acknowledgments
We acknowledge support from AdAgriF—Advanced methods of greenhouse gases emission reduction and sequestration in agriculture and forest landscape for climate change mitigation (CZ.02.01.01/00/22_008/0004635). The paper was also supported through GACR Project No. 23-08056S Dynamic tracking of drought events and their classification on the global scale—DynamicDrought. JŘ also received funding from Masaryk University within the MUNI/A/1323/2022.
Data availability statement
The data cannot be made publicly available upon publication because they are owned by a third party and the terms of use prevent public distribution. The data that support the findings of this study are available upon reasonable request from the authors.