

Abstract
Wheat is the most widely grown food crop, with 761 Mt produced globally in 2020. To meet the expected grain demand by mid-century, wheat breeding strategies must continue to improve upon yield-advancing physiological traits, regardless of climate change impacts. Here, the best performing doubled haploid (DH) crosses with an increased canopy photosynthesis from wheat field experiments in the literature were extrapolated to the global scale with a multi-model ensemble of process-based wheat crop models to estimate global wheat production. The DH field experiments were also used to determine a quantitative relationship between wheat production and solar radiation to estimate genetic yield potential. The multi-model ensemble projected a global annual wheat production of 1050 ± 145 Mt due to the improved canopy photosynthesis, a 37% increase, without expanding cropping area. Achieving this genetic yield potential would meet the lower estimate of the projected grain demand in 2050, albeit with considerable challenges.
Export citation and abstract BibTeX RIS

Original content from this work may be used under the terms of the Creative Commons Attribution 4.0 license. Any further distribution of this work must maintain attribution to the author(s) and the title of the work, journal citation and DOI.
1. Introduction
The global demand for food is continuously increasing and agricultural production must follow to ensure future global food security [1–5]. Wheat (Triticum aestivum L.) is one of the most important crops contributing to global food security, providing approximately 20% of calories and protein in the human diet [6]. Although global wheat production has continued to increase over recent decades [7], the rate of yield improvement has stagnated or declined in certain regional wheat-producing areas (e.g. Eastern Europe, Central India, and Western Australia) [8] and projected yield gains fall below the predicted future grain demand [3, 9, 10]. Grain production increases between 35%–56% (30%–62% when accounting for climate change) are needed to meet the projected global food demand by 2050 (relative to 2010 food demand) [11], while endeavoring to improve environmental sustainability and land preservation [2, 12]. Breeding new cultivars to further increase yield potential in high-yielding environments [13] is one approach to address the food security challenge [14], with the advantage that yields in poorer growing conditions could still increase [6, 15]. Investment in yield improvements and intensification can also mitigate greenhouse gas emissions [16]. Improving physiological traits that have a profound influence on the growth and yield of wheat, such as radiation use efficiency (RUE, biomass accumulation per unit of radiation intercepted by crop canopies), is of paramount importance to meeting the future grain demand [17, 18]. Estimates from the literature show that the RUE of current wheat could be increased by up to 50% under favorable crop-growing conditions [6, 19]. Doubled haploid (DH) crosses with modified traits such as RUE, light extinction coefficient, fruiting efficiency, grain filling duration, and grain size can increase yield potential compared to conventional wheat cultivars [15, 20, 21].
Global wheat yield gap analyses examine the difference between the potential yield (yield of well-adapted wheat cultivars grown with sufficient water and nutrients and without abiotic and biotic stress) and the average actual yield reported by farmers under conventional management practices [22]. Quantifying the yield potential provides a benchmark for future crop production and a guide for the sustainable intensification of agriculture. However, global yield potential analyses have not yet considered the improved genetic yield potential from advancements in physiological traits which would quantify the extent of potential genetic improvements. Expanding strategic genetic crosses across different target environments can result in significant yield gains [23], but crop management must be adjusted accordingly so that other resources do not become limiting, e.g. N fertilization [24].
Our aim was to explore the upper limits of current wheat genetic yield potential based on field measurements of selectively bred high-yielding wheat cultivars including the highest wheat yield reported in the literature, 16.6 t ha−1 dry weight for a high-yielding DH line [15, 20]. From these data, we first evaluated if a multi-model ensemble of state-of-the-art wheat crop models, which has consistently shown higher accuracy than any individual crop model [25–27], could reproduce the observed growth from improved physiological traits, and then we simulated the potential yield of improved wheat under prevailing temperatures at 34 global locations. We also determined a simple quantitative relationship between wheat production and cumulative incoming solar radiation implicitly involving both radiation interception and RUE to estimate the current maximum potential wheat yield based on incoming solar radiation (see section 4). This relationship is henceforth referred to as the efficiency of incoming radiation capture and use (ERCU). Both the multi-model ensemble simulations with improved traits and the upper limit of the ERCU relationship were extrapolated to the global scale based on current wheat growing areas to estimate global potential wheat production and yield according to local radiation levels.
2. Results and discussion
2.1. Crop model ensemble evaluation
Crop simulation models are robust computational tools that can simulate wheat growth, including potential yields of an area, by representing physiological traits mathematically within the models. Crop models incorporate the complexity of crop–soil–atmosphere interactions, the dynamics of phenology and growth (through accumulated thermal time), the dynamics of light interception, and the interactions of photosynthesis and carbohydrate distribution within a plant, at daily intervals while accounting for the spatial and temporal variability of different growth environments [28]. Models can therefore be adapted to simulate the growth and production of new wheat cultivars by altering the components to represent the improved physiological traits. Since existing wheat crop models have never before incorporated the trait advancements reported from the DH wheat field experiments (table 1), model testing was necessary to evaluate whether a wheat crop model ensemble could reproduce the production of the high-yielding traits of the DH line. Because crop model simulations contain implicit uncertainties from model input, structure, and parameters [29], the state-of-the-art approach in crop model applications is through multi-model ensembles which have been consistently shown in recent years to have a significant improved accuracy in projection compared to any single model applications [27]. Twenty-nine models using modified cultivar traits were calibrated and independently validated using data from field experiments under non-stress conditions (i.e. irrigated and fertilized plots without biotic stress) at Buenos Aires (Argentina), Ciudad Obregon (Mexico), and Valdivia (Chile) observed by Bustos et al [15] and Garcia et al [20]. The calibrated multi-model ensemble median of wheat crop models efficiently reproduced the highest observed yield and biomass ever reported (r2 = 0.91 and 0.66; RMSE = 177 g m−2 and 499 g m−2, respectively) from the measured yield-enhancing physiological traits, particularly increased RUE, in the three different environments (figures 1 and S1–S3). The observed yield response of the best-yielding DH lines at the sites in Argentina and Chile increased by 38% and 32%, respectively, compared to the check cultivar Bacanora, due to the enhanced traits, with the highest yields being recorded at the Chile site. Indeed, the models were able to reproduce most of the observed maximum yields at the Chile site (figure 1(f)), but were less accurate in simulating some of the maximum total biomass observations (figure 1(e)). The observed yield increases at the Argentina and Chile sites were higher than those at the warmer Mexico site (21%). The multi-model ensemble simulations overestimated biomass for one year at Mexico (figure 1(e), treatment CO 2009), which may have been influenced by assessing biomass from observed yield components and/or by discrepancies related to the edge effects from gap areas (spacing) within the raised-bed fields at that site [30, 31], unlike the more common homogenous fields simulated in the models.

Figure 1. Crop model performance and evaluation of wheat production from high-yielding traits. Box plots of simulated (a), (d) duration from sowing to maturity, (b), (e) final above-ground biomass, and (c), (f) yield of 29 wheat crop models for (a), (b), (c) ten treatments used for model calibration with cv. Bacanora, and for (d), (e), (f) five treatments used for model calibration with cv. Bacanora (white boxes) and five treatments used for model evaluation using the best-yielding DH line (gray boxes) at Valdivia, Chile (VA), Buenos Aires, Argentina (BA), and Ciudad Obregon, Mexico (CO). Field experiment data for the cv. Bacanora at Valdivia, Chile in 2010 (VA 2010) was not available, and therefore excluded from the model calibration which may explain the underestimation of the DH line biomass in 2010 (e). Box plots show the 90th percentile, 75th percentile, median, 25th percentile, and 10th percentile (horizontal lines from top to bottom) and outliers (open circles) of simulations based on the multi-model ensemble. RMSE (units same as y-axis) and r2 (coefficient of determination) are shown for the multi-model ensemble median. For the evaluation (d), (e), (f), the five calibrated treatments with cv. Bacanora are shown for comparison only and were not used in the statistical analysis. Biomass and yield values shown are with 0% moisture content.
Download figure:
Standard image High-resolution imageTable 1. Description and calculated percent change between the best-yielding DH line and the check cultivar (cv. Bacanora) of the traits provided to the crop modeling groups. Values are calculated from the observed field experiment data [15, 20, 21]. DM, dry matter; GS, growth stage; PAR, photosynthetically active radiation. The cultivar parameters used by each model are provided in table S2.
| Type | Trait | Units | Calculation | DH line(% change vs. cv. Bacanora) |
|---|---|---|---|---|
| Source | Radiation use efficiency (RUE) | g MJ−1 | Slope of above-ground biomass DM (GS10 to GS89) vs. cumulative intercepted PAR | 34 |
| Light extinction coefficient at GS31 (K) | m2 (at ground) m−2 (of leaf) | Exponential coefficient of cumulative PAR (pre-anthesis) vs. leaf area index (LAI) | 10 | |
| Sink | Fruiting efficiency (FEspike) | grain g−1 DM | Grain number divided by DM of anthesis spike | −5 |
| Potential grain filling duration (GFD) | °Cd | Thermal time (base temperature 0 °C) between anthesis and physiological maturity | −4 | |
| Potential grain filling rate (GFR) | mg DM°Cd−1 | Grain DM divided by thermal time (base temperature 0 °C) between anthesis and physiological maturity under potential growth conditions | 21 | |
| Potential grain size (GWpot) | mg DM grain−1 | Average single grain DM under potential growth conditions | 16 |
2.2. Efficiency of incoming radiation capture and use (ERCU)
To determine the ERCU, we considered how much wheat dry mass accumulates in relation to the entire resource of incident light during the growing season, i.e. cumulative incoming solar radiation from sowing to physiological maturity (figure 2), which is reminiscent of the widely used wheat yield to water use relationship described by French and Schultz [32]. Based on the observed biomass, we determined that the upper limit of potential above-ground biomass is 1.57 g m−2 of additional dry matter for each additional MJ m−2 of incoming solar radiation (figure 2). When combined with the 0.45 harvest index of the highest yielding DH line, 0.71 g m−2 grain yield per MJ m−2 of incoming solar radiation is conceivable (figure 3). Wheat production below the ERCU potential threshold is limited by unimproved physiological traits such as RUE and canopy architecture (affecting the light extinction coefficient), the proportion of diffuse radiation, biomass allocation, and/or stress factors such as nutrient deficiencies, weeds, pests, and diseases. For example, improved light interception by the DH line later in the season in 2010 at Valdivia has a strong positive effect on the observed above-ground biomass compared to Bacanora in 2012 (figure 2). Potential above-ground biomass production during early crop development can only be suggested (dashed line in figure 2) because of limited early season biomass data and the difficulty in estimating early leaf expansion and light interception. We estimate that 516 MJ m−2 of cumulative incoming solar radiation is wasted when crop dry matter fails to accumulate because there is insufficient leaf area to maximize the interception of incident radiation. Therefore, a fast and early establishment of the crop, where 'early vigor' traits combine with favorable growing conditions, is important for a high ERCU. As a rule of thumb, the potential yield based on the ERCU with improved physiological traits can be derived as 0.7 g per MJ of incoming solar radiation after subtracting 365 MJ m−2 from the cumulative incoming solar radiation of a cropping season for any location across the globe (figure 3).

Figure 2. Relationship between wheat biomass potential and cumulative incoming solar radiation. Observed cumulative total above-ground biomass was plotted against observed cumulative incoming solar radiation of cv. Bacanora (open symbols) and the DH line (solid symbols) from sowing to maturity for different growing seasons (corresponding years are the same color) at Valdivia, Chile (VA, circles), Buenos Aires, Argentina (BA, squares), and Ciudad Obregon, Mexico (CO, triangles). Solid colored lines indicate cumulative growth. Solid black line indicates the upper threshold of the production potential of cumulative incoming solar radiation calculated using the best pre- and post-anthesis crop response, i.e. average of the Valdivia 2012 cv. Bacanora first two measurements and average of the high-yielding Valdivia 2010 DH line final two measurements, respectively. The slope of the line indicates the Efficiency of incoming Radiation Capture and Use (ERCU, g MJ−1). Dashed black line indicates the suggested production potential for early crop development. Biomass of three older wheat cultivars from Yunusa et al [58] are included to show how the ERCU has been improved in newer wheat cultivars. Error bars indicate the standard deviation of replications for available measured data. All biomass values are with 0% moisture content.
Download figure:
Standard image High-resolution image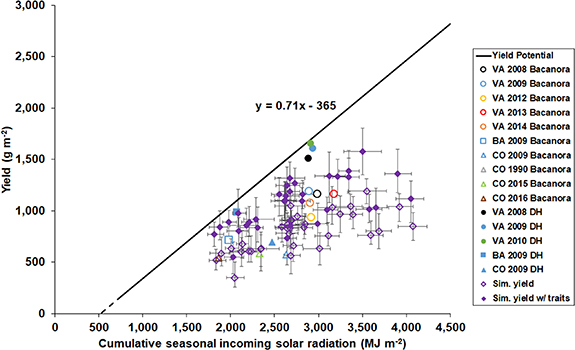
Figure 3. Relationship between wheat yield potential and cumulative incoming solar radiation. Observed yield was plotted against observed cumulative incoming solar radiation for cv. Bacanora (open symbols) and the DH line (solid symbols) in different growing seasons (corresponding years are the same color) at Valdivia, Chile (VA, circles), Buenos Aires, Argentina (BA, squares), and Ciudad Obregon, Mexico (CO, triangles). Solid black line indicates the upper threshold of yield potential of cumulative incoming solar radiation calculated using the biomass potential limit (see figure 2 and section 4) with the harvest index of the highest yielding DH line, 0.45. Dashed black line indicates suggested yield potential during early crop development. Simulated yields are of multi-model ensemble median of 26 wheat crop models with (solid diamonds) and without (open diamonds) modified cultivar traits (table 1) from 1980–2010 for 34 high-rainfall or irrigated AgMIP locations chosen from around the globe. Detailed incoming solar radiation at each location is shown in figure S5. Error bars indicate the 75th and 25th percentiles of the cumulative incoming solar radiation and yields simulated by the multi-model ensemble. All yields shown are with 0% moisture content.
Download figure:
Standard image High-resolution imageLocation and time of sowing have a strong influence on crop growth and the ERCU because the potential to intercept light depends on plant architecture, which changes with the developmental stage (driven by thermal time), temperature, water availability, soil constraints, and other factors. To examine and account for these interactions, we used a multi-model ensemble median with and without the modified traits (table 1) to simulate the potential yields at 34 high-rainfall or irrigated locations around the globe from 1980 to 2010 (figure S4). Average yield increased by 37 ± 20% across all 34 locations from the baseline simulated yield of check cultivars to the simulated yield with modified traits (figure 3, compare solid to open diamonds). When comparing the ERCU potential yield encompassing the modified traits and a 0.45 harvest index to the multi-model ensemble baseline simulated yield, a 106 ± 43% average yield increase across all locations was observed (figure 3, compare black potential line with open diamonds). The ERCU relationship provides a quick and simple potential genetic yield estimation, similar to the application of the French and Schultz [32] wheat yield to water use relationship, but is only applicable for growth under non-stress conditions.
The high ERCU, biomass, and yields observed at the Chile site were driven by a combination of the improved RUE of the DH line (table 1) and the highest incoming solar radiation per day throughout the growing season of the locations studied under yield potential conditions (figure S5). Notably, the highest DH yield resulted from a below-average harvest index of 0.45 (for treatment VA 2010) while the observed average harvest index was 0.49 across the Argentina, Chile, and Mexico sites. The yield gap between the ERCU potential yield and the simulated yields increases at locations with higher cumulative incoming solar radiation due to longer growing seasons, slower accumulation of thermal time, and less incoming solar radiation per day (figure S5).
2.3. Potential global wheat production
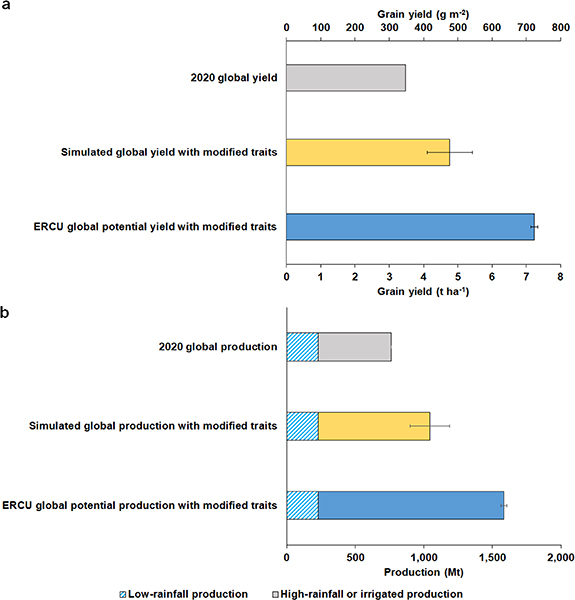
To determine the upper limit of global wheat production, the multi-model ensemble simulations at the 34 high-rainfall or irrigated locations were extrapolated to the global scale using the yield gap between the baseline simulations without modified traits and the simulations with modified traits (figure 3). This upscaling resulted in a potential global wheat production and yield gain of 280 ± 145 Mt yr−1 and 1.3 ± 0.7 t ha−1 yr−1, respectively. This is a 37% increase from the 2020 global wheat production and yield [7] without expanding the current wheat cropping area, assuming high-rainfall or irrigated field conditions (figure 4). This simulated yield increase agrees well with the observed yield response from the modified DH traits at the Argentina and Chile sites as expected. When extrapolating the yield gap between the multi-model ensemble baseline simulations and the ERCU upper limit to the global scale, the increase from the 2020 global wheat production and yield is 108%. The simulated multi-model ensemble potential yield increase is lower than the ERCU potential yield increase because the model simulations account for the changes in the light interception from the crop developmental stage, water availability, temperature, soil constraints, and other limiting factors. Breeding wheat cultivars with improved physiological traits such as RUE is a costly, time-consuming, and arduous process [6], but these global production estimates show that current wheat production has the potential to meet the necessary yield gains for future grain demand [11] through improved breeding strategies and without the need for additional cropping area.
Figure 4. Potential global yield and production under different high-yielding scenarios. Bar plots show global wheat (a) average yield and (b) production based on the latest reported statistics for 2020 [7] and the results of simulations aggregated from a multi-model ensemble median of 26 wheat crop models for 34 high-rainfall or irrigated AgMIP locations around the globe using modified cultivar traits (table 1), and the potential based on yield gaps determined from the efficiency of incoming radiation capture and use (ERCU) relationship (see figure 3). Total global production is the sum of global low-rainfall production and global high-rainfall or irrigated production. Global yields were calculated by dividing the total global production (including the unimproved yields in all low-rainfall regions, approximately 30% of the global wheat area [26, 51]) by the total global wheat area harvested [7]. Error bars for the simulated production with modified traits scenario indicate standard deviation from annual and model variation. Error bars for ERCU potential production with modified traits scenario indicate standard deviation from yield gaps between the ERCU upper limit and baseline simulated scenario. All production and yields shown are with a commercial moisture content of 13% [7].
Download figure:
Standard image High-resolution image
It is important to note that the potential productivity thresholds assume that optimization of each trait is possible and that there are no trade-offs, but this may not be applicable everywhere [33, 34]. There was no correlation (r2 = 0.02) between the observed RUE and harvest index of the DH lines, which suggests that it may be possible to improve both RUE (source) and harvest index (sink) simultaneously (figure S6). Multi-location breeding trials have shown that strategic source-sink crosses can result in significant yield gains across different target environments [23]. Temperature is a key factor affecting the ERCU because the relationship of temperature with solar radiation is a linear determinant of yield potential [35]. We consider the current temperature conditions in each region when applying the ERCU, but this could be further impacted by climate change in the future [36–38]. Climate change may increase genotype-environment interactions which could create challenges in realizing the same level of genetic gains from adapted cultivars in new environments [39]. Additionally, wheat productivity could be affected by fluctuations in incoming solar radiation between sun and shade [40] or source-sink imbalances [41], and there are still risks of suboptimal yields due to year-to-year variability resulting from extreme climate events and pests and disease [42]. Here, we do not address the economic constraints [43] of the material inputs (irrigation, fertilizer, biocides) required to maintain and protect higher production levels. For example, the higher-yielding crops may not require more water as was found with the energy balance calculation for maize yields [44], but additional research is needed to determine if this is also applicable to C3 crops. The higher-yielding crops may require more fertilizer [45] or more efficient fertilizer use, which would likely increase N2O emissions unless further advancements in synthetic N production are established, or advancements in crop N utilization efficiency are achieved as observed in Australia [46]. However, yield potential and N response have been shown to be independent of one another [47, 48], so higher yields with lower N fertilizer rates may be achievable [49, 50]. The nutritional content from large yields should be examined as grain quality may decrease with high yields and under climate change [37].
The simulated potential global production increase of 37% is a feasible scenario, as similar production increases have already been achieved in Chile and Argentina, although high-yielding crops may require higher inputs to support them [36, 45]. To prevent overestimation of the global potential yield in water-limiting areas, we assumed that the current production from low-rainfall areas (30% of the total 2020 global production [37, 51]) for all scenarios will not change because low-rainfall production is unlikely to benefit from the improved trait scenarios [41]. However, this is a risk-averse assumption, and it may be possible that low-rainfall areas could partially benefit from the modified trait scenarios which would further increase the potential production. It is also possible that breeding advancements increase the average wheat harvest index of 0.45 in the future [52, 53]. A harvest index of 0.61 has already been observed in modern elite winter wheat varieties [52], and the DH lines used in this study had an average harvest index of 0.49 across the three locations. While these genetic yield gains are promising, the global implementation of genetically improved cultivars is a laborious process. Providing a new commercially available wheat cultivar takes approximately 8–12 years [54], but an improved exchange of big data between breeding programs can accelerate the production of DH lines [55]. The combination of these modified traits and potential increases in harvest index are possible (figure S6), but this would still require multiple breeding cycles before cultivar release.
In regard to the simplified ERCU relationship, there is some uncertainty remaining in relating wheat productivity to incoming solar radiation because only a portion of the incident radiation is intercepted for photosynthesis depending on the crop canopy structure and irradiance received by leaves [56]. However, intercepted radiation can be approximated from incoming solar radiation because about 50% of incoming solar radiation is photosynthetic active radiation (PAR), and roughly 85%–90% of PAR is intercepted in the period when most biomass accumulation occurs, i.e. when leaf area index is above three for wheat, depending on canopy structure and angle of leaves [17, 57]. Studies using the high-yielding DH line in Argentina, Chile, and Mexico estimated the RUE for total above-ground biomass as ∼2.1 g MJ−1 intercepted solar radiation [15, 20], which is well above the average of 1.4 g MJ−1 intercepted solar radiation observed elsewhere for wheat [17, 58, 59]. The simulated cumulative intercepted solar radiation of the multi-model ensemble median (calculated by doubling the simulated cumulative intercepted PAR) suggests 66% and 71% of the cumulative incoming solar radiation was intercepted across the 34 locations in the simulations without and with modified traits, respectively. Assuming 71% of the incoming solar radiation was intercepted, the RUE becomes 2.2 g MJ−1 intercepted solar radiation, similar to the previous RUE using the high-yielding DH line [15]. Caution is advised when approximating intercepted solar radiation from the ERCU relationship because of seasonal variation in incoming solar radiation and the uncertainty in estimating light interception by leaves [56]. It is recommended only when the radiation interception rate is known. Intercepted solar radiation or intercepted PAR provides an accurate representation of crop dry matter accumulation [17, 60], but the availability of such data is often limited to local in situ measurements. The novel ERCU relationship is based on observed data and reveals the current upper limit of potential wheat yield gaps at the global scale for the development and improvement of global wheat adaptation strategies.
3. Conclusion
For the first time, a multi-model ensemble of existing wheat crop models has been shown to incorporate and reproduce the physiological trait advancements reported from recent high-yielding DH field experiments in different environments through modification of parameters within the models. Additionally, existing relationships between incoming solar radiation and wheat production have never before incorporated the trait advancements recently reported from DH wheat field experiments or used a solar radiation-wheat production relationship to estimate the upper limit of global genetic yield potential. These findings suggest that if wheat with improved physiological traits is grown across all high-rainfall and irrigated wheat-producing regions in the world, a potential increase of 37% of global wheat production and yield is feasible, as already achieved at sites in Argentina and Chile. There is also basis for doubling global wheat production and yield when only limited by solar radiation, although this is an elusive and immense challenge at the global scale. The 37% increase of global wheat production would meet the lower estimate of the projected future grain demand in 2050, without expanding the current agricultural cropping area. To achieve this, breeding strategies would need to optimize physiological traits with minimal trade-offs, while additional crop management inputs may be required to maintain such high yields.
The newly developed ERCU relationship can be applied as a simplistic upper benchmark, rather like the yield-water use function is routinely used in low-yielding rainfed agriculture [32], but with readily accessible, near real-time global incoming solar radiation data anywhere in the world (https://power.larc.nasa.gov). Farmers, scientists, and policymakers can use the ERCU relationship to benchmark local and regional yield improvements against observed high yields, provide a yardstick for sustainable intensification and potential yield gap analysis, and develop breeding adaptation strategies.
4. Materials and methods
4.1. Crop model ensemble evaluation
To determine if crop simulation models could reproduce the observed yield gains from measured high-yielding traits, we first evaluated the performance of 29 process-based wheat crop models (table S1) in simulating the observed yield potential of two spring wheat cultivars for multiple growing seasons at three different high-yielding locations with negligible water or nitrogen stress and full control of weeds, pests, and diseases. We used the maximum available agricultural model intercomparison and improvement project (AgMIP) wheat crop models in this ensemble since multi-model ensemble accuracy improves with the inclusion of each additional model [25, 61–63]. The check cultivar Bacanora was compared to a DH line resulting from a cross between cv. Bacanora and cv. Weebil with improved RUE, light extinction coefficient, grain filling rate, and potential grain size and slightly decreased fruiting efficiency and grain filling duration (table 1). These physiological traits were calculated from previous field experimental data observed at Buenos Aires (Argentina), Ciudad Obregon (Mexico), and Valdivia (Chile) by Bustos et al [15] and Garcia et al [20]. These locations had fertile soils and used best management practices to prevent yield limitation, e.g. N was applied ad libitum. The modified traits were selected specifically to increase photosynthesis and yield potential under non-stress conditions. The effects on grain quality or disease resistance were not examined. The RUE and light extinction coefficient were calculated using the mean percent change between Bacanora and the two best-yielding DH lines from Chile only because of limited measurements at Argentina and Mexico. The fruiting efficiency, grain filling duration, grain filling rate, and potential grain size were calculated using the mean percent change between the best-yielding DH line and Bacanora from each of the three locations.
The crop modeling experiment was conducted in two steps, model calibration followed by a 'blind' evaluation. In step 1, detailed crop growth data [15, 20] were provided to the modeling groups for five seasons at Valdivia, Chile (2008–2009, 2009–2010, 2012–2013, 2013–2014, and 2014–2015), one season at Buenos Aires, Argentina (2009–2010), and four seasons at Ciudad Obregon, Mexico (2009–2010, 1990–1991, 2015–2016 and 2016–2017) to give a total of ten site-year-treatment combinations with which to calibrate the models for the check cultivar Bacanora. The data at Ciudad Obregon, Mexico in 1990–1991 were obtained from a previous AgMIP study [26, 64]. Values for each season consisted of the mean of three replicated plots where the wheat crops were grown with ample N supply, full irrigation, and agronomic practices to reach potential yield for the local soil and weather conditions. All other crop protection factors including weed, disease and pest control, and potassium, phosphate, and sulphur fertilizers, were applied at levels to prevent limitations on yield. Total initial soil mineral N (NO3 and NH4) content was assumed to be equal to 140 kg N ha−1 to ensure negligible N stress. The temperature and solar radiation data were provided from a weather station located <2 km from the experimental field and the rainfall, wind speed, and relative humidity data were obtained using the NASA POWER database (https://power.larc.nasa.gov) [65, 66]. In step 2, a 'blind' simulation was conducted for the best-yielding DH line at each location using the same initial growing conditions from the calibration, without providing the modelers with observed data. Only the calculated trait percent changes (table 1) and instructions describing how to modify the calibrated cv. Bacanora traits for the high-yielding DH line were provided to simulate growth for three seasons at Valdivia, Chile (2008–2009, 2009–2010, and 2010–2011), one season at Buenos Aires, Argentina (2009–2010), and one season at Ciudad Obregon, Mexico (2009–2010). The model cultivar parameters that correspond to the physiological traits for each of the 29 models are provided in table S2. Not all models were able to modify all cultivar parameters (table S2).
4.2. Determination of ERCU
The ERCU relationship was developed by following the definition of yield potential from Reynolds et al [6]:
and the approaches of French and Schultz [32] in deriving the relationship between wheat production and water use, and of Bugbee and Salisbury [67] in calculating the potentially achievable yield from the photosynthetic photon flux in a controlled environment. The ERCU encompasses both RUE and radiation interception and is defined as:

calculated from the observed above-ground biomass per unit of incoming solar radiation (figure 2). The ERCU is similar to net primary production (NPP), a common metric in terrestrial ecosystem and forestry modeling calculated as photosynthetic CO2 fixation without autotrophic respiration [68], but NPP is the amount of carbon per unit of surface area per unit of time (gC m−2 d−1) while the ERCU is the rate of above-ground dry matter per unit of incoming solar radiation (g MJ−1). The ERCU uses total incoming solar radiation and RUE which are both standard inputs in most crop models. Total incoming solar radiation for each location and growing season was obtained from local weather stations and/or the NASA POWER database (https://power.larc.nasa.gov) [65]. The production potential threshold was determined from the linear fit between the best pre- and post-anthesis crop response from the high-yielding dataset. This was calculated using the average of the first two measurements of cv. Bacanora in Valdivia 2012 and the average of the final two measurements of the high-yielding DH line in Valdivia 2010 (figure 2). The biomass potential threshold was then multiplied by the harvest index of the highest yielding DH line, 0.45, to obtain the yield potential threshold (figure 3):

4.3. Crop model ensemble global simulations and extrapolation
After confirming that the 29-model ensemble median accurately reproduced the observed effects of the high-yielding traits (figure 1), 26 models of the ensemble (table S1) participated in simulating potential wheat production with and without the modified traits (table 1) from 1980 to 2010 at 34 high-rainfall or irrigated global locations including Buenos Aires, Ciudad Obregon, and Valdivia. As a check, steps 1 and 2 were reanalyzed with the 26-model ensemble to confirm that the ensemble median was still able to reproduce the observed high yield and biomass from the yield-enhancing traits (r2 = 0.92 and 0.64, respectively) (figure S7). 30 of the 34 high-rainfall or irrigated locations were from previous AgMIP studies [26, 37] with the addition of Buenos Aires (Argentina), Valdivia (Chile), Rots (France), and Leeston (New Zealand) (all locations shown in figures S4 and S5). As in the previous AgMIP studies, treatments were simulated with ample N supply, irrigation (if applicable), and with proper agronomic practices (e.g. typical sowing dates) for the local soil and weather conditions of each location. This ensured that the crop growth interactions with temperature, water, and soil dynamics corresponded to each location. All other crop management operations including weed, disease and pest control, and fertilizers, were applied at levels to prevent limitations on yield. Atmospheric CO2 concentration of 360 ppm was assumed for all years, so impacts from climate change or elevated atmospheric CO2 concentrations were not taken into account. For each location, region-specific check cultivars and cultivar parameters from a previous AgMIP study [26] were simulated with and without the modified traits (table 1) to emulate the crop response under the different global environmental and seasonal conditions such as temperature, rainfall, and solar radiation. Cultivar parameters for the individual crop models are shown in Asseng et al [26], and the various temperature functions in wheat crop models are presented in Wang et al [69]. Winter or spring wheat cultivars were chosen based on the available field experiment data and the dominant type of that region. Winter wheat cultivars have a higher yield potential than spring wheat cultivars because of the longer growing season caused by vernalization [70], so the benefits to spring wheat yield potential, especially through a driving trait such as RUE, would also likely benefit winter wheat yield potential [6, 19]. Additionally, similar to the high genetic yield gains in spring wheat observed at Chile by Bustos et al [15], a recent study also conducted at Chile observed high genetic yield gains in winter wheat grain yield, reaching up to 20.5 t ha−1 [71]. For each crop model, the cumulative seasonal incoming solar radiation for each location was calculated based on the simulated growing season. The multi-model ensemble median was then used to calculate the percent change between the simulated baseline yield without modified traits and the potential yield with modified traits at the 34 global high-yielding environments (figure 3, i.e. percent change between solid and open diamonds). We focus on the multi-model ensemble median because it has been shown to provide the best estimates when considering all variables [27].
To extrapolate the results to the global level, we upscaled both the crop model simulations from the 34 high-yielding locations and the ERCU upper limit to the global level using the same 'bottom-up' approach as in previous AgMIP studies [26, 37]. This approach used stratified sampling [72], a guided sampling method with several points per wheat mega-region [73]. The simulated results of each location were weighted by the FAO production that each location represented [26] (see supplementary methods). This 'bottom-up' stratified sampling approach has shown similar impact results as in the 'top-down' aggregation of simulated grid cells [74, 75] and reduced uncertainty when estimating yield potential and yield gaps compared to 'top-down' gridded frameworks [76]. The percent change of production was calculated between the simulated baseline scenario without modified traits and the simulated scenario with modified traits (figure 4). The percent change of production for the ERCU upper limit was calculated between the simulated baseline scenario without modified traits and the ERCU upper yield potential with modified traits. The weighted FAO production was multiplied by the percent change of production to obtain the additional production at each of the 34 locations for both scenarios. This additional production at each location was summed to calculate the total additional global production for both scenarios. The total production of the 34 high-rainfall or irrigated locations represented approximately 70% of global wheat production [37, 51], so 30% of the 2020 global average production was added to account for low-rainfall production (figure 4(b)), assumed to be constant for all scenarios because low-rainfall production is unlikely to benefit from the improved trait scenarios [41]. Global yields (figure 4(a)) were calculated by dividing the total global production scenarios in figure 4(b) by the total global wheat area harvested [7].
Acknowledgments
This study was a part of the Agricultural Model Intercomparison and Improvement Project (AgMIP) Wheat Phase 4. The study was supported by the International Wheat Yield Partnership (IWYP, Grant IWYP115) and the International Maize and Wheat Improvement Center (CIMMYT). Experiments carried out in Valdivia (Chile) were funded by IWYP, CIMMYT (Mexico), and the Chilean Technical and Scientific Research Council (CONICYT) by FONDECYT Project 1141048. The experimental work conducted at Valdivia by Dr Jaime Herrera (UACh) is appreciated. F T was supported by the National Natural Science Foundation of China (Project Nos. 31761143006 and 41571493). K C K was supported by the Ministry of Education, Youth and Sports of Czech Republic through SustEs (CZ.02.1.01/0.0/0.0/16_019/000797). Rothamsted Research receives support from the Biotechnology and Biological Sciences Research Council (BBSRC) through Designing Future Wheat (BB/P016855/1) and Achieving Sustainable Agricultural Systems (NE/N018125/1).
Data availability statement
The global agricultural data that support the findings of this study are publicly available at the Food and Agriculture Organization (FAO) FAOSTAT database (www.fao.org/faostat/) and the global incoming solar radiation data are publicly available at the National Aeronautics and Space Administration (NASA) Langley Research Center (LaRC) Prediction of Worldwide Energy Resource (POWER) database (https://power.larc.nasa.gov). Individual crop models and their documentation are listed in table S1.
The data that support the findings of this study are openly available at the following URL/DOI: https://doi.org/10.7910/DVN/VKWKUP. Data will be available from 01 November 2022.
Author contributions
J R G, S A, P M, F E, and H W conceived the study. J R G and S A co-wrote the manuscript and produced the figures. J R G, P M, and S D analyzed the crop model data. D C, M R, G M, D M, and G G conducted the observed field experiments and contributed to editing the manuscript. G S, F G, D P, and T S contributed to editing the manuscript. Authors from M A to Y Z performed the crop model simulations and are listed in alphabetical order. J R G and S A wrote the Supplementary Information.
Declaration of Interests
The authors declare that they have no competing interests.
Supplementary data (1.0 MB PDF)