

Abstract
The recent dry and warm years in Europe are often assessed as extreme in terms of socio-economic and environmental losses. However, the impact of a drought is a function of its duration. This fact needs to be considered in the evaluation of a drought. In this study, we use a hydrological model to analyze the 2018 European drought, an event that significantly affected vegetation. We show that the severity of the soil moisture drought is high in Central Europe and Mediterranean, but it does not reach the levels observed in the first half of the 20th century. Nevertheless, we demonstrate that when the multi-year 2014–2018 period is considered, its soil moisture drought severity is exceptional in a 253 year period, especially for Central Europe. While single-year droughts can be sustained by ecosystems like forests, the repeated stress exposure of such multi-year droughts may have significant impacts on their functioning. This is already evident in some regions of Central Europe, e.g. in the Czech Republic, Germany, and Poland.
Export citation and abstract BibTeX RIS

Original content from this work may be used under the terms of the Creative Commons Attribution 4.0 license. Any further distribution of this work must maintain attribution to the author(s) and the title of the work, journal citation and DOI.
1. Introduction
Year 2018 was globally the fourth warmest in the record according to four independent data sets (NASA-GISS (Hansen et al 2010), HadCRUT4 (Morice et al 2012), NOAAGlobalTemp (Smith et al 2008), JMA (Ishihara et al 2007, Huang et al 2015). In Europe, the highest temperature anomalies during 2018 were observed in Central Europe (January and April), and Scandinavia (May, July and November) (Climate Change Service Copernicus 2019). Record-breaking temperature during July and August caused large number of fatalities all over the continent—approximately 1500 according to the French Ministry of Health (Rösner et al 2019) or 863 in the United Kingdom (Public Health England 2019). In the same year, precipitation deficits occurred in various regions of Central and Northern Europe. The consequent natural hazards, such as severe drought and wildfires, affected substantially the ecosystem functioning (Biedermann et al 2019, Szejner et al 2019, Bastos et al 2020, Schuldt et al 2020) and resulted in severe socio-economic losses (Hlásny et al 2019). The fact that 2018 was the fifth consecutive year with unprecedented positive temperature anomaly accompanied by warm winters throughout the whole period (see section 4) led to extremely dry soils and steady depletion of groundwater tables throughout considerable part of Europe.
While some of these impacts reflect the actual hydroclimatic conditions, for the other cases the effects may accumulate in time, leading to much worse impacts than expected from the actual situation of the current year. This is the case for groundwater recharge (Tweed et al 2009), and ecosystem impacts particularly related to forest such as the potential outbreak of the eruptive forest insect (Biedermann et al 2019), reduction of aboveground biomass while maintaining the greenness (Sawada and Koike 2016) or decrease of tree vitality and resilience, and finally increase of tree mortality (Adams et al 2009, Goulden and Bales 2019). While the effects of the extreme year drought events on the vegetation are relatively well-studied (McDowell et al 2008), longer periods of multi-year extreme droughts did not receive so far such attention. According to studies by Van Dijk et al (2013) and Griffin and Anchukaitis (2014), cumulative impact of the slowly evolving phenomenon of drought can be revealed at a latter stage considering the effect over a longer accumulation period. On the other hand, it has been shown by Bachmair et al (2016) that the relation between impact severity and accumulation length may be different for different regions.
It has been previously shown (Hanel et al 2018, Brázdil et al 2019) that droughts of comparable or even larger severity with respect to recent droughts occurred in several past periods in Central Europe. Here we show that in the case of 2018, it holds true for precipitation and partly also for soil moisture. When seen from a long-term perspective, 2018 precipitation lies within normal range, and, although soil moisture drought severity is quite high over certain regions, it does not reach the levels noticed in the first half of the 20th century. To assess the extremity of recent drought at a multi-annual scale we utilize a long hydroclimatic dataset (Hanel et al 2018). It is shown that the dry period 2014–2018 is record-breaking in terms of aggregated soil moisture deficit during the last 253 years (1766–2018). We also discuss possible implications on agriculture and forestry which emerge from the long-lasting drought period.
2. Methods
Our analysis is based on the updated hydroclimatic datasets of Hanel et al (2018) including the year 2018 and extending the spatial domain to entire Europe. It utilizes the reconstructed climate fields of precipitation and temperature derived for the period 1766–2015 by Casty et al (2007) and E-OBS (Hofstra et al 2009) (daily gridded observational dataset for precipitation, and temperature in Europe) available for the period 1950 to present. The overlapping period allows for correction of biases in the dataset of Casty with respect to E-OBS, so the final product is used as an input into the mesoscale Hydrologic Model (mHM; Samaniego et al 2010, Kumar et al 2013b). mHM is a grid-based distributed model, which simulates major hydrologic processes (fluxes and states) on land surface, in the shallow soil and deeper subsurface water storages. A number of studies previously demonstrated the good performance of mHM to simulate variables such streamflow, evapotranspiration, groundwater and changes in the terrestrial water storage across Europe (Kumar et al 2013a, Rakovec et al 2016, Hanel et al 2018, Samaniego et al 2019). The model source code is free available in online repository git.ufz.de/mhm. The mHM simulations are conducted at a spatial resolution of 0.5 degree and monthly time step over the 253 years period (1766–2018). The analysis is focused on the assessment of the severity of meteorological and agricultural drought—represented by lack of precipitation and soil moisture, respectively—over Northern Europe (NEU; Scandinavia, British Isles and Iceland), Central Europe (CEU; continental Europe north of 45∘ N latitude) and the Mediterranean (MED; Iberian Peninsula, Italian Peninsula and Balkan Peninsula) as defined by Seneviratne et al (2017). This arrangement is used in terms of latitudinal spatial position. Longitudinal spatial position is considered based on regions adopted from Grillakis (2019)—west (British Isles, France, and Iberian Peninsula), central (Mid-Europe, Alps, and Italy), and east (Eastern Europe, East Mediterranean (Balkans)) (see figure S1 in supplementary information (available online at stacks.iop.org/ERL/16/034062/mmedia)).
We analyze monthly (reconstructed) precipitation and mHM-simulated soil moisture for each grid cell. Three-month moving average is used to smooth out the month-to-month variability of precipitation in the same way as in Hanel et al (2018). The series are standardized to allow for comparison across space (different climate types) and time (different periods) and to remove seasonality. The standardization is done individually for each month in year by Φ−1(p) with Φ−1 the quantile function of the standard normal distribution and p the probability from the empirical cumulative distribution function. The frequently used q20 threshold (Van Huijgevoort et al
2014, Van Loon 2015a, Wanders et al
2015, Hanel et al
2018) is adopted to identify the drought events (i.e. all values below the 20th percentile were considered drought). Standardization for each calendar month allows for identification of drought periods throughout the whole year as is the case for the often used variable threshold method. For each year, the sum of the values below the threshold is calculated and these annual sums are then aggregated for considered time scales (1–5 years). Finally, a drought severity, as one of the drought properties (duration, intensity, and severity) is calculated (e.g. Wilhite 2000, Van Loon 2015a). The drought severity for individual time periods is expressed through the exceedance probability which is calculated using ![$1 - [(r - 0.3)/(N + 0.4)]$](https://content.cld.iop.org/journals/1748-9326/16/3/034062/revision4/erlabe828ieqn1.gif) , where r is the rank of the aggregated below-threshold values and N the total number of periods for considered time scale. The exceedance probability represents the likelihood that the drought severity in specific period (e.g. 2014–2018) is the same or larger (estimated from the whole 253 year period), i.e. the smaller the exceedance probability the more severe the drought.
, where r is the rank of the aggregated below-threshold values and N the total number of periods for considered time scale. The exceedance probability represents the likelihood that the drought severity in specific period (e.g. 2014–2018) is the same or larger (estimated from the whole 253 year period), i.e. the smaller the exceedance probability the more severe the drought.
Continuous increase of precipitation deficit since 2014 is reported in Central Europe (Cekal 2018, Czech Hydrometeorological Institute 2019), that is why the study is focused on multi-year (2–5 years) drought assessment. In the main text, however, we report only the assessment of 1, 3 and 5 year time scales. Brief summary of 2–4 year drought analyses can be found in supplementary information in section S7. In line with the United States Drought Monitor, the droughts with exceedance probability  are referred to as 'extreme drought' (in other words 'extreme droughts' in our study refer to the 5% most extreme droughts over the 253 year period). Based on the area under extreme drought we select 5 most severe dry years and dry periods, which are compared with the year 2018 and 2014–2018 period (see figure 5 and also supplementary information, section S3).
The definition of the growing season for this particular study combines known onset of phenological stages as well as regional drought sensitivity of crops and forests across European regions. Following in general work of Rötzer and Chmielewski (2001) the growing season beginning is set to March for MED, to April in CEU and to May for NEU. As Trnka et al (2012) have shown across 11 European regions, the period from April till June are critical for drought impacts of key cereal crops across their growing areas in central and southern Europe. Similarly, spruces have been shown to be most sensitive to climate condition including drought between May and July (e.g. Kolár et al 2015) while drought adapted lowland oaks show their highest sensitivity between June and August (e.g. Rybnícek et al 2021). Therefore, months from May to August are included into growing seasons of all three defined regions and April in case of MED and CEU. The leaf fall on average occurs in October across much of Europe (Rötzer and Chmielewski 2001) and marks the very end of active growing season. The end of the conditions with positive net assimilation usually occurs somewhat earlier especially in higher latitudes. Therefore, September is set as the growing season end date for CEU and NEU regions while for more southern MED region it is October.
3. Hydroclimatic conditions during 2018
Precipitation anomalies of 2018 in Europe with respect to average over the period 1981–2010 (figure S2(a) in supplementary information) show a clear north-south dipole, with precipitation deficit in the north and surplus in the south (Toreti et al 2019). If we look at the standardized precipitation totals of 2018 from the 253 year perspective (figure 1(a)) we can see a similar spatial pattern. The beginning of 2018 up to spring was predominantly wet for most parts of Europe. During early summer, the precipitation activity in Central and Northern Europe was affected by atmospheric blocking, resulting in precipitation deficits (Sousa et al 2017). Finally, September was the turning point for precipitation (see Hänsel et al 2019 for further details). Since then, Europe received fair amounts of rainfall until the end of the year. On the contrary, the standardized mean temperature of 2018 from 253 year perspective (figure 1(c)) shows a homogeneous pattern, covering the entire continent with values higher than the long-time average (see figure S2(b) in supplementary information), except for some parts (south-west) of the Iberian Peninsula. The beginning of the year was predominantly cold. The most extreme temperature anomaly was recorded in April with Central Europe reporting the warmest April since the weather record started (Hänsel et al 2019, Ionita and Nagavciuc 2020). In fact, all the months till December were exceptionally warm with respect to 1981–2010 average.
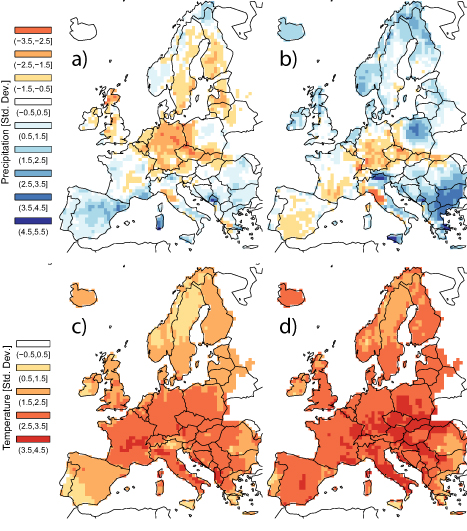
Figure 1. Standardized precipitation totals for (a) 2018 and (b) 2014–2018 period; standardized mean temperature for (c) 2018 and (d) 2014–2018 period across Europe. After subtracting the mean, the values at 1 and 5 year scales, were divided by standard deviation (at corresponding time scale) to obtain the standardized precipitation and temperature at each grid cell.
Download figure:
Standard image High-resolution imageThe high-pressure blocking that characterized the 2018 summer drought was caused by a combination of factors among them the most prominent one was the weaker than usual jet streams (Trouet et al 2018, Drouard et al 2019, Kornhuber et al 2019, Ionita et al 2020). The state of climate was not favorable for frontal systems coming from the Atlantic Ocean or the Mediterranean Sea to Central Europe. The blocking hindered the westerly winds and cloud formation, as well as precipitation, which resulted in long-lasting widespread drought and record high temperatures (Rösner et al 2019). This resulted in relatively stable advection of hot and dry air from eastern Europe (Buehler et al 2011). Similar weather conditions and their synoptic causes prevailed in Central Europe in the year 2015 (Ionita et al 2017) and also during 1994 and 2006 (Lhotka et al 2018, Tomczyk and Bednorz 2019). A statistically significant trend in increasing time-share of drought conducive synoptic situation over central Europe has been reported in previous studies (Trnka et al 2009, Lhotka et al 2020, Ionita et al 2020).
4. Hydroclimatic conditions during period 2014–2018
The period 2014–2018 started with the warmest winter since 1950. The year 2014 was in general exceptionally warm (the warmest on the record) over all seasons with highest temperature anomaly during spring (up to 4 ∘C). The annual precipitation amount was close to normal over the most of continental Europe except for the Balkan region and parts of Italy (Blunden and Arndt 2015). Winter 2014–2015 was exceptionally mild over Scandinavia and the eastern European region. The Icelandic low and the Azores high governed the climatic situation over western part of Europe resulting in high precipitation totals in the north and dry and warm south. Overall the mean land surface air temperature was above the 1961–1990 normal, only 0.2 ∘C short of the previous year. Precipitation totals in 2015 were below average across most of continental Europe and Iceland (60%–80% of normal). Parts of the British Isles, northern Europe, and the central and eastern Mediterranean recorded significantly above-average totals of 125% of normal and locally up to 170% of normal (Blunden and Arndt 2016). Winter 2015–2016 also showed positive NAO index which resulted in warmer than normal band from Ukraine to England. The annual mean land surface air temperature in 2016 was +1.41 ∘C higher than the 1961–1990 normal. The higher the latitude the higher the temperature anomaly. Precipitation totals were higher than long-term average in northern Scandinavia and parts of Balkans. Southern part of Europe saw the drier-than-average conditions. Rest of the Europe was near to normal (Blunden and Arndt 2017). Winter 2016–2017 was exceptionally mild over Scandinavia with temperature anomalies reaching more than +4 ∘C, whereas the southern Balkan states, Greece, and Turkey recorded widespread below-average temperature anomalies down to −2 ∘C. Winter in Europe was dry with values ranging mostly from 40% to 60% of normal, except for the Norwegian coast, which was wet with some locations exceeding 167% of normal. The annual mean temperature deviation was no different from the previous years exceeding +1.3 ∘C from the long term normal. Large parts of Europe had near-normal precipitation totals. Northeastern Germany and northern Poland recorded above-normal precipitation totals up to 167%. On the other hand on the Iberian Peninsula, in southern France, and Italy precipitation totals reached only 60%–80% of normal precipitation (Hartfield et al 2018).
The standardized precipitation totals over the period 2014–2018 are shown in the figure 1(b) showing that Balkans received unprecedented surplus of precipitation within the last 253 years. On the other hand central Europe and Iberian peninsula exhibited evident lack of precipitation from long term perspective. The fact that all years from period 2014–2018 were exceptionally warm was translated to significantly higher standardized mean temperature over whole European continent during the last 253 years (see figure 1(d))
5. The 2018 multi-year drought in a long-term context
Large part of Europe has been under soil-moisture drought for considerable fraction of the 2014–2018 period. Almost entire central Europe and significant part of Iberian and Italian peninsula (almost 32% of European continent—calculated from the total number of grid cells) were under drought conditions at least 40% of the time during this period on average (growing season and of non-growing season combined) (figure 2(c)). The drought conditions that directly affect the agriculture sector are more severe when only growing season is considered (figure 2(a)), showing that 43% of European continent endured during the period 2014–2018 in average at least 40% of dry months during growing season. The region with high percentage of winter droughts during the period 2014–2018 is located mostly in south-west Europe (see figure 2(b)).
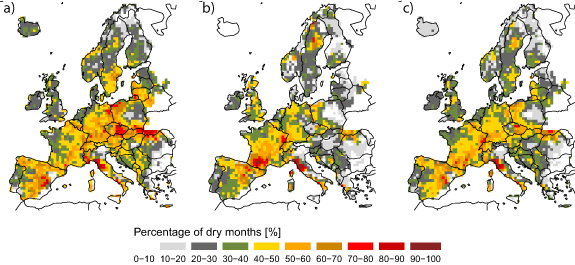
Figure 2. Percentage of dry months in terms of soil-moisture within the growing season (a), outside of the growing season (b) and combination of within and outside of the season during the period 2014–2018 (c). The color of the grid cell represents average fraction/percentage of dry months (months below the q20 threshold) in each year within period 2014–2018. The growing season for certain regions within the European continent was defined as follows: the Mediterranean: March–October; Central Europe: April–September; Northern Europe: May–September (see section 2).
Download figure:
Standard image High-resolution imageOur analysis shows that despite below-normal precipitation (with respect to 1981–2010 average) (figure S2(a) in supplementary information) the severity of the precipitation drought at annual scale was not particularly high for most parts of Europe except for isolated areas in Central Europe and southern France (figure 3(a)). On the contrary, the severity of soil moisture drought in large parts of Central and Northern Europe was extremely high (figure 3(d)). In addition, the comparison of the 2018 annual soil moisture drought with the top five most severe soil moisture drought years (1858, 1921, 1945, 1947 and 1959—selected based on the biggest area under extreme drought (grid cells with exceedance probability  )), shows that it is one of the most severe droughts over the past 253 years (1766–2018) in Germany, Czech Republic, Slovakia, Baltic countries and Sweden (see figure S3, bottom row; in the supplementary information). The soil moisture drought severity follows the same spatial pattern as that of the temperature anomalies (figure S2(b) supplementary information) suggesting the critical role of increased atmospheric evaporative demand (through its linkage to positive temperature anomaly) in driving the soil moisture deficit patterns as noticed during the 2018 drought.

Figure 3. Exceedance probability (%) of drought severity for precipitation and soil moisture for annual, 3 year and 5 year time scale. The visualization is based on the annual sums of droughts (see section 2), i.e. inside and outside of growing season is considered. The bar below each map shows areal fraction of given exceedance probability (i.e.  ,
,  ,
,  ,
,  ) within the domain.
Download figure:
Standard image High-resolution imageThe 3 year scale shows the transition of the drought phenomenon extremity between annual and 5 year time scale, which reflects the fact that the more years are considered within the period 2014–2018, the more extreme this period becomes. This also shows the multi-year nature of the drought within this period. The evolution of drought extremity in terms of precipitation reveals several hotspots, such as Western Mediterranean or Eastern Central Europe, with extreme precipitation drought severity (exceedance probability  ) covering only 4.6% area of Europe (figure 3(b)) (calculated as fraction of extreme drought severity grid cells out of total number of grid cells covering the domain). At 3 year scale, we observe that the extreme soil moisture drought (exceedance probability
  ) extends from some regions of Central Europe, the British Isles and Baltic countries (at annual scale), to Western Europe and the Mediterranean, covering 12.5% area of Europe and 17% only in Central European region (figure 3(e)). The transition can be also seen in figures 4(b) and (e) where the numbers of grid cells under the extreme drought for 3 year scale lie between annual and 5 year scale.
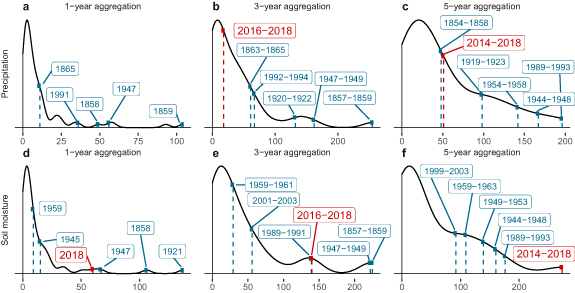
Figure 4. Distribution of the number of grid cells under the extreme drought (i.e. with exceedance probability  ) in annual, 3 year and 5 year time scale, Central Europe. The visualization is based on the annual sums of droughts (see section 2), i.e. inside and outside of growing season is considered. The horizontal axis represents the number of grid cells under extreme drought, the vertical axis probability. The figures were produced using Kernel density estimation. The highlighted periods (in blue) correspond to those which were selected based on the largest area under extreme drought (either precipitation or soil moisture) in comparison to 2018 and its corresponding scale (in red).
Download figure:
Standard image High-resolution imageAt the 5 year scale, the soil moisture drought severity during the 2014–2018 is exceptional over the last 253 years (see figure 5, bottom row where the 2014–2018 period is compared to 5 most severe soil moisture drought periods based on the number of grid cells with exceedance probability  ). High precipitation drought severity prevail in the Western Mediterranean and parts of Eastern Europe (figure 3(c)). This is in-line with the findings regarding the well-documented Mediterranean drying pattern (Mariotti et al
2008, Shohami et al
2011, Hoerling et al
2012, Kelley et al
2012). At the same time, Northern Europe experienced less extreme precipitation droughts than the Mediterranean and Central Europe (see figure S5, right panel; supplementary information). Years 2015 and 2018, received the least precipitation within the period 2014–2018 in these regions (see figure S6, left panel; supplementary information). The 5 year soil moisture drought severity is spatially more coherent as compared to the precipitation pattern (see figure 3). Almost 96% of Europe is covered by soil moisture drought with exceedance probability up to 40%, and out of which almost 21% endured the exceptional soil moisture drought conditions (i.e. exceedance probability
). High precipitation drought severity prevail in the Western Mediterranean and parts of Eastern Europe (figure 3(c)). This is in-line with the findings regarding the well-documented Mediterranean drying pattern (Mariotti et al
2008, Shohami et al
2011, Hoerling et al
2012, Kelley et al
2012). At the same time, Northern Europe experienced less extreme precipitation droughts than the Mediterranean and Central Europe (see figure S5, right panel; supplementary information). Years 2015 and 2018, received the least precipitation within the period 2014–2018 in these regions (see figure S6, left panel; supplementary information). The 5 year soil moisture drought severity is spatially more coherent as compared to the precipitation pattern (see figure 3). Almost 96% of Europe is covered by soil moisture drought with exceedance probability up to 40%, and out of which almost 21% endured the exceptional soil moisture drought conditions (i.e. exceedance probability  according to the United States Drought Monitor). Regions with the highest soil moisture drought severity are concentrated in Central Europe; namely in Germany, France, Switzerland, Belgium, Czech Republic and northern Spain (figure 3(f)).

Figure 5. Exceedance probability (%) of drought severity for precipitation (top row) and soil moisture (bottom row) in 5 year time scale. The visualization is based on the annual sums of droughts (see section 2), i.e. inside and outside of growing season is considered. The presented periods in this comparison to 2014–2018 correspond to those which were selected based on the biggest area under extreme drought (either precipitation or soil moisture) (grid cells with exceedance probability  ). The bar below each map shows areal fraction of given exceedance probability (i.e.
  ,
,  ,
,  ,
,  ) within the domain.
Download figure:
Standard image High-resolution imageAlthough Central Europe did not experience extreme precipitation drought (exceedance probability  ) in 2018 (figure 4(a)), approximately one third of the area was affected by extreme soil moisture drought (figure 3(d)). Yet, the empirical density function of all drought events shows that the extremity of 2018 was not that profound in this region (figure 4(d)). The picture changes significantly in the 5 year time scale. While the areal fraction corresponding to extreme precipitation drought was quite high (21%) in the Mediterranean region (figure 3(c)), in Central Europe it reached 14.3% but still ranked among the five worst precipitation droughts in the record (figure 4(c)). In Central Europe, the extreme soil moisture drought of 2014–2018 was found to have the largest spatial extent in the record (figure 4(f)). The fractional area corresponding to extreme drought (precipitation and soil moisture) over 2014–2018 period is also remarkable for the Mediterranean region (see figure S7 in supplementary information). It is worth noting, that in Northern Europe, the precipitation drought was not extreme at either annual (2018) or 5 year time scale (2014–2018). On the contrary, the soil moisture drought was extreme over a part of the area at the annual and 5 year time scale (see figure S8 in supplementary information).
The year 2019 was even warmer than 2018 with anomalies above +1.0 ∘C. Precipitation totals reached only +7 mm above normal and the regions with highest positive precipitation anomalies were found in northern areas of Europe and in some parts of Mediterranean due to the heavy rains while mid latitudes stayed mostly drier than normal (Blunden and Arndt 2020). Also 2020 so far was warmer than long term average over virtually all of Europe, more so in the east. Precipitation anomalies showed negative values over parts of central Europe (Germany, Poland) but other than that the rest of the Europe exhibited positive precipitation anomalies (Hersbach et al 2020). In this way we can presume that for central Europe the dry period still continues. The rest of the Europe is a subject of further research.
6. Implications of the multi-year European drought
Agriculture is where the most obvious and direct effects of summer droughts can be found. It is, however, essential to pay attention to the overall not just seasonal consequences of 2014–2018 drought period as it negatively affected the farming systems as the whole. Even when taken individually, they caused massive damage to the farmers. In the Czech Republic alone the first drought of 2015 led to reported 104 million Euro damage, which rose to over 300 million Euro in 2017 and one billion Euro in 2018 (see the table S1 in supplementary information section S8 where we show the number of active reporters within the Czech drought prediction system Intersucho (Trnka et al 2020) as an indirect effect of the cumulation of drought impacts on agriculture which shows a clear increase as the drought prolongs.). Paid assistance to farmers in million Euros for Austria reached 175 (2015), 140 (2017), and 210 (2018) (Österreichische Hagelversicherung VVaG 2019) showing also progressively growing tendency over this 4 year period. For many countries, the year 2018 has seen a substantial increase in the damages that have been estimated around three billion Euro in Germany resulting in 340 million Euro direct support there. Sweden with Poland supported their drought struggling farmers with around 116 million Euros each (Valeria D'Agostino 2019). Governments of France, Ireland, Denmark and Baltic countries weighed in with specific measures focused on easing the strain on farmers caused by drought. Not only field crops (e.g., wheat, maize, barley or potatoes) were negatively affected in Central and Eastern Europe, British Isles and Scandinavia but also pastures from eastern France to the western Czech Republic and from north of Alps to southern Scandinavia showed very poor growth performance (van den Berg and van der Velde 2018, Beillouin et al 2020).
When it comes to the long-term propagation of the drought phenomenon, another, a less noticeable impact is also present. Multi-year droughts, that are characterized by the limited water availability during the vegetation season and missing recharge in winter lead to depletion of the deeper soil water. That is why they are critical for the growth, vitality and survival of the mature trees (Berdanier and Clark 2016, Goulden and Bales 2019, Scharnweber et al 2020). A combination of those two factors can create long-term stress, which can in turn decrease the tree vitality and diminish the tree drought-defense mechanisms (Adams et al 2009). This is much more profound in the regions where the present tree species were not naturally adapted to such severe drought conditions, such as in central Europe. Buras et al (2020) discuss the so-called drought-legacy effects when the effects of the 2015 and 2018 drought together caused significant forest decline. This is in line with evidence we highlight in this study when a 5 year cumulative drought period, especially in central Europe, has potentially severe effects on the trees and forests.
The current large-scale collapse of the conifer plantations across central Europe (see figure 6) could be a possible outcome of such drought-legacy effect (Senf et al 2020). The extreme multi-year 2014–2018 soil moisture drought significantly weakened trees and forest ecosystems across central Europe. Especially the forest plantations of the conifer trees such as Norway spruce (Picea abies) are among the most heavily impacted systems (Biedermann et al 2019). Intensification of the forest management over the last 150 years has caused a transformation of the natural forests into a homogeneous plantation of the commercial conifer trees, which are naturally very vulnerable to any kind of stress (Hlásny et al 2019). The current multi-year drought has strongly decreased spruce tree defense over large regions of Central Europe. As a result, an unprecedented outbreak of European spruce bark beetle (Ips typhographus) has affected millions of hectares of forests stands in several countries (Biedermann et al 2019). Despite the fact we do not have precise information available, the conservative estimates show that till the end of 2019 close to 200 million of m3 of wood was damaged and lost, when only in the Czech Republic (CZ), close to 70 million of m3 was damaged (International Forest Industries 2020, Timber Industry News 2020). The estimated values for the year 2020 alone are between 40 and 60 million m3 of the cut wood. There is an evident sharp increase of the cut wood (figure 6) caused by the unprecedented increase of salvage logging caused by natural disturbances such as wind, bark beetle or drought. The proportion of the salvage logging from 2000 till 2015 was relatively stable with two peaks in the 2003 and 2007 caused by the windstorms. The sharp increase of the salvage logging since 2016 was caused by the onset of the bark beetle outbreak triggered by drought. Mainly spruce and pine plantations across the whole country were affected. In 2018 and 2019, the proportion of the salvage logging on the total cuttings was over 90%. The prediction for 2020 is similar. There is no historical parallel for such an collapse of the spruce and pine monocultures triggered by the reported drought in Central Europe in the modern forest history. The outbreak caused a huge economic loss for forest owners and in many regions, resulted to the collapse of the forest management because of the rapid decline of the wood price (Hlásny et al 2019). These outbreaks also have a negative impact on the ecosystem services (water, soil and carbon storage) (Biedermann et al 2019) and further contribute to ongoing climate change.

Figure 6. Development of the annual cuttings in the commercial forests of the Czech Republic (CZ) since 2000 together with the occurrence of the dry months. The red lines represent the total amount of the woodcut annually (million m3) in the commercial forests of the CZ. The annual amount of the salvage logging is shown by the orange line. From 2000 till 2015 the annual amount of the cut wood was oscillating around 17 million m3. This amount represents more or less mean annual wood increment in the country and thus respect the principle of the sustainable use of wood resources. Since 2016 the total annual amount of the cut wood sharply increases, reaching the values over the 30 million m3 for 2019. Source of cuttings data: (The Czech Statistical Office 2020).
Download figure:
Standard image High-resolution image
Another factor that should be highlighted is the role of positive feedbacks that can exacerbate drought propagation (Zhou et al 2019). It has been found that summer temperature extremes are related to soil moisture-temperature feedbacks (Seneviratne et al 2006, Fischer et al 2007, Diffenbaugh and Ashfaq 2010, Whan et al 2015, Lorenz et al 2016, Vogel et al 2017). Liu et al (2020) confirmed strong soil moisture-temperature coupling in the Central Europe during 2018 heatwave and, in the same time, weak coupling in Northern Europe due to the smaller soil moisture deficits. In addition to this direct feedback, it is also suggested that soil moisture-precipitation feedback plays a role in precipitation occurrence (Eltahir 1998, Schär et al 1999, Koster et al 2004) which is assumed to further decrease in Central Europe in the future (Vogel et al 2018). These feedbacks are found to be stronger in multi-year/multi-decadal time scale than at a short-term scale of subseasonal, seasonal, or interannual (Vogel et al 2017). Furthermore, due to the soil moisture feedbacks the effect of drying soil enhances itself in such a strong loop which is not possible to compensate with higher rainfall amounts (evidence in the Mediterranean in 2018). On top of this, some authors also attribute the decrease of soil moisture over coarser time scales to the systematic change of the European landscape in favour of agriculture (Chen et al 2009, Jayawickreme et al 2010, Wang et al 2012, 2013).
7. Conclusions
Through the hydrological simulation analysis we highlight the severity of soil moisture drought at 5 year time scale over the 2014–2018 period, especially in Central Europe. Such multi-scale fluctuations are common in European hydroclimate (Markonis et al 2018a) being a result either of persistence in hydroclimatic processes (Markonis et al 2018b), or due to repeating intra-annual extremes, such as extreme summer droughts (Hari et al 2020). Thus, even though annual mean deficit for individual years does not necessarily appear exceptional, the aggregated deficit over the whole 2014–2018 period clearly stands out as the most extreme 5 year drought period in the record. It remains an open question to what extent the exceptional drought severity within this period can be attributed to atmospheric circulation and increasing evaporative demand due to high temperatures and lower cloudiness (Trnka et al 2015). Nevertheless, the combination of relatively mild precipitation deficit and extremely severe agricultural drought points out to increasing aridity which is also consistent with findings of Markonis et al (2021) reporting coinciding increasing trends in temperature and agricultural drought together with a decrease in meteorological drought. We emphasize that the apparent increase in aridity (or soil moisture deficit) during recent periods implies critical considerations for future water management strategies in an anthropogenic warming context (Dai 2013, Samaniego et al 2018).
The consequences of multi-year drought are in general larger than expected from the simple aggregation of annual drought impacts in many sectors such as agriculture, forestry or water resources (Van Dijk et al 2013, Griffin and Anchukaitis 2014). We recognize that multi-year impacts could vary substantially depending on the detailed spatio-temporal evolution of drought events across many seasons and sectors under considerations (e.g. Stagge et al 2015, Blauhut et al 2015, Bachmair et al 2016, 2017). Furthermore, droughts evolve slowly and generally it is very difficult to precisely estimate the initial and end points of a drought event with its characteristics varying over a range of space and time (e.g. Lloyd-Hughes 2012, Samaniego et al 2013, Haslinger and Blöschl 2017). Thus, it is still unclear whether the multi-year drought is a single event or the result of reoccurring intra-annual events, such as warm-season droughts (Hari et al 2020, Markonis et al 2021). Here we analyze the multi-year droughts from the perspective of different temporal time scales ranging from 1 to 5 years within which we find a recent period 2014–2018 being one of the exceptionally dry and warm on record, especially over the Central Europe. The detrimental effect of the multi-year drought can be minimized by proper development of coping and resilience ability which can rely on adequate policy, institutional and management decisions and resource availability (Tortajada et al 2017). This is particularly important as the impacts of extreme and multi-year/multi-region droughts to agriculture are expected to increase over the 21st century according to climate model projections (Trnka et al 2019, Hari et al 2020). Therefore, current water resource management policies should be revisited, also considering the multi-scale propagation of extreme drought events.
Acknowledgments
This work was carried out within the bilateral project XEROS (eXtreme EuRopean drOughtS: multimodel synthesis of past, present and future events), funded by Czech Science Foundation (Grant No. 1924089J) and the Deutsche Forschungsgemeinschaft (Grant No. RA 3235/11). M T and partly M H contribution was supported by SustES—Adaptation strategies for sustainable ecosystem services and food security under adverse environmental conditions (CZ.02.1.01/0.0/0.0/16_019/0000797). We thank Jamie Hannaford and one anonymous reviewer for their constructive remarks and suggestions. We acknowledge the E-OBS dataset from the EU FP6 project ENSEMBLES (http://ensembles-eu.metoffice.com) and the data providers in the ECA&D project (www.ecad.eu).
Data availability statement
The data that support the findings of this study are available upon reasonable request from the authors.