


Abstract
We report on the first experimental observation of a spontaneously formed transport barrier in the tokamak with a circular configuration in helium plasmas. There was no external polarization of the plasma by electric field or other technique to form the barrier as it is typically used in tokamaks with circular plasma. In general, the transport barriers play an important role in plasma confinement especially in tokamaks with divertor configuration. In our experiments, we clearly observe distinct characteristics of a transport barrier, including a steep gradient of the electron temperature and an enhanced radial electric field along with the change in the plasma potential, floating potential, and electron temperature fluctuation. The electron temperature and the plasma potential are obtained by a combination of the ball-pen and Langmuir probe measurements with high temporal resolution on a shot-to-shot basis. This first experimental observation of the spontaneously formed transport barrier might bring new possibilities to obtain a fusion-relevant study of the edge plasma parameters and transport in helium plasmas even on small tokamaks.
Export citation and abstract BibTeX RIS

Original content from this work may be used under the terms of the Creative Commons Attribution 4.0 license. Any further distribution of this work must maintain attribution to the author(s) and the title of the work, journal citation and DOI.
1. Introduction
Transport barriers are localized regions within the tokamak plasma where the turbulence-driven transport of particles, heat, and momentum is significantly reduced. The formation of transport barriers plays a crucial role in enhancing plasma confinement, thus improving the overall performance of fusion devices such as tokamaks. Since the transport barriers and transitions into regimes of better confinement were observed for the first time, so-called H-mode, firstly observed on ASDEX [1], a high effort to understand the underlying processes and mechanisms of their formation was being made. The latest research [2, 3] and also the previous work [4] showed a clear relationship between transport barriers and E × B shear flows. Shear flows can suppress turbulent transport by decorrelating turbulent structures (blobs), leading to both better particle and energy confinement. Under specific conditions, transport barriers can be formed spontaneously. This usually happens in tokamaks with divertor configuration ASDEX-Upgrade [5], DIII-D [6], JET [7], COMPASS [8], PDX [9], or even on stellarators W7-AS [10], when the power input into the plasma is increased above a certain threshold [11]. In the previous experiments on tokamaks with limiter configuration, the transport barrier and associated shear flow was achieved only by using a massive biasing electrode to polarize the plasma by radial electric field as shown in ISTTOK [12], CASTOR [13], CCT [14], TEXTOR [15], TUMAN-3 [16], and J-TEXT [17] and recently also on HBT-EP [18]. This electrode was typically strongly interacting with plasma, causing high impurity content and long shadow in the flux tubes, which can hinder the studies of the plasma transport and confinement. In TUMAN-3, the H-mode was also triggered by edge plasma perturbations due to strong gas puffing and LiD pellet injection.
However, in this work, we present for the first time a possible spontaneous formation of the transport barrier measured in the electron temperature on the GOLEM tokamak with a circular configuration in helium plasmas. Tokamak GOLEM [19] is a small device located at CTU University in Prague, with full remote control. It has the possibility to measure profiles and fluctuations of plasma potential and electron temperature with high temporal resolution. In this experiment, we observed a gradually increasing radial electric field accompanied by the formation of a steep gradient of the electron temperature in the scrape-off layer (SOL). The difference between helium and hydrogen discharges on GOLEM have been studied in [20]. Despite numerous experiments, the spontaneous formation of a transport barrier had never been observed in hydrogen plasma or any other helium discharges on the GOLEM tokamak before. Several experiments with biasing electrodes were performed in hydrogen plasma without any observed impact on the plasma transport. On the other hand, many plasma biasing experiments were taken on CASTOR tokamak (the original name of the GOLEM tokamak, before it was placed on CTU), where the plasma was affected [13, 21] in a similar way to the spontaneous formation, which will be described later in this paper. This includes an increase of the poloidal velocity, steep gradient formation, or reduction of electrostatic fluctuations.
Although the invasive method using the biasing electrode can provide interesting results, the spontaneously formed transport barrier accompanied by a strong shear flow in circular plasma on GOLEM, as similarly observed on tokamak with divertor configuration, might be more relevant to study the particle and heat transport. The results from GOLEM helium discharge might also contribute to various numerical codes validation [22, 23].
This article is organized as follows. The experimental setup will be described in section 2. The calibration of the combined probe will be described and performed in section 3. The formation of the transport barrier itself is shown and discussed in section 4.
2. Experimental arrangement with limiter configuration
Tokamak GOLEM (R = 0.4 m, a = 0.085 m) has a circular cross-section vacuum chamber and limited plasma with an ohmic heating regime. The maximum plasma current is 5 kA, and the maximum toroidal magnetic field, which is not constant during the discharge, is up to 0.5 T. GOLEM has no active gas puffing during discharge and hence no density control. Typical core electron temperature is 100 eV, and the line averaged density up to  19 m−3 [24]. Tokamak GOLEM is equipped with several basic diagnostics. Besides the standard ones for the basic plasma parameters measurements, various electric probes are used (Langmuir probe (LP), double-rake probe, tunnel probe, ball-pen probe (BPP), rake probe). In our measurements, we used an adjustable manipulator equipped with a combined BPP and LP, which is installed in the bottom diagnostics port (see figure 1).
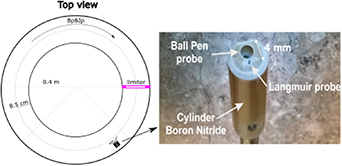
Figure 1. Left—the experimental arrangement for the combined probe measurements with limiter configuration, top view. Right—the photo of the combined ball-pen (diameter 4 mm) and Langmuir probe (diameter 1 mm) head. The probe head was made of boron nitride and installed in the bottom diagnostics port. Mirnov coil ring consisting of 4 coils is placed around the limiter. The magnetic field and the plasma current are clockwise oriented.
Download figure:
Standard image High-resolution imageThe LP measures either in a floating regime or can be biased to the voltage in the range of −120–40 V. The ball-pen probe is a modified electric probe constructed to measure plasma potential directly in magnetized plasmas [25]. The collector of the ball-pen probe is retracted into an insulating shield by 2.4 mm. The Langmuir and ball-pen probes, separated poloidally by 4 mm, are installed on the radially adjustable manipulator. The radial position of the probe head and the voltage applied on the LP can be changed between discharges to measure ion-current (IV) characteristics on the shot-to-shot basis. The LP can be also floating, measuring the floating potential. The experimental arrangement showing the basic toroidal configuration is shown in figure 1. The magnetic field is measured using Mirnov coils, installed on a single circular rack located inside the limiter.
3. Ball-pen probe calibration in helium plasma
Ball-pen probes give the possibility to measure simultaneously plasma potential and electron temperature fluctuations. To be able to measure the electron temperature, a calibration of the combined ball-pen [25] and LP in helium plasma had to be performed first. The calibration is based on the equation giving the relation between plasma potential, floating potential, and electron temperature. The difference between plasma and floating potential is proportional to the electron temperature, as follows:

where Φ is the plasma potential,  is the floating potential, Te the electron temperature, and α is the calibration coefficient. To perform the calibration, the ball-pen probe is floating, measuring potential that is close to the plasma potential Φ, while the LP is biased to measure I–V characteristics. The electron temperature Te and floating potential
  are determined as the parameters of fitted I–V characteristics, measured on a shot-to-shot basis. For fitting, a four-parameter fit is used:
where  is the probe current, Uprobe is the probe voltage,
  is the ion saturation current, β the sheath expansion coefficient, Ufl is the floating potential, and Te is the electron temperature.
The reproducibility of the discharge series must be sufficiently good due to the usage of the shot-to-shot method. The macroscopic discharge parameters, including loop voltage Uloop, plasma current  , and toroidal magnetic field Bt, with the excellent reproducibility represented by transparent lines, are shown in figure 2.

Figure 2. Time evolution of loop voltage, plasma current, and toroidal magnetic field. The region where the calibration was performed is illustrated by the shaded area. The reproducibility of the discharge series is represented with transparent lines.
Download figure:
Standard image High-resolution imageCalibration coefficient α generally depends on the mass number, toroidal magnetic field, and tokamak construction. The dependency of calibration coefficient α on toroidal magnetic field Bt in helium plasma in the GOLEM tokamak is shown in figure 3. The plotted error bars represent 1 standard deviation (std) of the error of the fit. A few values above 3 × std, where the fit did not converge, were removed. Orange and blue points represent two different time intervals on which IV characteristics were constructed, 1 ms, and 0.1 ms. Note that the mean value is similar for both cases. The resulting calibration coefficient was determined as α = (2.0 ±0.2) with a statistically insignificant dependence on Bt. Further, we will assume this coefficient α of the ball-pen probe as a constant value for the expected range of the toroidal magnetic 0.16 <Bt [T] < 0.26.
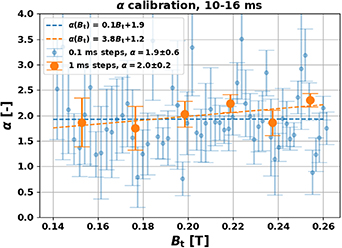
Figure 3. The resulting calibration of combined ball-pen and Langmuir probes. The calibration coefficient α is calculated for two different time intervals to demonstrate the low dependency on the magnetic field.
Download figure:
Standard image High-resolution image4. Spontaneous formation of the transport barrier
A reproducible series of discharges was performed to study the radial profiles of the electron temperature, plasma potential, and floating potential on a shot-to-shot basis. The comparison of the major plasma parameters ( ,
,  ) and ohmic heating in figure 4 demonstrates very good reproducibility. The line averaged density was obtained based on the interferometry measurements. We show an example of the density of one of the reproducible discharges (#26366).
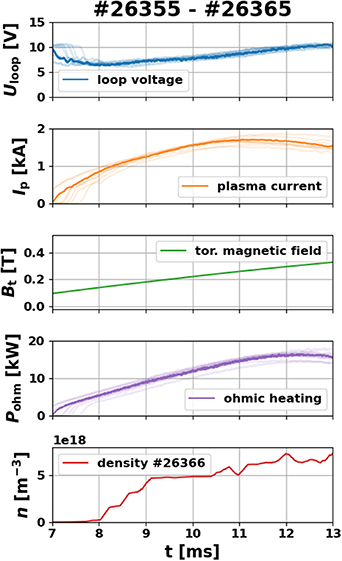
Figure 4. Time evolution of macroscopic plasma parameters (loop voltage, plasma current, toroidal magnetic field, and line averaged density). The reproducibility is illustrated by transparent lines. Density is shown for one representative discharge.
Download figure:
Standard image High-resolution imageThe stability of the plasma column plays an important role because the measurements of the radial profiles are based on the shot-to-shot basis. Mirnov coils and a fast visible camera were used for the plasma position analysis, to verify the global stability of the plasma column during the discharge series and to eliminate its influence on the radial profiles. An example of a representative discharge is shown in figure 5. We see that on the bottom, where the probe head is inserted, changes in plasma column position are small. The plasma column is touching the limiter on the high field side, which is typical for the tokamak GOLEM discharge. Similar behavior of plasma position was observed for all other discharges. The figure from fast camera, representing the vertical position of the plasma during discharge, shows similar trend. The change of the color visible on the fast camera is caused by graduate accumulation of impurities (mostly oxygen, nitrogen, and molybdenum), with dominant radiation in the blue region. All further radial profiles will be plotted with respect to the last closed flux surface (LCFS) to compensate for minor movements, being in an order of magnitude ∼1 mm.

Figure 5. Example of the plasma position during discharge #26355 determined by fast cameras (right) and by magnetic equilibrium reconstruction using a system of Mirnov coils (left). The plasma column remained stable during the analyzed phase, especially at the bottom side, where the probe head is present.
Download figure:
Standard image High-resolution imageRadial profiles of the plasma potential Φ, obtained using a combination of ball-pen and LPs, are shown in figure 6 on the left for different time intervals. Each point corresponds to an averaged value over the time interval. The plasma potential is calculated as:

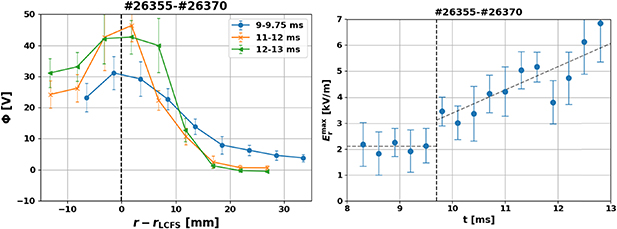
Figure 6. Left—radial profiles of the plasma potential in times before (9–9.75 ms) and during (11–13 ms) the transport barrier. The plasma potential maxima are used for the VSL position determination, represented by the vertical, dashed line. Right—temporal evolution of the maximum of the radial electric field  gradually increasing from 9.7 ms, illustrated by the vertical dashed line.
Download figure:
Standard image High-resolution imagewhere  is the floating potential of the ball-pen probe with coefficient α = (2.0 ± 0.2) derived in section 3. The maximum of the plasma potential was associated with the position of the LCFS, which also represents the velocity shear layer (VSL) [26]. Thus, all radial profiles will be plotted with respect to the position of the LCFS to eliminate the effect of plasma column movement. It is seen in figure 6 left that the maximum plasma potential is gradually increasing from 30 V up to 50 V. The temporal evolution of the maximum of the radial electric field determined from the plasma potential as
  is shown in figure 6 on the right. The vertical, dashed line emphasized the start of spontaneous increase of the radial electric field at ∼9.7 ms, which we identify with the time of the formation of the transport barrier. We see the radial electric field keeps increasing, however, it does not further impact profiles after their initial steepening, as will be seen later.
The radial profiles of the radial electric field  are shown in figure 7 on the left. The radial electric field is gradually increasing its maximum amplitude during the discharge up to more than 5 kV m−1. The poloidal velocity is calculated as
  and shown in the same figure on the right. Note that the magnetic field is time-dependent in the case of GOLEM tokamak, which must be considered during the
  calculation. The poloidal velocity increases by a factor of 2 during the presence of the transport barrier up to 16 km s−1. The slope of the poloidal velocity represents the shearing rate of the poloidal flow estimated as ωE
× B
=
calculation. The poloidal velocity increases by a factor of 2 during the presence of the transport barrier up to 16 km s−1. The slope of the poloidal velocity represents the shearing rate of the poloidal flow estimated as ωE
× B
=  /
/ r, where
  and is the maximum and minimum poloidal velocity in the VSL, respectively, and
  is their radial separation. The shearing rate increases from 1.3 × 10⁶ s−1 (blue profile) to 2.9 × 10⁶ s−1 (orange profile). Before the transport barrier was formed, the shearing rate was comparable to the ohmic COMPASS discharge [26] (1.5 × 10⁶ s−1) while it even exceeds the value measured in H-mode of ASDEX-U discharge [5] (2 × 10⁶ s−1) after the transport barrier was formed. The observed increase of the shearing rate thus seems strong enough to affect the turbulent transport and be consistent with the observed profile steepening.

Figure 7. Left—radial profiles or radial electric fields calculated from the ball-pen probe potential and corrected with a factor of  . Right—radial profiles of poloidal velocity determined from the radial electric field.
Download figure:
Standard image High-resolution imageThe radial profiles of the electron temperature, measured using the combined LP and BPP probes, are shown in figure 8. Flat profiles of electron temperature are observed in the time interval 9–9.75 ms, left panel, while the formation of steep gradients of the electron temperature is observed in time interval 11–13 ms, right panel. The formation of the gradient is localized inside SOL and is clearly not related to the position of the limiter. The maximum slope of the electron temperature gradient spontaneously increased by a factor of 2 from  ∼ 0.4 to
  ∼ 1.1. The width of the SOL was evolving during the discharge; however, the maximum change of the connection length was less than 10% and the estimated effect on the parallel transport is too small to explain the observed change in
  . Also, this SOL width variation was also present in both helium discharges without a transport barrier and other hydrogen discharges, yet no
  changes were observed.
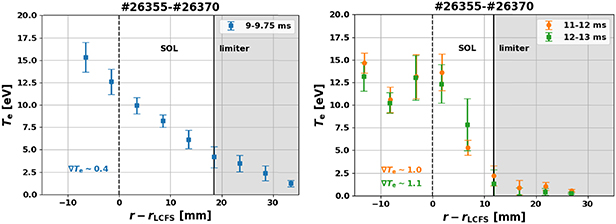
Figure 8. Radial profiles of electron temperature before (left) and during (right) the transport barrier formation. The strong gradient of electron temperature is observed at 11–13 ms.
Download figure:
Standard image High-resolution imageAdditionally, we compared the plasma input power with the  scaling law [11] valid for the divertor plasma and densities above
  [27]. The input power into the plasma at 9.5–10.0 ms was 11.2 ± 0.8 kW,
  and the calculated from the scaling gives 11.4 ± 1.7 kW, corresponding to each other within 10% experimental error bar. The measured density n is within 10% of
  . While the direct applicability of this scaling to our plasma may be debatable, the agreement supports our conclusions and suggests that the power input was within the appropriate order of magnitude necessary to facilitate the formation of a transport barrier in diverted plasma.
5. The characteristics of fluctuation within the transport barrier
Transport barriers are associated with a significant change of the measured fluctuations due to the suppression of turbulent structures by the shear. Raw signals, spectrograms, and power spectral densities (PSDs) were used to analyze the impact of the observed transport barrier on the plasma. Time traces of raw signal fluctuations of plasma potential, floating potential and electron temperature high-pass filtered at 2 kHz are shown in figure 9. Symbols  ,
,  , and
, and  represent ball-pen probe potential, floating potential, and electron temperature fluctuations, respectively. The left panel of figure 9 shows fluctuations inside the LCFS and the right panel inside SOL. The gray area emphasizes the time interval while the transport barrier was present. We directly observe that all the measured quantities inside LCFS show a significant increase in high frequencies, visible as enhanced signal amplitude, while a decrease in low frequencies is observed inside SOL. The shear might result in the suppression of bigger turbulent structures inside SOL, leading to the decrease in low frequencies and an increase in high frequencies.
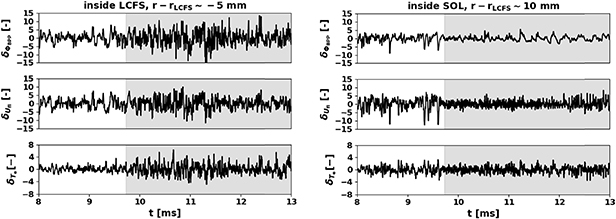
Figure 9. Temporal evolution of the raw signals with high pass filter applied on 2 kHz, inside LCFS (left) and inside SOL (right). The grey area represents the time interval of the transport barrier existence. An increase in high frequencies is observed inside LCFS, while a decrease in low frequencies is observed inside SOL.
Download figure:
Standard image High-resolution imageSpectrograms and corresponding PSDs of the floating potential, plasma potential, and electron temperature are shown in figures 10–12, to further investigate the impact of the transport barrier on the measured quantities. A high pass filter of 2 kHz is applied to remove trends. The left panels correspond to the radial position inside LCFS, while the right panels to the position inside SOL.
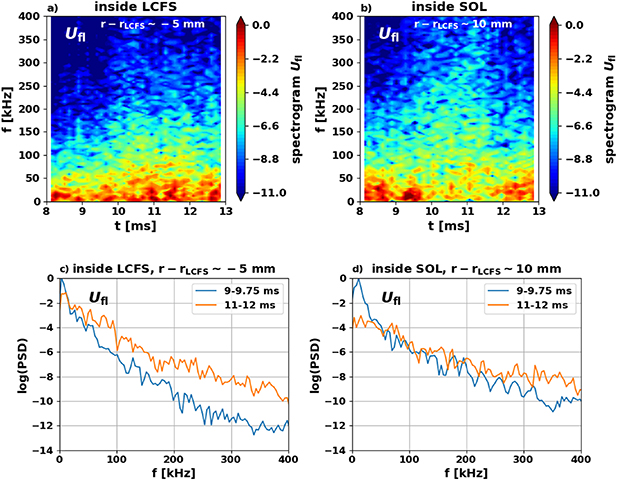
Figure 10. Spectrograms and PSDs of the floating potential (high pass filter 2 kHz) in an analyzed time interval inside LCFS and inside SOL. Low frequencies are significantly reduced inside SOL.
Download figure:
Standard image High-resolution image
Figure 11. PSDs of the ball-pen probe potential (high pass filter 2 kHz) in an analyzed time interval inside LCFS and inside SOL. The reduction of low frequencies inside SOL is not significant. An overall increase of frequencies inside LCFS is however clearly visible.
Download figure:
Standard image High-resolution image
Figure 12. PSDs of the electron temperature (high pass filter 2 kHz) in an analyzed time interval inside LCFS and inside SOL. Values of the electron temperatures inside LFFS and inside SOL before and during the transport barrier are shown in figure. It is evident that the low frequencies are slightly reduced inside SOL, while overall increase of frequencies is observed inside LCFS.
Download figure:
Standard image High-resolution image
Spectrograms as well as PSDs of floating potential in the SOL (figures 10(b) and (d)) show a clear decrease in low frequencies after the barrier was formed, whereas the spectrum inside the LCFS (figures 10(a) and (c)) shows an overall increase of fluctuations above 10 kHz. In the presence of the transport barrier, SOL fluctuations are expected to be suppressed mainly at lower frequencies due to the transport barriers' effect on turbulent structures, tearing them apart, which is consistent with our observations.
Spectrograms and PSDs of ball-pen probe potential, close to the plasma potential one, (figure 11) show a significant increase in the whole frequency range inside LCFS, however, not significant changes in SOL.
Spectrograms and PSDs of electron temperature (figure 12) show the overall increase inside LCFS and the minor decrease of low frequencies in the SOL. The value of the electron temperatures inside LCFS and in the SOL before and during the transport barrier are also shown in the figure. While the value of the electron temperature inside LCFS remained almost the same, it dramatically decreased in SOL. Although the plasma potential and electron temperature spectra in the SOL did not change dramatically, their combination, the floating potential, shows a clear decrease of fluctuations at low frequencies. This can be explained by a change of the cross-phase between the plasma potential and the electron temperature. Their phase-shift changed from 0.56 (corresponding to time interval 9–9.75 ms) to 0.28
 (corresponding to 11–12 ms). Also, as discussed in [28], such departure from the almost ideal interchange value 0.56
 might lead to decrease of the radial turbulent transport and temperature profile steepening.
6. Conclusion
We show a first-time observation of the spontaneously formed transport barrier on tokamak with the circular configuration in helium plasma. There was no external polarization of the electric field, or any other method typically used to form the transport barrier in circular configuration. The radial profiles of the electron temperature and plasma potential were obtained using the combined ball-pen and LP head. The calibration of the combined probe head in a helium plasma was an integral part of the experiment campaign. It allows us to measure the electron temperature and plasma potential with high temporal resolution. The plasma column position during the discharge series was verified by fast cameras and Mirnov coils. The formation of a steep gradient of electron temperature, accompanied by spontaneously increasing radial electric field from  ∼ 2 keV m−1 to the higher values was observed. The steep gradient of the electron temperature was formed for the radial electric field higher than
  ∼ 5 keV m−1. The averaged value of the electron temperature inside LFCS remained similar, while it decreased significantly in SOL during the presence of the transport barrier. The poloidal shear increased to 2.9 × 10⁶ s−1 corresponding to H-mode values observed at other machines. Behavior of the density profile that could complete the picture was not measured in the reported experiments and remains an open issue for future GOLEM experiments.
Further, it was shown that also the fluctuations of floating potential, plasma potential, and electron temperature changed significantly during the presence of the transport barrier. Inside SOL, a significant decrease of floating potential fluctuations was observed due to the change of the cross-phase between plasma potential and electron temperature changed from 0.56 to 0.28
 .
.
It was shown that the transport barrier in electron temperature was formed under reproducible conditions in circular plasmas, which might bring a new possibility to study of the edge parameters including the fluctuations, heat, and particle transport even on small tokamaks. The results from GOLEM helium discharge might also contribute to various numerical codes validation [22, 23]. However, the cause of the transport barrier formation in circular plasma is not yet clear and will be further investigated by improved plasma diagnostic systems (multipin probe head, fast visible camera).
There are several hypotheses that could explain the formation of the transport barrier. As shown in [29, 30], the power threshold for the LH transition is significantly lower for helium plasma compared to hydrogen plasma for higher densities. This might explain, why the transport barrier was not observed in the hydrogen plasma.
The plasma current increased gradually, which could influence the transport barrier formation. Furthermore, the measured density n was within 10% of the minimum threshold density  [27].
[27].
Another possible mechanism of the transport barrier formation can be given based on a similar experiment performed on the TUMAN-3 tokamak. On TUMAN-3 tokamak, plasma gas puff was able to provide the formation of the transport barrier.
No gas puff on the GOLEM tokamak was present, however, the wall conditions could act as a source of particles, which could in principle influence the plasma and create the transport barrier. In addition, the plasma on the GOLEM tokamak is typically not pure hydrogen/helium plasma. There is usually a mixture of gasses, which might decrease the threshold needed for different regimes transitions [5]. In addition, there are usually nitrogen, carbon, or metallic impurities, which might play a role in the transport barrier formation.
Acknowledgments
Authors would like to thank to Jordan Cavalier for the fruitful discussion on this topic.This work was supported by the Grant Agency of the Czech Technical University in Prague, Grant No. SGS22/175/OHK4/3T/14 Research of the Magnetic Field Confinement in Tokamak and MYES Projects# LM2023045.