


Abstract
The JET hybrid scenario has been developed from low plasma current carbon wall discharges to the record-breaking Deuterium-Tritium plasmas obtained in 2021 with the ITER-like Be/W wall. The development started in pure Deuterium with refinement of the plasma current, and toroidal magnetic field choices and succeeded in solving the heat load challenges arising from 37 MW of injected power in the ITER like wall environment, keeping the radiation in the edge and core controlled, avoiding MHD instabilities and reaching high neutron rates. The Deuterium hybrid plasmas have been re-run in Tritium and methods have been found to keep the radiation controlled but not at high fusion performance probably due to time constraints. For the first time this scenario has been run in Deuterium-Tritium (50:50). These plasmas were re-optimised to have a radiation-stable H-mode entry phase, good impurity control through edge Ti gradient screening and optimised performance with fusion power exceeding 10 MW for longer than three alpha particle slow down times, 8.3 MW averaged over 5 s and fusion energy of 45.8 MJ.
Export citation and abstract BibTeX RIS

Original content from this work may be used under the terms of the Creative Commons Attribution 4.0 license. Any further distribution of this work must maintain attribution to the author(s) and the title of the work, journal citation and DOI.
1. Introduction
Optimisation of the so called 'hybrid' scenario [1–4] on JET [5] to maximise the fusion performance has taken significant experimental time over the last decade. The challenges as described in [6] were many and had to be solved step by step.
Firstly, the scenario designed in carbon machines (more recent results in [7–9]) had to be adapted to the ITER like wall (ILW) conditions [10–13]. Secondly, the low  MA adopted for the initial scenario development was not suited for generating high fusion power, nor for confining the produced alpha particles. With the need of higher current operation, an increase in magnetic field was unavoidable, necessitating more heating power to sustain reasonable beta values (first results in [14], further results in section 2). This in turn poses a challenge for the heat exhaust (discussed in section 2.1).
On the other hand, predictions based on the first successful higher current pulses [14] would anticipate high fusion power, to be achieved at the highest auxiliary heating powers (≈40 MW) expected to be available. Other predictions [15, 16], provided an estimate of the range of IP
over which the scenario could be optimised taking into account the expected changes in the density profile and neutral beam injection (NBI) deposition profile. Here, the increase in confinement due to the plasma current needs to be balanced with reduced central neutral beam penetration with increasing plasma density. Also the plasma pedestal scaling was investigated to optimise the choice of parameters [17]. The carbon wall scenario profited from  and a significant fast ion pressure in the plasma core, leading to a decrease of the ion temperature stiffness [18–21], which would boost the fusion performance of JET significantly.
The experiments discussed in this paper where designed with the following relations in mind: The stored energy is limited by the machine size and heating power. Given JET's size and available heating power, a simple calculation shows that the resulting ion temperatures would not be at the values where the D-T fusion cross section is optimal for high plasma densities. At fixed stored energy the fusion performance for JET can be enhanced, by lowering the plasma density and by increasing  . These fundamental considerations have given the direction for choosing parameters like plasma shaping and current. All plasmas described here are type-I edge localised mode (ELMy) H-modes in the main heating phase.
Following the idea of minimising the Tritium consumption, and neutron activation of the device using a Deuterium-Tritium mixture, the plasma scenario optimisation commenced with Deuterium as working gas (section 2). During this phase, most of the challenges were tackled: divertor heat load mitigation, choice of IP and BT were finalised, control of high Z impurities, optimised H-mode entry and magneto hydro dynamic (MHD) avoidance (sub-sections to 2). As part of the risk mitigation strategy an attempt was made to adapt the scenario for operation in Tritium as the main ion isotope (section 3). This required an adjustment of the q-profile formation, re-optimising the H-mode access phase and regaining control of high Z impurities in the steady phase. This was considered an important step, because the main differences in physics between Deuterium and D-T should be more pronounced in Tritium without leading to a strong activation of the JET vessel. Finally, combining the lessons learned, the performance optimisation was continued using a 50:50 mixture of Deuterium and Tritium (section 4) presented first at the EPS conference 2022 [22]. To mitigate the risk of not achieving high fusion power (target 10 MW for 5 s) in one scenario, two different scenarios were chosen: the hybrid scenario described in this article and the baseline scenario described in [23] to be published in this issue.
2. Scenario development in Deuterium
The aim of achieving high fusion power in the hybrid scenario can only be reached if the auxiliary heating power is increased. The resulting heat loads would violate the surface temperature limits of the W coated divertor tiles. In section 2.1, the strategy to overcome this and the results are described. To improve the fast particle confinement and the global energy confinement, the plasma current, and as consequence also the magnetic field, had to be increased, the options are presented in section 2.2. The increased plasma current exacerbated the issue of high Z impurity control as discussed in section 2.3. The increase in heating power leads to high beta values, and the occurrence of MHD modes needs to be prevented as discussed in section 2.4. Finally the H-mode entry needed further optimisation as described in section 2.5. These measures together have led to the Deuterium reference discharge, which has then be adapted to Tritium as working gas as described in the next section. In table 1 the pulses used in this section are summarised.
Table 1. Discharge parameters for Deuterium pulses at t = 8.5 s using in this section.
| Pulse No | IP (MA) | BT (T) |
 (MW)
(MW)
|
 (MW)
(MW)
|
 1022 s−1
| sw. freq. (Hz) |
 (MJ)
(MJ)
|

|

| SN 1016 s−1 | figure(s) |
|---|---|---|---|---|---|---|---|---|---|---|---|
| 97 781 | 2.3 | 3.45 | 30 | 1.5 | 1.15 | 20 | 8.06 | 2.34 | 1.18 | 3.5 | 1, 2, 6, 10 |
| t = 8 s | 2.3 | 3.45 | 30 | 1.5 | 1.13 | 20 | 9.45 | 2.77 | 1.4 | 5.5 | 11, 16, 17 |
| 18, 19, 20(b) | |||||||||||
| 21, 23 | |||||||||||
| 95 962 | 2.2 | 2.8 | 22 | 5.3 | 1.5 | 4 | 6 | 1.9 | 1.03 | 1.6 | 2 |
| 96 432 | 2.2 | 2.8 | 30 | 4.8 | 1.1 | 4 | 7.67 | 2.7 | 1.15 | 3.2 | 3(a), 4(a) |
| 96 499 | 2.2 | 3.45 | 30 | 4.9 | 1.15 | 4 | 8.1 | 2.33 | 1.2 | 3.35 | 3(a), 4(a) |
| 94 945 | 2.2 | 2.8 | 24.5 | 4.3 | 1.25 | 4 | 7.13 | 2.42 | 1.18 | 2.65 | 3(b), 4(b) |
| 96 341 | 2.2 | 2.8 | 25 | 2.06 | 1.6 | 4 | 5.95 | 2.1 | 0.97 | 1.64 | 3(b), 4(b) |
| 94 631 | 2.2 | 3.45 | 25 | 3.9 | 1.8 | 4 | 5.15 | 1.5 | 0.84 | 1.27 | 3(b), 4(b) |
| 96 946 | 2.3 | 3.45 | 30 | 3.6 | 0.88 | 20 | 7.26 | 2 | 1.05 | 2.9 | 5(b) |
| 96 950 | 2.5 | 3.45 | 30 | 3.9 | 0.8 | 20 | 7.26 | 1.85 | 0.94 | 2.54 | 5(b), 5(c) |
| 96 501 | 2.2 | 3.45 | 30 | 4.9 | 1.24 | 4 | 7.8 | 2.24 | 1.16 | 2.95 | 6, 10(a), 10(b) |
| 97 783 | 2.3 | 3.45 | 30 | 2.85 | 1.13 | 20 | 8.28 | 2.4 | 1.21 | 3.6 | 7 |
| 97 784 | 2.3 | 3.45 | 30 | 3 | 1.15 | 20 | 7.67 | 2.18 | 1.14 | 3.23 | 7 |
| 97 787 | 2.3 | 3.45 | 30 | 3.3 | 1.15 | 20 | 7 | 1.9 | 1 | 2.7 | 7 |
| 97 790 | 2.3 | 3.45 | 28 | 1 | 2 | 20 | 9 | 2.66 | 1.44 | 5.07 | 7 |
| 100 822 | 2.3 | 3.45 | 30 | 4.25 | 1.4 | 20 | 8.4 | 2.3 | 3.55 | 8, 19, 21, 22 | |
| 100 834 | 2.3 | 3.45 | 28.4 | 4.25 | 1.45 | 20 | 8.07 | 2.16 | 2.7 | 8 | |
| 100 836 | 2.3 | 3.45 | 30 | 4.5 | 1.42 | 20 | 8.1 | 2.2 | 3.5 | 8 | |
| 96 947 | 2.3 | 3.45 | 32 | 3.75 | 0.88 | 20 | 9.2 | 2.6 | 1.3 | 4.8 | 9(a), 9(b) |
| 97 782 | 2.3 | 3.45 | 30 | 1.7 | 0.85 | 20 | 8.35 | 2.5 | 1.25 | 4.05 | 9(a), 9(b) |
An important tool used in this study is the gas injection. The gas request waveform in any figure presented does not exactly correspond to the flow rate of the injected gas, due to the time for the gas to flow through the pipework. In case of mid-plane Deuterium injection this delay is in the order 10's of milliseconds. The gas injection valves have also a hysteresis which led to higher gas injection rates for a given flow request when preceded by a request at a higher level. In most cases, this has been overcome by transiently closing the valve using the gas request waveform, while in some cases an effect may remain and would not be visible in the displayed waveforms. In this paper only gas request waveforms are presented.
2.1. Avoiding divertor temperature limits
In the following it will be shown that strike-point sweeping is sufficient for heat load mitigation for the scenario and no detrimental effect on the pedestal parameters have been found. Some tendency to trigger ELMs at the extrema of the sweep occurred.
In JET, the surface temperature limit on W coated divertor tiles is set to about 1200 ∘C in order to avoid e.g. diffusion of carbon from the substrate into the surface W layer [24]. Initial extrapolations from lower power discharges showed that the flattop length at 40 MW of injected power could not exceed 1 s, if the heat loads are not mitigated (target 5 s flattop+ramp-up/down of heating). Two different routes were tested: medium amounts of Neon injection and strike point (SP) sweeping. The effect of Neon on the density peaking and the general performance has been discussed in [25]. The fact that the plasma density is increased by injection of Neon and that additional density peaking (which can lead to high Z impurity accumulation) was observed made this path less attractive. Combining those effects with the increased dilution and the corresponding loss of fusion power [26, 27], led to a prioritisation of the strike-point location sweeping route. In depth analysis of the heat load distribution during SP sweeping [24] showed that even a moderate sweeping amplitude of ≈6 cm was sufficient to control the surface temperature to below the limit, even with  MW for 5 s. The sweeping position, and amplitude were optimised and no clear detrimental effects e.g. on the plasma confinement were observed. In figure 1, the heat loads during type-I ELM crashes in the extrema of the sweeping range are indicated. This can be considered as the maximum heat load spread, even though the power fall off length (as far as the traditional definition can be used) is maximised during an ELM crash. The ELM crash heat load is strongly coupled to the pedestal pressure [28] which is very high in the pulses considered compared to higher gas/lower input power H-modes and therefore it can be considered as worst case. In addition to the heat load mitigation, a dynamic change in the ELM frequency has been observed, as discussed in the next sub-section.
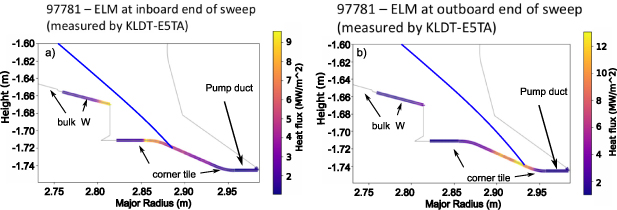
Figure 1. Heat loads in the outer divertor region during an type-I ELM crash at the extrema of the sweeping range for a pulse with 33 MW of auxiliary heating and 12 MW bulk radiation.
Download figure:
Standard image High-resolution image2.1.1. ELM bunching.
The SP sweep anticipated for full power mitigation, moves the outer SP from the inner end of the corner tile (about R = 2.85 m in figure 1), to a position deeply in the pumping throat (right lower edge of figure 1). Only a small oscillation of the pedestal top parameters during a sweeping cycle was observed at any sweeping frequency, but e.g. an oscillation of the radiated power is visible in figure 2. The energy confinement time is  ms which corresponds to one sweeping cycle at 4 Hz, the higher sweeping frequency of 20 Hz has also been chosen for the scenario development to minimise the global and edge perturbations. But also a coupling of the type-I ELM occurrence to the position of the SP could be clearly seen in some cases (figure 2, also see [24]). On the left a case with a sweeping frequency of 4 Hz and on the right an example of 20 Hz are shown. The sweeping range is different between the two cases. A sweeping range slightly inwards by ≈2 cm of the pumping throat has been chosen for the final scenario because it produced less impurity events starting in the divertor during the high power phase of the pulse. On the left hand plot it can be seen, that whenever the SP moves inwards the ELM frequency (type-I) increases or the ELMs bunch together (other pulses are less clear). For the SP position which is closest to the pumping throat the ELM frequency is smaller and the ELM size increases. From figure 2 it can be seen that a big ELM can have a temperature drop of ≈400 eV and a small ELM only of ≈250 eV. On the right hand side, with 20 Hz sweeping rate there is no 'bunching' visible, but a tendency remains that ELMs occur at or close to the SP position furthest away from the pumping duct. This effect is much weaker than with other methods to control the ELM frequency, e.g. pellets [29] ([30] for D-T) or vertical position kicks [31]. So far, the physics of this is not understood, especially because there is no very significant change in the pedestal top parameters. A stability analysis is outstanding. The ELM bunching has been observed at all currents, magnetic fields and heating powers in plasmas used in this study sufficiently above the L-H transition threshold. The plasmas in figure 2 are chosen to demonstrate the ELM bunching cleanest, they have different plasma parameters and are not suitable for performance judgements.
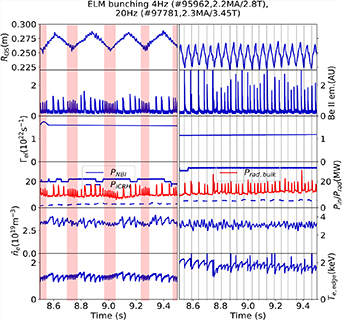
Figure 2. Examples of ELM bunching for divertor strike-point sweeping at 4 Hz (left) and 20 Hz (right). On top of the figure is plotted the radius variable of the outer SP measured away from the nominal major radius of the vessel, second the Beryllium II light emission, third the gas request waveform. Fourth the NBI power, ICRH power and the radiated power, fifth the line averaged edge density close to the pedestal top and last the electron temperature at a fixed radial position which is just inside of the pedestal top.
Download figure:
Standard image High-resolution imageThe 20 Hz sweeping scenario is used for the highest performance pulses which helps in marginal cases to maintain a constant ELM frequency and may play a role in the high Z impurity control.
During the experimental campaign also vertical position kicks were tested. This was only partially successful, the ELM frequency could be controlled for higher frequency ELMs at low radiation. When the radiation increased, due to insufficient radial transport by ELMs, the kicks were no longer able to trigger ELMs and the control of the ELM frequency was lost. Then the natural ELM frequency reduces further due to the reduced power crossing the separatrix. This was expected since ELM control with this method is more difficult at higher beta [31]. Also pellet ELM triggering was tested. In this case the trigger probability was high, but the pellet size was already too large leading to a detrimental significant density increase. In addition to this, the reliability for the first pellets is relatively low with the JET injector. As discussed later, especially the H-mode entry and the occurrence of the first few ELMs is often decisive for the performance of the whole pulse. It was decided that the merits of pellets for this scenario do not outweigh the operational overhead introduced and the scenario was further developed without pellets.
2.2. Importance of the IP and BT choice for confinement and stability
In the following it will be shown that the choice of BT has little influence on the performance of the hybrid pulses. The choice of IP is restricted due to occurrence of hot spots at lower current and loss of fusion power at higher IP for radiation stable pulses.
During scenario development often a certain target scenario with a certain q95 (safety factor q at the 95% poloidal flux surface) is aimed for to ensure scalability. Nevertheless the main target in preparation for the D-T campaign was special: optimise the fusion power output. However some constraints on the choice of the plasma current and the magnetic field remain. The lower boundary for IP
is given by the ability to confine alpha particles. An upper boundary ≈3 MA was set, to provide sufficient separation from the JET baseline scenario operational domain. The baseline experiments were carried out in parallel [23]. The BT
choices are limited by the ion cyclotron resonance heating (ICRH) resonances which are at the nominal centre of the torus vessel for 2.4 T, 2.7 T, 3 T and 3.45 T using the ELM resilient ICRH schemes, which are described in [32–34]. Lower magnetic fields were excluded to limit the  and to avoid MHD instabilities at too low q95.
2.2.1. Choice of BT.
An increase in plasma current from the 1.7 MA/2 T development at constant q95 resulted in an operation point at 2.5 MA/2.9 T. This was used as the first test in [6], but it was shown that the Shafranov shift was not large enough to have a central ICRH resonance for 2.9 T and therefore an operation point 2.35 MA/2.8 T was chosen later. The magnetic field sets the ICRH resonance at a fixed radial location. If the plasma centre is displaced from the geometric centre of the torus, the radio frequency (RF) resonance shifts off-axis. It has been shown in [35–37] that, if the resonance is not close to the centre of the plasma, the effect on the impurity accumulation vanishes or even becomes negative. One possibility to compensate for this is to locate the resonance where the plasma is supposed to have the magnetic axis at a given beta to compensate the Shafranov shift. This leads to an off-set of about 0.1–0.2 T to the 2.7 T, which would deposit the heating at the geometric axis, for the hybrid plasmas discussed here. Further performance optimisation led to 2.2 MA/2.8 T, as e.g. shown in [27, 38]. Those plasmas were the starting point for the final optimisation. To illustrate the effect of different magnetic fields, time traces of two sets of comparison pulses are shown in figure 3. In the left figure, both plasmas have the same input power, radiation and gas request in the stationary phase at high power, on the right the comparison is of medium power for two pulses at 2.8 T and one pulse at 3.45 T.
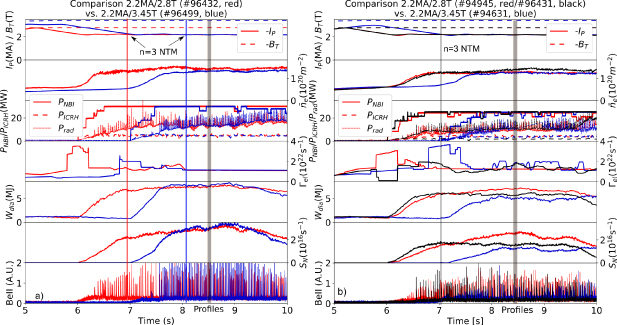
Figure 3. Comparison of pulses at 2.8 T and 3.45 T at high power ≈35 MW (a, left) and medium power  30 MW (b, right). Both figures have on top the plasma current and magnetic field, second the line integrated central density, third the NBI, ICRH and radiated power, fourth gas request waveform, fifth the diamagnetic stored energy and last the neutron rate. The gray vertical bar denotes the time and averaging interval for the profiles shown in the next figure. Vertical lines denote the start of NTM activity of the discharge using the same colour coding.
Download figure:
Standard image High-resolution imageStarting with the comparison at higher power (figure 3 on the left), the pulses are very comparable with very slight advantages for the higher magnetic field pulse (#96499, blue), in terms of stored energy and neutron rate. This is anti-correlated with the plasma density, which is higher for the lower magnetic field but also the initial gas inlet at lower BT
was higher. Both plasmas develop a n = 3 neo-classical tearing mode (NTM) (#96432, t = 6.85 s, maximum  ; #96499 t = 8.15 s, maximum
  ) at a
  , although the impact of the n = 3 NTM on the stored energy is small. In fact, in both cases the stored energy even increases after the mode is excited. The critical
  is the same for both plasmas, this results in a ≈25% increase in stored energy at the time when the NTM occurs at higher BT
. The n = 3 NTM can have a detrimental effect on the fusion performance as can be seen in section 4.2.
is the same for both plasmas, this results in a ≈25% increase in stored energy at the time when the NTM occurs at higher BT
. The n = 3 NTM can have a detrimental effect on the fusion performance as can be seen in section 4.2.
In figure 3 on the right, the opposite trend in confinement can be seen. Pulses at lower magnetic field (#94945, red maximum  and #96341, black maximum
  ) show better energy confinement than the higher field pulse (#94631, blue maximum
  ). Pulses #94631 and #96341 utilise feed back control of the ELM frequency with the gas inlet rate as actuator, resulting in the higher gas request around t = 8.5 s keeping the ELM frequency at 20 Hz. Part of the reason for the significantly increased neutron rate of #94945 is probably the low and constant gas rate (
 Hz). The plasma density for similar gas rates is still higher for the lower magnetic field pulses. Only pulse #96341 is hampered by a n = 3 NTM, occurring at t = 7.05 s while the other pulses are without NTM activity. In figure 4, the plasma profiles are plotted for the same discharges as in figure 3, using the same colour scheme. The electron density and temperature are measured by the high resolution Thomson scattering system (HRTS) [39] and the ion temperature by the impurity charge exchange diagnostic [40] utilising an injection of Neon up to a concentration of ≈0.5% into the plasma. In the medium power pulses, the lower field plasmas have higher ion-temperatures in the core. Similar trends are found in the toroidal rotation profiles. Generally the changes in
  are expected to be small, on the other hand the differences in the ion temperature profile peaking are also small. In general the pulses are comparable and the differences are within the general variations between 2 pulses also at the same magnetic field. The pulses have been chosen to represent general trends within a larger database of pulses as presented in [41].
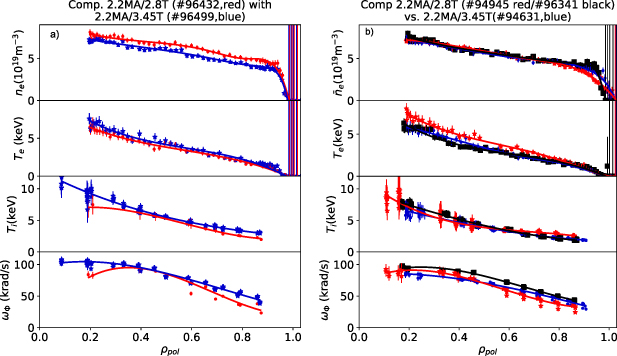
Figure 4. Comparison of profile for pulses at 2.8 T and 3.45 T at high power (left, (a)) and medium power (right, (b)) at  s.
s.
Download figure:
Standard image High-resolution imageBased on the available comparisons, it can be argued that the toroidal magnetic field is not a strong player in determining the performance, at such high heating power and low gas fuelling conditions. In this experiment no dependence of τE
on BT
for this pair of pulses has been found and which is still within the error bars of the ITPA 2020 IL scaling [42] ( ).
).
Another reason to choose the magnetic field of 3.45 T was be to more compatible with the ICRH schemes planned for D-T operation [43, 44]. The increase in q95 from 3.9 to 4.8 for JET has no consequences in reaching high fusion performance. The classification of these plasmas is arbitrary, the q95 is similarly high as in an advanced tokamak scenario but the q0 is as low as in a 'hybrid' scenario plasma. Since the performance is not changed by the change in q95 and the relatively low bootstrap and non-inductively driven part of the plasma current, it would be more consistent classifying theses plasmas as a 'hybrid' scenario.
2.2.2. Choice of IP.
The already limited choice of plasma currents between 2 MA and 3 MA was further reduced by the fact, that at lower currents than 2.2 MA toroidally localised hot spots on outer poloidal limiters occurred, the cause of which have not yet been found. The two main hypotheses are (ICRH) fast particle losses, due to the deteriorated confinement, and from the antennae far RF sheath effects. The intensity of the hot spots increased strongly with increasing the ICRH power, but was reduced if the RF coupling was improved by increasing the gas rate from a gas inlet close to one RF antennae pair. This is illustrated in figure 5 on the left hand side top. The surface temperature reduces with separatrix density in general. The separatrix density, at similar heating and gas fuelling, is closely coupled to the plasma current. Since the lower currents were operationally not accessible the development concentrated on slightly higher current pulses.
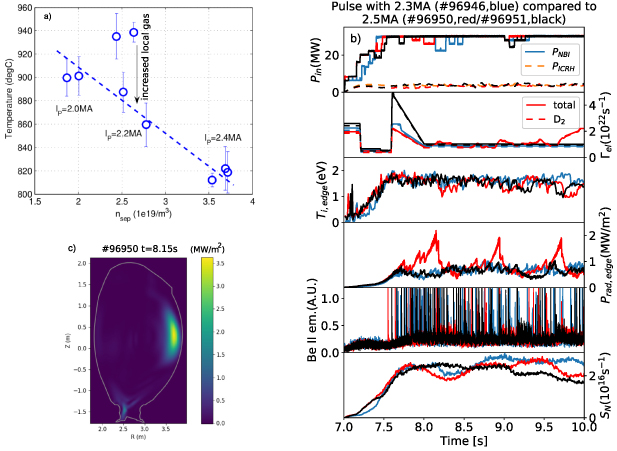
Figure 5. Left, top, (a): temperature on limiter surface as function of separatrix density. Left, bottom, (c): bolometric reconstruction of high radiation on low field side, 'crescent'-like. Right, (b): performance of higher IP pulses. Heating powers are plotted in the top box, gas request rate in the second box from the top, the edge ion temperature close to the pedestal top in the middle, the edge line integrated radiation in the fourth box and the Be II emission originating from the the divertor is plotted in the next box. The bottom box contains the neutron rates.
Download figure:
Standard image High-resolution imageThe increase of IP
at constant heating power and magnetic field has an effect on the impurity behaviour by increasing the pedestal MHD stability, and consequently reducing the ELM frequency. The outward transport (flushing) of W from the pedestal is reduced due to the lower ELM frequency. This is not sufficiently compensated by an increase in pedestal density, and the corresponding decrease in density peaking, leading to less inward convection of high Z impurities. In figure 5 on the right hand side this is illustrated. The reference plasma in blue at  MA has been repeated with an
  MA (red), and the occurring edge radiation control increase (reconstruction of bolometer on the left bottom in figure 5) was counter-acted by increasing the gas injection at t = 7.6 s (pulse in black). In this case, the performance in terms of edge Ti
is similar to the lower gas and also to the lower current pulse. The low current pulse is not optimal because the NBI ramp in the beginning is very slow. As discussed later this can have a significant impact on the performance. To counter-act the decrease in ELM frequency, either the power needs to increased (not possible, as already operating at maximum power), the gas inlet rate needs to be increased or external ELM trigger events e.g. pellets need to be supplied. The JET baseline scenario [23] successfully used pellets for this and was able to increase the plasma current to high values. In the hybrid scenario the gas injection rate was used as the main actuator, which had to be increased significantly at higher IP
to avoid high radiation. This led to a net loss of fusion power, as described in section 2.3. In figure 5 some tendency of this can be seen in the neutron rates. The lower IP
pulse has higher neutron rates after t = 8.5 s. In the pulses shown the heating power is not as high as in the highest performance pulses. It is possible that at higher powers a better performace could have been obtained. Several attempts to obtain those pulses failed because of insufficient NBI power. This loss of fusion power could not be mitigated within the experimental time frame. The optimum plasma current was found to be 2.3 MA.
MA (red), and the occurring edge radiation control increase (reconstruction of bolometer on the left bottom in figure 5) was counter-acted by increasing the gas injection at t = 7.6 s (pulse in black). In this case, the performance in terms of edge Ti
is similar to the lower gas and also to the lower current pulse. The low current pulse is not optimal because the NBI ramp in the beginning is very slow. As discussed later this can have a significant impact on the performance. To counter-act the decrease in ELM frequency, either the power needs to increased (not possible, as already operating at maximum power), the gas inlet rate needs to be increased or external ELM trigger events e.g. pellets need to be supplied. The JET baseline scenario [23] successfully used pellets for this and was able to increase the plasma current to high values. In the hybrid scenario the gas injection rate was used as the main actuator, which had to be increased significantly at higher IP
to avoid high radiation. This led to a net loss of fusion power, as described in section 2.3. In figure 5 some tendency of this can be seen in the neutron rates. The lower IP
pulse has higher neutron rates after t = 8.5 s. In the pulses shown the heating power is not as high as in the highest performance pulses. It is possible that at higher powers a better performace could have been obtained. Several attempts to obtain those pulses failed because of insufficient NBI power. This loss of fusion power could not be mitigated within the experimental time frame. The optimum plasma current was found to be 2.3 MA.
2.3. Reducing impurity accumulation
In this sub-section it will be shown that high Z impurity accumulation is a significant problem when operating at low gas fuelling rates. It will be shown that edge ion temperature screening is important for the impurity influx control and that a optimisation of the flattop gas fuelling can lead to radiation stable pulses.
With the introduction of the ITER like wall in 2011, the control of high Z impurities in the plasma has become a major part of the scenario development [45, 46]. First, only the steady aspect will be discussed here, but in the next sub-section also transients will be described.
The process of how W from the wall can penetrate towards the plasma core is complex and can be influenced in many ways. The sputtering of W at the wall depends e.g. on the temperature and the impurity composition of the scrape off layer (SOL) plasma [47]. Whether the source at the wall becomes a relevant source for the core plasma or not, depends on the SOL transport but more important here: on the transport in the gradient zone outside the pedestal top. The transport in this zone is governed by neo-classical transport as described for the core in [48] with probably little balancing by turbulent transport. The main ingredients in the neo-classical transport, are an inward convection proportional to  and an outward convection proportional to
  , i.e. ion temperature gradient screening. The ELM crash event can transport W out of the pedestal zone, and the ELM frequency is a key parameter which can be used to avoid W influx to the bulk plasma [49]. But it has also been shown that ELMs sputter W, and are a significant part of the source [50]. If most plasma parameters, like heating power, shape and plasma current are fixed, then the gas injection is the main parameter to influence the ELM frequency. Unfortunately an increase in gas rate is connected to a decrease in global confinement [11]. For the core plasma the increased net W influx at the boundary can be compensated by an increase in electron heating [43]. The additional turbulence drive helps to compensate the neo-classical inward pinch. In some cases these conditions can not be kept constant in time, often a slow increase in radiation and peaking of the electron density profile is observed. At some point during the pulse, the accumulation of high Z impurities can occur when the density peaking becomes sufficient to overwhelm the temperature gradient screening and the turbulent transport. This has been modelled in advance of the D-T campaign to give advice on the choice of IP
and magnetic configuration [16]. The density peaking is determined by the sources, here mainly the NB deposition [51] and the transport. In this experiment ICRH heating in the Hydrogen minority scheme has been used. The details, like the impact of the minority fraction and finite orbit width effects can be found in [52]. A substantial fraction (typically
, i.e. ion temperature gradient screening. The ELM crash event can transport W out of the pedestal zone, and the ELM frequency is a key parameter which can be used to avoid W influx to the bulk plasma [49]. But it has also been shown that ELMs sputter W, and are a significant part of the source [50]. If most plasma parameters, like heating power, shape and plasma current are fixed, then the gas injection is the main parameter to influence the ELM frequency. Unfortunately an increase in gas rate is connected to a decrease in global confinement [11]. For the core plasma the increased net W influx at the boundary can be compensated by an increase in electron heating [43]. The additional turbulence drive helps to compensate the neo-classical inward pinch. In some cases these conditions can not be kept constant in time, often a slow increase in radiation and peaking of the electron density profile is observed. At some point during the pulse, the accumulation of high Z impurities can occur when the density peaking becomes sufficient to overwhelm the temperature gradient screening and the turbulent transport. This has been modelled in advance of the D-T campaign to give advice on the choice of IP
and magnetic configuration [16]. The density peaking is determined by the sources, here mainly the NB deposition [51] and the transport. In this experiment ICRH heating in the Hydrogen minority scheme has been used. The details, like the impact of the minority fraction and finite orbit width effects can be found in [52]. A substantial fraction (typically  50%) of the heating is in the electron channel and can help to increase the turbulent transport in the core and to reduce the density peaking [37]. Other effects can be the occurrence of MHD which can act as a short circuit for impurities to be transported into the core by directly connecting flux lines [53]. Sometimes also a state has occurred where the ELM flushing was insufficient but the transport towards the core for high Z impurities is small. In this case the impurities are enriched close to the pedestal top. The strong rotation in hybrid plasmas leads then to a concentration of the impurities on the low field side [54] which looks like a 'crescent' on a tomographic reconstruction of the bolometric radiation measurement. Such behaviour occurs in high-power baseline-scenario pulses in JET-ILW, in which W flushing by ELMs triggered by pellets is critical for controlling the radiation fraction [55].
2.3.1. Ion temperature screening of W in the plasma periphery.
For ITER it is expected that the ion temperature gradient screening overcomes the density gradient driven inward pinch across the pedestal region in the transport equation [56] and the impurity influx into the core is very much reduced. In the JET Deuterium experiments a reversal of the impurity flux between ELMs has been found [57]. The measured impurity fluxes are outward between ELMs and inward during an ELM crash as predicted for ITER [58]. The final localisation of the ion temperature gradient screening is outstanding, because the diagnostic accuracy of the JET edge charge exchange diagnostic is not sufficient in the H-mode pedestal region. It has also been found in modelling [59] that toroidal rotation can enhance the screening in the plasma edge which is maximised under similar conditions as the edge ion temperature. In figure 6 results from two pulses with sufficient impurity control in the first phase are presented. At t = 9.4 s the NBI power drops by ≈6 MW in the pulse shown in red. As a consequence the edge ion temperature starts to decrease and shortly afterwards the radiated power and the edge density increases. The pulse is stable even after the power drop (similar to the event at t = 9 s where the radiation increase is not strong enough to have long term effects) but a big ELM around  9.5 s leads to a radiated power increase and a further edge temperature drop, which leads to a situation where the radiation is no longer controlled. The plasma then looses performance rapidly, and the operational window closes. From this point on the impurity radiation can only be reduced by an increase in gas inlet rate which decreases the edge temperature, hence it goes further away from the initial state. Utilising the edge Ti
screening, the operational range has been extended to lower gas inlet rates resulting in higher performance. This example shows the importance of high and continuous power because every time the Ti
screening is not maintained it might not be possible to recover the favourable conditions. This is also true for the H-mode entry, if the Ti
screening is not accessed from the beginning it will be extremely difficult to access it later in the pulse.
9.5 s leads to a radiated power increase and a further edge temperature drop, which leads to a situation where the radiation is no longer controlled. The plasma then looses performance rapidly, and the operational window closes. From this point on the impurity radiation can only be reduced by an increase in gas inlet rate which decreases the edge temperature, hence it goes further away from the initial state. Utilising the edge Ti
screening, the operational range has been extended to lower gas inlet rates resulting in higher performance. This example shows the importance of high and continuous power because every time the Ti
screening is not maintained it might not be possible to recover the favourable conditions. This is also true for the H-mode entry, if the Ti
screening is not accessed from the beginning it will be extremely difficult to access it later in the pulse.
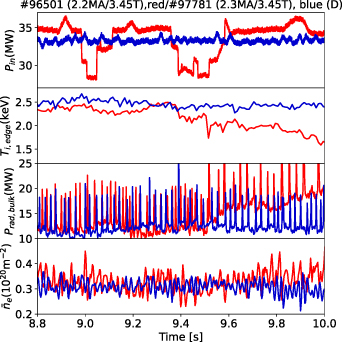
Figure 6. Loss of impurity control due to power drop. Input heating power in the upper trace in red a strong power loss case which is compared to non perturbed case in blue. Edge ion temperature in the second row, radiated power from the bulk of the plasma in the third row and the line integrated edge density in the fourth row.
Download figure:
Standard image High-resolution image2.4. MHD avoidance
In the following it will be shown that controlling q0 allows to reduce the MHD activity and to reach higher beta values with good confinement.
The importance of the q-profile in the hybrid scenario is still under debate [60]. There are many aspects to this, mostly discussed is the influence of q on the confinement. Unfortunately within the time frame of the DT preparation it was not possible to make sophisticated changes in q as described in [5]. The basic strategy was to use a fast current ramp up together with a current overshoot to produce a broad q-profile and then to start the NBI heating to slow down the  relaxation for the time duration of the flattop. In this scenario experiment, the q-profile adjustments are used as a tool to influence the MHD stability only. By avoiding low-n NTMs the confinement can be maintained and the W accumulation in cases where MHD acts as a 'bridge' [53], is reduced. The target
  was aimed to be higher than 1 but lower than 1.3 as a compromise to avoid low n-number NTMs at too high
  and preventing the occurrence of sawteeth during the flattop at too low
  . Nevertheless fishbone activity occurs in most pulses at some time indicating that the central q is very close to 1. A series of pulses with different q0 starting conditions at the time of the start of the main heating phase is illustrated in figure 7. In this series of pulses the IP
and
. Nevertheless fishbone activity occurs in most pulses at some time indicating that the central q is very close to 1. A series of pulses with different q0 starting conditions at the time of the start of the main heating phase is illustrated in figure 7. In this series of pulses the IP
and  time traces are adjusted in a way that the heating always starts at the end of the current overshoot. The change in the overshoot flattop will have some changes in the outer part of the q-profile as consequence. Nevertheless, the main effect is a delay in the heating start time which increases the time duration for fast current diffusion at low temperatures and hence produces a lower value of central q the later the heating starts. The most unstable pulse has the earliest heating and highest q0 (#97787, blue). A n = 2 NTM is excited at t ≈ 6.5 s which intensifies at t ≈ 7 s. The n = 2 NTM is accompanied by a n = 3 and a brief n = 4 NTM. 1/1 activity becomes visible at t ≈ 9 s but lasts only for ≈0.7 s indicating that q > 1 for most of the pulse. This pulse has also the lowest neutron rate and the highest radiation in the early phase of the pulse. The next pulse (#97784, red) is more benign, a n = 3 NTM at t ≈ 7.5 s is excited which could be related to a beta limit. Here the island width is smaller and the NTM is excited later. No 1/1 activity is visible during the whole flattop. The neutron rate is already a bit improved, relative to the early heating pulse. In (#97783, black) the occurrence of a n = 3 NTM is further delayed, relative to the start of the heating, and is no longer connected to a beta limit (beta is dropping before), but probably the q-profile decays towards a more unstable state, and at constant β a tearing mode is triggered by either an ELM or by converting an already existing n = 3 ideal mode, (visible in the spectrogram of magnetic pick up coil, but very low amplitude) as described in [61]. Here a continuous 1/1 mode, accompanied later by fishbones, occurs at t ≈ 10.5 s. This indicates that the q = 1 surface enters around this time. The last pulse (#97790, orange) of the series was stopped early by a protection system due to a contact with the inner heat shield wall. Nevertheless, this pulse reaches at the lowest power the highest neutron rate and is, in the period with heating, NTM free. It has the lowest
  , as highlighted by core n = 1 activity at t = 8 s and sawteeth starting at t = 9 s. If the pulse had run longer, then most probably a n = 2 or n = 3 NTM would have been triggered with a sawtooth crash later. All other pulses are sawtooth free until the IP
ramp-down during termination. These findings are in line with earlier results published in [61] for the MHD stability and [62] for the confinement dependence on
, as highlighted by core n = 1 activity at t = 8 s and sawteeth starting at t = 9 s. If the pulse had run longer, then most probably a n = 2 or n = 3 NTM would have been triggered with a sawtooth crash later. All other pulses are sawtooth free until the IP
ramp-down during termination. These findings are in line with earlier results published in [61] for the MHD stability and [62] for the confinement dependence on  . A gradual confinement decay happens in the higher confinement pulses (#97783, #97784) because of a gradual radiation peaking increase connected to a gradual density profile peaking and maybe connected to the excited n = 3 NTM. The pulses presented in this figure are at the lowest possible gas injection levels for maintaining radiation peaking stable conditions.
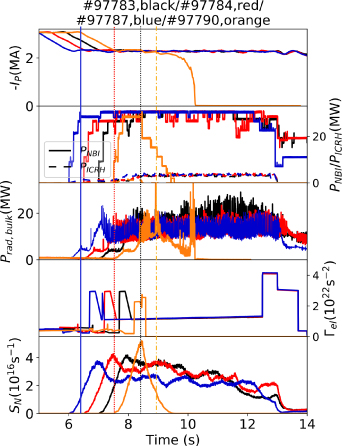
Figure 7. Change in time of heating to scan  at 2.3 MA/3.45 T. Most upper plot is the plasma current followed by the heating powers from NBI and ICRH, third box contains the bulk radiated power, in the fourth box the gas request waveform is given and in the last plot the neutron rate is plotted. Vertical lines in the appropriate colours indicate the occurrence of different MHD modes.
Download figure:
Standard image High-resolution image2.5. Influence of H-mode access on plasma performance and stability
In the following it will be shown that the H-mode entry phase is important for achieving high fusion performance but also for impurity influx control.
As discussed before, impurity control is essential in achieving high fusion performance. At the start of the auxiliary heating phase, the transients leading to a stationary ELMy H-mode are especially challenging, because of the preceding ELM free H-mode phase. This ELM free H-mode is characterised by missing ELM transport (W flushing) and a quickly increasing edge density, together with a buildup of the density gradient. If this density buildup takes place at low temperatures (no Ti gradient screening) then ideal conditions for W inward transport are created. A careful design of the power and gas waveforms can prevent an early high Z influx. Mitigation can be achieved, by increasing the gas fuelling to high values before the start of the heating and decreasing the gas flow rate after establishing an ELMy phase to the desired target value, this drives the pedestal quickly to the stability limit and shortens the ELM free phase. As an indication that the gas injection is appropriately timed, a marginal increase in plasma density should occur before the heating starts. For the large vacuum vessel and the slow response of some valves, due to travel transits of the neutral gas through the feed pipes, usually the gas injection starts 200 ms before the heating. Examples of use of early injection waveforms are shown in figure 3. This kind of pre-heating gas puff is efficient in solving the ELM free period problem and the consequent increase in W concentration. Unfortunately, it also impacts the plasma performance significantly and the larger this gas puff is, the lower the early high Z influx, the lower the β increase and the confinment of the H-mode. For the fusion performance optimisation a different path had to be found.
As discussed in the previous sub-section, the time evolution of the plasma density can also have long term effects. With the high gas influx the edge density increases strongly and the increase in stored energy due to the L-H transition is dominated by the density channel, whereas the edge temperature does not increase as strongly, and consequently the ions stay more coupled to the electrons. The timing of the gas injection can be used as a tool to control the plasma performance, and the severity of impurity influxes. In figure 8 the consequences of early, optimal and late gas timings are illustrated. Here the gas injection is already delayed, compared to the previous cases to avoid a too early density increase. If the plasma is fuelled early (#100836, blue), the radiation is rather stable, but the neutron rate increases only slowly. The middle gas timing (#100822, black) results in a much earlier Ti increase while the density increases much later. The neutron rate increases more promptly due to the increase in heating power. The latest gas puff (#100834, red), on the other hand has also a prompt increase in Ti and neutron rate, but the lack of ELMs lead to a strong increase in edge radiation, which in turn degrades the performance by cooling the pedestal. This impacts also on the central ion temperature and the neutron rate decreases. Just to note here, even the earliest gas timing is already later than the ones in figure 3, and this was an important step in the performance optimisation. The timing used in the pulse plotted in black is the one which was envisaged to start the D-T development. Another factor to determine the density/temperature share of the stored energy, and the occurrence of the first ELMs in the early phase, is the heating power ramp rate. If the power is too low in the early phase of the pulse, the temperature increase is not large enough to enter the screening regime, discussed in the previous sub-section. In addition the ELM frequency is lower, and both together lead to a reduced performance and sometimes to high radiated power. For the final performance optimisation, close to the limits in terms of early but also flattop gas, it was very important to heat the plasma as promptly as possible and to reach the anticipated flattop power within a few MWs. It should also be mentioned here that, even plasmas with incorrect gas time traces or unintended power waveforms do not disrupt in Deuterium during the flattop, only the performance is reduced.
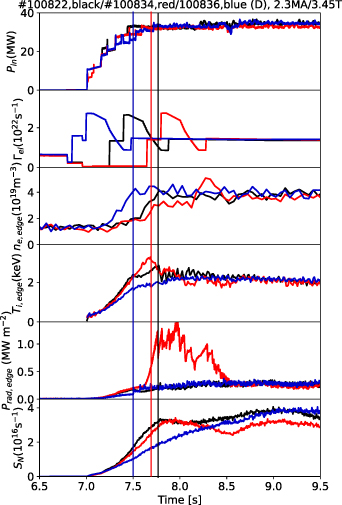
Figure 8. Change in gas timing relative to heating timing. On top is the NBI input power plotted, the second box has the gas request waveform, the third box the edge density, the fourth the edge ion temperature, the fifth the edge line averaged radiation from a vertical bolometer channel and the last box has the neutron rate plotted. Vertical lines in the appropriate colour indicate the first appearance of type-I ELMs.
Download figure:
Standard image High-resolution imageKeeping the W impurities out of the confined plasma is a necessary but not sufficient condition to achieve high fusion power. The confinement in general but the temperatures especially need to be maximised. This is also partially achieved during the initial H-mode phase. The low density/high temperature phase helps to decouple ions and electrons and produce high  and high β. As is is known from analysis, and modelling of Carbon wall [18] pulses, and experiments in the ILW at lower IP
[12, 63], achieving higher β can reduce the heat transport in particular that of the ions. This effect is assisted by the fact that the pedestal stability is increased at higher beta [64, 65]. In addition to this, the fast particle fraction will increase due to the longer slow-down times when the electron temperature is increased. This augments the thermal beta effects and is known to stabilise turbulence [20, 66]. Under conditions of low density, and high NBI heating power, the plasma rotation and its gradient also increases. This leads to a higher
and high β. As is is known from analysis, and modelling of Carbon wall [18] pulses, and experiments in the ILW at lower IP
[12, 63], achieving higher β can reduce the heat transport in particular that of the ions. This effect is assisted by the fact that the pedestal stability is increased at higher beta [64, 65]. In addition to this, the fast particle fraction will increase due to the longer slow-down times when the electron temperature is increased. This augments the thermal beta effects and is known to stabilise turbulence [20, 66]. Under conditions of low density, and high NBI heating power, the plasma rotation and its gradient also increases. This leads to a higher  shearing rate which can also play a role in the transport reduction. Detailed modelling has not yet been performed, so a quantification of the different effects is not possible at this stage. The neutron performance in Deuterium consists of thermal reactions, beam-target, beam-beam and RF-NBI synergy effects as described in [67].
To access all these synergistic effects, the main ingredients are a low electron density, low radiation, no detrimental MHD, and high (edge) ion temperature. In figure 9 two plasmas are shown, in red a pulse with strong early gas fuelling and in blue a plasma with late initial gas. In the middle the plasma profiles during the ELM free period around t = 7.5 s and on the right at the start of regular ELM activity at t = 7.9 s are shown. In case of the lower gas influx the edge density is increasing much more slowly. At the same time, the ion temperature is much higher in the core, but this is also seen in the pedestal region. The toroidal velocity is similarly about 20% higher, in the same way the ion temperature is increased. About 400 ms later (≈2 ) the differences in the density profile have almost disappeared (late gas more peaked in the very centre but also higher pedestal), but the differences in the core ion temperature (same for toroidal velocity) are almost as large as at the earlier time. The profile shape has changed, and an ITB (internal transport barrier) like structure has appeared around half radius (not visible in the toroidal rotation). The high core ion temperature has lead to the very high transient neutron rates which are comparable to previous neutron rate records [68–70] in Deuterium. As well, as the high ion temperature, the electron temperature is also higher over the whole radius. Even though the performance of the early gas fuelling pulse is much worse in this phase, the ion temperature is higher than the electron temperature. The performance degradation is most probably caused by changes in the pedestal structure as reported in [71]. The high temperatures result in the normalised parameters
  (calculating the thermal stored energy using the fast particle fractions calculated by TRANSP [72]) and
  for about one τE
. Unfortunately the high fusion performance decays in all cases. The preparation for D-T concentrated on stationary pulses for at least 5 s, as a consequence it was not attempted to prolong the transient high performance.
for about one τE
. Unfortunately the high fusion performance decays in all cases. The preparation for D-T concentrated on stationary pulses for at least 5 s, as a consequence it was not attempted to prolong the transient high performance.

Figure 9. Comparison of pulses with early gas (red) and late gas (blue) in the H-mode entry phase. On the left (a) the time traces are organised as follows: on top  , second gas request, third bulk radiated power, fourth the line integrated density at the edge, fifth Ti
from a spectroscopic line integrated measurement close to the plasma centre and last the neutron rate. The gray vertical bar denotes the time and averaging interval for the profiles shown in the middle (electron density in (b), electron and ion temperature in (d) and on the right (electron density in (c), electron and ion temperature in (e).
, second gas request, third bulk radiated power, fourth the line integrated density at the edge, fifth Ti
from a spectroscopic line integrated measurement close to the plasma centre and last the neutron rate. The gray vertical bar denotes the time and averaging interval for the profiles shown in the middle (electron density in (b), electron and ion temperature in (d) and on the right (electron density in (c), electron and ion temperature in (e).
Download figure:
Standard image High-resolution image2.6. Maintaining plasma performance and stability during heating flattop
Up to now the H-mode entry phase was discussed, in the following the important factors to maintain the performance are described. In figure 10 two pulses are compared, now concentrating on the more stationary ELMy H-mode phase. Here the pulse with early gas (#96501, red), is compared to the final D reference pulse obtained before D-T (#97781, blue). It has a slower start to reach the fusion performance but for  9.3 s the same neutron rate is reached. Nevertheless, the two pulses are not equivalent in this phase, as can be seen in the kinetic profiles shown on the right part of figure 10. The ion temperature for the late gas injected pulse is higher. Detailed analysis [57] shows, that the pulse in blue is relatively well protected from impurity accumulation by edge Ti
screening as discussed in section 2.3.1. A drop in NBI power at t = 9.4 s leads to an increase in radiated power in the pulse shown in red and the performance degrades. The pulse in red had a 4 Hz sweeping whereas the one in blue had 20 Hz, which, as discussed before, might affect the ELM behaviour. The initially visible, slow oscillation of the radiated power in the pulse in red and even the reduced ion temperature could be caused by this. After the radiation increase, the difference in plasma temperatures becomes stronger. Even though the pulse in blue shows an increased density peaking, the radiated power stays constant indicating that no accumulation process is ongoing and the fusion performance is sustained. The peak
9.3 s the same neutron rate is reached. Nevertheless, the two pulses are not equivalent in this phase, as can be seen in the kinetic profiles shown on the right part of figure 10. The ion temperature for the late gas injected pulse is higher. Detailed analysis [57] shows, that the pulse in blue is relatively well protected from impurity accumulation by edge Ti
screening as discussed in section 2.3.1. A drop in NBI power at t = 9.4 s leads to an increase in radiated power in the pulse shown in red and the performance degrades. The pulse in red had a 4 Hz sweeping whereas the one in blue had 20 Hz, which, as discussed before, might affect the ELM behaviour. The initially visible, slow oscillation of the radiated power in the pulse in red and even the reduced ion temperature could be caused by this. After the radiation increase, the difference in plasma temperatures becomes stronger. Even though the pulse in blue shows an increased density peaking, the radiated power stays constant indicating that no accumulation process is ongoing and the fusion performance is sustained. The peak  value in #97781 is 2.8 at the time of the performance overshoot and then reduces to 2.35 when the global performance is the same as in #96501. To summarise the progress in Deuterium, the time averaged fusion power (D-T equivalent, defined as in [73] essentially using a 50:50 mix of D and T with the NBI power shared between D and T, otherwise no changes) is plotted against the averaging time in figure 11 in pink. To reference, the achieved DTE1 fusion powers [74] are plotted in red and the actual reached fusion power in DTE2 (only
  ) are plotted in blue. The DTE2 results will be discussed in section 4. The transient peak fusion power of 1997 was approached in terms of D-T-equivalent fusion power. The drive for obtaining stationary conditions was successful as can be seen for averaging times between 2 and 5.5 s where the fusion power is more than twice the value from 1997. One reason for the improved fusion power is the higher available auxiliary heating power of
  MW and
  MW in the DTE2 preparation compared to
  MW and
  MW used in the DTE1 pulses which are plotted in figure 11.
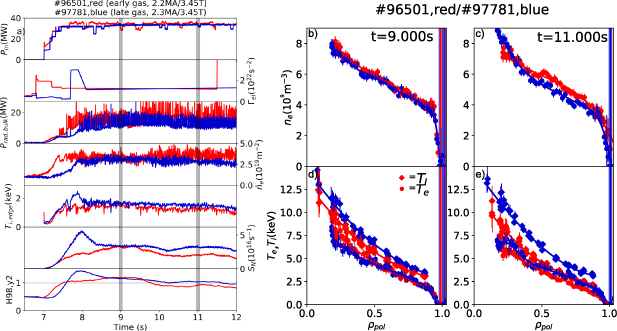
Figure 10. As in figure 9 but comparison of a steady phase (a). The gray vertical bar denotes the time and averaging interval for the profiles shown in the middle (electron density in (b), electron and ion temperature in (d) and on the right (electron density in (c), electron and ion temperature in (e)).
Download figure:
Standard image High-resolution image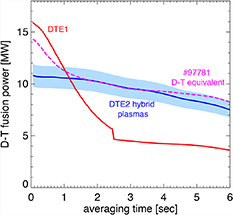
Figure 11. Averaged fusion power against averaging time including the results from the D-T campaign.
Download figure:
Standard image High-resolution image3. Transition to Tritium
A change in isotope mass can affect many important phases of the scenario. In this study we have excluded the effect of Tritium on the breakdown by using Hydrogen gas, even though the break down in Tritium has been shown to work during the commissioning phase. The consequences of a breakdown in Tritium on the initial q-profile have not been investigated, and the additional risk associated with this has not been taken. The change in the H-mode entry phase, due to a change in L-H threshold [75], but also due to different confinement and ELM behaviour, has been considered as one of the main challenges. Also in the flattop, a change in ELM/confinement, but also possibly in the impurity source (higher sputtering yield) and transport (potential change in kinetic profiles) are expected, and the same is valid for the termination phase. Even though other ICRH schemes would be available, all experiments described here used the Hydrogen minority scheme, as it was used in Deuterium. Also the expected broadening of the NBI deposition profile, due to the lower velocity of Tritium when accelerated to the same kinetic energy, can have consequences for the energy transport, particle transport (lower core source) and the rotation profile [76]. The key parameters of the pulses used in this section are summarised in table 2. Confinement improvement factors are not available due to the different NBI deposition profiles (and fast ion content) with T NBI which are not calculated as a standard output. Only detailed TRANSP calculations can be used which are not available for many of the pulses. Also it should be mentioned that the neutron rates quoted are T-T neutrons which have a different reaction cross section, so that the neutron rates in pure T plasmas are higher than in D plasmas for the same plasma parameters.
Table 2. Discharge parameters for Tritium pulses and references at t = 8.5 s.
| Pulse No | IP (MA) | BT (T) |
 (MW) (MW) |
 (MW) (MW) |
 1022 s−1 1022 s−1
| sw. freq. (Hz) |
 (MJ) (MJ) |

| Elem | SN 1016 s−1 | figure(s) |
|---|---|---|---|---|---|---|---|---|---|---|---|
| 97 848 | 2.3 | 3.45 | 0 | 0 | 0.34 | 0 | 1.36 | 0.15 | D | 0.0001 | 12 |
| 98 562 | 2.3 | 3.45 | 0 | 0 | 0 | 0 | 1.12 | 0.06 | T | 0.0002 | 12 |
| 98 567 | 2.3 | 3.45 | 0 | 0 | 0 | 0 | 0.87 | 0.18 | T | 0.0004 | 12 |
| 97 893 | 2.3 | 3.45 | 25 | 1.5 | 0.04 | 20 | 6.67 | 1.96 | D | 2.3 | 13, 14 |
| 98 913 | 2.3 | 3.45 | 24 | 1.55 | 0.05 | 20 | 8.12 | 2.46 | T | 7.25 | 13, 14 |
| 97 977 | 2.3 | 3.45 | 29 | 1.5 | 0.14 | 20 | 8 | 2.3 | D | 3.3 | 15 |
| 99 272 | 2.3 | 3.45 | 28 | 1.6 | 1.05 | 20 | 9.2 | 2.85 | T | 8.9 | 15 |
| 97 781 | 2.3 | 3.45 | 30 | 1.5 | 1.15 | 20 | 8.06 | 2.34 | D | 3.5 | 1, 2, 6, 10 |
| t = 8 s | 2.3 | 3.45 | 30 | 1.5 | 1.13 | 20 | 9.45 | 2.77 | D | 5.5 | 11, 16, 17 |
| 18, 19, 20(b) | |||||||||||
| 21, 23 | |||||||||||
| 99 163 | 2.3 | 3.45 | 29 | 1.5 | 1.95 | 20 | 8 | 2.3 | T | 6.6 | 16, 17 |
| 99 161 | 2.3 | 3.45 | 27 | 1.4 | 1.07 | 20 | 7.75 | 2.3 | T | 5.7 | 16, 17 |
| 100 854 | 2.3 | 3.45 | 29.5 | 1.5 | 1.95 | 20 | 6.2 | 1.78 | D | 2.16 | 16, 17 |
3.1. Isotope effect on q-profile tailoring
In the following it will be shown that the q-profile formation is isotope dependent and that a change in density can mitigate the effect.
A careful comparison of H and D pulses had shown a significant delay of the q = 1 MHD onset time with an increase in isotope mass [77]. This delay in the q = 1 formation could be traced back to a change in electron temperature peaking caused by central radiation. Possible root causes are an ion-electron decoupling due to a lower electron-ion heat exchange lowering Ti and it is gradient screening, and/or increased impurity sputtering by the heavier isotope. The effect is reproduced in [78] by modelling the current ramp up using transport coefficients calculated by Qualikiz. A possible mitigation was proposed in this paper by increasing the plasma density. In figure 12 three pulses are shown: In blue a Deuterium reference, in pink a Tritium replicate, maintaining the gas request waveform and in purple a pulse with increased density to match the q = 1 MHD onset time. The pulse in pink was terminated early at t ≈ 4.7 s by a hollow temperature protection, which was intended to stop plasmas in order not to disrupt and to save Tritium and neutrons later in D-T. Nevertheless, it disrupted later due to a locking of a double tearing mode caused by the modified q-profile. The pulse with higher density in Tritium ran through normally and the onset time of q = 1 MHD was matched within a few ms. This recipe was used from then on.
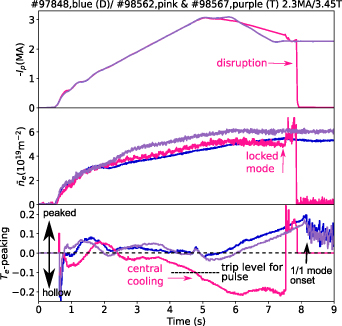
Figure 12. q-profile shaping in Tritium. On top the plasma current, in the middle the core line integrated density and on the bottom a Te core peaking factor are plotted.
Download figure:
Standard image High-resolution image3.2. Impact of higher isotope mass on H-mode access phase
In the following it will be shown that the higher isotope mass of T compared to D leads to a change in edge stability and hence to longer ELM free phases. The ELM frequency together with the higher edge density leads to stronger impurity influxes and less radiation stable pulses. Only an increase in gas injection rate can mitigate this.
The transition to higher main ion isotope mass also had consequences for the H-mode entry phase and the initial ELM free phase. In figure 13, a comparison of two plasmas with very similar engineering parameters (same IP
, BT
,  , very similar gas inlet), but with different main ion isotopes, is shown. Until about t = 7.6 s, the plasmas are very similar having the same stored energy, pedestal density and pedestal temperature. Then the edge radiation in the Tritium pulse starts to increase, and the pedestal electron temperature no longer increases, whereas in the Deuterium pulse the pedestal temperature increases further before saturation. At t ≈ 7.75 s the first type-I ELM in the Deuterium pulse occurs. At this time, before the first type-I ELM in the Tritium pulse, the pedestal temperature in the Deuterium pulse is higher than in Tritium, but the stored energy and the density are slightly higher in the Tritium pulse as can be inferred from figure 13 left side. The detailed electron pedestal profiles from the HRTS diagnostic, are plotted in the middle part of figure 13. The increase in edge density mentioned before is not visible in these profiles. This could be, because the averaging interval is 150 ms, whereas the densities are diverging only ≈100 ms before the ELM, and the scatter in the profile measurements is comparable to the expected differences. Nevertheless, the first ELM in the Tritium pulse is delayed past t = 8 s and therefore significantly delayed compared to Deuterium. At the time of the first ELM in Tritium, the pedestal density and the edge radiation have increased significantly, at about constant pedestal temperature, resulting in a about 15% higher pedestal pressure. The detailed profiles from HRTS for this time point are shown in the right part of figure 13.
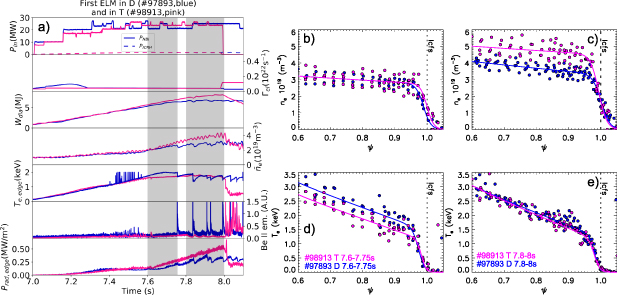
Figure 13. Delayed first ELM in Tritium. On the left hand (a) the time traces in blue for the Deuterium pulse and in pink for the Tritium pulse are shown. On top the NBI and ICRH heating powers, in the second row the gas request, in the third row the stored energy, in the fourth row a line integrated edge density, in the fifth row a electron temperature measurement close to the pedestal (spikes around 7.5 s could be related to non thermal electron losses), followed by a Be II signal and last an edge line integrated radiation measurement. The gray vertical bar denotes the time and averaging interval for the pedestal temperature (d), (e) and density profiles (b), (c) shown on the right. The averaging interval is chosen to be before the first Deuterium ELM in the middle plots (b), (d) and before the first Tritium ELM on the right side (c), (e).
Download figure:
Standard image High-resolution imageFurther insight can be gained from a ELM stability analysis (details are explained e.g. in [79]), shown in figure 14. Here, the normalised pressure gradient  is on the x-axis and the normalised current density on the y-axis. The colour code represents the calculated growth rate of the analysed peeling-ballooning modes in MISHKA. In a black line the calculated stability boundary is drawn. Also in black, the most unstable n mode number is indicated as a number. The green star represents the
  of the analysed plasma using the pedestal profiles shown above. This assumes
  in the profile from the pedestal top to the SOL and any systematic difference between T and D could affect the comparison. The measured Ti
at the pedestal top is close to the electron temperature during the time interval presented in both discharges. At the early time point, both plasmas are indicated as stable. Considering the long averaging interval, which is not included in the estimate of the error bar, and the significant error bars involved, this can be considered as typical for plasmas which are close to an ELM occurring. If at all, the T pulse on the right is deemed to be more unstable than the Deuterium pulse on the left, which had an ELM occurring shortly after. At the later time point, the Deuterium pulse has already regular ELMs and the point has moved closer to the calculated stability boundary, indicating good agreement between the stability calculation and the experimental observed ELM stability. The Tritium pulse on the lower right, on the other hand, has not yet had an ELM in the experiment, but a 15% higher pedestal pressure which translates to a about 20% higher α (corresponds to a mostly constant pedestal width) and a slightly higher normalised edge current. The observation, that the Tritium pulse crosses the stability boundary is not robust enough to make a strong statement here. But clear from the relative movement is, that the pedestal stability in Tritium is improved compared to Deuterium, as reported in detailed type-I ELMy H-mode experiments in D, T and D-T [80, 81]. One consequence is the longer ELM free period in Tritium as described before. But also the higher necessary gas injection, described later, could be related to this. The increased stability in T could be driven by similar physics (resistive MHD) as presented in [81, 82], even though the pedestal top temperatures here are higher, because mostly the near separatrix part of the profile is important. A more detailed analysis has not been attempted yet for the first Tritium ELM presented here.
in the profile from the pedestal top to the SOL and any systematic difference between T and D could affect the comparison. The measured Ti
at the pedestal top is close to the electron temperature during the time interval presented in both discharges. At the early time point, both plasmas are indicated as stable. Considering the long averaging interval, which is not included in the estimate of the error bar, and the significant error bars involved, this can be considered as typical for plasmas which are close to an ELM occurring. If at all, the T pulse on the right is deemed to be more unstable than the Deuterium pulse on the left, which had an ELM occurring shortly after. At the later time point, the Deuterium pulse has already regular ELMs and the point has moved closer to the calculated stability boundary, indicating good agreement between the stability calculation and the experimental observed ELM stability. The Tritium pulse on the lower right, on the other hand, has not yet had an ELM in the experiment, but a 15% higher pedestal pressure which translates to a about 20% higher α (corresponds to a mostly constant pedestal width) and a slightly higher normalised edge current. The observation, that the Tritium pulse crosses the stability boundary is not robust enough to make a strong statement here. But clear from the relative movement is, that the pedestal stability in Tritium is improved compared to Deuterium, as reported in detailed type-I ELMy H-mode experiments in D, T and D-T [80, 81]. One consequence is the longer ELM free period in Tritium as described before. But also the higher necessary gas injection, described later, could be related to this. The increased stability in T could be driven by similar physics (resistive MHD) as presented in [81, 82], even though the pedestal top temperatures here are higher, because mostly the near separatrix part of the profile is important. A more detailed analysis has not been attempted yet for the first Tritium ELM presented here.

Figure 14. Stability diagrams early time point (D ELM) upper row (a), (b), later time (T ELM) lower row (c), (d), Deuterium pulse on the left side (a), (c), T pulse on the right side (b), (d). The black stability boundary represents the growth rate of  . The numbers show the most unstable toroidal mode number. The star represents the experimental point.
Download figure:
Standard image High-resolution imageThe previous comparison showed a Tritium pulse where the radiation increase was not very strong. The ratio of radiation to density, a proxy for the impurity density, is similar for the Deuterium and the Tritium pulses in this phase. However, often a behaviour as shown in the comparison in figure 15 was observed. In this case, the edge densities start to be different earlier at about t = 7.3 s, where in the Tritium pulse the first dithering ELMs are visible. Furthermore, the edge radiation is increasing strongly and the pedestal electron temperature increase is limited by the cooling. The core radiation is not increasing at this stage, the radiation is concentrated in the plasma edge and looks like a crescent on the low field side due to centrifugal force effects [54]. In other cases, it was observed that the edge impurities migrate to the core later when the density peaking increases. Within the limited time frame of the Tritium experiments, due to Tritium budget restrictions, the choice was a significant increase in early gas injection to allow experience to be gained with the flattop phase. The gas request waveform was changed to start at t = 7.4 s with the maximum level which was previously only reached at t = 7.6 s after a step up (compare figures 13 and 15). The first ELM now occurs 300 ms earlier and the radiation increase is avoided. The resulting pulses will be discussed in the next section. Please keep in mind that the T injection valves have longer pipe work and that the gas injection time point in figure 15 results in similar actual gas release as in the Deuterium reference pulses, further discussed below.
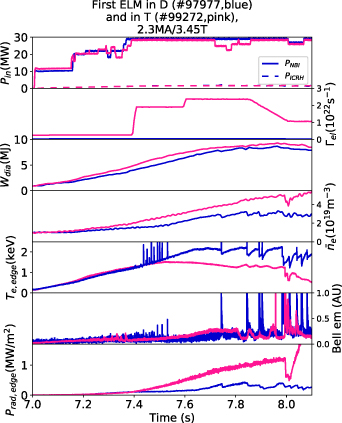
Figure 15. Occurrence of high edge radiation due to missing ELM activity. Figure description as in figure 13 left side.
Download figure:
Standard image High-resolution image3.3. Avoiding impurity accumulation in the flattop phase
In the following it will be shown that also in the flattop the radiation control is more difficult in T compared to D and a higher gas level is needed to stabilise those pulses.
The radiation control during the H-mode entry phase required higher gas influxes. In order to maintain this radiation controlled state also the gas fluxes in the main heating phase had to be optimised. In figure 16, a high fusion performance Deuterium pulse in cyan, a low gas Tritium pulse in pink, a higher gas Tritium pulse in purple and a repeat of the pulse in purple done in Deuterium in darker blue are compared. The Tritium pulses here are not optimal comparison pulses to the high fusion performance Deuterium one, mainly because the NBI heating power is increasing slowly and only reaches the values in the Deuterium pulse at about t = 9 s, when the termination phase starts in the T pulse. This was done to induce the first ELM earlier in addition to the increased early gas fuelling. The gas request waveforms are very different for the T pulse compared to the high fusion performance Deuterium pulse. This is necessary due to the much longer gas pipes which were used for the Tritium gas injection modules compared to the Deuterium gas injection modules [83]. In addition, the increased mass of Tritium compared to Deuterium leads to a lower sound velocity and further delay in the effective injection time by about 50 ms. The delay due to the pipe length has been measured using injections into the empty torus and measuring the response on in vessel gas pressure measurements. It was found that the gas arrival time varies between 300 ms and 500 ms depending on the module used. The longer pipe work also leads to a deformation of the pulse shape, it acts similarly to a low pass filter. For the scenario work the fastest injection modules have been used. There is of course also a similar delay in the Deuterium injection but this is only ≈50–70 ms. A consequence of the delayed gas flow response is that the initial density rise in the pulses is not due to the injected gas, but by remaining gas in the wall, mainly from the plasma startup phase, and also the injection is not as prompt as the time traces imply. These differences have been taken into account when the pulse was repeated in Deuterium, in this case the gas request waveform has been only adjusted for the slower flow speed of Tritium, and valves used in the D pulse had the same characteristics as those used for the Tritium pulses.
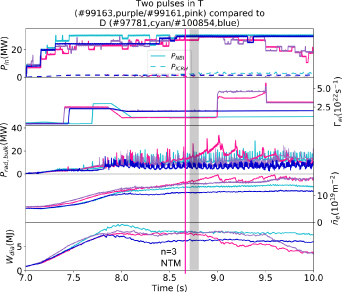
Figure 16. Time traces with 2.3 MA/3.45 T comparing Deuterium with Tritium at different gas levels. The figure is organised as follows: on top the NBI and ICRH heating powers, second gas request waveform, third bulk radiated power, fourth line integrated core density and last the stored energy. The gray vertical bar denotes the time and averaging interval for the profiles shown in the next figure.
Download figure:
Standard image High-resolution imageThe earlier gas and the slower heating ramp lead to a loss in stored energy of 25% in the initial phase of the D engineering comparison pulse, and together with the higher gas injection in the later phase the stored energy is 20% lower for the same heating power. Also the density is lower compared to that in the high performance Deuterium pulse and much lower compared to the Tritium pulses. The radiation is controlled well in the higher gas Tritium pulse and as well in the Deuterium pulse with higher gas fuelling. This comparison reference using the same engineering parameters shows a clear confinement increase in Tritium compared to Deuterium, but it should be kept in mind that the NBI deposition profile is different with the change in isotope mass. The Tritium pulses reach the same stored energy as the high fusion performance Deuterium pulse at t = 8.7 s. Systematically the plasma density is higher in Tritium compared to Deuterium, as shown in [80, 81]. The Tritium pulse with identical gas (pink) to the high performance Deuterium pulse, has a much lower ELM frequency and as a consequence an increased radiation. Further more a n = 3 NTM is triggered at t = 8.6 s. Part of the cause of this lower ELM frequency is probably the lower NBI power in this phase. Only the pulse with increased gas fuelling (purple) is stable until the termination phase. The ELM frequency in this pulse is much higher (≈80 Hz) compared to the high fusion performance Deuterium reference (≈40 Hz) but lower than the comparison reference using the same engineering parameters (≈100 Hz). A pulse with slightly lower gas fuelling in T (not shown here) developed an impurity accumulation problem similar to the pulse in pink. The early termination is due to Tritium saving measures which motivated shorter pulses.
3.4. Performance of Tritium scenario compared to Deuterium
In this sub-section it will be shown that the pulses in T have less potential for high fusion power compared to the D references but if repeated with similar gas injection the T pulses show improved confinement compared to D.
Due to the slow start of the NBI heating in the Tritium pulses (to trigger an earlier ELM, as described above), a comparison with high fusion performance Deuterium pulses is not definitive. It is possible and it cannot be excluded that, if more experimental time could have been dedicated, a higher performance in Tritium pulses could have been achieved. A more meaningful comparison with the comparison reference using the same engineering parameters, obtained after completion of the T and D-T experiments, shows that the higher isotope mass can lead to improved confinement relative to Deuterium. The initial ITB-like structure in the high performance Deuterium pulse could not be reproduced with Tritium, and was also not so evident in the Deuterium engineering comparison pulse. The initial increase in gas, to improve the H-mode entry and the increased plasma density probably prohibits the access to this (transport) regime. A similar stored energy compared to the high fusion performance Deuterium pulse has been reached in the later phase of the pulse, but at higher plasma density. The corresponding profiles, including the comparison reference using the same engineering parameters in Deuterium, are shown in figure 17. The increase in density, seen on the left, overcompensates the losses in temperature (electron temperature middle, ion temperature on the right) for the stored energy. The comparison reference using the same engineering parameters has about a 20% lower stored energy due to lower density and ion temperature. Especially, the ion temperature is reduced at the edge compared to the high fusion performance Deuterium pulse, but also the strong peaking of the core (inside  ) ion temperature profile is not seen in these Tritium pulses. On the other hand, the ion temperature peaking in Tritium is still significantly higher than in the comparison reference using the same engineering parameters for the same pedestal ion temperature, comparing only the higher gas pulses. Further analysis needs to follow to clarify if here the core transport is different than reported in [80, 84, 85], as the situation is complex due to the strong edge-core coupling as reported in [80]. The increased difficulty of impurity control can also be understood from the different profile shapes. The decreased ion temperature gradients in the Tritium pulses, the increase in W sputtering yield due to the higher isotope mass, together with similar or higher density gradients increases the inward transport of W. Here the very different density gradients in the two Tritium pulses are of special interest. The low gas fuelling pulse, which also has a very low ELM frequency (≈20 Hz), has a very high edge density and as a consequence also a large density gradient from the pedestal outwards. In figure 17 lower part the pedestal profiles are shown. The profiles have been shifted radially to ensure 100 eV electron temperature at the separatrix to compensate for possible inaccuracies in the equilibrium reconstruction. The density outside the separatrix is with HRTS data not well constrained, hence the difference in SOL decay length is probably not real. On the other hand it can be seen that the pedestal density in T is about 50% higher compared to Deuterium for the high gas and the low gas case. The density is lower for the higher gas fuelling indicating that the particle outward transport by ELMs is dominating the source effect. The higher density gradient in T together with the low (compared to high fusion performance Deuterium) ion temperature gradient and the missing outward transport by ELMs generates ideal conditions for a strong increase in W radiation from the mantle region, in the 'crescent'-like impurity structure. The stable pulse has a similar density gradient as in Deuterium with a lower ion temperature gradient. This is probably compensated by the larger outward transport by ELMs (
 80 Hz,
  40 Hz) resulting in a stable situation, as is typical of the behaviour of baseline scenario pulses in JET-ILW [55]. The comparison reference using the same engineering parameters pulse in Deuterium has even lower ion temperature gradients towards the core but higher ELM frequency. To summarise: A plasma state with similar confinement, compared to high fusion performance Deuterium pulses, has been reached but the increase in density and the decrease in (ion-)temperature make the plasmas unsuitable for the purpose of achieving higher fusion performance. Compared to an engineering reference a clear energy confinement improvement and also higher ion temperature gradients towards the core are found. Lessons have been learned on impurity control and how to enter H-mode in a more controlled manner in plasmas with Tritium.

Figure 17. Profile comparison at  s between Deuterium (high fusion performance pulse in light blue, comparison reference using the same engineering parameters in darker blue) and Tritium pulses (low gas pulse in pink, high gas pulse in purple). (a), (d) Electron density, (b), (e) electron temperature and (c) ion temperature. The lower row shows the pedestal profiles with the separatrix position defined as the 100 eV point in the electron temperature.
Download figure:
Standard image High-resolution image3.5. Some remarks on the plasma termination in Tritium
In the following it will be shown that also in the termination T pulses are more prone to impurity accumulation and they are more disruptive.
As can be seen already from the discussions on H-mode entry and on impurity control during the steady ELMing phase, it could be expected that the termination would face significant difficulties. As discussed in [86, 87] the main problem in the termination with a metallic wall is the control of the impurities. This is achieved by increasing the gas fuelling to increase the ELM frequency and reduce the confinement. Both, become more difficult with the increase in isotopic mass and therefore the method used for Deuterium pulses did not work well, impurity accumulation and excitation of low n-number tearing modes were observed. In principle the strategy to improve this phase is clear, namely by increasing the gas inlet, the heating power and by extending the length of the termination phase [86]. However, for reasons described in [88], the measured local power of re-ionised NBI particles in the NBI duct increases with isotope mass. The temperature increases with higher injected gas rate, NBI power and also the pulse duration. This leads to premature stop of the plasma due to violation of the surface temperature limit. As a consequence the gas rate, duration and power during the termination phase had to be cut in order to run the pulses through without safety induced stops. As a result, all of the hybrid Tritium pulses disrupted, the vast majority in the termination phase, but a few pulses also because of uncontrolled radiation increases in the H-mode entry phase. This should be compared to the Deuterium disruptivity of  5%.
5%.
4. Reaching high fusion performance in 50:50 Deuterium-Tritium mixture
Due to the difficulties illustrated in the previous section, it was thought to be too time consuming to start the development in D-T as a middle point between the successful Deuterium pulses and the adjustments performed in Tritium. The development started again from the Deuterium references, but keeping the lessons learned in Tritium in mind. The scenario development in D-T was very restricted due to the large amount of neutrons produced in the hybrid discharges and the limited time frame of the campaign. Therefore the IP and BT waveforms have not been changed neither the shaping or the sweeping scenario. First, the q-profile adjustment in the current ramp up (see previous section) was done in Ohmic plasmas. Here a point in the middle between the density in Deuterium and the density in Tritium quickly provided the right operation point. Next, short pulses were done to optimise the H-mode entry phase. Last, the flattop was optimised in long pulses. In addition to this staged development, additional real-time stops were implemented to: stop plasmas with hollow electron temperature profiles in the current ramp up (already used in Tritium), stop plasmas with insufficient heating power and to stop plasmas with a stored energy below a certain threshold. This last neutron saving measure was used extensively towards the end of the DTE2 campaign as the hybrid plasmas were producing large amounts of neutrons, to ensure that full duration pulses superseded the performance of the previous pulses. This was necessary due to the strong activation of the plasma vessel by the produced neutrons and the limited life time neutron budget of JET. In table 3 the pulses used in this section are summarised.
Table 3. Discharge parameters for D-T pulses and references at t = 8.5 s.
| Pulse No | IP | BT |

|

|

| sw. freq. |

|

| Elem | SN | figure(s) |
|---|---|---|---|---|---|---|---|---|---|---|---|
| (MA) | (T) | (MW) | (MW) | 1022 s−1 | (Hz) | (MJ) | 1018 s−1 | ||||
| 97 781 | 2.3 | 3.45 | 30 | 1.5 | 1.15 | 20 | 8.06 | 2.34 | D | 0.035 | 1, 2, 6, 10 |
| t = 8 s | 2.3 | 3.45 | 30 | 1.5 | 1.13 | 20 | 9.45 | 2.77 | D | 0.055 | 11, 16, 17 |
| 18, 19, 20(b) | |||||||||||
| 21, 23 | |||||||||||
| 99 596 | 2.3 | 3.45 | 26 | 4.5 | 1.7 | 20 | 7.55 | 2.1 | D-T | 2 | 18 |
| 99 527 | 2.3 | 3.45 | 26 | 1.55 | 0.94 | 20 | 9 | 2.75 | D-T | 3.45 | 18 |
| 99 950 | 2.3 | 3.45 | 29 | 4 | 1.4 | 20 | 9.7 | 2.77 | D-T | 3.45 | 19, 20, 21, 22 |
| 100 822 | 2.3 | 3.45 | 30 | 4.25 | 1.4 | 20 | 8.4 | 2.3 | D | 0.036 | 8, 19, 21, 22 |
| 99 912 | 2.3 | 3.45 | 29 | 3.9 | 1.47 | 20 | 9.8 | 2.75 | D-T | 3.7 | 20(b) |
| 99 869 | 2.3 | 3.45 | 27 | 4 | 1.45 | 20 | 9.42 | 2.6 | D-T | 3 | 20(b) |
4.1. Optimisation of the H-mode entry
In the following it will be shown that in a 50:50 D-T mixture the H-mode entry phase is characterised by an increased edge stability resulting in increased edge radiation despite the existence of an edge ion temperature gradient screening. Similarly to pure T an increase and shift in timing of the gas injection allows radiation stable pulses.
In D-T, first tests with the gas timing as in Deuterium have led to radiation unstable pulses similarly to the results in Tritium. In figure 18, three pulses are shown, in blue the Deuterium reference discharge, in orange an example of a low and late gas fuelling pulse and in gold a discharge where the radiation in the H-mode entry phase was successfully controlled, both in D-T. The gas request waveforms in D-T represent two different gas inlets with different time constants. The start of the waveform consists of Tritium injection modules which have long pipes and therefore the gas will enter the vessel later (T injection as dotted lines in figure 18), approximately together with the Deuterium injection starting at the second step (D injection as dashed lines). This second step can be directly compared with the gas request in the Deuterium pulse in blue (#97781). In the pulse in orange (#99527) the gas is effectively injected about 100 ms later than in the Deuterium pulse and in the pulse in gold (#99596) 200 ms earlier than the in pulse in orange. During the experiments, it was found that with a waveform as in the pulse in orange a slightly Tritium rich plasma is created at the start of the H-mode, the more compact waveform as in the pulse in gold, creates a slightly Deuterium rich plasma but the 50:50 mix is reached within a second. The late start in the gas injection for the pulse in orange leads to a very long ELM free phase with the first ELM almost 1.2 s after the start of the heating. The edge radiation is steadily increasing in this phase despite the high edge ion temperature. The high radiation leads to a roll over in the temperature around t = 7.7 s resulting in lower edge temperatures at t = 8.2 s compared to the two other pulses. The pulse in gold has much reduced radiation, controlled by early and frequent ELMs—even reaching lower edge radiation levels than the reference in Deuterium. This pulse is on the safe side of the gas injection rates similarly as the Tritium pulse in the previous section. Scans of the gas timing have shown a gradual loss of radiation control during the early phase of the pulse, if the gas timing is between the pulse in gold and the pulse in orange without a significant performance improvement. The early gas timing has been adopted as standard in the following scenario development. As with Tritium, the early gas timing in D-T prevented the occurrence of the very high fusion performance, transient phase seen at the start of the main heating pulse in Deuterium. The performance optimisation concentrated purely on the heating flattop to extend the duration of the high fusion performance achieved.
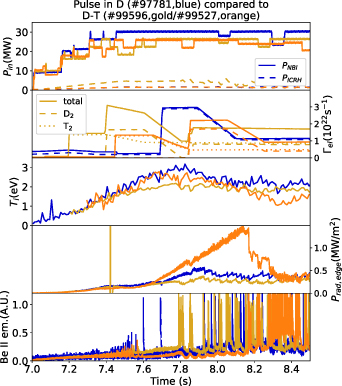
Figure 18. H-mode entry in D-T with early (gold) and late (orange) gas injection compared to Deuterium (blue) with 2.3 MA/3.45 T. The figure is organised as follows: on top the NBI and ICRH heating powers, second the gas request waveform (closed line: total number of electrons, dashed line: total number of Deuterium atoms, dotted line: total number of Tritium atoms), third the ion temperature close to the plasma edge but inside the pedestal, fourth a line integrated bolometric measurement cutting through the low field side avoiding the divertor (detection of 'crescent' like radiation) and fifth the Be II light to indicate the ELM crashes. The 'spike' on the bolometric measurement is not connected to an impurity influx, it is not a real radiation signal but a low level diagnostic disturbance.
Download figure:
Standard image High-resolution image4.1.1. Ion temperature screening of W in the plasma periphery.
As discussed in the section 2.5 it is preferable to achieve a high edge Ti to improve the confinement and to screen high Z impurities. Due to a contamination of the horizontal bolometer channel signals by the injected Tritium neutrals hitting the detection foil (gas inlet close by), only the vertical bolometer channels are used to derive the radiation transport in the pedestal region. Although this analysis is potentially less robust, the comparison shown in figure 19, which includes a D pulse that was analysed in [57], is consistent with the achievement of impurity screening in D-T plasmas.
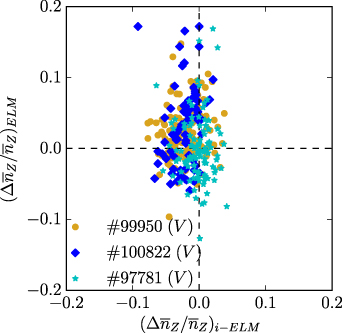
Figure 19. Impurity transport between and during ELMs in D-T compared to D. On the x-axis the change in high Z impurity density between ELMs and on the y-axis the change in high Z impurity density due to an ELM crash is shown. Positive numbers are indicating inward direction of the transport.
Download figure:
Standard image High-resolution imageStarting with the main Deuterium reference #97781 (section 2.5) in blue, the Deuterium comparison pulse for D-T done after the D-T campaign #100822 in cyan and one of the best performing D-T pulses #99950 in gold. On the x-axis the relative change in high Z impurity density between ELMs is shown. Negative x-values mean an outward transport of impurities between ELMs hence screening and positive x-values represent inward transport between ELMs. On the y-axis the relative change in impurity density is given, comparing the value from before an ELM crash with the value afterwards. Negative values are considered as ELM flushing whereas positive values mean an inward transport, e.g. by an increased source during the ELM crash, or a temporary break down of the screening due to the pedestal temperature loss. Another explanation could be, that the ELMs, which have an interchange nature, can bring in W from the SOL if the density is higher there, than at the pedestal top. In this representation a purely ELM flushing pulse should have points only in the lower right corner and a pure screening pulse would have points only in the upper left corner. The D-T pulse does not differ significantly from the two Deuterium pulses, hence the strength of Ti screening in D-T was similar to Deuterium (this analysis has not been performed for T). The profile details will be discussed in section 4.2.
4.2. Performance of D-T scenario and comparison with Deuterium
In the following it will be shown that opposite to pure T, in a 50:50 D-T mixture a similar fusion performance compared to the D-T equivalent in Deuterium can be reached. Adjustments to the gas injection are nevertheless necessary. Compared to D pulses with the same gas injection level the confinement in D-T is clearly improved. Record fusion energy has been generated in a 50:50 D-T mix.
To characterise the performance in the best D-T pulse the time traces of some key quantities are plotted in the left part of figure 20. Even though this pulse gives the best 5 s averaged fusion power of 8.3 MW it is not fully stationary. The bulk radiated power increases slowly after t = 9 s, preceded by an increase in density peaking and the fusion performance starts to roll over. One additional effect is the onset of different NTMs, namely n = 4 starting at t = 10.55 s and n = 3 at t = 11.13 s. Coincident with the occurrence of the n = 4 NTM, the stored energy starts to decay faster, the radiated power increases and the measured neutrons start to decay. By the time of the n = 3 NTM the performance is already so far degraded, that no direct impact is visible. Just for reference, n = 1 activity starts at t = 8.84 s indicating the arrival of the q = 1 surface. The pulse is in a hybrid domain reaching  at
at  and
and  . The fusion power is shared by beam-target reactions (≈60%) and thermal (≈40%) (beam-beam reactions are negligible). The fusion power has been achieved with a triple product of
 ![$[n_T(0)+n_D(0)]\cdot \tau_{\text{E,th}}\cdot T_i(0)\approx1.16\cdot10^{20}$](https://content.cld.iop.org/journals/0029-5515/63/11/112001/revision1/nfacde8dieqn78.gif) m−3 keVs and a fusion gain of Q = 0.32. TRANSP calculations show that 2 MW of alpha particle heating were generated in the early phase and decay later in the pulse together with the stored energy. In this calculation only orbit losses are considered, additional losses as described in [89] are expected.
m−3 keVs and a fusion gain of Q = 0.32. TRANSP calculations show that 2 MW of alpha particle heating were generated in the early phase and decay later in the pulse together with the stored energy. In this calculation only orbit losses are considered, additional losses as described in [89] are expected.
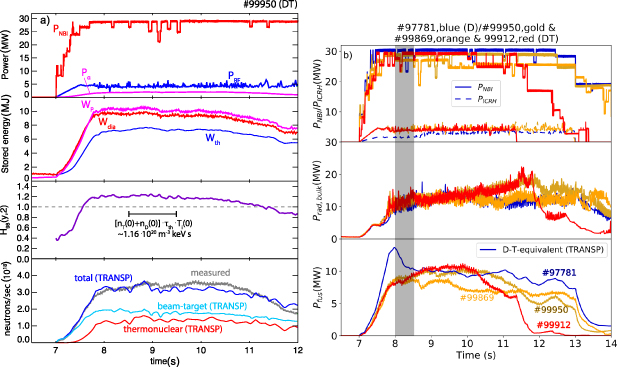
Figure 20. Main performance indicators of D-T pulse (2.3 MA/3.45 T, figure on the left, (a). On the top the NBI, ICRH and the alpha heating power (from TRANSP) are plotted. In the second row the  , the
, the  and the calculated thermal stored energy from TRANSP
  are plotted. In the third row the energy confinement time normalised to the IPB98(y,2) scaling is drawn. In the last row the measured and modelled neutron rates from TRANSP are shown. The fusion performance compared to Deuterium (2.3 MA/3.45 T, right, (b)). On top the heating powers are presented. In the middle the bulk radiated power smoothed over 10 ms is shown. On the bottom the achieved fusion powers for the D-T pulses and the D-T equivalent fusion power from TRANSP for the Deuterium pulse are shown. The gray vertical bar denotes the time and averaging interval for the profiles shown in the next figure.
Download figure:
Standard image High-resolution imageAnother interesting question to ask, is whether the performance in D-T is similar to the best pulses run in Deuterium. In the right part of figure 20, three of the best pulses from D-T are compared to the reference high performance discharge in Deuterium. The Deuterium pulse (blue) has higher NBI power but there is a step in the ICRH power later in the pulse. The best performing D-T pulse (gold) has about 2 MW less NBI power, but this is comparable to the generated alpha heating power. The most stationary high fusion performance D-T pulse (orange) starts with the same power as the pulse in gold but then the power is reduced after the initial phase. All three pulses have a similar radiated power as can be seen in row 2 as a lower boundary. Also all pulses used the Hydrogen minority ICRH scheme even though possibly higher fusion powers could have been obtained with other schemes in D-T [44]. Last, the fusion power is plotted. In case of the Deuterium pulse the fusion power is calculated by TRANSP assuming a 50:50 D-T plasma with 50% Tritium NBI injection, using the kinetic profiles from the Deuterium pulse. The drop of fusion power in the pulse in orange is caused by the power loss at t = 9.47 s. The initial very high performance of the Deuterium pulse could not be reproduced (under other conditions ITBs can be formed in D-T, see [90]), but the fusion power in the stationary phase was well reproduced even with slightly less NBI power. The higher performance pulse #99950 sets a new record fusion energy obtained in a 50:50 mixture D-T of 45.8 MJ. Also a pulse with more stationary conditions and without a slow change of the radiation after a NBI power loss (#99869) has been obtained. This pulse is accompanied by a pulse obtaining more than 10 MW fusion power (Q = 0.35) for ≈3 alpha slowing down times (#99912, red). Higher fusion energy and power averaged over 5 s has only been generated in the tritium-rich scenario reported in [91]. If compared to the 1997 results (as in figure 11), the transient peak fusion power was not achieved in DTE2. This is largely due to the fact that the ITB which was visible in the D-T preparation discharges could not be reproduced, most likely because of the earlier gas injection leading, together with the change in isotope mass, to higher densities. Also the lower toroidal rotation speed could be important here.
In the pulses here the ELM frequency for the Deuterium pre-DT reference is lower (≈30 Hz) in the early phase (8–9 s) then it increases to 40 Hz (9–10 s) and even further to 50 Hz (10–11 s) and 60 Hz (11–13 s). The D-T pulses have a more constant ELM frequency of ≈45 Hz which is similar to the post D-T reference (#100822 in D). This comparison can be expanded by looking at the kinetic profiles which are shown in figure 21 in the upper part. The electron density is higher in D-T across the plasma radius, the electron temperature is similar though a little more peaked in D-T compared to Deuterium. The ion temperature is slightly higher in Deuterium compared to D-T starting in the pedestal. The toroidal rotation velocity is by about 50% higher in this Deuterium pulse, the rotation peaking ( –0.8) is similar.

Figure 21. Comparison of kinetic profiles between Deuterium reference (blue) and D-T performance pulses (gold) for time interval 8–8.5 s. Upper row: original pre D-T campaign reference (a)–(d), lower row post D-T campaign reference (e)–(h). Left: electron density (a), (e), second electron temperature (b), (f), third: core ion temperature (c), (g), right: core toroidal velocity (d), (h).
Download figure:
Standard image High-resolution imageAs indicated in section 4.1 the H-mode entry phase had to be changed when running the pulses in D-T. Considering potential legacy effects of this phase on the rest of the pulse, the pulses discussed above might not be comparable. Hence another series of pulses have been performed after the D-T campaign in D, to gain better comparison pulses. In figure 22 on the left time traces of an engineering comparison pulse (same heating power, gas request waveforms matched in the H-mode entry and during flattop) between the D-T pulse and a Deuterium pulse is shown. This is a good match until t ≈ 9.5 s, when in Deuterium the radiation increases. In this comparison the stored energy is 18% lower in Deuterium compared to the D-T pulse. The profiles are shown in the lower row of figure 21. The toroidal rotation velocity is now very well matched with the D-T pulse. The toroidal velocity was consistently higher in the series of pulses obtained before D-T. The high rotation velocity for the pre D-T reference pulse can not be straightforwardly explained, by e.g. other NBI sources or energies as those are similar between #97781 and #100822. The NBI deposition in D-T is different compared to the one in Deuterium, because half of the injected NBI uses Tritium as working gas and hence has a different velocity distribution because Tritium at the same acceleration voltage is slower than Deuterium. In figure 22, the neutral beam power deposition profile plus the alpha particle heating are plotted for the total power (lines), ions (dash-dotted) and electrons (long dashed) for the D NBI in the Deuterium reference in blue and the combined D and T NBI in the D-T pulse (gold). The deposition profiles have been calculated with TRANSP using the kinetic profiles, the geometry of the NBI sources used and the magnetic configuration as input. The main difference is a pronounced off-axis ion heating with the Tritium beams ( is higher for Tritium). In addition, the higher plasma density in D-T also leads to a more off-axis deposition for the Deuterium NBI. The central deposited power is lower by about 20% in the D-T pulse and an increased power deposition occurs at
  . The central electron heating is slightly higher, because of the generated alpha heating for the D-T pulse, which is important for the control of impurities. The reduced central ion heating has not much influence on the ion-temperature peaking seen in figure 21, lower right, but the transport calculations that could shed light on this are not yet available. A discussion of the general uncertainties of the absorbed NBI power using Tritium as working gas can be found in [76].
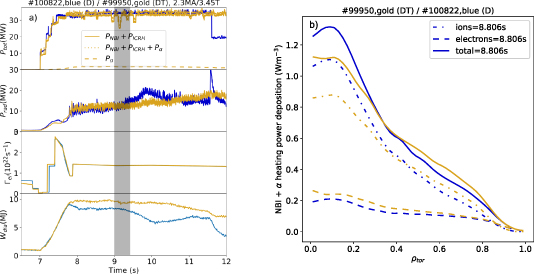
Figure 22. Engineering match Deuterium pulse (blue) for the high fusion performance D-T pulse (gold). On top the input heating power is plotted, in the second box the bulk radiated power smoothed with 10 ms, in the third box the gas request rate and in the last box the diamagnetic stored energy. The gray vertical bar denotes the time and averaging interval for the profiles shown in the previous figure. The NBI heat deposition profiles plus the generated α heating power at t = 8.8 s is plotted on the right.
Download figure:
Standard image High-resolution image4.3. Consistency with predictive modelling
The experiments have also been assisted by extensive interpretative (example in figure 22) and predictive modelling. Especially in the planning phase before DTE2, predictive modelling was utilised to generate realistic performance expectations and to define physics topics which could be addressed with the expected fusion power output [84]. The hybrid scenario as one of the two performance scenarios was looked at particularly in detail [92]. The role of higher isotope mass is expected to be stronger for the core plasma in the JET hybrid scenario domain (high confinement, high β, strong rotation, low collisionality). These expectations were based on analysis of Deuterium pulses and extrapolating to D-T. To complete and verify these results, the hybrid scenario development in D-T and the resulting experimental data were absolutely necessary. As can be seen in [84] the predictive modelling is roughly consistent with the obtained results further validation post experiments is provided in [93]. A key message from these results is that, in the absence of performance degrading MHD or impurity effects, a higher heating power would be expected to lead to a further increase in the fusion power. If this could be maintained at a constant level, a higher 5 s averaged fusion power would result. The experimental fusion power obtained is a non-linear function of input power, best fitted with a quadratic (or higher order) function, as illustrated in figure 23. In this figure only data during the power ramp-up and in the heating flattop is included. It should be noted that the low input power points are generated mostly in the power ramp-up phase, which means that the fusion powers determined for these points include the transient phase at the H-mode entry. This means that the trend in figure 23 may be slightly different to that of an input power scan in otherwise similar conditions. This trend is similar to observations in Deuterium only.
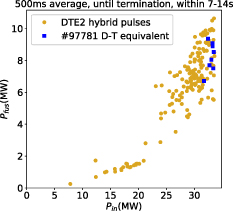
Figure 23. Obtained fusion power compared to D-T equivalent fusion power from pre-D-T reference as function of input power (ITB phase removed).
Download figure:
Standard image High-resolution image
5. Implications for ITER and future devices
The demonstration of a hybrid like regime in a 50:50 D-T mixed plasma is novel and an important step in qualifying the scenario as an operation option for future devices preparing a fusion reactor as e.g. ITER. These experiments are the first to demonstrate the scenario at higher isotope mass than Deuterium. It is not possible to create on JET a fully integrated scenario meaning a high temperature (low collisionality) plasma with high edge density and edge radiation for power exhaust as required by ITER. A fully integrated scenario will only be possible using a tokamak with much higher energy confinement, e.g. larger size. It is also expected that an SP sweeping scenario is not sufficient for power exhaust in ITER. Instead we investigated the process of a staged development using different isotopes, tested the use of predictive modelling to guide the experiment as descibed in the introduction, and provided key physics data for investigations of isotope and impurity behaviour. In line with the goal of producing a high fusion power scenario, the development concentrated on the low collisionality domain reducing the edge plasma density as much as possible to increase the edge (ion-)temperature. Most importantly it has been shown that the high Z impurity influx can be controlled by high Ti gradients in the edge which is expected to be the case for ITER [56]. This can open a high fusion performance window and may allow to decouple the fuelling needs from the need of controlling the ELM frequency which would be done by pellets in ITER. The experiments have also shown, that controlling the plasma edge in the different phases of the scenario (H-mode entry, steady phase, termination) becomes more difficult with higher isotope mass and measures have to be taken in order to avoid pulses with uncontrolled impurity accumulation. The modified density rise during the current ramp phase is another example in which the change of isotope mass can unexpectingly impact on the scenario creation. The optimum operation point in for high fusion performance D-T is different than the one found in Deuterium. Nevertheless, the use of the same tools (mainly gas injection) and the same optimisation path as in Deuterium has allowed to move from one operation point to the other, in a small fraction of the time used in Deuterium to find the optimisation point first. Also the fact that the modelling has allowed to predict the performance backs up a staged development plan, learning in Hydrogen and Deuterium and then moving to T and D-T. The modelling and extrapolation capabilities can now further progress with the additional information from the collected experimental data, increasing the confidence of our understanding of physics processes involved.
6. Summary and conclusion
In order to produce a maximum fusion power scenario, a significant development had to take place, starting from a low current, low power plasma as in [5] towards a high stored energy, high neutron rate plasma at higher IP
. The choice of plasma current was constrained by the need for alpha particle confinement, hot spots in the machine at too low IP
, and increased difficulties to control the plasma edge density and radiation with good neutron performance at higher IP
. The toroidal magnetic field has been shown to play a minor role for the performance of the plasma and has been chosen to allow a more flexible ICRH heating and to achieve a higher β-limit. The input power was chosen to be the maximum available, in order to maximise the fusion power by maximising the (ion-) temperature and also the beam-target reactions. The plasma shaping has been chosen for maximum pumping and minimising the upper triangularity in order to keep the plasma density low. The low plasma density allows the optimisation of the NBI penetration, and also helps to create a low collisionality plasma in which a high  ratio can be created. Another challenge for the scenario was the control of the divertor surface temperature. A strike-point sweeping scenario has been developed and it was shown to be sufficient. The main optimisation left to be done was connected to the injection of gas as the main actuator to control the impurity influx and transport (ICRH power was already maximised), but also controlling the performance of the scenario. Especially time consuming were the optimisation of the H-mode entry and the termination phase of the pulse. Here the dynamics, caused by the rapid change in heating power, need to be counteracted by a dynamic change in gas fuelling which increases the number of free parameters (starting time, duration, height or more complex waveforms). The finding of the edge screening of impurity influxes by the ion temperature gradient allowed the widening of the operational space and to achieve higher performance. The scenario optimisation could have proceeded further if there were no time constraints of the experimental campaigns. It is not clear whether the reached performance is the maximum possible or if further optimisation might have been possible.
Moving to higher isotope mass made it necessary to re-optimise the gas wave forms in order to compensate for higher densities and lower ELM frequencies. Again the transient phases were the most demanding, due to the number of free parameters. In Tritium it was not possible to reproduce an equivalent high performing scenario, due to the constraints Tritium operation poses onto the scenarios in JET and the limited time frame in which the experiments were executed. The Tritium pulses where either not stationary or in the high gas, high ELM frequency regime. Nevertheless global parameters, e.g. stored energy, were similar in Tritium to a high fusion performance Deuterium pulse. Comparing an engineering match (power and gas matched) a clear energy confinement increase in the Tritium plasmas was measured. In D-T the results from the Tritium campaign helped in finding the directions of the necessary development. Successfully the main characteristics of the Deuterium reference plasma have been ported to D-T and high fusion powers with a record 50:50 D-T fusion energy produced as output. The D-T plasma has hybrid scenario properties, e.g. improved confinement  and high beta
  . The initial strong ion temperature peaking in Deuterium could not be reproduced due to the necessary changes in the H-mode entry phase. Nevertheless
  MW for
  (#99912), an averaged
  MW for
  s and a
  MJ (#99950) have been produced in a 50:50 Deuterium Tritium mix. Only in T-rich plasmas with higher beam target neutron yields [91] higher fusion powers, averaged over 5 s, and energies have been reached.
The development produced a wealth of useful information for next generation devices and for benchmarking D-T fusion predictions. Key results are the experimental validation of edge impurity screening, reaching high confinement at different isotope mass, creating low collisionality references for next generation devices and providing strategies how to adapt plasmas from operation in one hydrogen isotope to operation in another isotope.
Acknowledgments
The BSC part of this work has contributed through the Spanish National R&D Project PID2019-110854RB-I00 and the CIEMAT part through grant PID2021-127727OB-I00, funded through MCIN/AEI/10.13039/501100011033 and ERDF "A way of making Europe". This scientific paper has been published as part of the international project co-financed by the Polish Ministry of Science and Higher Education within the programme called 'PMW' for 2018–2023. This work has been carried out within the framework of the EUROfusion Consortium, funded by the European Union via the Euratom Research and Training Programme (Grant Agreement No. 101052200 - EUROfusion) and from the EPSRC [Grant Number EP/W006839/1]. Views and opinions expressed are however those of the author(s) only and do not necessarily reflect those of the European Union or the European Commission. Neither the European Union nor the European Commission can be held responsible for them. Views and opinions expressed are however those of the author(s) only and do not necessarily reflect those of the ITER organization.