


Abstract
WEST is an MA class superconducting, actively cooled, full tungsten (W) tokamak, designed to operate in long pulses up to 1000 s. In support of ITER operation and DEMO conceptual activities, key missions of WEST are: (i) qualification of high heat flux plasma-facing components in integrating both technological and physics aspects in relevant heat and particle exhaust conditions, particularly for the tungsten monoblocks foreseen in ITER divertor; (ii) integrated steady-state operation at high confinement, with a focus on power exhaust issues. During the phase 1 of operation (2017–2020), a set of actively cooled ITER-grade plasma facing unit prototypes was integrated into the inertially cooled W coated startup lower divertor. Up to 8.8 MW of RF power has been coupled to the plasma and divertor heat flux of up to 6 MW m−2 were reached. Long pulse operation was started, using the upper actively cooled divertor, with a discharge of about 1 min achieved. This paper gives an overview of the results achieved in phase 1. Perspectives for phase 2, operating with the full capability of the device with the complete ITER-grade actively cooled lower divertor, are also described.
Export citation and abstract BibTeX RIS

Original content from this work may be used under the terms of the Creative Commons Attribution 4.0 licence. Any further distribution of this work must maintain attribution to the author(s) and the title of the work, journal citation and DOI.
1. Introduction
The concept of a superconducting tokamak, equipped with actively cooled metallic plasma-facing components (PFCs), is today one of the options for the development of fusion energy. Integration of both physics and technology to control steady-state plasmas in such environment is an essential step to prepare the operation of the future fusion power plant. For this purpose, WEST was built with international partners from China, Europe, India, Korea, and USA. WEST is an MA class superconducting tokamak (plasma current Ip = 0.5–1 MA, toroidal field B = 3.7 T, major radius R = 2.5 m, minor radius a = 0.5 m), equipped with two up-down symmetric divertors. The PFCs are all tungsten and actively cooled [1]. WEST is designed to operate in steady-state long pulses up to 1000 s [2] (figure 1) with high particle fluence, thanks to its continuous wave (CW) radiofrequency (RF) heating and current drive systems: ion cyclotron resonance heating (ICRH) [3, 4] and lower hybrid current drive (LHCD) [5].
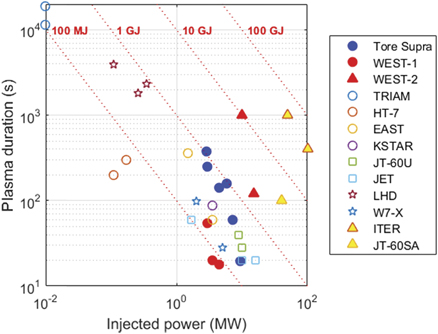
Figure 1. Plasma duration versus injected power in various long pulse devices. WEST appears for the 2 phases of the operation.
Download figure:
Standard image High-resolution imageThe key mission of WEST is to prepare ITER operation, but also to support the conceptual activities in view of DEMO. It aims at paving the way towards the ITER actively cooled tungsten divertor procurement and operation; and at mastering integrated plasma scenario over relevant plasma wall equilibrium time scale in a full tungsten environment.
Power exhaust in long and steady-state pulses can be studied in various divertor configurations: lower single null (LSN), upper single null (USN) and double null (DN). For the phase 1 of operation from 2017–2020, the lower divertor was not fully actively cooled and composed of a set of actively cooled ITER-grade plasma-facing units (PFUs) prototypes based on the W monoblock concept, complemented with inertially cooled W-coated elements while the upper divertor was already fully actively cooled but not based on ITER divertor technology. For the phase 2, from summer 2021, the lower divertor will be fully equipped with actively cooled ITER-grade PFUs. This paper reports the main findings from the exploitation in phase 1 related to the characterisation of the operational domain, the development of plasma scenario, the related plasma–wall interaction (PWI) studies and the first tests of ITER-grade PFUs in tungsten tokamak environment.
The paper is organised as follows. Section 2 describes the machine configuration and the monitoring systems for PFCs. Plasma scenario development towards long pulses is reported in section 3. Section 4 details the analyses of PWI. Section 5 is devoted to tests of ITER-grade PFU. Finally, the conclusions and the perspectives towards WEST phase 2 in the context of ITER operation preparation and DEMO conceptual design studies are given in section 6.
2. Machine description
2.1. Divertor configuration
The WEST tokamak is the result of a deep transformation of the Tore Supra tokamak [1, 6, 7]. The diverted configuration has been achieved by inserting poloidal field coils inside the circular vacuum vessel [8] and increasing the aspect ratio from 3.3 up to 5–6. The constraint to integrate ITER divertor vertical target technology at full scale led to the choice of a single quasi horizontal target (tilted at −22° with respect to the horizontal axis) that collects both strike points. To reuse the RF antennas and to access upper and double null plasma shapes, an up/down symmetric configuration with two identical divertor coils and targets in terms of geometry have been implemented (figure 2). A pumping baffle has been introduced in the outer part of the lower divertor to close the divertor leg and enhance the particle exhaust, provided by a set of turbomolecular pumps (up to 5 ports equipped with 2.2 m3 s−1 pumps in phase 1, will be extended to 10 ports in phase 2).

Figure 2. WEST pulse #55170 illustrating the up/down symmetric configuration and three divertor configurations.
Download figure:
Standard image High-resolution imageThe X-point height can be increased up to ∼15 cm, which in return pulls both strike points apart while reducing the flux expansion. This provides an efficient knob to control the heat flux for given power injection.
2.2. Tungsten plasma-facing components
The procurement of the ITER-grade divertor is one of the key elements of the WEST programme [9], which aims to gain experience in the industrial scale manufacture of tungsten PFC very similar to those foreseen for the ITER divertor vertical targets [10]. For the initial phase of operation, phase 1, which started at the end of 2016, a set of prototypes of the divertor PFUs, based on ITER actively cooled tungsten monoblock technology and provided by the potential ITER suppliers, were installed and qualified. Note that the series production (456 PFUs) has been launched at the end of 2018 after several plasma campaigns. During phase 1, the ITER-grade PFUs were complemented by inertially cooled tungsten coated graphite PFUs (physical vapour deposition (PVD) 12 μm W thickness). This 'startup' divertor limited the pulse duration (∼10 s for injected power larger than 5 MW) but well above the ITER-grade PFU thermal time constant (∼3 s) allowing for the testing of their power handling capability.
The upper divertor target, as well as the lower divertor baffle and the upper protection components (for vertical displacement event and ripple losses protections) are actively cooled PFCs using a CuCrZr heatsink covered by a thin tungsten layer (W-PVD 15 μm). The geometry of the upper divertor PFUs is similar to the geometry of the ITER-grade PFUs and they can extract up to 8 MW m−2 in steady state [11]. The inner bumpers are based on reused carbon fibre composite (CFC) tiles with a new shaping and a thin tungsten coating (W-PVD ∼ 12 μm) while the outer movable bumper is based on reused CFC tiles with a thick tungsten coating (vacuum plasma spray ∼80 μm W on top of 80 μm Mo). The five RF antenna high heat flux CFC protection limiters are also covered with the same thick tungsten coating. An overview of the different W coatings implemented in WEST is given in [12] and illustrated in figure 3.

Figure 3. Picture inside the WEST vacuum vessel showing the various tungsten armoured PFCs (April 2018).
Download figure:
Standard image High-resolution imageThe W coating of the outer movable bumper CFC tiles were damaged on significant areas by runaway electrons during the first plasma campaigns. The W coated CFC tiles of the outer movable bumper were replaced by bulk tungsten tiles in 2019 [13]. It is also planned, in phase 2, to replace the inner bumper tiles with bulk tungsten tiles and to implement new antenna protection limiters using the technology of the upper divertor (CuCrZr heatsink with thin tungsten coating). These last modifications will remove the remaining W-coated carbon-based PFCs from the vacuum vessel.
2.3. Monitoring systems for plasma facing components
Protection of plasma facing components is crucial when operating devices in long pulses with injected power at multi-megawatts levels. In WEST, the power loads on PFCs are expected to be in the range of those in ITER: from 10 to 20 MW m−2 respectively in steady-state and for transient events. Various diagnostics are installed for monitoring and inspection (figure 4). An infrared (IR) thermography system is implemented [14], enabling real-time (RT) monitoring of PFCs surface temperature to ensure safe operation while providing essential data for PWI physics studies. This IR system consists of a set of three different diagnostics: seven endoscopes located in upper ports devoted to machine protection, covering the full lower divertor and the five RF antennas; a tangential wide-angle camera covering 1/6 of the vacuum vessel, and in particular upper port protections, upper divertor targets, lower divertor baffle, and inner guard limiter; a very high-resolution view (100 μm pixel size) of the lower divertor [15]. The data produced by the IR system is visualized and analysed with the versatile ThermaVIP software (Viewing Imaging Platform) [16], and routinely used for real-time processing of PFCs temperature monitoring [17]. For about 14% of the pulses dedicated to scenario development, the IR monitoring led to a thorough reduction of the heating systems injected power, and thereby helped to protect the PFCs, while allowing the continuation of the plasma discharges.

Figure 4. Diagnostics devoted to monitoring and inspection of PFCs.
Download figure:
Standard image High-resolution imageAn example of such active RT protection using IR cameras is illustrated in figure 5. In this figure, we can see that the temperature of the PFC exceeded the safety threshold at the end of the LHCD heating phase, pre-programmed at 1.8 MW. Active LHCD power control was then triggered to keep the PFCs safe, below the critical temperature. It is worth noting that thanks to this reliable RT monitoring, no water leak occurred during phase 1 of operation. All water-cooled elements facing the plasma are also monitored by calorimetry diagnostic composed of more than 200 sensors. So far, heat flux distribution on the overall plasma vacuum vessel is analysed after plasma discharge. It will be implemented in the wall plasma monitoring system for RT control. Moreover, several specific diagnostics are dedicated to PWI and W transport studies, such as a wide array of Langmuir probes (LPs) [18], thermocouples (TCs) [19], fibre Bragg grating (FBG) [20], visible (∼240 lines of sight) [21]/VUV spectroscopy [22], a robotic articulated inspection arm (AIA) [23] (figure 4).
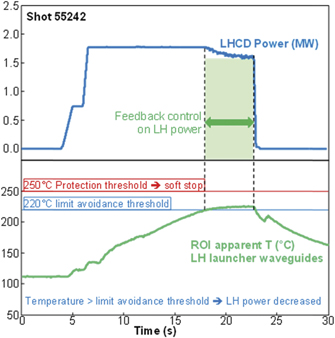
Figure 5. Active real-time control of the LHCD power, using IR system, to avoid the overheat of PFCs. The region of interest showing an apparent temperature above the first threshold ('limit avoidance threshold') in this example is the waveguides exit at the front face of the LH launcher.
Download figure:
Standard image High-resolution image3. Plasma scenario development
3.1. Initial operation with unboronized tungsten walls
In the initial commissioning phase of WEST [24], a large number of runaway electrons (REs) were produced at the early stage of the discharge and attributed to the high level of impurities that considerably narrowed the operational window in which burn-through was achievable (∼2–4 mPa). Too low prefill pressure (below ∼2 mPa) led to non-sustained breakdowns, as expected, while unexpectedly, too high prefill led to REs (above ∼4 mPa). Inadequate wall conditioning explained this behaviour, as RE discharges exhibited higher radiated fractions in the first 25 ms after breakdown. In those situations, the ohmic current fails to rise quickly enough, and the available flux change from the central solenoid is preferentially taken by REs seeds. In a superconducting device, runaways electrons can seriously damage the superconducting magnets, not only the PFCs. Indeed, in a discharge performed at 350 kA (#52205), RE appeared during plasma current ramp-up then stayed during the whole current flat-top phase. They were ultimately lost, after the plasma disruption, on the outer movable bumper, generating a cone of photoneutrons that triggered the quench of the toroidal field coil in its trajectory [25]. Analyses of this quench event and the detection system are reported in [26]. RE production during plasma breakdown, ramp-up and disruptions can be a serious threat to the reliability and availability of ITER and future fusion devices. It has to be noted that after this event, an early detection of RE discharge, based on the plasma current ramp-up rate and plasma position after breakdown, was implemented to stop the discharge below 100 kA. This method proved to be efficient as only 2% of plasma that were not caught by the protection exhibited RE.
Usual wall conditioning techniques (150 °C–200 °C baking sequences and deuterium glow discharge cleaning) as well as plasma operations were found to be inefficient to get satisfactory tungsten wall conditions. The solution was to use boronization during the second plasma campaign (He-15% B2H6 mixture used). The first boronization of the vessel walls considerably improved breakdown conditions by almost completely suppressing RE beam formation and extending prefill ranges up to ∼20 mPa. In addition, it opened the operational domain to densities well above the 1.5 × 10¹⁹ m−3 limit encountered before the first boronization. The usual reduction of intrinsic oxygen contamination was observed (figure 6) as well as the reduction of the associated strong edge radiation level but at the expense of tungsten core radiation as discussed later.

Figure 6. Oxygen radiation before and after the first, second and third boronizations performed on WEST. OVIII ray intensity is averaged during the first 0.5 s of the plasma current flattop and normalized to the line averaged density.
Download figure:
Standard image High-resolution image3.2. RF heated plasmas and W contamination
Most of WEST experiments, in which the electron heating is dominant, were performed in deuterium, LSN and USN configurations at magnetic field 3.6–3.7 T, R ∼ 2.5 m, a ∼ 0.45 m, κ ∼ 1.3, δ ∼ 0.5, plasma current in the range of 0.3–0.7 MA (q95 ∼ 3–6) and up to 1 MA, central electron density from 2.5–8.5 × 10¹⁹ m−3 (Greenwald fraction = 0.3–0.8) [27]. RF power is provided by two LHCD launchers and three ICRH load resilient antennas [4]. All the ICRH antennas and LHCD launchers are actively cooled, being able to operate in CW. They are movable radially for optimizing the power coupling and thermal loads handling. ICRH is typically used in hydrogen minority regime, resulting in dominant electron heating [2]. The LH power is injected using a fully active multi-junction launcher and a passive active multi-junction launcher. The latter is able to couple the power at long distance from the plasma [28]. So far, the LHCD and ICRH powers coupled have reached 5.3 MW and 5.7 MW respectively. The total injected power has reached a peak of 8.8 MW/0.5 s. Figure 7 illustrates a pulse with the five antennas active and a total RF power of ∼8 MW. The fraction of radiated power is generally 50%–55% in the range of parameters explored [27]. It has to be noted that the five antennas are equipped with W coated side limiters. Interestingly, the fraction of radiated power is very similar when operating LHCD or ICRH, despite ion acceleration in front of the ICRH antennas favouring W sputtering [29]. Discharges lasting more than 30 s were routinely carried out with LHCD alone using the actively cooled upper divertor and a discharge duration close to 1 min was obtained with 3 MW of LHCD (figure 9) [30].
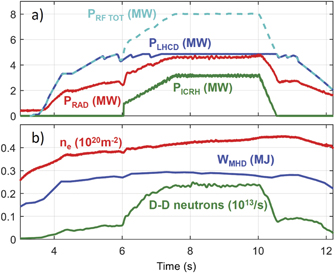
Figure 7. Time traces of pulse #55799 run at 500 kA. (a) total RF, LHCD, ICRH and radiated powers; (b) line averaged electron density, energy content from MHD equilibrium and D–D neutron rate.
Download figure:
Standard image High-resolution imageAs already observed in several experiments with metallic PFCs (e.g. FTU [31], JET [32]), achieving a reliable plasma current ramp-up can be challenging due to the risk of large core radiation, and subsequent triggering of MHD modes. In WEST, during the early plasma current ramp-up, tungsten central radiation very often cools down the plasma in the centre, resulting in a hollow electron temperature (Te) profile and the triggering of MHD 2/1 modes. In order to prevent Te profile hollowness from occurring, nitrogen (N2) injection during the current ramp-up has been employed (figure 8) [33]. N2 injection induces an increase of the plasma resistivity in the peripheral region that leads to faster current diffusion (see plasma inductance in figure 8), hence higher ohmic heating in the centre which compensates for the plasma cooling due to W core radiation. Another typical method used in several tokamaks to provide early central heating is to use electron cyclotron resonance heating (ECRH). A 3 MW/CW ECRH system is currently under preparation for WEST phase 2 of operation, and will be operational in 2023.
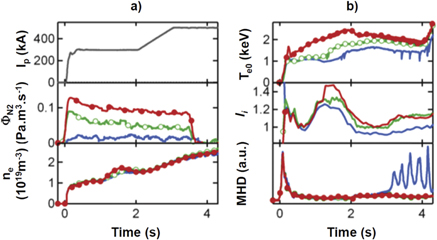
Figure 8. Example of 3 consecutive pulses, #54762 (blue), #54764 (green), #54765 (red), with increasing nitrogen seeding rate. (a) Plasma current, identical for the 3 pulses (top), nitrogen injection rate (middle) and volume-averaged plasma density (bottom); (b): central electron temperature, internal inductance and MHD level.
Download figure:
Standard image High-resolution imageTungsten is, in most cases, the major radiating species but tungsten accumulation is generally not an operational issue on WEST as illustrated for a 53 s pulse on figure 9. This experimental observation is consistent with simulations and could be explained by low torque plasmas in WEST. Indeed, transport simulations computed with GKW and NEO reported in [34], figured out that W neoclassical transport is dominant only within the very core region r/a < 0.25. Hence, despite the unfavourable peaked electron density profile, the radial profile of tungsten is predicted to be rather flat (figure 10). Note that the W peaking would significantly increase in presence of a large toroidal rotation (figure 10) that is not expected in WEST RF heated plasma. This result is promising for ITER low torque operation.
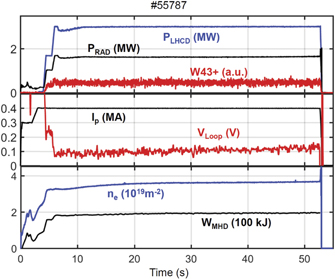
Figure 9. Discharge sustained by LHCD (#55787, 3.7 T/0.4 MA, USN configuration).
Download figure:
Standard image High-resolution image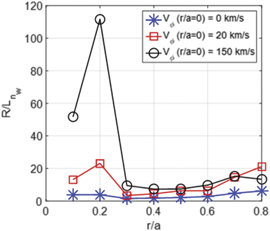
Figure 10. Normalized W density gradient length computed with GKW and NEO for different levels of central toroidal rotation velocity.
Download figure:
Standard image High-resolution image3.3. Plasma confinement at large aspect ratio
L-mode discharges in WEST exhibit an H factor around 0.8 with respect to the H-mode scaling H98,y2 as shown in figure 11 with ITPA-IOS database for metallic devices [35]. This surprizing results for L mode plasmas is due to the unfavourable aspect ratio dependence of the H98 scaling law, leading to, at A = 5–6, similar confinement time prediction using the L96 or the H98 scaling laws. The weak aspect ratio dependence of the L96 scaling law is confirmed. Adding more than 1000 WEST entries modifies the exponent to A from 0.04 in the L96 scaling to 0 if performing the regression including WEST entries [36]. Concerning H-mode scaling laws, while IPB98(y, 2) reports a degradation of the confinement with A, the gyro-Bohm and electrostatic turbulence scaling (so-called DS03) reports a benefit of working at large A [37]. The relatively narrow range of the available A parameters in the databases which are used for energy confinement time scaling laws likely explains this opposite trend. Given this uncertainty, it is worth exploring H-mode confinement in large A devices such as WEST.
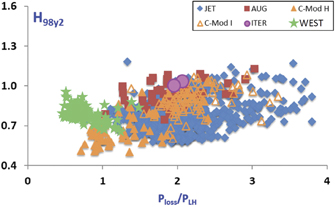
Figure 11. H factor in metallic devices from ITPA-IOS database showing WEST discharges during phase 1 of operation.
Download figure:
Standard image High-resolution imageUp to now, H-mode has been obtained in WEST only after fresh boronization when the radiated fraction is reduced down to 30% for several discharges. L–H transitions were observed when the power crossing the separatrix is between 3–3.5 MW as expected by the ITPA empirical scaling law [38]. When combining 4 MW of LHCD with 1 MW of ICRH, the E × B velocity profile exhibits a deeper well, reaching −5 km s−1 [39] (figure 12) together with a steepening of edge density measured by fast sweeping reflectometry (figure 12). It results in a significant increase of the particle confinement time; 30% increase of plasma density while the gas injection is turned off. The increment in the energy content is weaker, less than 10%, and no edge localized modes (ELMs) have been observed. Moreover, in most cases, the plasma radiation increases leading to an oscillatory regime. During phase 1 of operation, the available power and the core radiation level mainly due to W contamination has limited the plasma regimes close to the L–H threshold. Based on these results and the expected progress of heating power in phase 2, easier burn-through of W radiation should facilitate access to regular H-mode operation.
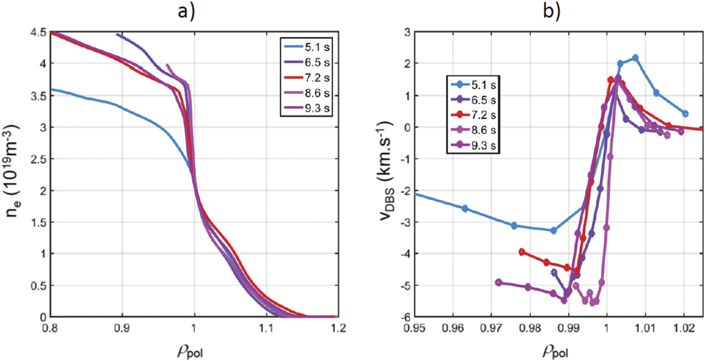
Figure 12. (a) Density profile evolution using fast sweep reflectometry; (b) associated E × B velocity profile from Doppler back scattering during WEST pulse #55564.
Download figure:
Standard image High-resolution image4. Plasma–wall interaction studies
4.1. Divertor heat load
One of the main goals of WEST is the assessment of power handling capabilities and the lifetime of tungsten divertor components under high heat flux and high fluence operation in a full W tokamak environment. During its phase 1, WEST operated with a lower divertor composed of a set of actively cooled ITER-grade tungsten PFUs and inertial tungsten coated graphite components. Characterization of this divertor has been performed notably by using IR thermography and a large set of divertor diagnostics such as TC, flush-mounted LP and FBG embedded in the W-coated graphite components (figure 13).

Figure 13. (a) Poloidal magnetic field configuration in the WEST tokamak (HFS = high field side/LFS = low field side). (b) Top view of the lower divertor instrumented with 16 TC (red points). (c) 2D poloidal cross-section of the PFC with FBGs; the numbers indicate the measurement spots location (Bragg gratings), the surface exposed to the plasma is on the top. (d) 2D poloidal cross-section of the two PFCs with 4 TCs each (TCI/TCMI/TCMO/TCO = TC inner/TC middle-inner/TC middle-outer/TC outer).
Download figure:
Standard image High-resolution imageHeat flux deposition on the W-coated graphite components of the lower divertor has been studied in detail in [40, 41] using the whole set of measurements. The study includes a large database of L-mode plasmas heated by LHCD and/or ICRH, up to 8 MW total injected power during 4 s and up to 90 MJ total injected energy in LSN configuration. An asymmetry between the outer and inner heat flux is reported: 3/4 1/4 distribution for the parallel heat load, as expected with the drift flows in forward magnetic field [42]. Deposited heat flux on the lower divertor has reached 6 MW m−2 at the outer strike point (OSP), as shown in figure 14(a). As expected, the heat flux decay length at the target (λq target) varies almost linearly with the magnetic compression of the field lines, from 60 mm for low compression (low X-point height ∼ 50 mm) down to 10 mm for high compression (high X-point height ∼ 120 mm) (figure 14(b)). The maximal deposited heat flux observed so far, about 6 MW m−2, has been obtained in L-mode with 4 MW of LH power, a radiated fraction of 45% and an X-point height of 120 mm. In this configuration, a heat flux of 10 MW m−2 could be achieved with about 7 MW of additional power and 50% of power radiated. Hence, extrapolation from achieved results indicate that WEST will provide heat flux in the range of 10–20 MW m−2 when it operates, even in L-mode, at the full heating capability of 15 MW thanks to the flexibility allowed by the X-point height variation.
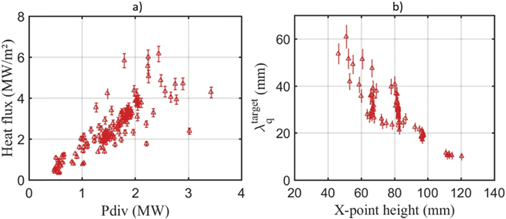
Figure 14. (a) OSP heat flux versus power received by the divertor with total injected power up to 6 MW (Pdiv = Ptot − Prad); (b) heat flux decay length at the target, λq target, versus X-point height from TC measurements (at Ip = 0.5 MA).
Download figure:
Standard image High-resolution imageAnalyse of IR exhibits a complex spatial distribution of the heat flux, due to the ripple of the toroidal magnetic field (figure 15(a)) and a complex emissivity pattern in the 3.9 μm wavelength range (detection range of the IR monitoring system) on the divertor target, which is correlated with erosion/redeposition pattern (figure 15(b)). It is worth noting that the emissivity in the OSP region (erosion-dominated area) remains in the range of 0.12, very close to the value measured on pristine W-coated graphite PFU emissivity in laboratory. In addition, the emissivity map evolves significantly over the campaign adding significant complexity to the real-time protection system of the divertor.
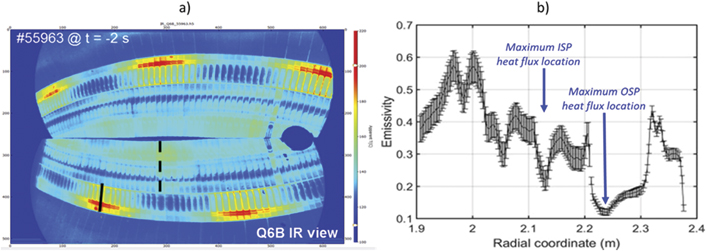
Figure 15. (a) IR image showing two 30° sectors of the lower divertor (optically recombined on one camera); (b) estimated emissivity along the W-coated tiles in the poloidal direction; usual locations of the inner strike point (ISP) and outer strike point (OSP) are indicated.
Download figure:
Standard image High-resolution imageA procedure, described in [43], was implemented to estimate, for a given pulse, a given infra-red endoscope and a given tile equipped with TCs, profiles of emissivity and background reflections. This procedure takes advantage of the divertor temperature increase during the plasma operation due to the inertial behaviour of the tungsten coated PFUs and use photonic calculation to disentangle the emitted and reflected parts in the measured radiance. Using this procedure on IR data before implementing thermal inversion, one can compute the heat flux profile along the tile. Both FBG and IR gives an estimate of the heat channel width at the target that can be remapped to the midplane, λq OMP, by normalization with the magnetic flux expansion. While the maximum heat flux given by all diagnostics are within 20%, estimates of the heat channel width with IR are systematically lower than estimates with the other diagnostics (FBG, TC and LP): λq OMP of about 2.8 mm is found with the IR method while 7.2 mm is obtained with the FBG method. For comparison, the L-mode scaling laws for this case predicts λq OMP = 2.9–3.7 mm. These discrepancies are not yet understood and further dedicated experiments are planned.
4.2. Divertor modelling test bed
Plasma edge simulations using the SOLEDGE2D-Eirene code package have been performed and divertor in/out asymmetries are well reproduced [44, 45]. Simulations were performed for a series of discharges at Ip = 0.5 MA, with 4 MW of injected power, 2.3 MW of total radiated power, 4 × 10¹⁹ m−2 of central line integrated density and a height of the X point of about 115 mm from the wall. As shown in figure 16, SOLEDGE results are in good agreement with the density and temperature profiles measured by LPs embedded in the divertor. Total radiated power of 780 kW is in quantitative agreement with the bolometry measurements in the divertor region. Simulations also show a strong asymmetry between oxygen concentrations at the inner divertor target with respect to the outer one. This asymmetry is observed by the VUV spectroscopy system using a moving line of sight in the poloidal plane, allowing one to retrieve the information on the angular position of the oxygen light emission (figure 17). The force balance analysis shows that friction dominates over thermal gradient forces at the inner target, while, at the outer target, the repelling thermal gradient forces dominate.

Figure 16. (a) Profiles of electron density and (b) electron temperature at the lower divertor target for the WEST #54067. In blue solid line SOLEDGE2D simulation, in black symbols the LP measurements. (c) Radiation map from SOLEDGE2D simulation. The total radiated power is 780 kW in quantitative agreement with the bolometry measurements in the outer region.
Download figure:
Standard image High-resolution image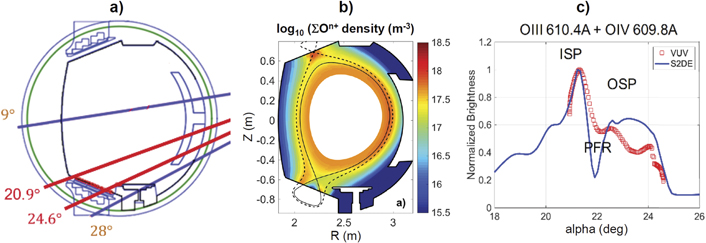
Figure 17. (a) VUV system in scanning mode. (b) 2D poloidal map of oxygen density from SOLEDGE2D simulation. (c) Comparison of 'poloidal' profiles of oxygen in lower divertor (not absolutely calibrated). Experimental data from VUV system are reported with red symbols while the solid blue line represents results from SOLEDGE simulation.
Download figure:
Standard image High-resolution image4.3. Characterization of tungsten erosion and migration
Concerning post mortem analysis, erosion marker tiles, featuring a thin W/Mo layer added on top of the W coating, were analysed after exposure in WEST C3 campaign. It was found that both the inner strike point (ISP) and the outer strike point (OSP) are net erosion areas, with more pronounced erosion at the OSP. The transition between strong erosion and thick deposition area is very sharp as shown in figure 18. The C3 campaign averaged net erosion rate is roughly ∼0.1 nm s−1, in the same range that what was found in AUG [46]. Thick deposited layers (>10 μm) were found near the ISP.
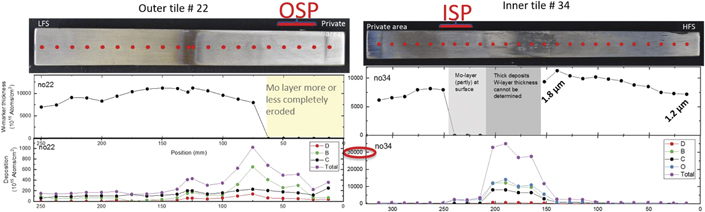
Figure 18. Post-mortem analysis of erosion marker tiles (W-coated PFU), outer tile on the left and inner tile on the right, showing the W-marker thickness on the top and the light impurity deposition on the bottom (scale is ×30 on the inner tile).
Download figure:
Standard image High-resolution image4.4. Helium campaign
ITER will operate with a tungsten divertor, a material featuring surface morphology changes when exposed to helium plasmas, in particular the formation of the so-called tungsten fuzz under specific conditions. Investigating interactions between tungsten PFCs and helium plasmas in a tokamak environment is therefore a key point to consolidate predictions for the ITER divertor performance and lifetime. To this end, dedicated He experiments were performed in WEST at the end of the first phase of operation (#55813 → #55987) [47], before dismantling the lower divertor components for post mortem analysis. The experiment was designed to reach the conditions for W fuzz formation in the area, namely: incident particle energy Einc > 20 eV, He fluence >1024 m−2, surface temperature >700 °C [48]. A robust long pulse scenario was developed in He L mode plasma with plasma current Ip = 300 kA, LHCD power = 4 MW, average density 4 × 10¹⁹ m−3. Plasma duration was adjusted to ∼30 s to reach a surface temperature above the threshold for W fuzz formation over a significant area around the OSP on the inertially cooled PFUs. Repetitive He long pulses (in the range 20–30 s) were carried out, cumulating ∼2000 s of plasma exposure and 4.4 GJ of energy injected into the plasma over 1 week of operation.
Local divertor plasma conditions were recorded with LPs (figure 19), while the divertor surface temperature was monitored by embedded TC/FBG and IR cameras. It is shown that the three criteria mentioned above for W fuzz formation were met in the OSP area. Indeed, typical electron temperatures measured by the LPs were Te ∼ 20 eV at the OSP as shown in figure 19, which corresponds to an incident He energy Einc > 100 eV. The temperature threshold for W fuzz formation is typically reached after 20 s at the OSP. The total He fluence reached at the OSP is assessed from cumulated LP measurements to be ∼2 × 1025 He/m2 (figure 19). Combining IR and LP measurements, it is shown that even in the worst-case scenario (highest emissivity assumption), the threshold for W fuzz formation in terms of He fluence (∼1024 m−2)/surface temperature is reached in an area of ∼1 cm around the OSP.

Figure 19. (a) He incident particle flux and (b) electron temperature profile, both estimated with LPs as a function of monoblock number along the divertor target for a typical He pulse (#55953); (c) He fluence cumulated over the He campaign. The location of the inner and the OSPs inferred from magnetic reconstruction are shown with left and right dotted lines, respectively.
Download figure:
Standard image High-resolution imageIn-vessel inspections using the AIA were performed before and after the He campaign. It did not reveal any macroscopic signs of W surface modification in the OSP area of W-coated PFU, such as blackening of the surface reported when W fuzz is formed. More detailed post mortem analysis are underway and should give further insights, in particular on the presence of He nanobubbles on the near-surface. It underlines however that in tokamak conditions, the complex balance between erosion/redeposition and W fuzz formation needs to be taken into account. The data obtained will be used to consolidate the experimental database supporting the modelling effort for predicting W fuzz formation and growth in ITER.
5. Test of ITER-grade plasma-facing unit
5.1. Plasma-facing unit configuration and plasma exposure
During phase 1, the WEST lower divertor was composed of a mix of ITER-grade PFU and inertially cooled, W-coated graphite PFUs. One of the 12 lower divertor sectors was progressively equipped with up to 14 actively cooled ITER-grade PFUs [49], each of which has 35 monoblocks (MB) of 12 mm poloidal width separated by 0.5 mm toroidal gaps (figure 20).
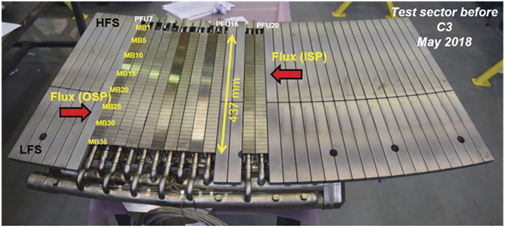
Figure 20. Photograph of the WEST lower divertor sector equipped with 12 ITER-like PFUs for the C3 campaign (2018). The poloidal length of the ITER-like PFUs (437 mm) is indicated. The remaining PFUs are made of graphite with a 12 μm coating of W. The direction of the parallel heat flux is indicated at the inner and outer strike points (ISP and OSP).
Download figure:
Standard image High-resolution imageThe ITER-grade PFUs were monitored by the very-high resolution IR camera (short wavelength IR band: 1.6–2.1 μm, minimum temperature threshold ∼370 °C, 0.1 mm/pixel). They were not bevelled, some of them had 1 mm chamfers. While most of the PFUs were aligned within the ITER requirements (at most ±0.3 mm perpendicular steps between neighbouring PFUs), three of them were not: at the OSP PFU#7, PFU#12, and PFU#19 were measured to protrude respectively +0.31 mm, +0.79 mm, and +0.63 mm above their neighbours (figure 21). These misalignments were not corrected on purpose to study their behaviour. During the C3 experimental campaign, a total of 2.5 h plasma exposure was cumulated over 1076 discharges at Ip up to 0.8 MA lasting up to 37.5 s, corresponding to a total injected energy of 5 GJ. Auxiliary heating was mostly provided by lower hybrid antennas, coupling a maximum of 5.3 MW to the plasma. The maximum steady-state surface heat load was qpk ∼ 2.5 MW m−2 corresponding to parallel heat flux of q// ∼ 50 MW m−2 for a typical B-field incidence angle of ∼3° at the OSP. There was a significant number of disruptions (730) and many discharges had strong MHD activity, both of which can deliver intense transient heat pulses to PFCs having durations of the order of a few ms.

Figure 21. Representation of the metrology study before C3 illustrating misalignments of the PFUs to their nominal positions (dashed lines). Beveled graphite PFUs are shown in blue, chamfered W PFUs in red, and W PFUs with sharp edges in black. The ISP profile is centred on MB#17 (upper panel), and the OSP on MB#25 (lower panel). Note that the vertical scale is greatly exaggerated in order to clearly show the misalignments.
Download figure:
Standard image High-resolution image5.2. First evidence of damages
No failure occurred on the PFUs during phase 1 but microscopic observations carried out after the C3 campaign revealed a variety of damage on the PFUs including cracking, optical hot spots, melting formation (figure 22). The main results are reported in [50, 51]. It has to be noted that the thermal response of misaligned leading edges of ITER-grade PFUs, analysed with 3D finite elements modelling and IR imaging, is in agreement with the optical approximation of the parallel heat flux [52]. The damages were more severe for PFUs installed with a significant relative misalignment, for which poloidal leading edges were irradiated at near perpendicular incidence by the heat flux (measured misalignment up to 0.8 mm, to be compared with ITER specifications of 0.3 mm). The damage is observed on the full poloidal extent of the divertor, even on zones that normally should receive little or no heat flux in steady state.
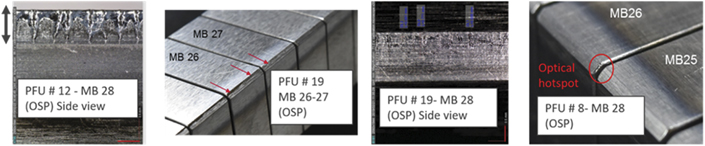
Figure 22. Example of damages observed on the ITER-grade PFUs; from left to right, damage on a misaligned sharp PFU#12, on misaligned chamfered PFU#19 and on aligned chamfered PFU#8.
Download figure:
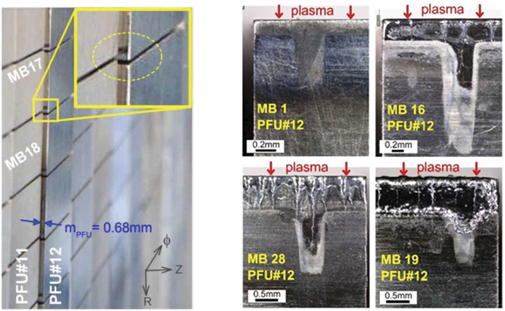
Standard image High-resolution imageIn particular, clear evidence of optical hot spots was observed for the first time (figure 23) [53], as predicted to occur in ITER in [54]. Indeed, IR images obtained during a disruption clearly showed local heat flux deposition on isolated points of the leading edges of PFUs, as the result of penetration of charged particles into the toroidal gaps. The formation of these so-called optical hot spots was found on both chamfered and non-chamfered PFUs, as well as for PFUs misaligned and aligned. It is worth noting that these hot spots appeared in the absence of H-mode, and therefore without ELM PWI, and also at medium input power.
Figure 23. Evidence of optical hot spot observed on the leading edge of MB of unchamfered PFU#12. The location of the optical hot spot and the melted band are consistent with the radial and vertical misalignments of the PFU (mPFU).
Download figure:
Standard image High-resolution image
The propagation of these kind of damages and their influence on plasma operation will be carefully studied during the second phase of operation.
6. Conclusions and perspectives
WEST has completed its first phase of operation which corresponds to the first stage towards the implementation of a full ITER-grade divertor. During this phase, characterized by tungsten walls, a wide range of plasma configurations have been produced, from LSN to USN and stable plasma conditions have been achieved up to 1 MA. The initial boronization played a critical role in the opening of the operational domain towards higher density and lower edge radiation but at the expense of core W radiation. RF heating with LHCD and/or ICRH, have progressed with up to 8.8 MW coupled to the plasma during several seconds while the radiated power fraction was found to remain around 50%–55% in most of the discharges, whatever the heating mix. On the actively cooled upper W divertor, long pulses lasting up to 55 s have been routinely achieved, with no W accumulation despite peaked electron density profiles. After fresh boronization, and low core radiation, H-mode transition were observed close to the expected L–H threshold but accompanied by an increase of core radiation and an oscillatory behaviour. In the next phase of operation, higher input power will allow for exploring H-mode and I-mode operational windows respectively in LSN and USN.
Concerning power handling at the divertor, asymmetries were observed with a higher impurity concentration and therefore tungsten source at the ISP while about ¾ of the parallel heat load was found at the OSP. These observations are fairly well reproduced by SOLEDGE simulations. Scenarios with detached ISP offers promising developments. The heat flux level and pattern on the lower and upper divertors have been characterized thanks to embedded thermal measurements, IR and flush-mounted LPs. The maximum heat flux currently reported is around 6 MW m−2 for 4 MW of LHCD and smallest flux expansion at the target (far X-point configuration) in L mode. This gives confidence to reach ITER expected divertor heat flux level in the next phase.
A set of actively cooled ITER-grade PFUs prototypes have been exposed to tokamak plasmas for the first time. No failure occurred so far but cracking and local melting have been observed for misaligned PFUs. In addition, optical hot spots, which have been predicted to occur in ITER at the projection of the toroidal gaps on the subsequent PFU, have been observed experimentally, even for PFU aligned within ITER specifications.
WEST has completed its commissioning in L-mode and is now ready for the operation and exploitation of the full capabilities of the device for the next phase. This second phase of operation, with the full lower actively cooled divertor, is planned to start in summer 2021 to address long pulse/high fluence operation on the newly manufactured ITER-grade actively cooled divertor, up to 10 MW/1000 s.
The assessment of ITER PFC performance and lifetime as well as innovative PFC under relevant power fluxes and particle fluence are the central thrust of the phase 2 programme. Other issues including operation at high radiated fraction in compact divertor geometry, demonstration of detachment control over long pulse, exhaust physics at large aspect ratio and operation in double null are key topics which will be also tackled in the perspective of a fusion power plant.
Acknowledgments
This work has been carried out within the framework of the EUROfusion Consortium and the French Research Federation for Fusion Studies and has received funding from the Euratom Research and Training Programme 2014–2018 and 2019–2020 under Grant Agreement No. 633053. The views and opinions expressed herein do not necessarily reflect those of the European Commission.