


Abstract
The ability to detect and control fuel isotopic content down to a 1% concentration level is greatly important for the upcoming JET DTE2 campaign, as well as its associated TT and DD phases. A reduction of H minority concentration even from 2% down to 1% is shown here to have significant impact on the effectiveness of ion cyclotron range of frequencies core heating, while the ability to maintain T or D concentration at or below 1% is critical to limiting fusion neutron generation in the DD and TT phases, correspondingly. The sub-divertor measurement of (global) isotopic concentration, based on Penning-activated optical spectroscopy, can deliver minimally this 1% detection for DTE2 as long as light collection from the Penning emission can be optimized and gradual window transmission deterioration can be minimized. This is simulated with a statistical analysis developed to understand the uncertainty sources in the JET DTE1 data, as well as to guide the optimization of an upgraded, fuel-isotopic content (and helium-ash concentration) gas analysis system for the JET divertor in preparation for DTE2. While this random error can be reduced to allow measurement substantially below 1% concentration, analysis also shows a systematic error of up to 1% understood to be due to plasma–surface interactions in the Penning excitation, suggesting that 1% may still be the low-end limit for the sub-divertor measurement, unless a Penning-source conditioning approach is also developed.
Export citation and abstract BibTeX RIS
1. Introduction
The upcoming JET deuterium–tritium (D–T) campaign known as DTE2 (D–T Experiment 2) will constitute the second such nuclear phase of JET, with DTE1 having occurred nearly two decades earlier [1, 2]. Unlike DTE1, which took place in a carbon wall environment, DTE2 will take place in the present ITER-like wall (ILW) environment. This change has also required the upgrade of some of JET's key diagnostics, such as charge-exchange spectroscopy (CXS) whose upgrade improves core plasma ion temperature measurement in absence of significant C impurity content in the plasma [3]. Along these lines, and to assure readiness to provide measurement important to fusion fuel cycle for DTE2, a study was performed to determine the detection limit for fuel isotopes in the sub-divertor region. It focused particularly in the measurement provided by Penning optical spectroscopy, also known as optical gas analysis (OGA). In the present study, the DTE1 OGA data [4] were revisited with focus on the uncertainty of the measurement on the low concentration end.
In parallel with this, the significance of getting measurement resolution down to the 1% level (or below) to a successful DTE2, as well as to the TT phase of the upcoming JET campaign, which will precede DTE2 and the DD campaign which will follow, has also been explored. A review of the impact that changes in isotopic minority concentration around the 1% concentration level can have on the effectiveness of ion cyclotron resonance heating in increasing the ion energy content is examined, based on pulses and related literature from earlier JET campaigns, and is used to motivate the need for a robust measurement at these low concentration levels for DTE2.
The upgraded sub-divertor gas analysis system for JET-DTE2 has many of the same features as for the corresponding system being designed for the ITER divertor, including the Penning-OGA measurement, whose recently improved detection limits for trace He (down to 0.1%) in a mostly D2 divertor effluent will benefit both JET-DTE2 and ITER [5]. Thus, a demonstration, in an ILW environment, of getting also the fuel isotopic measurement down to the lowest achievable levels, but also the significance of achieving particularly low (<~1%) detection minima on DT plasma performance, are both of great importance to the design of measurement capability for ITER, in particular for its nuclear phase, where the measurement is most challenging.
In the present paper, the significance of low (≪10%) fuel isotope concentration detectability for a successful DTE2 is initially motivated in section 2.1, where JET-ILW pulses with H-minority ion cyclotron range of frequencies (ICRF) heating and with H concentrations at and below 2% are examined with focus on the impact on electron/ion heating and tungsten (W) core concentration. The significance of such low detection levels (even perhaps lower than for ICRH core plasma heating) for the JET DTE2 campaign is further highlighted in section 2.2, by a brief discussion of its impact on DTE2-related neutron budgets.
Section 3 then begins the discussion of fuel isotope detectability in the subdivertor, and is specifically devoted to the reexamination of measured isotopic ratios from past JET campaigns, including the tritium concentration data from DTE1 (in section 3.1) and a large set of more recent data from ICRH discharges (in section 3.2) with main focus on the error bars and their trend at or near the ~1%-concentration level.
In section 4, the focus shifts to the improvements under way in the measurement approach in preparation for DTE2. This section also includes the description and deployment of a newly developed simulation tool, which can simulate the spectral profile of the Balmer-α spectral lines, with two or more isotopic components, including the propagation of error to estimate the uncertainty of the measurement. The tool is intended to guide the optimization of the measurement for DTE2, particularly for cases including presence of both D and T, where spectral resolution and spectral line fitting can play a more significant role in the propagation of the errors, as compared to the concentration of H in either D or T, where the H component is spectrally well enough separated.
In section 5, the connection between sub-divertor and main plasma isotopic composition is briefly discussed, and an overall summary is provided in section 6.
2. Significance of 1%-level fuel isotope selectability for DTE2
2.1. Impact on core plasma heating with ICRH
The importance of resolving isotopic concentrations at the ~1% level during plasmas with ICRH can be seen in figure 1. When the hydrogen concentration is reduced from 2.5% to below 1% (here based on divertor spectroscopy) in high NBI power H-mode discharges, second harmonic deuterium ICRF power absorption becomes dominant over the fundamental hydrogen minority one [6, 7]. In such conditions, deuterium ions (both from the thermal background and in particular from the injected NBI sub-population) are accelerated to high energies, as seen by the neutral particle analyser (NPA) measurements for deuterium at E = 300 keV. These fast D+ ions not only lead to a considerable enhancement of the neutron yield with respect to the standard H minority case with similar Ti (not shown) but, in combination with the fast H+ ions (that are also accelerated to significant energies due to their small fraction) cause full stabilization of the sawtooth activity during the high ion cyclotron resonance heating (ICRH) power phase in the given example (JET pulse 89192). Note that the total radiation is similar in the two cases showing that equivalent high-Z impurity screening is achieved in both discharges.

Figure 1. Two similar discharges with H/D < ~1% (red lines) and H/D = ~2.5% (blue lines) from divertor spectroscopy: JET pulses 89192–93, correspondingly.
Download figure:
Standard image High-resolution imageIn related studies, a series of similar H-mode discharges in JET-ILW with varying H injection, varying the H/(H + D) ratio from 23% down to 2%, exhibited a correspondingly continuous increase in the core Te, confirming that electron heating (after collisional redistribution) is maximized for low H minority concentrations (~2%). Since electron heating with ICRH has proven beneficial for high-Z impurity control in JET-ILW, the core W content (as measured by soft x-ray) is also reduced at the lowest hydrogen levels [7, 8].
The above examples would imply that the ability to measure, and ultimately control, the fuel isotopic content down to the 1% concentration level is important for optimizing the performance of a given ICRH scheme in fusion devices. This is particularly important when using 3He minority heating or for inverted ICRH heating scenarios, where a small overshoot of the minority concentration can have a strong impact on the wave absorptivity and on the fate of the RF power absorbed in the plasma [9]. Similarly, the so-called H–(3He)–D three-ion scheme needs fine control of the minority 3He ions' concentration at very low levels (<1%) to be efficient [10].
From a DT diagnostic standpoint capability, this case is also of interest regarding the present upgrade of the JET sub-divertor gas analysis diagnostic (to be briefly described in section 4). In addition to improvements in the fuel isotopic content measurement, the upgrade will also provide for potential He detection down to a 0.5% level, thanks to using spectrally resolved measurement for the He I emission, previously done with a filtered detector approach [11]. This detection limit for He is compatible with estimates of anticipated 4He concentration from DT-produced alpha particles.
2.2. Impact on neutron budget for pre- and post-DTE2 operation
The ability to have a fusion fuel isotopic content detection limit at or even below the 1%-conc level is also of great importance to the envisioned pre-DTE2 (TT) and post-DTE2 (DD) campaigns, in limiting the D/(D+T) content for the former, the T/(D + T) in the latter, thus effectively minimizing fusion neutron production for these phases [12]. JET has contractual limits on the vessel activation due to the total 14 MeV neutron fluence over the lifetime of JET (2 × 10²¹ 14 MeV neutrons, of which 0.3 × 10²¹ have been used in DTE1). The 14 MeV neutron production is measured for each pulse and the vessel activation is computed for the vessel composition. The in-vessel activation levels are measured during shutdowns. Thus, each campaign at JET has a 14 MeV budget, staying inside the total 14 MeV limit for the lifetime of JET. In this scheme, pre-campaign estimates are based on having (worst case) 1% D/(D+T) for TT campaigns, providing an estimate for the number of high power pulses that can be done during the campaign. For DT campaigns, the pre-campaign estimates use 50:50 DT concentrations for neutron estimates. Thus, the significance of the low end, fuel isotope detectability is most relevant in the TT and DD campaigns and, in fact, this is an area where a lower detection limit than 1% could be of value.
3. Isotopic content measurement uncertainty and limits based on the existing JET database
3.1. Tritium concentration measurements in DTE1 and associated low end detection uncertainty
In the present study, the DTE1 OGA data [4] were revisited with focus on the uncertainty of the measurement on the low concentration end. The data plotted in figure 2 are the same OGA data plotted, e.g. in figure 5 of [4], however with the error bars now added and displayed with the data. The latter are from the error analysis carried out as part of the original fitting of the spectral profiles, which produced the isotopic concentration data for [4] and has since continued to automatically process data for this diagnostic.
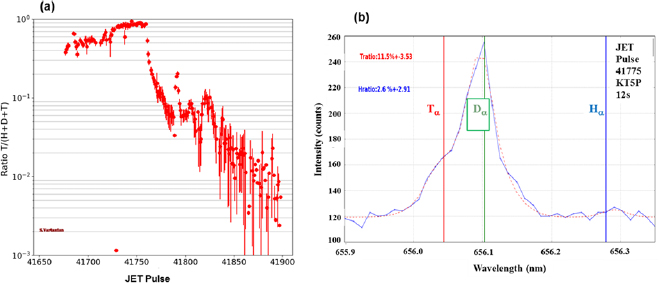
Figure 2. (a) Isotopic concentration T/(H+D+T) versus pulse number for the same DTE1 pulses as plotted in [4] but now with the error bars added. (b) Actual Penning optical spectrum from the DTE1 published set, here for ~11% T and ~2.6% H concentrations. The red, green and blue vertical lines mark the central wavelengths of the T, D and H components of the Balmer-alpha line. (The concentrations given in the graph headings are the fit values and their computed error from the store processed data files.)
Download figure:
Standard image High-resolution imageIn the automatic analysis, the error bar on the isotopic ratio is derived from the error bars on fit parameters corresponding to the H and D spectral intensities, which are taken to be the square root of the diagonal elements of the covariance matrix, as is standard for χ2 fitting. The signal on individual pixels is weighted by the inverse of the square root of the signal. It can be seen in the present figure that as the 1% T/(H+D+T) tritium concentration level is approached, the uncertainty in the measured concentration approaches 100% of the measurement value (figure 2). This suggests a 1% lower limit to the isotopic content measurement with this technique, assuming that the error bar calculated with this method corresponds to an interval of confidence large enough for the measurement to be reliable (see discussion in section 4.2).
Insight to the causes of the substantial relative uncertainty in the low concentration data can be most simply gained by observation of an actual, optical spectrum from this set of data. Figure 1(b) shows Penning-excited optical spectrum from the DTE1 published set, in this case for ~11.5% T and ~2.6% H concentrations, to illustrate the challenge of extracting the low concentration of these isotopes in a deuterium background. Firstly, it is noted that the overall intensity level (in number of CCD detector counts) is quite small. The Dα peak minus the continuum is barely above 100 counts. The saturation limit of the CCD detector was 32 000 counts. Thus, the full dynamic range was far from being utilized. It has been found relatively recently that the inherent property of Penning- (and the related magnetron-) type discharges to produce thin film coatings greatly contributed to low spectral line intensity levels. The Penning plasma discharge, which is in itself a relatively low emission source, can contribute to a progressive reduction in the signal by depositing carbon-based coatings onto the viewport window, through which its plasma light emission is collected. That, in turn, reduces light transmission through the window and therefore the amount of light that can be collected for spectroscopic analysis. This degradation of the S/N then directly impacts the detection limit, as will be seen.
Furthermore, this reduced light level can affect the detection limit of the tritium detection in a more complex way that the hydrogen detection. With state-of-the-art, passive optical spectroscopy used for DTE1, one can see in figure 2(b) that the H minority species is spectrally well separated from D. As such, it seems to be affected primarily by the relatively low spectral line signal over the random noise. On the other hand, the close spacing of the D and T components means that the low S/N can also compound the error of the non-linear fitting, which is necessary to distinguish the T from the D component (as also seen in figure 2(b)).
It is worth noting that a similar (~1%) isotopic detection limit was concluded in a recent, laboratory-based study, using H as a proxy for T in H/D mixtures, for an equivalent sub-divertor gas analysis system designed and prototyped for ITER [5]. The system included the same plasma excitation source as was used in DTE1 and until presently (i.e. the now obsolete, commercial, Alcatel CF2P Penning cold-cathode gauge) albeit with a different differential pumping arrangement with respect to the main analysis region. The fact this limit persisted, even though much better S/N levels could be obtained in the laboratory study with large integration times (>~1 s) suggested that additional mechanisms might also be playing a role in preventing H detection below the 1% concentration level. More indications of this will be seen in the next section, examining a more recent JET dataset with low concentrations of H in mainly D plasmas.
It is finally noted that the mentioned, historically used, automatic fitting program basically fits the spectral profile of each isotope Balmer-α line (i.e. Hα 6562.79 Å, Dα 6561.03 Å, and Tα 6560.44 Å) to an empirical model using two (nominally co-centric) Gaussian profiles [13]. Although the model has been interpreted as corresponding to the emission from both ('cold') atomic species and from ('hot') molecular dissociation species, no actual atomic or molecular physics is involved in the fitting of the lines. An ongoing effort, in parallel to the present study, is attempting to further improve spectral fitting by introducing atomic and molecular physics into the fitting program [14].
3.2. Hydrogen concentration measurements after DTE1 and ahead of DTE2 capability upgrade.
The present study also examined measurement uncertainty in a large set of data from more recent experimental campaigns, particularly focusing on comparison of the OGA data to those from divertor spectroscopy, i.e. measurement directly in the divertor plasma (with the local plasma providing in this case the excitation source for the emission). This dataset was taken from a database specific to ICRH physics studies. The database contains 1254 measurements with a hydrogen concentration varying from 0.75% to 14.75%. Each one is averaged over 1 second (or four spectral scans of 0.250 s integration time) and taken during the quasi-steady state in each discharge (both in terms of the isotopic composition and the plasma parameters, including the ICRH heating power).
In figure 3, ![${{\left[{\rm H} \right]}_{{\rm Spec}}}$](https://content.cld.iop.org/journals/0029-5515/60/1/016021/revision2/nfab4c5aieqn001.gif) is the hydrogen concentration
is the hydrogen concentration ![$\frac{\left[{\rm H} \right]}{\left[{\rm H} \right]+\left[{\rm D} \right]+\left[{\rm T} \right]}$](https://content.cld.iop.org/journals/0029-5515/60/1/016021/revision2/nfab4c5aieqn002.gif) as measured by divertor spectroscopy and
as measured by divertor spectroscopy and ![${{\left[{\rm H} \right]}_{{\rm OGA}}}$](https://content.cld.iop.org/journals/0029-5515/60/1/016021/revision2/nfab4c5aieqn003.gif) is the same quantity as measured by the Penning-OGA. The figure shows the relative difference between the two measurements of the hydrogen concentration:
is the same quantity as measured by the Penning-OGA. The figure shows the relative difference between the two measurements of the hydrogen concentration: ![$\frac{\delta \left[{\rm H} \right]}{\left[{\rm H} \right]}=\frac{{{\left[{\rm H} \right]}_{{\rm OGA}}}-{{\left[{\rm H} \right]}_{{\rm Spec}}}}{{{\left[{\rm H} \right]}_{{\rm OGA}}}}$](https://content.cld.iop.org/journals/0029-5515/60/1/016021/revision2/nfab4c5aieqn004.gif) , as a function of
, as a function of ![${{\left[{\rm H} \right]}_{{\rm OGA}}}$](https://content.cld.iop.org/journals/0029-5515/60/1/016021/revision2/nfab4c5aieqn005.gif) , for low hydrogen concentrations (<15%). The full set of data from both diagnostics, plotted together with the error bars, as found in the processed data files, can be found in [15].
, for low hydrogen concentrations (<15%). The full set of data from both diagnostics, plotted together with the error bars, as found in the processed data files, can be found in [15].
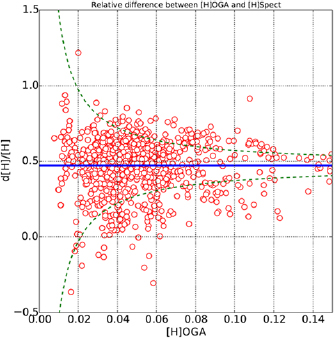
Figure 3. Isotopic concentration relative difference between subdivertor Penning OGA and divertor spectroscopy plotted versus the OGA measurements.
Download figure:
Standard image High-resolution imageFigure 4 shows, over the same data set and again in relative values, the uncertainty in the hydrogen concentration measurement specifically by the Penning-OGA: ![$\frac{\varepsilon \left[{\rm H} \right]}{\left[{\rm H} \right]}$](https://content.cld.iop.org/journals/0029-5515/60/1/016021/revision2/nfab4c5aieqn006.gif) . As with figure 2, the uncertainty is taken directly from the error bars produced by the standard JET automatic fitting program, which computes the isotopic ratios from the spectral profiles, and are stored in the JET processed data files.
. As with figure 2, the uncertainty is taken directly from the error bars produced by the standard JET automatic fitting program, which computes the isotopic ratios from the spectral profiles, and are stored in the JET processed data files.
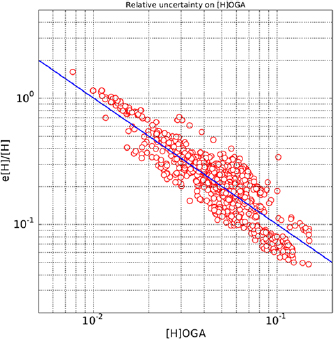
Figure 4. Relative error in the OGA measurement for the ICRH data set as a function of the hydrogen concentration for values <15% (i.e. [H] <0.15) for the latter.
Download figure:
Standard image High-resolution imageIt is observed that ![$\frac{\varepsilon \left[{\rm H} \right]}{\left[{\rm H} \right]}\propto \frac{1}{\left[{\rm H} \right]}$](https://content.cld.iop.org/journals/0029-5515/60/1/016021/revision2/nfab4c5aieqn007.gif)
![$({\rm which}\,{\rm implies}\,{\rm that}\,\varepsilon \left[H \right]\sim$](https://content.cld.iop.org/journals/0029-5515/60/1/016021/revision2/nfab4c5aieqn008.gif)
 ). That is to be expected, since the uncertainty (absolute value) of the spectral line fit, from which in turn are deduced the concentrations of the different species, is (for a given spectral resolution) essentially dependent on the S/N ratio; the latter in turn depends on the overall intensity of the fitted spectrum, but not on relative concentrations of the isotopic components. It is seen on this figure that
 ![$\frac{\varepsilon \left[{\rm H} \right]}{\left[{\rm H} \right]}\sim 1$](https://content.cld.iop.org/journals/0029-5515/60/1/016021/revision2/nfab4c5aieqn010.gif)
![${\rm for}~{{\left[{\rm H} \right]}_{{\rm OGA}}}\sim 0.01$](https://content.cld.iop.org/journals/0029-5515/60/1/016021/revision2/nfab4c5aieqn011.gif) . This is like in the case of the DTE1 T concentration, where the error bar in the T concentration was seen to exhibit a ~1%-concentration uncertainty in the measurement as the 1% concentration level is approached.
. This is like in the case of the DTE1 T concentration, where the error bar in the T concentration was seen to exhibit a ~1%-concentration uncertainty in the measurement as the 1% concentration level is approached.
On the one hand, the similarity of apparent detection limits is not surprising, given that the same plasma source is used for the excitation of the measured species and the same spectrometer and detector of the recording of the spectra. On the other hand, a study of the spectrometer settings for this latter set of post-DTE1 data shows that the entrance slit of the spectrometer was increased by a factor of four, from 50 to 200 µm, to offset additional loss of light due to deterioration of window transmission. As the (likely to be mostly) amorphous carbon coatings had partially formed during DTE1, replacement of the windows was not trivial, and the replacement has only recently taken place as part of the upgrade discussed in section 4. What is important to note is that, with a 200 µm slit, the D and T components of the Balmer-α line would no longer be resolved (either by the present, high-resolution spectrometer or by any state-of-the-art upgrade). While this adjustment allowed for sufficient signal levels for resolving the hydrogen (proportionally increasing the amount of light admitted into the spectrometer from a ~1000 µm diameter optical fiber) it would have been detrimental to resolving the tritium in deuterium plasmas (with instrumental function width increasing roughly in proportion to the slit width above the ~50 µm setting). Therefore, window replacement and, most importantly, a window coating mitigation scheme were indeed critical system upgrade needs ahead of DTE1.
Looking back at figure 3 and taking the divertor spectroscopy measurements as the reference values for the isotopic content, one would expect that the relative difference ![$\frac{\delta \left[{\rm H} \right]}{\left[{\rm H} \right]}$](https://content.cld.iop.org/journals/0029-5515/60/1/016021/revision2/nfab4c5aieqn012.gif) should be roughly bound by
should be roughly bound by ![$\left\langle \frac{\delta \left[{\rm H} \right]}{\left[{\rm H} \right]} \right\rangle \pm \left\langle \frac{\varepsilon \left[{\rm H} \right]}{\left[{\rm H} \right]} \right\rangle $](https://content.cld.iop.org/journals/0029-5515/60/1/016021/revision2/nfab4c5aieqn013.gif) which is what the green, dashed lines indicate in figure 3. As a caveat, it is also noted that the divertor spectroscopy is sensitive to the strike point position which could also be contributing to the spread in the data shown in figure 3.
which is what the green, dashed lines indicate in figure 3. As a caveat, it is also noted that the divertor spectroscopy is sensitive to the strike point position which could also be contributing to the spread in the data shown in figure 3.
The average value ![$\left\langle \frac{\delta \left[{\rm H} \right]}{\left[{\rm H} \right]} \right\rangle \sim 0.47$](https://content.cld.iop.org/journals/0029-5515/60/1/016021/revision2/nfab4c5aieqn014.gif) (the blue solid line in figure 3) suggests a 'systematic' effect, in addition to the random error due mostly to S/N limitations. For the higher isotopic concentrations, this ('systematic') relative difference becomes insignificant and the Penning-OGA measurement tends to be in good agreement with main plasma diagnostics, especially after plasma-wall equilibration, as discussed in section 5. This difference, which has most impact at the low isotopic contents of interest in the present study, is presently attributed to isotopic exchanges processes with the metallic surfaces of the Penning cold-cathode gauges, which is used as the emission source for this spectroscopic technique (see e.g. discussion on surface interaction in the plasma source in [5]). Direct, laboratory studies of these interactions, using the same plasma sources and deploying baking under controlled conditions, as well as a model to describe these processes, are presently under way [16].
(the blue solid line in figure 3) suggests a 'systematic' effect, in addition to the random error due mostly to S/N limitations. For the higher isotopic concentrations, this ('systematic') relative difference becomes insignificant and the Penning-OGA measurement tends to be in good agreement with main plasma diagnostics, especially after plasma-wall equilibration, as discussed in section 5. This difference, which has most impact at the low isotopic contents of interest in the present study, is presently attributed to isotopic exchanges processes with the metallic surfaces of the Penning cold-cathode gauges, which is used as the emission source for this spectroscopic technique (see e.g. discussion on surface interaction in the plasma source in [5]). Direct, laboratory studies of these interactions, using the same plasma sources and deploying baking under controlled conditions, as well as a model to describe these processes, are presently under way [16].
On the other hand, the random error is manifestly due to limitations in light emission from the OGA source and light losses from source to detection and can only be reduced by improved light emission or collection and by the mitigation of light transmission losses. As will be discussed later in the paper, an upgraded, multi-sensor (including shielded mass spectrometers) gas analysis diagnostic for DTE2 is aiming to reduce light losses for the OGA part of the system, partly by mitigation of window coatings produced by the Penning plasma source. Divertor species-concentration analysis—and especially the OGA part - remains a critical fuel isotope diagnostic as JET DTE2 is approached. It is also likely the main way to diagnose and control the isotopic concentration in ITER, especially at these low concentration levels. This is due to the increased challenge of fitting divertor spectroscopy spectra, in the presence of significantly more spectral line broadening, as well as more complex reflected light issues in ITER's metal wall environment (see e.g. discussion and references also provided in [5, 17]).
4. Optimization of fuel isotope detection for DTE2
4.1. Upgrade to Penning-OGA configuration to optimize light collection and mitigate losses due to gradual coating of the window
An upgraded, multi-sensor, diagnostic system has been recently completed to provide for JET DTE2 a more complete, plasma pulse-relevant, divertor gas analysis capability than was available for DTE1. This upgraded diagnostic system (partly described in [11]) is referred to, within the JET-DTE2 project, as the KT5 Upgrade [18].
Figure 5 illustrates a key feature of the present upgrade, aimed to alleviate gradual S/N deterioration through losses in light transmission in its Penning-OGA measurement. The scheme involves the use of a metallic mirror, designed to prevent direct line-of-sight between the Penning plasma source and the window through which the light is collected. It is aimed to prevent the deposition of thin coatings (Penning plasmas are akin to magnetron sputtering plasmas and thus efficient sources of coating deposition) directly onto the window. Impact of thin film coatings on light reflection from a metallic mirror was not expected to be as significant. In fact, an accelerated aging test, using this new, mirror-based configuration, with the same geometry and under similar gas and pressure conditions on a vacuum test-stand outside the JET enclosure (also the same spectroscopic measurement system) found no detectable loss of signals over the equivalent of 200 typical JET plasma pulses (figure 6).
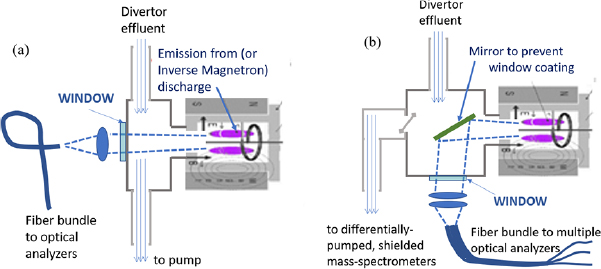
Figure 5. Illustrating the pulse-relevant, divertor gas analysis capability upgrade, with emphasis on improved collection of light from the Penning excitation source, as well as mitigation of gradual loss of window transmission due to coating deposition. (Shapes of optical and vacuum components are purely schematic figure and do not represent detailed design.) (a) Configuration ahead of present upgrade: window is in direct line-of-sight of the Penning plasma source. (b) Configuration after upgrade: mirror redirects light and prevents direct exposure of window to coating deposition from the Penning source.
Download figure:
Standard image High-resolution image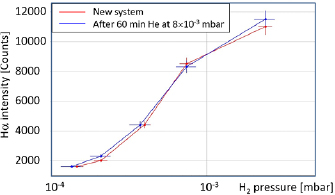
Figure 6. Accelerated testing with H2 injection for 1 h @8 × 10⁻³ mbar, this being the equivalent of 200 typical JET plasmas shots. No reduction in window transmission across relevant visible spectral region. Study carried out on CCFE vacuum test-stand but at plasma operations-relevant total neutral pressures. It is also clear that much better utilization of the dynamic range of the spectrometer detector is made with the system, now having also optimized light collection.
Download figure:
Standard image High-resolution imageIn addition to the Penning-OGA measurement, this upgrade also includes mass spectrometers aimed for plasma pulse resolving operation, which was not available in DTE1. In fact, for DTE1, only the OGA measurement was able to provide gas species concentration information during the pulse (mass spectrometers were available but only post-pulse gas analysis and vacuum integrity characterization). That simpler configuration was known, until recently, as the KT5P diagnostic (the 'P' for Penning). Lower pressure conditions, as needed for the mass spectrometers to operate, will be made possible by separating the magnetically shielded mass-spectrometers from the OGAs via a motorized, variable aperture [18] as also illustrated in figure 5.
4.2. Simulation of the uncertainty in the isotopic content to guide [T] detectability
The spectroscopic detection system is also being currently upgraded with aim to improve D/T resolution and the overall dynamic range. In support of this hardware effort, an evolving, advanced spectral fitting program at CEA-IRFM, featuring full error statistics capability, has been run for the present study in simulation mode The aim is to evaluate what aspects of a hardware system configuration would most improve isotopic detection (especially at super-low concentrations) with particular focus on resolving T from D, as this is more dependent on fitting the spectral profiles than detecting the hydrogen.
Figure 7 shows a simulation for conditions relevant to the DTE1 data showed earlier (figure 1). The simulation first produces a theoretical Dα/Tα profile, for a given concentration and with each isotopic component comprising two Gaussians ('cold' and a 'hot' components) according to [13]. Random noise is then added (here the noise level typical of the DTE1 data is used). Subsequently, a large number (~10 000 in this example) non-linear fits are carried out (with the noise generated at random). The statistics then provide the upper and lower bounds of the  confidence interval in the resulting fitted results (figure 7(a)). That means that, for an input tritium concentration
 ![${{\left[T \right]}_{0}}$](https://content.cld.iop.org/journals/0029-5515/60/1/016021/revision2/nfab4c5aieqn016.gif) , and for given signal intensity and noise level, the measurement will have a probability 95% to be in the range
, and for given signal intensity and noise level, the measurement will have a probability 95% to be in the range ![$\left\{{{\left[T \right]}_{0}}-{{\varepsilon}_{{\rm lower}}},{{\left[T \right]}_{0}}+{{\varepsilon}_{{\rm upper}}} \right\}$](https://content.cld.iop.org/journals/0029-5515/60/1/016021/revision2/nfab4c5aieqn017.gif) , where
, where  and
and  are plotted in figure 7(a). This high value
  was chosen because of the large sensitivity to the low values of the minority gas concentration of the neutron generation in the DD and TT phases and of the ICRF core heating in the JET DTE2 campaign.
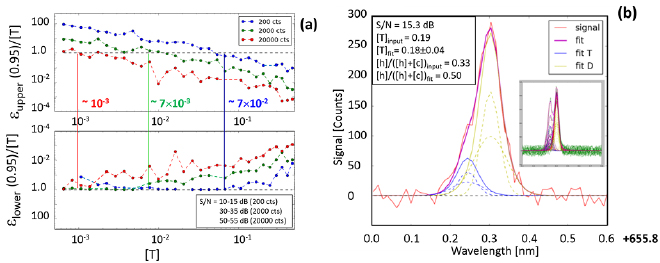
Figure 7. Simulation of fuel isotope ratio spectra, with statistical analysis of error. Cases for three peak intensities (200, 2000 and 20 000 counts (cts)), each with ±12 cts of random noise (similar to DTE1 data) and 0.118 Å/pixel linear dispersion (in all cases the intrinsic instrument function for the spectrometer is taken as 0.3A FWHM for a 50 µm slit). (a) Log–log plots of εupper/[T] and εlower/[T] versus T content with the vertical lines (in corresponding color) showing where uncertainty in the determined concentration value reaches 100% of the value. (b) Fit of simulated profile for 19% T content, also showing 'cold' and 'hot' components from the fit to compare to the ones of the simulated spectra.
Download figure:
Standard image High-resolution imageIn this case, the simulation was carried out for three levels of peak intensity. At the same random noise level this gives, correspondingly, three levels of S/N; this can be also thought of as three levels of use of the full dynamic range of the detector system. A simulated profile for 19% T concentration is shown in figure 7(b) for a poor S/N case, much as was the case of the DTE1 data, for comparison with figure 2(b). The S/N has clearly great impact on the detection limit. In fact, other cases ran with this simulation examined sensitivity to other instrument features, such as the linear dispersion (the spacing of the detector pixels for a given spectrometer instrument function). But these were not as important as the S/N. Looking, for instance, back at figure 7(a), for the condition that give only ~200 counts (cts) peak intensity, the error in T detection is already reaching 100% of the concentration value at 7%-conc. With medium signal level of about 2000 cts, one gets down to 0.7% concentration before the uncertainty reaches 100% of the value. This supports the strong emphasis put on ways to optimize light transmission/collection, as well mitigate the progressive deterioration thereof, due to coating of the windows by the Penning discharge, as discussed earlier in this section.
Although they have comparable S/N values, the limiting values (defined by ![$\frac{\varepsilon \left({{\left[T \right]}_{{\rm lim}}} \right)}{{{\left[T \right]}_{{\rm lim}}}}\sim 1$](https://content.cld.iop.org/journals/0029-5515/60/1/016021/revision2/nfab4c5aieqn021.gif) ) deduced from figures 2(a) and 7(a) differ substantially (0.01 and 0.07, respectively). This is not a contradiction: the difference between the two estimates comes from the difference in the definition of the error bars. For the data presented in section 3, they are calculated from the uncertainty on the fit parameters and thus cannot be straightforwardly translated in terms of interval of confidence (However, it is recalled that these come from the already processed data, in the JET database, and from the automated data analysis procedure, which continues to be used to this date.) In contrast, in statistical study described in the present section, the error bars (i.e. the confidence interval) come from the consideration that the 10 000 values of
) deduced from figures 2(a) and 7(a) differ substantially (0.01 and 0.07, respectively). This is not a contradiction: the difference between the two estimates comes from the difference in the definition of the error bars. For the data presented in section 3, they are calculated from the uncertainty on the fit parameters and thus cannot be straightforwardly translated in terms of interval of confidence (However, it is recalled that these come from the already processed data, in the JET database, and from the automated data analysis procedure, which continues to be used to this date.) In contrast, in statistical study described in the present section, the error bars (i.e. the confidence interval) come from the consideration that the 10 000 values of ![${{\left[T \right]}_{{\rm fit}}}$](https://content.cld.iop.org/journals/0029-5515/60/1/016021/revision2/nfab4c5aieqn022.gif) obtained for a synthetic spectrum, to which a random noise has been added, exhibit a Gaussian distribution around the value
obtained for a synthetic spectrum, to which a random noise has been added, exhibit a Gaussian distribution around the value ![${{\left[T \right]}_{{\rm syn}}}$](https://content.cld.iop.org/journals/0029-5515/60/1/016021/revision2/nfab4c5aieqn023.gif) used to produce the synthetic spectrum. Using this property, one could derive a relation between any chosen confidence interval (i.e.
used to produce the synthetic spectrum. Using this property, one could derive a relation between any chosen confidence interval (i.e.  ) and the corresponding limit value
 ![${{\left[T \right]}_{{\rm lim}}}$](https://content.cld.iop.org/journals/0029-5515/60/1/016021/revision2/nfab4c5aieqn025.gif) , i.e.:
, i.e.: ![$\frac{1}{{{\left[T \right]}_{{\rm lim}}}}\cdot er{{f}^{-1}}\left(1-2{{\delta}_{\lim}} \right)={\rm Constant}$](https://content.cld.iop.org/journals/0029-5515/60/1/016021/revision2/nfab4c5aieqn026.gif) (see appendix). This relation can then be used for estimating the confidence interval corresponding to the error bars of figure 2(a), yielding:
(see appendix). This relation can then be used for estimating the confidence interval corresponding to the error bars of figure 2(a), yielding:
![$\delta _{{\rm lim}}^{{\rm DTE1}}=\frac{1}{2}\left(1-erf\left[\frac{\left[T \right]_{{\rm lim}}^{{\rm DTE1}}}{\left[T \right]_{{\rm lim}}^{{\rm Stat}}}er{{f}^{-1}}\left(1-2\delta _{{\rm lim}}^{{\rm Stat}} \right) \right] \right)=\frac{1}{2}\left(1-\right.$](https://content.cld.iop.org/journals/0029-5515/60/1/016021/revision2/nfab4c5aieqn027.gif)
![$\left.erf\left[\frac{0.01}{0.07}er{{f}^{-1}}\left(1-2\times 0.95 \right) \right] \right)\sim ~0.59$](https://content.cld.iop.org/journals/0029-5515/60/1/016021/revision2/nfab4c5aieqn028.gif) .
.
In other words, for the data displayed in figure 2(a), there is only a 59% probability that the correct value is within the range of the fitted value ± the error bar from the fit. Such a probability is too low for a reliable estimation, e.g. of the neutron generation in the DD and TT phases or of the ICRF core heating at low minority gas concentration. This justifies the choice of a much higher value  for estimating the required performance of the Penning OGA system to be used in DTE2 (see section 4.1).
5. Relation between sub-divertor and main plasma isotopic content
It is important to mention that any isotope concentration measurement done outside the plasma does not necessarily reflect the absolute concentration of that isotope in the plasma core and transport modelling including additional particle sources (as e.g. NBI or fusion alphas) should, in principle, be pursued to establish a proper link between these quantities, for the specific plasma conditions of interest. However, there is also significant experimental evidence to convince that, for plasma–wall equilibration timescales, the hydrogenic isotopic content in the sub-divertor matches that of the main plasma. This is likely because, in such timescales, there is enough exchange of particles between main plasma and (neutralized) sub-divertor gas that the analysis of the latter serves as a global measurement of isotopic content of the former.
Although there is presently no experimental determination of the required, minimal equilibration time, there are a number of published studies, from present generation tokamaks, from which to get a sense of time scale for this equilibration. These include (a) the JET DTE1 data of [4] in which great agreement is shown between sub-divertor and main plasma measurements (including neutrons) over a very large range of isotopic concentrations, (b) a long-pulse, particle balance study on Tore Supra in which it was specifically shown that the Penning-OGA measurement, in this case in the pumping duct of a toroidal pumped-limiter, was in full agreement with neutral particle analyzer (NPA) data from the core, thus permitting the former to continue taking data over much longer time scales than was possible for the latter diagnostic [19] (see figure 8), and (c) a recent study on JET-ILW, in which the sub-divertor isotopic concentrations match quite well the concentrations measured by the core CXS diagnostic [20]. This should however be checked (via modeling) for ITER, especially since it has already been established that isotopic measurement by divertor spectroscopy will not be feasible at low concentrations, while CXS and NPA may be quite limited in resolving small isotopic concentrations.

Figure 8. Comparison of sub-divertor isotopic concentration measurement to NPA in Tore Supra long pulse plasmas, showing full agreement after ~8 s. On Tore Supra HROP denoted 'high-resolution optical Penning' to be distinguished from the Penning-based measurement of He/D2, which uses much lower spectral resolution to detect simultaneously measure He I and Dα emission. Reproduced courtesy of IAEA. Figure from [19]. Copyright (2013) IAEA.
Download figure:
Standard image High-resolution image
6. Summary and conclusion
Re-examination of isotopic content data, from automatic fitting of optical spectra of the Penning-OGA system on JET, both from DTE1 pulses (with focus on T content) and from more recent ICRH physics pulses (with focus on H minority content) shows that resolving isotopic content at the 1% or lower level can be challenging and requires special attention. In particular, preventing the loss of light through window transmission losses, can greatly impact the ability to maintain detectability at this level and prevent progressive loss of this capability. The current system upgrade includes a way to mitigate light loss resulting from thin film deposition on the viewing port of the OGA.
The importance of maintaining detection capability down to this small concentration level for the JET DTE2 campaign has also been examined. Specifically, it is seen that for maximizing ICRH core heating in DTE2, the impact of lowering H content from 2% to 1% can have substantial impact. It has also been noted that during the TT and DD campaigns, ahead and after DTE2 respectively, the same reduction in the T content can have substantial impact on the neutron budget. Loss of light from the Penning plasma source doubly impacts T detectability: (a) direct impact by reducing S/N and (b) indirect impact by forcing diagnostic operators to trade instrumental function width for more light into the spectrometer, making it harder to resolve T/D components of the Balmer-α line.
Not included in this paper is a discussion of the effect of plasma-surface interactions inside the Penning discharge tube, where neutrals are ionized and plasma light emission is produced in the process, and then used to determine the concentrations of the emitting species. This interaction, in particular in the form of hydrogen desorption from Penning electrode stainless steel surfaces (as well as isotopic exchange effects) is suspected to play a role in the detected systematic shift of the OGA-based H-content data and is a topic of current laboratory studies [16]. Even including this effect, it is clear that, for DTE2, presently upgraded, sub-divertor gas analysis capability is expected to provide measurement minimally down to the 1% level in support of JET DTE2 campaign needs.
Acknowledgments
This work was supported, in part, by the US Department of Energy under Contract No. DE-AC05-00OR22725 with UT-Battelle, LLC. Continuing support and encouragement from JET management and task force leaders for this collaborative work is gratefully acknowledged. This work has been carried out within the framework of the EUROfusion Consortium and has received funding from the Euratom research and training programme 2014-2018 under grant agreement No. 633053. The views and opinions expressed herein do not necessarily reflect those of the European Commission.
Appendix
Relation between any chosen confidence interval ( ) and the corresponding limit value ([T]lim).
The values ![${{\left[T \right]}_{{\rm fit}}}$](https://content.cld.iop.org/journals/0029-5515/60/1/016021/revision2/nfab4c5aieqn031.gif) are distributed around
are distributed around ![${{\left[T \right]}_{{\rm syn}}}$](https://content.cld.iop.org/journals/0029-5515/60/1/016021/revision2/nfab4c5aieqn032.gif) with a Gaussian distribution:
with a Gaussian distribution:
where  depends on the ratio S/N.
The corresponding repartition function is:
yielding:

One calls ![${{\left[T \right]}_{\lim}}$](https://content.cld.iop.org/journals/0029-5515/60/1/016021/revision2/nfab4c5aieqn034.gif) the value of
the value of ![${{\left[T \right]}_{{\rm syn}}}$](https://content.cld.iop.org/journals/0029-5515/60/1/016021/revision2/nfab4c5aieqn035.gif) such that
such that ![${{\left[T \right]}_{{\rm fit}}}=0$](https://content.cld.iop.org/journals/0029-5515/60/1/016021/revision2/nfab4c5aieqn036.gif) for
for ![$P\left({{\left[T \right]}_{{\rm fit}}}~ \right)=1-{{\delta}_{\lim}}$](https://content.cld.iop.org/journals/0029-5515/60/1/016021/revision2/nfab4c5aieqn037.gif) . This leads to:
. This leads to:
Footnotes
- a
This manuscript has been authored by UT-Battelle, LLC under Contract No. DE-AC05-00OR22725 with the U.S. Department of Energy. The United States Government retains and the publisher, by accepting the article for publication, acknowledges that the United States Government retains a non-exclusive, paid-up, irrevocable, world-wide license to publish or reproduce the published form of this manuscript, or allow others to do so, for United States Government purposes. The Department of Energy will provide public access to these results of federally sponsored research in accordance with the DOE Public Access Plan (http://energy.gov/downloads/doe-public-access-plan).