
Abstract
A nanosecond DBD-like discharge in a coplanar electrode configuration propagating along the water–air interface is an efficient source of reactive species to produce plasma-activated water. In this letter, we report on the mechanism of the discharge onset as well as on further developments over hundreds of nanoseconds. We combined ultrafast optical imaging with electrical characteristics to capture basic morphological imprints of individual discharge phases occurring during a single discharge event with high temporal resolution. We show that during the first nanoseconds, a diffuse bi-directional ionizing avalanche expands over the liquid surface at high speed (>5  105 m s−1). Later, discrete plasma filaments form from the diffuse plasma due to an ionization instability. The filaments, during their subsequent elongation (∼2
  105 m s−1), retain the diffuse plasma at both ends. The filaments re-ignite in the same positions on the liquid surface over several successive (mainly capacitive) current pulses (∼1 μs apart), which result from discontinuities in the driving voltage.
Export citation and abstract BibTeX RIS

Original content from this work may be used under the terms of the Creative Commons Attribution 4.0 license. Any further distribution of this work must maintain attribution to the author(s) and the title of the work, journal citation and DOI.
1. Introduction
Electric discharges with liquids or in liquids can be produced under different arrangements and conditions to obtain plasmas with specific properties suitable for different applications, e.g. for plasma-assisted (bio)decontamination, chemical conversion or even the production of new materials [1, 2]. However, the physics of such discharges is complicated due to the very complex geometry resulting from the presence of irregular solid–liquid–gas interfaces, and the detailed mechanisms of the discharge are often quite unclear and are therefore the subject of ongoing research [3–12]. We recently proposed a new dielectric barrier discharge (DBD) - like electrode geometry, that produces transient filament discharges propagating along the water surface without direct contact with the metallic electrodes. We also revealed the basic time-resolved opto-electric characteristics, and based on time-averaged emission spectra we estimated the characteristic parameters of plasma filaments (e.g. gas temperature and electron concentration) and showed that for discharge repetition rates of tens of Hz, reactive species formed in discharge filaments significantly affect the properties of plasma-activated water (PAW) [13]. Time-averaged emission spectra revealed intense broadened lines of atomic hydrogen, oxygen, and nitrogen, so we concluded that at least a partial streamer-to-spark transition characterized by increased gas temperature and degree of dissociation (which is very important for efficient PAW formation) must occur in the given discharge configuration. The main goal of this work is to elucidate the mechanism and dynamics of discharge initiation in this specific DBD-like electrode geometry. In what follows, we provide experimental evidence for initial diffuse discharge cloud formation followed by streamer propagation and streamer-to-spark transition, all occurring at the air–water interface. This evidence is obtained using four-channel high-speed imaging, which allows up to four images to be acquired with (sub)nanosecond time resolution during a single discharge event. Since the cold streamer and the hot spark show very different morphologies and radiation characteristics, these specific discharge phases can in principle be distinguished using imaging methods with sufficiently high spatiotemporal resolution.
2. Discharge apparatus and high-speed four-channel imaging
A sketch of the discharge geometry with basic voltage–current-emission characteristics is shown in figure 1(a). The reactor consists of a plastic rectangular chamber with brass electrodes placed on the bottom and separated by insulating blades. A small stream of water (conductivity 1.2 μS cm−1 at the reactor's inlet) flows continuously through the chamber, maintaining a constant level so that the air–liquid interface is approx. 1 mm above the edge of the blade. The system was supplied with a pulsed power generator (Suematsu Electronics MPC3010S-50PL), voltage and current waveforms were measured using an oscilloscope (Tektronix TDS 3054C), a high-voltage divider (North Star PVM-1, 1:2000), and a current probe (Pearson Electronics m. 2877). Plasma induced emission was detected both by fast Hamamatsu photomultiplier (PMT) and high-speed imaging XXRapidFrame camera (Stanford Computer Optics, Inc.) [13]. As the conductivity of the liquid was considerably larger than that of the blade and the gas above the liquid surface, the thin layer of water above the blade was of high-resistance. Thus, when a high voltage (>28 kV) was applied to the electrodes, a large potential drop of several kV mm−1 appeared along this area. This potential drop also appeared in the gas at the liquid surface due to the boundary condition  . Consequently, gas breakdown was initiated at the liquid surface due to the weak dielectric strength of the gas.
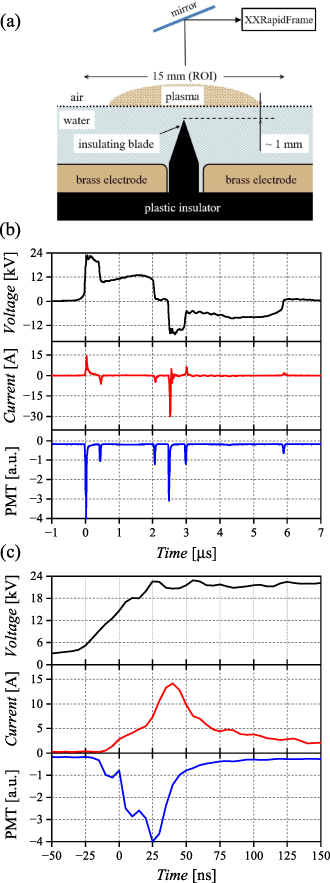
Figure 1. Experimental setup: (a) sketch of the discharge geometry with indicated region of interest (ROI), (b) characteristic voltage and current waveforms, and (c) detail of the waveforms' onset. Voltage, current and PMT waveforms acquired as an average over 100 triggered events.
Download figure:
Standard image High-resolution imageFigure 1(b) shows the typical voltage, current and PMT waveforms in a reactor supplied with DI water. Due to the low initial conductivity (1–2 μS cm−1) of the injected water, the current impedance was rather capacitive, as the relaxation time constant τDI =  /σDI was ∼6 μs, which was much longer than the voltage rise/fall-time. The liquid electric properties are closer to dielectrics than electrolytes, and therefore, the discharge regime is rather similar to a classical coplanar DBD, when the driving voltage is rapidly changing [4]. This property is responsible for the spiky character of the current waveform. The PMT waveforms show that the optical emission produced by the discharge develops simultaneously with the current pulses.
Registering the PMT waveforms together with the intensified charge-coupled device (ICCD) gate monitor using a fast oscilloscope allows any ICCD image to be assigned to a specific voltage/current phase from the very beginning and with the time resolution allowed by the ICCD detector. The four-channel ICCD imaging technique used in this work monitored the initial instants of the discharge development as well as the later stages.
3. Results and discussion
The intensity and spatial distribution of the light emitted by the produced discharge proved to be highly variable. The luminosity observed during the early stage is very weak compared to the late stages, especially after filament formation. The brightness in the following images has therefore been normalized to better visualize the morphological differences. Figure 2 shows the development of very early plasma just after its initiation. The position of the insulating blade (see figure 1(a)) is marked by the horizontal dashed line, and t marks the time position of a trigger signal. The trigger signal is produced when the supply voltage exceeds a certain level, which generally does not correlate to the moment of the gas breakdown. Therefore, there is always an initial jitter of any discharge event with respect to t. However, since we obtain four time-resolved frames from each individual discharge with precise (sub-nanosecond) timing with respect to t (and voltage/current waveforms), we can avoid jitter errors by evaluating a sufficiently large set of four-channel frames. It is clearly shown that the very early luminous plasma first appears just above the blade (figure 2, Ch2, t + 0 ns), is almost homogeneous and propagates in the direction perpendicular to the blade. The vertical asymmetry in the registered luminosity shows that the propagation speed varies slightly over the surface, probably due to the slightly uneven height of the liquid layer above the blade at the moment of the discharge (this may be the result of a structural imperfection of the blade surface or vibrations of the liquid surface caused by periodic discharges). After a few nanoseconds, an anode-directed wave develops, which is formed by a set of individual parallel filaments densely arranged along the entire length of the blade (figure 2, Ch3, t + 6 ns). On the other hand, the cathode-directed wave propagates in the opposite direction in the form of bright spots separated by a significantly darker space from the blade area. This indicates that the current density, or electric field in the plasma, is in this development stage different in the two areas. The highest radiation intensity is at the avalanche front indicating the presence of an increased electric field producing electron-impact excitations in this area. This localized excitation is typical for streamer discharges in gases [14, 15], and it was also reported for the case of water surface homogeneous avalanches at reduced pressure [4]. However, a deeper insight into the discharge initiation in a DBD-like geometry at the water–air interface at 1 atm is still missing. In any case, the locally enhanced luminosity indicates a locally enhanced electric field at the avalanche/streamer front and a redistribution of the electric potential by the developing filaments, i.e. the conductivity of the plasma filaments is higher than that of the liquid. The average propagation speed of both luminous fronts estimated from the first two images is higher than 5  105 m s−1. The last image (figure 2, t + 12 ns) shows further but significantly slower plasma expansion along with dimming, indicating that the last image was captured after the peak of the first current pulse had passed (see plot in figure 1(b)). It is also obvious from the last image that the positive polarity ionization wave (in the cathode area) propagated faster than the negative polarity wave (over the anode area). This was previously also observed in water–nitrogen interface under reduced pressures [4].
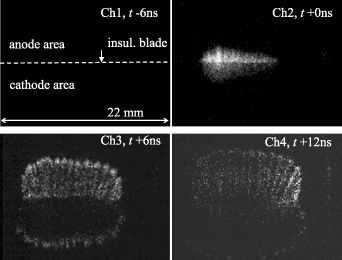
Figure 2. Formation of the very early plasma emission and diffuse bi-directional ionizing avalanche. Image sequence obtained from a single triggered event by using specific timing of the Ch1–Ch4 gates with respect to the onset (time t = 0 ns) of the HV pulse and acquired by using equal Ch1–Ch4 gates of 2 ns.
Download figure:
Standard image High-resolution imageThe sequence of images in figure 3 shows the transition of the plasma from diffuse to filamentary structure. The resulting plasma filaments seem to have their origin in inhomogeneities present in the early plasma, although they were observed to develop even from homogeneous plasma of circular shape [12]. Over time, the pattern in figure 2 (Ch3, t+ 6 ns) becomes more distinct due to the action of an ionization instability ('fingering phenomena' [15]), and it finallyreaches the state captured in figure 3 (Ch1, t+ 20 ns). Later on, the filaments' tips maintain a small area with the diffusive pattern originating in the early plasma. One of these areas is marked with the red circle in figure 3. As the diffusive parts always precede the propagating filaments, it can be concluded that conditions (electric field, rise time) in the vicinity of the tips are similar to those at the beginning of the plastic blade area. For this reason, the conductivity of the filaments bundle has to be higher than the liquid conductivity. Then, the gradient of electric potential is reduced along the filaments, and is displaced toward the tips' vicinity, as has been proved by direct potential measurement in [5]. As the resistance of individual plasma filaments varies, more conductive filaments carry higher currents, which leads to an increase in their temperature, and thus, a further increase in their conductivity. This is next followed by a decrease of the potential drop in their vicinity. If there are other less conductive filaments present, current and temperature in these decreases, and so their conductivity drops even more. As a result, only a few strong filaments remain separated by larger distances (figure 3, Ch4, t + 38 ns). The plot in figure 4 depicts the decline of filaments number n over time (only the most luminous ones are accounted for) and also the mean current density j in these filaments. It was calculated from the measured total current i divided by the filament number and the conductive cross-section of the filament σ = π R2 approximated by the radius R of the visible luminous plasma channel at the position of the blade:

Figure 3. Formation of discrete filaments with diffuse plasma at tips. Image sequence obtained from a single triggered event by using specific timing of the Ch1–Ch4 gates with respect to the onset (time t = 0 ns) of the HV pulse and acquired by using equal Ch1–Ch4 gates of 6 ns.
Download figure:
Standard image High-resolution image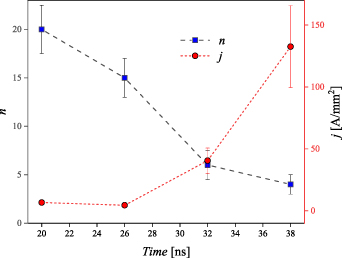
Figure 4. Time evolution of number of dominant luminous filaments n and estimation of corresponding mean current density j.
Download figure:
Standard image High-resolution imageFurther elongation of plasma filaments captures figure 5, which also proves the maintenance of the diffusive areas at the filaments' tips. The elongation of the filaments is probably continuous, not step-like, as no stagnation was observed during the initial current pulse. To better see the change of the filaments' lengths, white lines at constant position are drawn in figure 5. The average propagation speed calculated from the second (Ch2) and fourth (Ch4) images is about 2  105 m s−1.

Figure 5. Elongation of plasma filaments until reaching the stopping length. Image sequence obtained from a single triggered event by using specific timing of the Ch1–Ch4 gates with respect to the onset (time t = 0 ns) of the HV pulse and acquired by using equal Ch1–Ch4 gates of 6 ns.
Download figure:
Standard image High-resolution imageThe last figure 6 shows images integrated around distinct current pulses during the same event (cf figure 1(b)). The captured filaments clearly do not change either their position or shape, i.e. they re-appear at the same place when they are re-supplied by each following current pulse.

Figure 6. Morphology of plasma filaments during several consecutive current pulses developing within one triggered event. Image sequence obtained from a single triggered event by using specific timing of the Ch1–Ch4 gates with respect to the onset (time t = 0 ns) of the HV pulse and acquired by using equal Ch1–Ch4 gates of 50 ns.
Download figure:
Standard image High-resolution image
4. Conclusions
By employing ultrafast optical imaging diagnostics synchronously and simultaneously with electrical measurements, we succeeded in revealing basic morphological imprints of individual discharge phases occurring over nanosecond timescales on the water–air interface in a specific DBD-like discharge configuration. We show that during the first nanoseconds, a bi-directional diffuse ionizing avalanche covers most of the liquid surface at high speed (>5 × 10⁵ m s−1). Later, discrete plasma filaments form from the diffuse plasma, probably due to an ionization instability driven by local E/N enhancement associated with random variations in the thickness of the water layer in the blade region. The strongest filaments, during their subsequent elongation (∼2 × 10⁵ m s−1) and after reaching the stopping length, retain the diffuse plasma at both ends. The filaments apparently re-ignite in the same positions on the liquid surface over several successive (mainly capacitive) current pulses (∼1 μs apart), which result from discontinuities in the driving voltage. The conclusions drawn in this work are based exclusively on sequences of four images taken during a single discharge event and are not affected by statistical averaging of event-to-event variations. A detailed time-resolved spectrometric study is underway to determine the basic characteristics (e.g. E/N, gas temperature and electron density) of the initial diffuse and later filamentary phases revealed in this work.
Data availability statement
All data that support the findings of this study are included within the article (and any supplementary files).