
Abstract
This paper presents measurements of the plasma turbulence with an emphasis on the ion temperature fluctuations in comparison to the electron temperature and the ion saturation current fluctuations in the edge of the COMPASS tokamak. The ion temperature values are obtained by using a fast swept ball-pen probe, with temporal resolution up to 10 µs, accompanied by independent 1 µs measurements of the electron temperature and ion saturation current. The experimental results obtained for a wide range of line-averaged densities show that statistical properties of the fluctuations are in good agreement with a form of beta or gamma distribution function. In addition, the dependence of the averaged ion and electron temperatures on the line-averaged density is studied in the near and main scrape off layer region.
Export citation and abstract BibTeX RIS

Content from this work may be used under the terms of the Creative Commons Attribution 4.0 licence. Any further distribution of this work must maintain attribution to the author(s) and the title of the work, journal citation and DOI.
1. Introduction
Turbulence study plays an important role for understanding anomalous transport on tokamak devices [1] as well as stellarators [2]. The edge turbulence, caused by large intermittent filamentary structures of higher-than-average density and temperature (blobs), is dominating the transport across the magnetic field in tokamaks. Blobs have a typical size of several centimeters in the direction perpendicular to the magnetic field [3, 4], while are tens of meters long in the parallel direction [5]. The blobs usually spread through the scrape off layer (SOL) with a radial velocity of one-tenth of the parallel sound speed (in the order of 1 km s−1) [3, 6–9] and can be recorded by electrostatic probes as fluctuations of the measured probe current and potential. The relative fluctuation level is minimal near the shear layer, where blobs are formed, and increases as the blobs dissipate in the far SOL, due to transport along open magnetic field lines [10]. In general, the conditionally averaged signal of a blob structure results in an asymmetric waveform with a fast rise and a slow decay, having an amplitude several times higher than the one of the average signal [11].
The probability distribution function (PDF) of the studied plasma parameters, typically the ion saturation current ( ) and electron temperature (Te), is therefore deviating from a normal (Gaussian) shape [12]. The PDF can be characterized by computing its higher central moments (e.g. skewness and kurtosis). For example, the skewness of
  and Te PDF is found to be positive in the SOL region and increases toward the first wall indicating the presence of blobs moving outwards. This was observed by various measurements [3, 13–15] as well as numerical simulations [10, 15–17]. In addition, the relation between the skewness and kurtosis of the
  PDF was observed to follow a parabolic relation, which seems to be well described by a gamma distribution in the SOL region [7, 14]. It was also found that the
  fluctuations exhibit universal statistical properties across the SOL of multiple devices and discharge conditions [18, 19].
On the other side, the Te fluctuations are only rarely measured with high temporal resolution [20] and the ion temperature (Ti) fluctuation measurements are almost completely absent due the difficulty of achieving the required high temporal resolution. Yet obtaining experimental results on Te and Ti fluctuations would significantly contribute to the validation of simulations, such as [6, 21]. For this reason, the ball-pen probe (BPP) was used during COMPASS measurements to estimate both the ion and electron temperatures. Indeed, a combination of BPP and Langmuir probe (LP) can be used to measure Te fluctuations [20, 22]. In addition, fast sweeping of a BPP was recently shown to measure Ti fluctuations, down to 10 µs [23]. As this resolution already coincides with a typical blob autocorrelation time observed on COMPASS [24], it therefore enables us to study also the ion temperature characteristics in detail.
This paper is organized as follows: In section 2 synthetic retarding field analyzer '(RFA)-like' I–V characteristics are used to estimate an average ion temperature. The ratios of averaged Ti/Te temperatures are studied for different line-averaged densities. Section 3 presents a statistical evaluation of the different measured plasma parameters thanks to the high temporal resolution of the measurements. Namely, some of the higher statistical moments of PDF functions are analyzed and compared to different analytical distribution functions. Section 4 summarizes all findings.
2. Ion and electron temperature ratio in the SOL
In fusion devices, the radial profiles of Ti are typically measured using RFAs [25, 26] with a temporal resolution in the order of 1 ms, too slow to study Ti fluctuations. In the main SOL [27], the resulting RFA Ti values are significantly higher than the Te ones, observation also supported by simulations of blobs including ion dynamics [6]. This effect may be attributed to parallel ion energy loss being much lower than the electron one, due to difference in parallel conductivity of electrons and ions scaling as  . In order to study the Ti fluctuations, a technique based on sweeping the BPP was recently used to measure Ti with high temporal resolution (10 µs) [23]. The BPP dielectric shielding tube strongly suppresses flux of electrons due to their tiny Larmor radius, while ions reach the collector due to much larger Larmor radius. Swept collector voltage then repels all the ions from the ion Maxwellian distribution with too low energy, similarly as LP does it for electron energy distribution. Since nontrivial electric field is self-generated inside the BPP tube, following the ion trajectories in 3D is necessary and was simulated in [28]. Thus, from the electron branch of the BPP I–V characteristic, using a four-parameter fit (equation (1) in [23]) the ion temperature (Ti) can be obtained as a parameter of the exponential decay of the ion current. Following the work in [23], an improved analysis of the BPP I–V characteristics, based on the determination of the useful voltage range for fitting [29] was implemented in this paper. The optimum fit voltage range is found from a series of fits performed on the same dataset, varying only in the upper bound of the voltage range. The optimal fit is selected from a plateau, where the Ti remains constant. This improvement results in an increase of the total amount of useful data, up to approximately 60% of all the available data.
All measurements of the  , Te and Ti reported in this paper were performed at the midplane of the COMPASS tokamak using a fast-reciprocating probe head carrying three BPPs and two LPs (see figure 1 in [20]) during a set of eight L-mode discharges (#7023–7027, #7029, #7034, #7038) having different values of the line-averaged density in the range of 2 × 10¹⁹–9 × 10¹⁹ m−3. A lowpass filter with fcutoff = 370 kHz was applied to all probe signals. The plasma current Ip = 170 kA and the toroidal magnetic field BT = 1.15 T remains the same for all discharges. Throughout this paper the radial profiles are plotted relatively to the last closed flux surface (LCFS). The exact position of the LCFS on COMPASS is routinely obtained by means of probes [30] or magnetic equilibrium reconstruction. In this paper we use probe measurements to locate the maximum of plasma potential, which improves the precision of the position of the LCFS compared to the one provided by the magnetic equilibrium reconstruction. A combination of floating LP and BPP and one negatively biased LP were used to obtain the Te [23] and
  values, respectively, with a high temporal resolution. The LP and BPP were separated by 4 mm in the poloidal direction. It was shown in [8], by both ESEL simulations and experiments, that the spatial size of plasma potential fluctuations is much larger than the probe distance. Therefore, the Te values obtained by BPP and LP can be considered localized. It is worth mentioning that previous fast Te measurements on the tokamak ISTTOK also have shown high correlation (∼0.8) between two BPP/LP and triple probe measurements on a 4 and 8 mm poloidal distances (figure 11 in [20]). The data acquisition system operated at a sampling rate of 5 MHz. As mentioned earlier, the ion temperature Ti was obtained by sweeping one of the BPP (see details in [23]). All fast Ti measurements can be transformed to an 'RFA-like' I–V characteristics to provide Ti with low temporal resolution as shown in [23]. This allows us to study the averaged values and ratios of Ti/Te.
Regarding the temporal resolution of the Ti measurements, we have observed that the typical blob time scale in the SOL in the presented shot series can be even less than the 10 µs measurement time scale. For this reason, even at such a high sampling rate, the presented Ti measurements still represent averaged values within the 10 µs recording interval. However, it is clear that the Ti measurements are already sensitive to blobs, which is reflected in the resulting strongly skewed PDF functions, as shown in the next section.
For each discharge, an RFA-like Ti radial profile was reconstructed, where each radial point represents a 3 ms time interval. The Ti and Te values are then averaged within two regions, namely main SOL (0.01 < R − RLCFS (m) < 0.015) and near SOL (0.0 < R − RLCFS (m) < 0.005]), for each of the discharges. The obtained results are plotted in figure 1. Note that the high values of the plasma potential measured by BPP in the vicinity of the LCFS for discharges with low line-averaged density (<4.1019 m−3) limits our maximum Ti values of fast measurements. Thus, the corresponding RFA-like values might be also limited. These points are plotted only with gray color. Higher swept voltage amplitude applied on the probe could in future measurements compensate for the increased plasma potential.

Figure 1. Dependency of the RFA-like Ti (obtained by averaging RFA-like radial profiles over a region of interest) and mean values of Ti and Te (obtained by averaging over the same region) on the line-averaged electron density for the main SOL (left) and near SOL (right). Each point was obtained over one discharge.
Download figure:
Standard image High-resolution imageIn figure 1, we observe that the Ti(RFA-like)/Te ratio is close to 3 and 4 in the main SOL and tends to decrease with higher density. A similar behavior was observed with RFA measurements on Tore Supra (see figure 2 in [31]), or with segmented tunnel probe on CASTOR tokamak [32]. Regarding the near SOL region, the ratio around 2 is in a good agreement with results obtained on various tokamaks (see figure 1 in [31]). Fast Ti measurements gives therefore similar results than the ones obtained by actual RFA measurements. The interpretation of the signification of RFA data, as mentioned in [25], can be illustrated by comparing the RFA-like Ti to its mean values (orange squares in figure 1) calculated on the same datasets and enabled thanks to fast probe measurements. It is clear that both values are quite different, due to the fact that the RFA diagnostic measures only on the 'hot tail' of the ion temperature distribution (high temperature), while the average value is a mixture of all available temperatures.
3. Characteristics of fluctuations in the SOL and edge
In this section, we focus on the properties of the PDFs of the simultaneously measured Ti and Te in comparison with the  to assess the influence of the plasma temperature fluctuations. The fluctuations are here characterized in terms of higher central moments (skewness and kurtosis), providing an insight about the properties of the underlying nonlinear dynamics [12]. The skewness is used to quantify the positive or negative asymmetry of the PDF, while the kurtosis measures whether the PDF is flatter or more peaked compared to a Gaussian PDF. This statistical analysis is performed on data from 3 ms time intervals for all eight similar discharges with different line-averaged densities, as already mentioned in the previous section. Similarly to the study of
  measurements in [7, 14, 19, 33], we have also observed that the
  fluctuation level and associated PDF moments do not depend on the line-averaged density. It is newly shown that the same behavior can be observed for the Ti and Te measurements. Note, all the achieved statistical characteristics of
  , Ti and Te are plotted in further graphs by different symbols and colors, but independently on the line-averaged density to increase the clarity of figures.
Figure 2—left shows the fluctuation level, calculated as the standard deviation of a given variable over its mean, of the plasma parameters (Ti, Te and  ) to increase towards the wall. For reference see figure 1, where the mean (µ) values of Ti and Te are indicated. We also observe that the fluctuation level of each of the plasma parameters increases at a different rate. While the
  fluctuation level, being proportional to the fluctuations of
  , increase greatly during the outward flight, the Ti and Te fluctuation levels increase only slightly, indicating that this increase is mostly due to the blob density. This observation seems in agreement with previous lithium-beam emission spectroscopy measurements on COMPASS, which have shown a significant increase of the ne fluctuation level toward the wall (see figure 6 in [34]). The increase of
  and Te fluctuation levels towards the wall is commonly observed on other devices like ASDEX [35], COMPASS [35], TCV [33], ISTTOK [20].

Figure 2. Radial profiles of the fluctuation level (left) and skewness (right) of different plasma parameters with respect to the LCFS position. Measurements obtained during eight discharges with different densities are plotted together, showing similar radial variation. The ion temperatures possibly affected by the technique limitation (voltage range limitation) are plotted in gray color. The vertical dashed line indicates the transition between the confined plasma and SOL.
Download figure:
Standard image High-resolution imageIn figure 2—right the radial profile of the skewness of all the studied plasma parameters is plotted. The positive skewness of the  indicates the presence of blobs in the SOL, while the negative skewness indicates the presence of density holes inside the LCFS [12]. Note, that the skewness is a dimensionless relative quantity, thus even a small negative skewness of
  , corresponding to a small low-density region (hole) inside the LCFS, can cause a large blob (large skewness) in the far SOL assuming that both the hole and blob originated from the same event. This is further understood by recalling that the background plasma density is higher inside the LCFS than in the SOL. We can also notice (see figure 2 and later figure 4) that the skewness of the Te and Ti never becomes negative. This observation is consistent with ESEL Te fluctuation simulations [8]. The interpretation of this interesting finding can be formulated as follows: the birth and subsequent cross-field transport of the higher-density blob is accompanied with a temporary locally decreased density hole inside the LCFS. This hole is consequently characterized by a negative skewness of the
  PDF (mostly governed by density). However, the temperature (ion and electron) inside the hole remains unchanged for low viscosity plasma, as the hole does not absorb the colder plasma from the SOL. The ions, moving at a mean speed close to the sound speed, are in any case too slow to flow from the low temperature region into the hole and cause negative skewness of Ti. The observations made from figure 2—right seem consistent with this explanation.
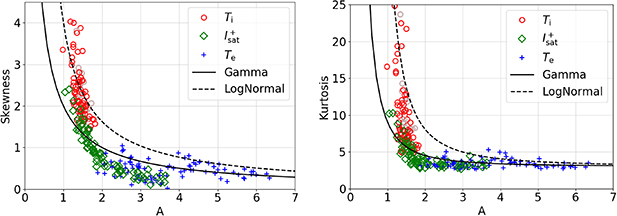
Figure 3. Variation of the skewness (left) and kurtosis (right) as a function of the cluster parameter A. The theoretical relations of these parameters in the case of gamma and log-normal distributions are also shown for comparison. Measurements realized in the SOL ![$(0 < R\left[ {\text{m}} \right] < 0.02)$](https://content.cld.iop.org/journals/0741-3335/64/5/055021/revision3/ppcfac5a0bieqn26.gif) during eight discharges having different densities are plotted simultaneously.
during eight discharges having different densities are plotted simultaneously.
Download figure:
Standard image High-resolution image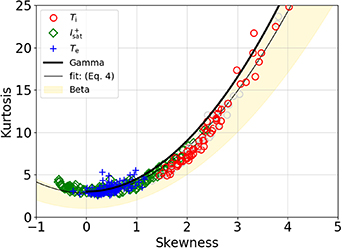
Figure 4. The kurtosis as a function of the skewness. Comparison with result of gamma distributed (equation (4)) and beta distributed statistics (equation (6)). Measurements performed in the region ![$( - 0.005 < R - {R_{{\text{LCFS}}}}\left[ {\text{m}} \right] < 0.02)$](https://content.cld.iop.org/journals/0741-3335/64/5/055021/revision3/ppcfac5a0bieqn27.gif) during eight discharges with different densities are plotted simultaneously. The ion temperatures possibly affected by the technique limitation are plotted in gray color.
during eight discharges with different densities are plotted simultaneously. The ion temperatures possibly affected by the technique limitation are plotted in gray color.
Download figure:
Standard image High-resolution image
The main goal of the paper is to compare the experimentally obtained characteristics of the Ti, Te and  PDFs with theoretical predictions. In order to do that, we compare the relations between the skewness or kurtosis and the clustering parameter A of these PDFs to the gamma and log-normal distribution. The gamma distribution was chosen as it is known to well describe natural phenomena where grouping (clustering) of random events occurs and was observed when studying fluctuations of Te and
  in the SOL, both experimentally and numerically (see [6, 7, 19]). From the gamma distribution, it is possible to define a relation between the skewness S and the parameter A as follows [19]:
where  that we call the clustering parameter, quantifies the dispersion of the distribution. Here
  denotes the mean value of the studied parameter x (in our case Ti, Te or
  ) and
) and  its standard deviation. Having A approaching infinity would correspond to an absence of intermittent structures (no clustering) since the gamma distribution would tend to the normal distribution. The relation between the cluster parameter A and the kurtosis K for a gamma distribution is as follows [19]:
Similarly, we can obtain such relations for the log-normal distribution, where the skewness and kurtosis relations with the cluster parameter A are as follows [19]:
where  . The log-normal distribution is also considered and compared to the data, as it was shown to describe the PDFs of plasma quantities measured on the RFX reversed-field pinch device [36].
The comparison between the equations (1)–(3) and experimentally measured data inside the SOL (![$0 \leqslant R - {R_{{\text{LCFS}}}}\,\left[ m \right] \leqslant 0.02$](https://content.cld.iop.org/journals/0741-3335/64/5/055021/revision3/ppcfac5a0bieqn28.gif) ) are then shown in figure 3. Firstly, note that the observed large kurtosis values are related to a long 'hot tail' of the corresponding Ti PDF (see example figure 5 in [23]). Secondly, it is clear that all the measured plasma parameters follow a similar (continuous) trend, hence probably the same form of distribution, having the Te on the high-A side and the Ti on the low-A side of the curve. Thirdly, we observe that both the gamma and log-normal distributions provide a reasonable qualitative match to the data (similar trend), although they are unable to reproduce fully the experimental observations. The experimental data from the region inside the LCFS had to be excluded for this analysis, since neither of the distributions allows for the skewness to attain negative values, even though the negative skewness is commonly observed in this region [12, 18, 37–39]. Note that we have also investigated the effect of sampling frequency on the results presented in figures 3 and 4. For that purpose, Te and
) are then shown in figure 3. Firstly, note that the observed large kurtosis values are related to a long 'hot tail' of the corresponding Ti PDF (see example figure 5 in [23]). Secondly, it is clear that all the measured plasma parameters follow a similar (continuous) trend, hence probably the same form of distribution, having the Te on the high-A side and the Ti on the low-A side of the curve. Thirdly, we observe that both the gamma and log-normal distributions provide a reasonable qualitative match to the data (similar trend), although they are unable to reproduce fully the experimental observations. The experimental data from the region inside the LCFS had to be excluded for this analysis, since neither of the distributions allows for the skewness to attain negative values, even though the negative skewness is commonly observed in this region [12, 18, 37–39]. Note that we have also investigated the effect of sampling frequency on the results presented in figures 3 and 4. For that purpose, Te and  data were averaged and downsampled to the same resolution as the Ti measurements. Only a slight increase in scatter of the skewness and kurtosis values was then observed. We can therefore conclude that using a higher sampling rate for Ti measurements could possibly deliver slightly less scattered skewness and kurtosis values.
Now, we proceed to discuss the direct relation between the kurtosis and skewness as it may provide more insight on which distribution could better characterize the PDFs. The experimentally measured dependency of K versus S is potted in figure 4. Again, we observe that all the plasma parameters follow each other in a continuous parabolic trend, indicating that they could be described by the same form of distribution.
Indeed, numerous other experiments in the SOL of magnetized plasmas on toroidal fusion devices, such as, TCV, Alcator, NSTX [40, 41] and simple plasma devices, like TORPEX [18], have also shown that the  and Te fluctuations, agree well with this parabolic relation linking the skewness and kurtosis moments. In addition to these experimental findings, a stochastic model of intermittent fluctuations, presented in [7], also supports the universality of this parabolic dependency (see equation (10) in [7]). This model provides a general statistical description of turbulence based on the assumption that fluctuations can be represented as a sequence of bursts events following a Poisson process with exponentially distributed waiting times. The model was shown to well describe
  fluctuations caused by blobs and elucidate experimental findings such as: broad plasma profiles and large fluctuation levels, skewed and flattened amplitude PDFs and, again, the parabolic relation between kurtosis and skewness [1, 11].
We now intend to characterize further the parabolic dependency of the kurtosis as a function of the skewness with:

where the parameters  and
and  can be found as best fit parameters. A least-square fit of all the data presented in figure 4 yields the parameters of the quadratic polynomial equation (4) as:

The fitted parameters  and
and  are close to the experimental findings from the TCV and TORPEX devices [18], where the parameters were found as
  and
and  . These values are also close to the ones corresponding to a gamma distribution, as the relation between the kurtosis and the skewness for a gamma distribution is (see equations (1) and (2)):
A comparison of this theoretical relation to the experimental data is plotted in figure 4 and is shown to agree reasonably well with the measurements of all the studied parameters Te,  and Ti. Note that in [7], undertaking further assumptions about the shape of the burst waveform (sharp rise and exponential decay) and of the distribution of burst amplitudes (exponentially distributed), Garcia retrieves equation (5) (see equation (16) in [7]) and eventually even the gamma distribution. It therefore seems that the gamma distribution is a good approximation of the real distribution in the SOL, both shown by experimental observations and theoretical derivation. On the other hand, the gamma distribution does not allow for S < 0, experimentally observed in the confined region on the
  , here and in many works [12, 18, 37–39], thus restricting equation (5) explicitly to the SOL region. Also, a slight departure of the experimental data from equation (5) is observed (see figure 4), consistent with the observations made in figure 3, suggesting that the fluctuations are not purely gamma distributed.
As was already suggested in [18], to stay consistent with the physical mechanism of generation of the density blobs and holes originating from the same event, a more general distribution function can be found to characterize the turbulence of fusion devices. This distribution is the so-called beta distribution and provides a more universal statistical description of the turbulence than the gamma one, as it can predict the (negative skewness) holes as well as the (positive skewness) blobs. The dependency of its kurtosis with its skewness can only be expressed analytically for specific cases but lies between boundaries that follow the parabolic relation of equation (4). In fact, for beta distributions characterized by the two strictly positive parameters p and q, the boundaries of its kurtosis versus its skewness are given by [18]:

The region defined by these boundaries is shown in yellow in figure 4. First, note that the upper limit of this inequality is exactly equation (5) of the gamma distribution (for positive skewness), which matches well the experimental data. Second, most of the data are encompassed within those boundaries which tends to show that the fluctuations of the three plasma parameters ( , Ti and Te) can be described by the same form of beta distribution. In fact, although the specific relation between the skewness and the kurtosis of a given beta distribution is more complex than the one of a gamma distribution, the relation is usually found to be very close to a parabola like equation (4).
Thus, we can conclude that fluctuations, including the ones of Ti, can in general be described by a beta distribution, while the gamma distribution is a good approximation of the distribution in the SOL region (behind LCFS), where positive bursts (blobs) appear and dominate. These findings, especially on Ti and Te which are rarely or never measured with such a sufficient temporal resolution, may provide an indispensable insight for validation of the physical basis of simulation models of the tokamak SOL.
4. Conclusions
In this paper we have shown that the averaged Ti values, obtained by the RFA-like characteristics, are systematically higher than the corresponding averaged Te for different line-averaged densities, in both main and near SOL regions. Higher Ti/Te ratios are seen in the main SOL in comparison to the near SOL region, as it is commonly observed at different fusion devices. Moreover, the Ti/Te ratio decreases with higher line-averaged density in the main SOL, as it was also shown on Tore Supra and CASTOR tokamak. We have then analyzed and compared fluctuation levels of Ti, Te and  over the entire edge plasma during eight L-mode discharges. It was found that the fluctuation level of all plasma parameters decreases towards the LCFS, but for Ti only with a weak dependence.
The relations between the skewness or kurtosis and the clustering parameter A for all measured Ti, Te and  were observed to follow a similar trend. These experimentally obtained characteristics were compared to the theoretical predictions (log-normal and gamma distribution), with a reasonable agreement to the gamma distribution function within the entire SOL region. It concludes, based on gamma distribution, that the relation between kurtosis and skewness should follow the parabolic function
  . We have demonstrated that this function fits well to the experimental data. Moreover, the fitting of the data using general parabolic formula
  provides empirical values
  . Similar coefficients were also obtained on TCV tokamak for purely
  measurements. The beta distribution is also applied, since it very well fits with the experimental data in the SOL, while it also includes the negative
  skewness observed in the confined region. In general, it was found that statistical properties (fluctuation level, skewness and kurtosis) of all plasma parameters do not exhibit any clear dependence on the line-averaged density.
Acknowledgments
The authors would like to thank A Devitre for initial help with the fitting routines and D Trunec for insightful discussions. This work has been carried out in the framework of the EUROFusion Consortium and has received funding from the Euratom research and training programme 2014–2018 and 2019–2020 under Grant Agreement No. 633053. The views and opinions expressed herein do not necessarily reflect those of the European Commission. This investigation was supported projects MEYS #LM2018117, CZ.02.1.01/0.0/0.0/16_019/0000768, IAEA CRP F13019—Research Contract Nos. 22727/R0 and GACR 22-03950S. Part of the work presented in this article was realized in the frame of the 2018 summer school SUMTRAIC held at the IPP Prague [42].
Data availability statement
The data generated and/or analyzed during the current study are not publicly available for legal/ethical reasons but are available from the corresponding author on reasonable request.