
Abstract
The pressure in an underwater discharge channel is the main parameter that influences all its applications. In this study, we investigate a relatively large gap with a plane-to-plane electrode geometry that uses the assistance of an injected gas bubble for breakdown. The delay in the application of high voltage following the injection of a gas bubble from a grounded electrode determines the initial dimensions of the bubble. We examined three types of discharge: (a) a large bubble with easy triggering, (b) a medium bubble, and (c) a small bubble with difficult triggering. The main diagnostic tool is Hα line broadening. It is shown that (i) Doppler broadening plays no role; (ii) at pressure broadening, the resonance and van der Waals broadenings must be considered; (iii) the impact approximation is not applicable, and hence the quasi-static high-pressure (namely 'nearest neighbour') approximation must be used; and (iv) the Stark broadening plays the dominant role. Because a mixture of two gases (evaporated water vapour and nitrogen from bubble injection) is present in the discharge channel, simple thermodynamic considerations were applied to estimate the ratio of the contributions of resonance and van der Waals broadening. The larger the bubble, the smaller the pressure detected in the discharge channel. This is in agreement with the measurements of the pressure wave amplitude at a certain distance from the discharge channel using a piezoelectric pressure probe.
Export citation and abstract BibTeX RIS

Original content from this work may be used under the terms of the Creative Commons Attribution 4.0 license. Any further distribution of this work must maintain attribution to the author(s) and the title of the work, journal citation and DOI.
1. Introduction
Underwater spark discharges can serve as a source of diverging pressure waves [1]. After reflection at a suitable reflector, they can be transformed into converging shock waves [2] with a huge range of potential applications (such as extracorporeal lithotripsy {i.e. the disintegration of kidney or gall stones [3]}, grinding of rocks [4], and cleaning/deforming of materials [5, 6]). The underwater spark gap typically has a pin-to-pin electrode geometry; however, after a number of shots, the tips of the electrodes become rounded, the electric field in their vicinity falls, the gap increases, breakdown becomes unstable, and finally fails. One solution would be a spark gap with a plane-to-plane electrode geometry. However, a moderately long underwater gap (a few millimetres in length), in which reasonably large amounts of energy are dissipated, is difficult to breakdown. For this reason, a spark gap with a gas bubble injection has been patented [7] and is being investigated [8, 9]. Unfortunately, the dimensions of the bubble influences not only the breakdown voltage and breakdown delay (following the voltage application) [9], but also the pressure in the discharge channel. Therefore, for a large triggering bubble, we find a well-defined Hα spectral line in the visible spectrum. With a reduction in the dimensions of the triggering bubble, the width of this spectral line increased with a simultaneous decrease in its amplitude [9]. It is clear that the smaller the triggering bubble, the longer the streamers must be built in the water, the larger volume of water must be evaporated, and the smaller the volume (volume of the bubble) into which the evaporated water can expand; therefore, the higher the pressure in the entire discharge channel. As a result, we can conclude that the triggering bubble not only facilitates the breakdown of the underwater gap, but also reduces the pressure in the discharge channel and the efficiency of the transformation of electrical energy (accumulated in the driving capacitor) into mechanical form (i.e. into the energy of the generated pressure/shock wave that propagates from the discharge channel). The aim of this study was to use optical emission spectroscopy for underwater spark-channel diagnostics. To the best of our knowledge, besides our recent paper [9], only two such papers have been presented [10, 11], in contrast to the numerous others that have investigated the light emission of streamer or corona discharges {see e.g. [12, 13]}. Our previous article [9] demonstrates (1) experimental arrangement that enables to collect visible spectra without water absorption (through ground electrode), (2) that the underwater spark in its early stage is not a black body radiator (it has a dominant hill-like region in the range from 350 to 580 nm {probably a result of substantially broadened line radiation}, and clearly pronounced Hα line that broadens {undoubtedly due to increased pressure} with the gas bubble diminution), (3) that the increased pressure with gas bubble diminution is confirmed by a pressure probe that measures amplitude of the pressure wave propagating from the discharge channel. Our present paper proceeds from the same experimental data published in [9], but their interpretation is based on in-depth analysis of Hα line profile (line width) that not only leads to determination of the pressure in the discharge channel, but also casts new light on other processes taking place in the early stage of underwater spark discharge initiated with gas bubble assistance.
2. Methods and experimental setup
The experimental arrangement is described in [9], and is illustrated in figure 1. The plane-to-plane electrode system is mounted in a tank filled with tap water (conductivity = 400 μS/cm). The electrodes are made of brass, have a diameter of 6 mm and a typical inter-electrode gap of 7 mm. The grounded cathode is drilled through (diameter of 1.6 mm) to enable (i) placement of an optical fibre (tip of which is embedded 4 mm behind the hole outlet to the gap) for spectroscopic diagnostics; and (ii) injection of the bubble (N2) into the gap to facilitate breakdown. The capacitor Cs (0.8 µF) is charged to a voltage of 15 kV. A triggered spark gap switches the capacitor to the electrode system with an adjustable delay (BNC575 pulse delay generator) from 20 to 27 ms following injection of the gas bubble. Temporal voltage and current waveforms are measured using a voltage divider (PVM-4 2000:1, North Star Research Co.) and a Pearson probe (model 101), and recorded by an oscilloscope (Tektronix MDO 4054C). The current signal serves as the trigger source for the oscilloscope; in this way, the time base of this oscilloscope is synchronised with the moment of breakdown, i.e. when the underwater spark is formed. The oscilloscope generates the output trigger signal for the high-speed and spectrometer cameras (figure 1).
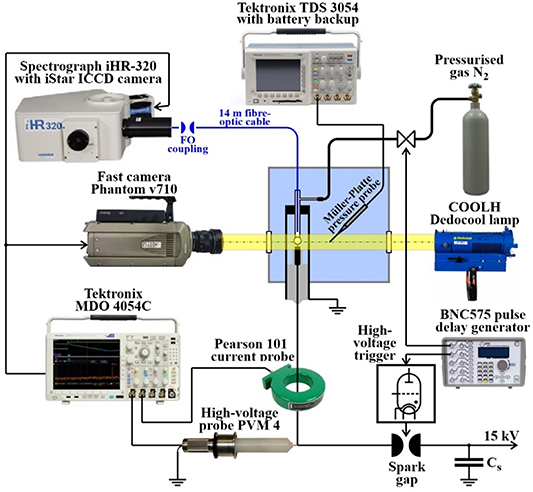
Figure 1. Experimental setup for spectroscopy of spark discharge in water. Adopted from [9]. CC BY 4.0.
Download figure:
Standard image High-resolution imageThe high-speed camera Phantom v710 allows for closed-loop writing of frames (in our case 256 × 256 pixels at 79 000 fps) into its dynamic 8 GB RAM memory {due to that even pre-trigger frames are available}. Camera is equipped with a Nikon 200 mm f/4D IF-ED AF Micro objective lens and captures video sequences of the gas bubble injection and the dynamics of the electrical discharge evolution. The processes are visualised using the optical shadowgraphy method; as a high-intensity light source, we use a COOLH Dedocool tungsten light head operating in the continuous regime.
The radiation emitted by the spark channel is transmitted by a 14 m fibre-optic cable to the iHR-320 imaging spectrograph (Jobin-Yvon; grating 300 G mm−1, blazed at 600 nm). There, it is decomposed into a spectrum and registered (nearly synchronously with the breakdown {or more precisely with the delay equal to difference between travel time of electrical and optical signals (24.1 ns) plus camera activation time (19 ns), which amounts 43.1 ns behind the breakdown}) by a multichannel iStar ICCD camera DH740i-18U-03 (Andor, 2048 × 512 pixels, effective pixel size 13.5 × 13.5 μm). For our purposes, an exposition time of 3 μs is used. We captured the spectrum by taking measurements at two positions of the grating (the first centred at the wavelength 471 nm {measuring range 347–595 nm}, the second centred at 719 nm {measuring range 595–843 nm}). Although the bubble dimensions varied by ±15% at the same trigger setting, we selected pairs of discharges with bubble dimensions that differed by less than 7% for spectrum construction. The wavelength calibration was performed with the help of low-pressure Ar lamp with traces of Hg vapour. The spectral sensitivity of the whole instrument (including the fibre-optic cable) was flattened with the help of Deuterium Tungsten-Halogen calibration light source DH-2000-CAL (Ocean Optics, Inc.). A typical spectral resolution is ⩽0.6 nm.
The spark discharge generates a pressure wave in the surrounding water, the waveform of which is detected by a Müller-Platte needle probe, with detection frequencies ranging from 0.3 to 11 MHz. The tip of the probe is positioned at a distance of 70 mm from the axis of the electrode gap. The measured acoustical signal is recorded by another oscilloscope (Tektronix TDS3054C). In order to minimise electro-magnetic interference from the discharge, this oscilloscope is powered by a backup power supply (EATON 5E 850i).
3. Results
3.1. Visible light emission
A general description of the underwater discharge generated between plane-to-plane electrodes with a nitrogen bubble injection was given in [8]. After voltage application, a streamer discharge develops in the injected gas bubble as a result of an avalanche process, and propagates along the inner side of the bubble surface [8, 14]. When the streamers reach the anode side of the bubble, they continue to propagate in the water. As soon as one of these streamers bridges the inter-electrode gap, the electrical breakdown takes place and the underwater spark is generated. Its visible spectrum is shown in figure 2.
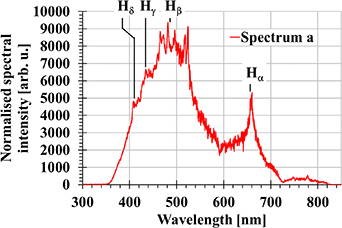
Figure 2. Optical emission spectra of an underwater spark. The positions of un-shifted Balmer series lines of hydrogen are depicted.
Download figure:
Standard image High-resolution image3.2. Three types of discharge
The electrical and optical emission properties of such underwater discharges depend on the delay τ in the application of the voltage behind the bubble injection. The first column of figure 3 shows examples of current and voltage waveforms for three typical discharges, which differ in terms of the size of the injected nitrogen bubble just before initiation of the spark. The processes in three types of discharge can be described as follows. (a) Large τ {∼27 ms}: the injected bubble almost interconnects the electrodes, and the pre-breakdown streamers propagate easily along the inner side of the bubble wall up to the bubble front facing the high-voltage electrode. They finally have to travel only a small distance in undisturbed water. Breakdown (spark initiation) occurs almost immediately after voltage application. Since the spark channel in the water is very short, a small volume of water is evaporated, the pressure increase in the plasma column is relatively low, and the Hα line is clearly visible in the spectrum. (b) Medium τ {∼24 ms}: the size of the bubble is around 50% of the inter-electrode gap, and the pre-breakdown streamers have to travel about one half of their path in the water. Due to this, breakdown is delayed {∼20 μs} following the voltage application. The development of a longer discharge channel in water accompanies evaporation of larger amounts of water and increases pressure in the discharge channel and in the bubble, meaning that the Hα line broadens and its peak value is reduced. (c) Small τ {∼20 ms}: the bubble occupies approximately 30% of the inter-electrode gap and the pre-breakdown streamers have to bridge a large distance through the water. The onset of the spark is even further delayed {nearly 40 μs} after voltage application, and a larger amount of water is evaporated, with still higher pressure. The Hα line further broadens and starts to be hardly noticeable above the background. Unfortunately, the video frames corresponding to the time period of spectroscopy measurements were overexposed, and did not contain any information. Instead, images of the bubble one frame before breakdown are presented in the second column of figure 3. The third column of the figure depicts the visible spectra of the spark discharge immediately after breakdown; a change in the amplitude and width of the Hα line (at a wavelength of 656.3 nm) are clearly visible (the backgrounds {dashed lines} of this spectral line were obtained by extrapolation from their neighbourhoods).
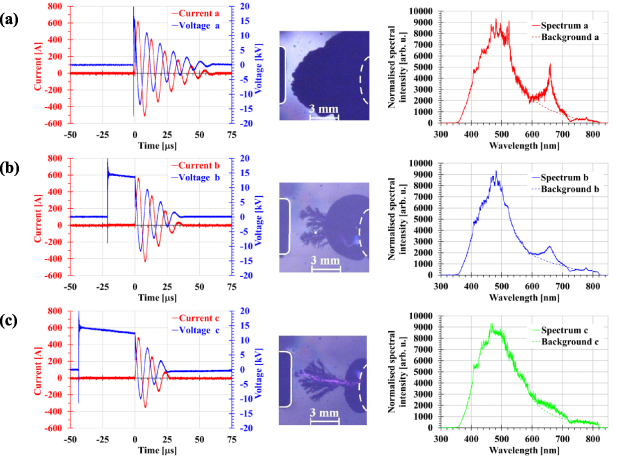
Figure 3. (a) Long delay between bubble injection and voltage application; (b) medium delay; (c) short delay. First column: temporal current and voltage waveforms; second column: shadow images of injected nitrogen bubbles just before breakdown (exposure time 0.4 μs), where the surface of the anode is outlined by a solid white line, and the surface of the cathode is depicted by a dashed white line; third column: spectrum of the spark discharge (exposure time 3 μs). The Hα line can be found in the region around 656.3 nm, and the background (dashed line) was obtained by extrapolation from its neighbourhood. Adopted from [9]. CC BY 4.0.
Download figure:
Standard image High-resolution image4. Analysis of spectroscopic data
4.1. General considerations
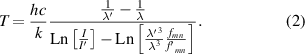
The results presented above (and in [9]) encouraged us to use the Hα line profile (which is clearly discernible in the red part of the visible spectra) as a diagnostic tool for the spark channel. An analysis of spectral lines is usually done in circular frequency ω scale and with subtraction of the background (see figure 4). An error in background determination causes the line asymmetry and hence uncertainty in the fitting of the theoretical profiles to line wings. Negative Δω (= ω−ω0, ω0 is the central circular frequency of the spectral line) correspond to the red wings of the spectral lines, where the background is lower, and hence the preference for fitting is on the negative side of Δω. The first two graphs (discharges (a) and (b)) suggest that the Hα line profiles are better approximated by Lorentzian curves (impact approximation of pressure broadening) than by Gaussian ones (Doppler broadening due to thermal motion of radiating atoms), while the third graph (discharge (c)) shows a part of the spectrum that is too narrow (in comparison with the line width) to decide. A Voigt function (folding of Lorentzian and Gaussian functions) can be distinguished in our environment from a purely Lorentzian one only if the Gaussian width is at least two thirds of the Lorentzian one. This gives ΔωFWHM−Doppler ∼4 × 10¹³ s−1 for discharge type (a), which corresponds to a temperature as high as ∼3 × 10⁸ K ∼26 keV, far above the highest value given for underwater discharges (5.2 × 10⁴ K ∼4.5 eV [15]). This disqualifies the spectral line profiles from being used for temperature determination in the underwater spark channel. The term 'temperature' implies a local thermodynamic equilibrium, which is a prerequisite for its use. In this case, the prerequisite is evidently fulfilled, because the mean free time between collisions of water vapour molecules at 100 °C and atmospheric pressure {∼2.25 × 10⁻¹⁰ s} is much smaller than the investigated time interval of our discharge {∼1 × 10⁻⁶ s}. Knowledge of temperature is essential for: (i) estimating the plasma composition (degree of dissociation, excitation, etc), and the associated types of collisions; (ii) assessing the applicability of various approximations; and (iii) estimating the pressure in the discharge channel. For discharge type (a), we calculated the temperature from the ratio of the intensities I/I' of the two Balmer lines with wavelengths λ, λ', oscillator strengths fmn, f'mn and excitation energy eUm, eU'm [16]:
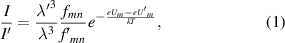

Figure 4. Normalised Hα line profiles with subtracted background, approximating Gauss (Doppler broadening), Lorentz (impact broadening for Van der Waals and resonance interactions), and a high-density nearest neighbour (NN) approximation for both the Van der Waals and resonance interactions curves. The full widths at half magnitude (ΔωFWHM) are also depicted. From top to bottom, the images show discharges (a), (b), and (c).
Download figure:
Standard image High-resolution imagegiving
The line intensity  , where the line spectral intensity Is line(λ) is the measured spectral intensity Is(λ) minus background spectral intensity Is background(λ) {Is line(λ) = Is(λ)—Is background(λ)}, we see that the largest error comes from uncertainty of background determination, and this is namely at Hα
line (due to its largest width).
, where the line spectral intensity Is line(λ) is the measured spectral intensity Is(λ) minus background spectral intensity Is background(λ) {Is line(λ) = Is(λ)—Is background(λ)}, we see that the largest error comes from uncertainty of background determination, and this is namely at Hα
line (due to its largest width).
For IHβ /IHγ , we have
which for discharge (a) gives a value of ∼8000 K. For discharges (b) and (c), the higher members of the Balmer series lines are very small, and are therefore unsuitable for temperature determination. The temperature value given above is higher than indicated in the model [1], but smaller than in all other experiments (for example, Martin [17] measured a value of ∼30 000 K; Robinson et al [15] measured temperatures up to 52 000 K; and Vokurka and Plocek [18] found temperatures between 11 000 and 18 000 K).
On the other hand, since discharges type (b) and (c) need to heat more particles than type (a) for the same driving circuit, we expect that they will have even lower temperatures. To conclude this part, we note that our temperature determination is not extremely convincing. For simplicity, a temperature of 8000 K will be used for the plasma channel in the following numerical calculations, but where possible, the whole assumed temperature range of 2000–25 000 K will be considered.
Pressure broadening is usually classified according to the strength of the interaction causing a frequency change Δω for a radiating particle interacting with a perturbing particle at a radius vector r,

where Cq is the interaction constant, and q is an integer [19]. The most important cases of interaction are: (i) the linear Stark effect {q = 2}; (ii) resonance interaction between identical particles, or interaction between a charged perturber and a quadrupole {q= 3}; (iii) the quadratic Stark effect {q = 4}; and (iv) the Van der Waals interaction {q = 6}. Since our spark discharge burns in a mixture of water vapour (evaporated when streamers/spark pass through a water slab) and nitrogen (the gas used for the injected bubble) {the ratio H2O:N2 differs among the types of discharge, being smallest in type (a) with the largest bubble, and largest in type (c) with the smallest bubble}, the first relevant broadening mechanism is the Van der Waals one {q = 6}. Here, the radiating atom is hydrogen and the perturbers are molecules of water vapour, some products (oxygen) of their dissociation, and molecules and atoms of nitrogen. In this case [19, 20],

with elementary charge e, polarisability αp H2O ∼ 1.44 × 10⁻²⁴ cm3 [21], αp O ∼ 1.57 × 10⁻²⁴ cm3 [21], αp N ∼ 3 × 10⁻²⁴ cm3 [22], the Bohr radius a0, the reduced Planck constant ħ, and the effective principal quantum number n* . Strictly speaking, C6 has a specific value for each radiating atom/perturber pair; fortunately, however, these specific values do not differ greatly, and a medium value seems to be a good compromise. Polarisability has in cgs units dimension cm3, while in SI units dimension kg−1 s4 A2; this is why we use the cgs system in the majority of our calculations.
However, when we look at the temperature dependence of water dissociation at atmospheric pressure and thermal equilibrium (see figure 5; the calculation is similar to that in [23]; at higher pressure, the curves are shifted down and stretched to higher temperatures), it becomes clear that even resonance broadening {q = 3} must be considered. In this case [19],
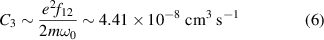

Figure 5. Molar fraction of dissociated water vapour at atmospheric pressure, as a function of temperature. For an increase in pressure, the curves shift down and stretch to higher temperatures.
Download figure:
Standard image High-resolution imagewhere e is the elementary charge, f12 is the oscillator strength of the given transition [24] (a full list of energy transitions contributing to the hydrogen Balmer-alpha line can be found in [25]), m is the mass of the electron, and ω0 is the line central frequency on the ω-scale. Hence, C3 has a specific value for each spectral line.
4.2. Impact approximation: Van der Waals interaction
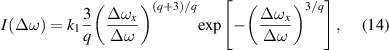
Perturbers passing along a straight line with velocity v by the radiating atom (of a different sort than the perturbers) change the phase of this radiation and broaden the radiating spectrum. In the case of non-overlapping collisions, the broadened line spectrum leads to a Lorentz (dispersion) profile [19, 20]:
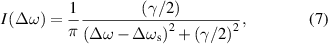
where I(Δω) is the line intensity as a function of the circular frequency deflection Δω from the central point ω0,

is the full width at half magnitude (FWHM) of the given line (on the ω-scale), and

is the shift of the centre of the line ω0 due to collisions (where v is the thermal velocity, and N is the density of perturbers). Note that the ratio γ/Δωs has a constant value of 2.75, and independent determination of these two quantities cannot yield any additional information. Starting with an experimentally determined value of γ for discharges (a), (b), and (c), we can calculate the appropriate particle densities N and pressures p(= N kB T with the Boltzmann constant kB, temperature T) in Pa as well as in atm (physical atmospheres). The results are summarised in table 1.
Table 1. N and p if line broadening is caused only by Van der Waals interaction at low pressures.
| Discharge | (a) | (b) | (c) | |||
|---|---|---|---|---|---|---|
| γ [s−1] | 9.43 × 10¹³ | 1.54 × 10¹⁴ | 2.66 × 10¹⁴ | |||
| N [cm−3] | 1.99 × 10²¹ | 3.25 × 10²¹ | 5.61 × 10²¹ | |||
| p [Pa]/[atm] | 2.20 × 10⁸ | 2.17 × 10³ | 3.59 × 10⁸ | 3.54 × 10³ | 6.20 × 10⁸ | 6.12 × 10³ |
The applicability of this approximation is usually examined with the help of the Weisskopf radius ρW, where

(in our case ∼7 × 10⁻⁸ cm) is the impact parameter of a perturber colliding with a radiating atom which causes a phase shift of radiation 1. The impact approximation is valid if ρW ≪ N−1/3 (mean distance between the particles d; see figure 6). At the same time, the region of applicability is restricted to the interval Δω < v/ρw (inverse duration of one collision) ∼1.9 × 10¹³ s−1 i.e. for the central part of the spectral line profile. Due to this, the pressures determined above are not relevant.
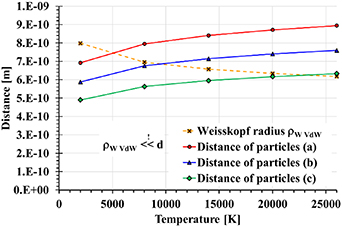
Figure 6. Distance of particles and Weisskopf radius as a function of the discharge channel temperature, calculated in the impact approximation of the Van der Waals interaction.
Download figure:
Standard image High-resolution image4.3. Impact approximation: resonance interaction
Perturbers passing along a straight line with velocity v by a radiating atom (of the same sort as the perturbers) change the phase of this radiation and broaden the radiating spectrum. In the case of non-overlapping collisions, the broadened line spectrum also leads to the Lorentz (dispersion) profile in (7), in which the damping constant γres is

which does not depend on the thermal velocity of perturbers, and hence does not depend on the temperature of the spark channel, and the shift of the line centre Δωs res is

If the experimentally found broadening of the Hα line is caused by the impacts of hydrogen atoms/molecules, their appropriate densities and pressures can be calculated as summarised in table 2.
Table 2. N and p if line broadening is caused only by resonance interaction at low pressures.
| Discharge | (a) | (b) | (c) | |||
|---|---|---|---|---|---|---|
| γ [s−1] | 9.43 × 10¹³ | 1.54 × 10¹⁴ | 2.66 × 10¹⁴ | |||
| N [cm−3] | 4.51 × 10¹⁹ | 7.37 × 10¹⁹ | 1.27 × 10²⁰ | |||
| p [Pa]/[atm] | 4.99 × 10⁶ | 4.92 × 10 | 8.14 × 10⁶ | 8.04 × 10 | 1.41 × 10⁷ | 1.39 × 10² |
Even here, it is essential to test the applicability of this approximation: The Weisskopf radius ρW

must be much smaller than the mean distance between the perturbers (ρW ≪ N−1/3). The reality is shown in figure 7, and it is obvious that even in this case, this approximation is not applicable.

Figure 7. Distance of particles and Weisskopf impact parameter as a function of the discharge channel temperature, calculated in the impact approximation of resonance interaction.
Download figure:
Standard image High-resolution image4.4. High-density—nearest neighbour (NN) approximation: general
In the case of higher densities, the simultaneous action of more perturbers must be considered [19, 20], although their motion is neglected. The simplest case is the one, where the phase shift of the emission of the radiating atom is caused by the nearest perturber. From the probability that this nearest perturber has distance r follows fitting curve to line profile in the form
where (similarly to (4))

is a normal shift corresponding to a mean distance rx of the perturbers. The fitting curve in (14) has two maxima located at

with size

To fit this curve to the experimental profile, we have two degrees of freedom: the amplitude (coefficient k1), and the fitting curve parameter Δωx . During the fitting procedure (see figure 8), we usually try to (i) tie the approximating function in (14) to the end points of the line segment marked 'FWHM a' (the FWHM of the experimental line profile); and (ii) achieve a reasonably good fit to the wings of this line (the approximating function (14) is obscured around the line centre). In practice, we usually search directly for Δωx where I(Δωx ) = (3 k1/q) exp[−1]; care should be taken since this equation has four roots, and only the two outer ones are correct. For the NN approximation, we compared three different fittings (amplitude preference, Δωx preference, no preference), and the standard deviation of density determination was smaller than 15%. Simultaneously, we can find the half width at half magnitude ΔωHWHM and its relation to Δωx :

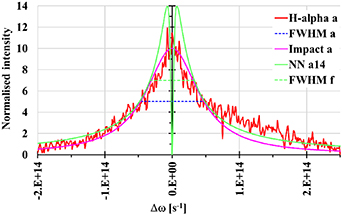
Figure 8. Experimental line profile (background subtracted) normalised to 10 with a 'FWHM a' of 9.43 × 10¹³ s−1, impact approximation (Lorentz curve), and NN approximation (18) with amplitude 14 (illustrative example).
Download figure:
Standard image High-resolution imagewhere f is a specific number for each discharge.
4.5. High-density NN approximation: Van der Waals interaction
The NN approximation for the Van der Waals interaction (q = 6) has a fitting curve in the form
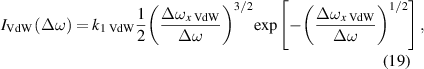
where

Hence,

and the pressure p is then

Our calculations of N and p (where pressure p is evaluated for a temperature T = 8000 K) based on the fitting procedure described above are given in table 3.
Table 3. N and p if line broadening is caused only by Van der Waals interaction at high pressures.
| Discharge | (a) | (b) | (c) | |||
|---|---|---|---|---|---|---|
| ΔωFWHM [s−1] | 9.43 × 10¹³ | 1.54 × 10¹⁴ | 2.66 × 10¹⁴ | |||
| N [cm−3] | 1.43 × 10²¹ | 1.59 × 10²¹ | 2.29 × 10²¹ | |||
| p [Pa]/[atm] | 1.58 × 10⁸ | 1.55 × 10³ | 1.76 × 10⁸ | 1.74 × 10³ | 2.53 × 10⁸ | 2.50 × 10³ |
4.6. High-density NN approximation: resonance interaction
The NN approximation for resonance interaction (q = 3) has a fitting curve in the form
where

Hence,

and the pressure p is then

Our calculations of N and p (where the pressure p is evaluated for a temperature T = 8000 K) based on the fitting procedure described above are given in table 4.
Table 4. N and p if line broadening is caused only by resonance interaction at high pressures.
| Discharge | (a) | (b) | (c) | |||
|---|---|---|---|---|---|---|
| ΔωFWHM [s−1] | 9.43 × 10¹³ | 1.54 × 10¹⁴ | 2.66 × 10¹⁴ | |||
| N [cm−3] | 7.78 × 10¹⁹ | 1.24 × 10²⁰ | 2.03 × 10²⁰ | |||
| p [Pa]/[atm] | 8.59 × 10⁶ | 8.48 × 101 | 1.37 × 10⁷ | 1.35 × 10² | 2.24 × 10⁷ | 2.21 × 10² |
4.7. Linear stark effect
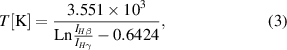
Even in this case we have quasi-static approximation, at which for example quasi-static electric field of stationary ions splits spectral lines of atoms with one valence electron into equidistant components. These are then broadened by an impact effect of much faster electrons. The resulting line profile is a superposition of these broadened components. Fortunately, we needn´t follow this rather complicated theory, in which deflections from Holtzmark field, contribution of 'slow' electrons to quasi-static field, Debye screening, and so on are respected, because Hα line profiles were tabulated in a relatively large range of temperatures and densities in [26]. From these tables we learnt that (1) the temperature dependence is very weak (esp. at low densities), (2) deflections from the Lorentz profiles are relatively small, (3) the half line-width (ΔωHWHM—half width at half magnitude) can be approximated at 10 000 K by the power function

where Ne is density of electrons in cm3. With that we can easily find results summarized in table 5.
Table 5. Ne and pe if line broadening is caused only by Stark effect.
| Discharge | (a) | (b) | (c) | |||
|---|---|---|---|---|---|---|
| ΔωFWHM [s−1] | 9.43 × 10¹³ | 1.54 × 10¹⁴ | 2.66 × 10¹⁴ | |||
| Ne [cm−3] | 6.13 × 10¹⁸ | 1.14 × 10¹⁹ | 2.29 × 10¹⁹ | |||
| pe [Pa]/[atm] | 6.76 × 10⁵ | 6.67 × 100 | 1.26 × 10⁶ | 1.25 × 101 | 2.53 × 10⁶ | 2.50 × 101 |
5. Analysis of additional data
5.1. Measurement of the amplitude of the pressure wave expanding from the discharge channel
As mentioned in section 2, the amplitude of the pressure wave in water (at a distance of 70 mm from the axis of the electrodes) was measured using the Müller-Platte needle probe. The results are shown in table 6. It should be borne in mind that this is only an indirect measurement (the amplitude of the pressure wave falls with distance from the discharge channel).
Table 6. Amplitude of pressure wave.
| Discharge | (a) | (b) | (c) | |||
|---|---|---|---|---|---|---|
| Amplitude of pressure wave [Pa]/[atm] | 1 × 10⁵ | ∼1 | 3 × 10⁵ | ∼3 | 5 × 10⁵ | ∼5 |
| Ratio | (a):(a) | 1 | (b):(a) | 3 | (c):(a) | 5 |
5.2. Shadow images: thermodynamic considerations
To estimate the partial pressures of the water vapour, and the nitrogen in the discharge channel, we consider (in the ideal gas approximation) the following processes: (i) during the first 3 μs (the exposure time of the spectrograph camera), the spark discharge (a) evaporates a water column of the radius R ({we selected R = 0.1 cm—the first free parameter}; the spark discharges (b) and (c) evaporate radii that are proportional to the square root of the energy input in discharges (b) and (c) normalized to energy input to discharge (a) during this time interval) and the length z1 (determined from shadow pictures {see the second column of figure 3}; z1 is a distance between the bubble front and the high-voltage electrode). Hence, the volume V1 of water evaporated in z1 thick water slab (V1 = π R2 z1) is proportional to the energy input during the first 3 μs. From these data, an evaporated water volume per unit length V1u (V1u = π R2) can be calculated. The evaporated water in V1 has partial pressure pV1 H2O. (ii) The bubble volume V2 and the bubble half-contour length z2 are also determined from shadow pictures (second column of figure 3). The spark discharge propagating along the inner wall of the bubble [14] evaporates a volume of water proportional to V1u × z2 with proportionality coefficient η, the second free parameter (we used η∼ 0.5). This evaporated water creates a partial pressure pV2 H2O in V2. The pressures pV1 H2O and pV2 H2O adiabatically balance out (an irreversible process), and also partly penetrate into volume V3 (see below) creating a resulting partial pressure pH2O. (iii) The bubble feeding tube with volume V3 has a constant pressure of nitrogen pV3 N2, and only a small part s (third free parameter, we used s∼ 0.03) of this V3s (V3s = s× V3) takes part in fast pressure changes. (iv) The nitrogen pressure in the bubble pV2 N2 and in the part of feeding volume V3s adiabatically expands to V1, yielding the same value of pN2 for V1, V2, and V3s. (v) The total pressure ptot in V1, V2, and V3s is ptot = pH2O+ pN2. These results are shown in table 7.
Table 7. Thermodynamics—input parameters and resulting partial and total pressures.
| Discharge | (a) | (b) | (c) | |||
|---|---|---|---|---|---|---|
| Dissipated energy E3 μ s [J] | 7.6 | 4.5 | 3.4 | |||
| Radius R [cm] | 0.100 | 0.077 | 0.067 | |||
| Length z1 [cm] | 0.1 | 0.3 | 0.6 | |||
| Bubble volume [cm3] | 0.761 | 0.095 | 0.013 | |||
| Length z2 [cm] | 0.84 | 0.62 | 0.44 | |||
| Feeding tube volume V3 [cm3] | 3.93 | 3.93 | 3.93 | |||
| pH2O [Pa]/[atm] | 3.00 × 10⁶ | 29.60 | 8.33 × 10⁶ | 82.17 | 1.33 × 10⁷ | 131.43 |
| PN2 [Pa]/[atm] | 3.03 × 10⁵ | 2.99 | 2.93 × 10⁵ | 2.89 | 2.78 × 10⁵ | 2.75 |
| Ptot [Pa]/[atm] | 3.30 × 10⁶ | 32.59 | 8.62 × 10⁶ | 85.06 | 1.36 × 10⁷ | 134.18 |
| Ratio | (a):(a) | 1.00 | (b):(a) | 2.61 | (c):(a) | 4.12 |
6. Discussion
The amplitude of a pressure wave (see section 5.1) is related to the pressure in the discharge channel indirectly: it depends not only on the deposited energy, but also on the deposited power (i.e. how fast the energy is deposited). However, if we assume that the energy input is roughly the same for all types of discharge, the ratio of their amplitudes can give us an idea of the pressure ratios in the discharge channel. A Müller-Platte needle probe measures the piezoelectric charge generated on polarised polyvinylidenefluoride at the arrival of the pressure wave; this polarisation is very stable, not only according to the manufacturer, but also to other authors (e.g. [27]), and no aging was observed.
Thermodynamic estimates (see section 5.2) were based on the ideal gas approximation, which may not be appropriate, especially at high pressures. Next, dynamic effects were taken into account only partly: it was assumed that fast changes took place only in the volumes V1, V2, and V3s (meaning that water vapour penetrated into only a small part of the feeding volume V3). The adiabaticity of the expansion processes was also an approximation. Finally, the initial radius of the plasma channel (which determined how much water was evaporated) was not known. This last drawback turned out to be an advantage, as it became a free parameter that, along with two other free parameters, helped us adjust the plasma composition within narrow limits. This allowed us to ensure that the pressure in the plasma channel monotonically increased from type (a) to type (c) in a manner consistent with the measurements yielded by the pressure probe.
An analysis of the pressure broadening of the Hα line profile offers two approximations. The comparison (presented in sections 4.2 and 4.3) of the mean distance of particles (perturbers) with the Weisskopf radius shows that the impact approximation could be considered for neither the Van der Waals nor the resonance interactions. Hence, a high-density NN approximation (see sections 4.5 and 4.6) was used with both the Van der Waals interaction (a hydrogen atom perturbed by oxygen atoms from water molecules and nitrogen atoms from the bubble filling gas), and the resonance interaction (a hydrogen atom perturbed by hydrogen atoms) in play. Since there was no other tool at hand to determine the ratio of these two effects, we used the partial pressures of the water vapour molecules and nitrogen molecules from table 7 to estimate their contributions. Since this moment we must approximate all the profiles by the Lorentz curves and use the fact that the convolution of two Lorentz profiles is also the Lorentz profile with the FWHM equal to the sum of the full widths at half magnitudes of both components. Combining equations (18), (21), and (25) gives
where Nn is the density of neutral particles provided that the broadening is caused only by them, and dres, dVdW are coefficients inferred from the relative element densities responsible for resonance (hydrogen) and Van der Waals (oxygen and nitrogen) broadening (in the NN approximation). The fitting procedure is relatively sensitive: the density part ascribed to resonance broadening is proportional to ΔωHWHM res/C3, while the density part ascribed to Van der Waals broadening is proportional to {ΔωHWHM VdW/C6}1/2. Table 8 (based on an optimised choice of plasma channel radius for discharge (a), as specified in table 7) presents respective densities/pressures.
Table 8. Hα line broadening caused by the neutral particles only.
| Discharge | (a) | (b) | (c) | |||
|---|---|---|---|---|---|---|
| ΔωFWHM [s−1] | 9.43 × 10¹³ | 1.54 × 10¹⁴ | 2.66 × 10¹⁴ | |||
| N [cm−3] | 5.84 × 10²¹ | 6.37 × 10²¹ | 9.18 × 10²¹ | |||
| p [Pa]/[atm] | 6.45 × 10⁷ | 6.36 × 10² | 7.03 × 10⁷ | 6.94 × 10² | 1.01 × 10⁸ | 1.00 × 10³ |
| Ratio | (a):(a) | 1.00 | (b):(a) | 1.09 | (c):(a) | 1.57 |
For inclusion of the Stark effect into broadening mechanisms we must determine, which fraction of the line width belongs to broadening by neutral/charged (electrons and ions) particles. Even in this case we approximate both profiles by the Lorentz curves; hence, the resulting line-width is the sum of line-widths of addends. Thus, we plot (see figure 9) the density of neutrals Nn responsible for broadening to a row of fractions of the experimentally determined half-width of the Hα line. Supposing, that these fractions alongside mean the degree of ionization α, we can even plot the density of electrons Ne (derived from α). Finally, in the same graph we plot the number of electrons Ne responsible for complementary fraction of the half-width of the Hα line—as derived from the Stark effect. Where both Ne curves cross, there is a fraction of the half-width of the Hα line attributed to neutrals and complementary fraction attributed to electrons and ions (see figure 9). The numerical results for discharges (a), (b), and (c) are summarized in table 9.
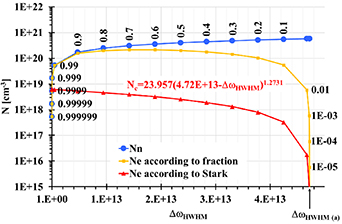
Figure 9. Density of neutrals Nn, and density of electrons Ne as derived from (1) a row of discrete fractions (see point captions at Nn and Ne curves) of the half-width of the Hα line, (2) complementary fraction of the half-width of the Hα line—as derived from the Stark effect. Discharge type (a) with the ΔωHWHM = 4.72 × 10¹³ s−1.
Download figure:
Standard image High-resolution imageTable 9. Hα line broadening caused by the neutral as well as charged (electrons and ions) particles.
| Discharge | (a) | (b) | (c) | |||
|---|---|---|---|---|---|---|
| ΔωFWHM [s−1] | 9.43 × 10¹³ | 1.54 × 10¹⁴ | 2.66 × 10¹⁴ | |||
| N [cm−3] | 1.07 × 10¹⁹ | 3.53 × 10¹⁹ | 5.00 × 10¹⁹ | |||
| p [Pa]/[atm] | 1.18 × 10⁶ | 1.17 × 101 | 3.90 × 10⁶ | 3.85 × 101 | 5.51 × 10⁶ | 5.44 × 101 |
| Ratio | (a):(a) | 1.00 | (b):(a) | 3.30 | (c):(a) | 4.66 |
It turns out that the dominant role in the Hα line broadening plays the Stark effect. However, the non-negligible contribution of neutral particles adopts the ratios of the calculated pressures to the ratios of amplitudes of pressure wave propagating from the discharge channel and measured by pressure probe. In absolute values the pressure in the discharge channel calculated from the Hα line broadening is about ten-times higher than the amplitude of pressure wave. This is also reasonable, because amplitude of pressure wave falls with distance from the discharge channel.
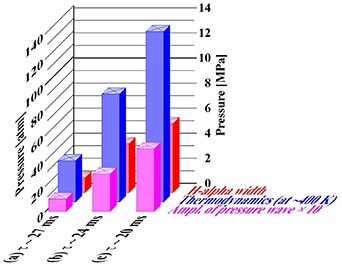
The survey of results of individual measurements/calculations is shown figure 10.
Figure 10. Pressure in three types of discharge: (a) delay τ ∼ 27 ms between bubble injection and voltage application; (b) delay τ ∼ 24 ms; (c) delay τ ∼ 20 ms, as yielded by various types of measurements/calculations/estimates. Numerical values are given in tables 6, 7 and 9.
Download figure:
Standard image High-resolution image
7. Conclusion
Finally, we can conclude the following. (i) A large delay between bubble injection and voltage application {in the plane-to-plane electrode geometry} results in easy switching, but a small initial pressure in the discharge channel. The smaller the delay is, the smaller is the bubble injected prior to voltage application, the more difficult is the breakdown, but the higher is the initial pressure generated in the discharge channel. (ii) In the case of additional gas admixture (e.g. nitrogen injection), an additional tool is necessary to determine its fraction. (iii) Despite some uncertainties (caused by unknown composition of the gas mixture and by the degree of ionization), it seems to us that the pressure inferred from Hα line broadening is fairly plausible, although we do not have enough information to estimate an error.
Acknowledgments
This work was performed under the auspices and with the support of the Ministry of Education, Youth, and Sports of the Czech Republic (INTER-EXCELLENCE/Inter-COST contract LTC20061), of the Grant Agency of the Czech Republic (Contract GA18-12386S), and of COST (European Cooperation in Science and Technology (contract TUMIEE CA17126)).
Data availability statement
All data that support the findings of this study are included within the article (and any supplementary files).
Conflict of interest
The authors have no conflicts to disclose.
Ethical statement
No procedures performed in this study involved human/animal participants.