1. Introduction
In Atlantic salmon (
Salmo salar) populations, repeat spawners may make up a variable, but significant proportion of the total spawning fish biomass and egg deposition [
1,
2,
3]. Repeat spawners are generally larger and more experienced than maiden spawners, which translates into comparatively higher fecundity [
4,
5] and thus, a larger contribution per capita to population growth. Modeling studies have shown that repeat spawners may have an important buffering and stabilizing effect on Atlantic salmon populations [
6] and that kelt (i.e., post-spawning salmon) survival can be a significant factor for long-term population persistence [
7].
Despite the large energy demands entailed by upstream migration and spawning, Atlantic salmon generally do not feed during this phase of their spawning migration (e.g., [
8]). Post-spawning, Atlantic salmon kelts can resume some feeding whilst in-river [
9], but given the size of available prey items relative to kelt size in most salmon rivers, their ability to restore their energy reserves before returning to sea is very low. Therefore, post-spawning, kelts are energetically depleted [
10], and need to return to sea for foraging in order to survive and return as repeat spawners. A study indicated that even slight increases in overall depletion of energy reserves leads to highly increased mortality of these kelts [
11]. Therefore, unobstructed river connectivity from spawning areas to the ocean is crucial for survival of the individual kelt and potentially for long-term persistence of local populations as increased mortality can compromise the bet-hedging breeding strategy leaving the population vulnerable to seasons with reproductive failure.
Many salmon rivers are affected by anthropogenic constructions, such as hydropower plants (HPPs) and associated structures (e.g., intake, dam and impounded river stretches) that inherently alter natural conditions and interrupt river connectivity. These structures may constitute barriers to both up- and downstream migration, and hamper or completely block passage for shorter or longer periods [
12,
13,
14,
15,
16]. Such structures can be detrimental to salmon kelt survival both directly and indirectly [
17]. During downstream migration, kelts can go through the turbines causing severe cuts and lesions and ultimately death. Additionally, visual observations of energy-depleted kelts entrained on trash racks or struggling to maintain body equilibrium and fight the current in front of trash racks at turbine intakes are common. However, little is known about kelt behavior in the impounded areas of the river, where directional current is more or less obliterated and the hydraulic conditions resemble a lake rather than a river. In these areas, salmon kelt (as well as other lotic fish species) can get disoriented and unable to negotiate the area and locate the bypass due to lack of current based directional guiding, thereby delaying their onward migration. Such delays might result in additional energy depletion of the kelts before they can reach the ocean and resume feeding, which in turn can be fatal for the individual kelt and thus stability of the local population. Besides the basic metabolism, the kelts might spend an excess amount of energy if they are actively searching for a passage opportunity. Delays in migration caused by HPP facilities have been associated with reduced passage success [
17], and may be a significant factor for kelt survival.
Whereas overall survival, delay duration and passage routes of salmonid kelts negotiating hydropower facilities have previously been studied [
17,
18,
19], knowledge of detailed kelt behavior and thus activity based energy expenditure is scarce or non-existing. Such knowledge is crucial to fully understand the impact of anthropogenic fragmentation of rivers. Knowledge of kelt behavior is also important to facilitate scientific based advice on, for example, design and operation of hydropower facilities, in particular on water intake area, bypass options and bypass flow regime.
In this study, we aimed at quantifying activity-based energy expenditure of kelt upstream of the Bjørset dam in a regulated river (the River Orkla, Norway) and relating it to the overall energetic status of the kelts. This was achieved by combining high-resolution 3D telemetry tracking of kelts, an energetic model including swimming speed, and a detailed 3D hydraulic model of the study area. This multi-disciplinary approach allowed us to estimate kelt energy expenditure based on detailed movement trajectories while accounting for effects of water flow direction and velocity.
2. Materials and Methods
2.1. Study Site
The study was carried out on the River Orkla in Central Norway (63°03′ N, 9°40′ E), which is designated as a national Norwegian salmon river. The mean annual discharge is ca. 72 m
3s
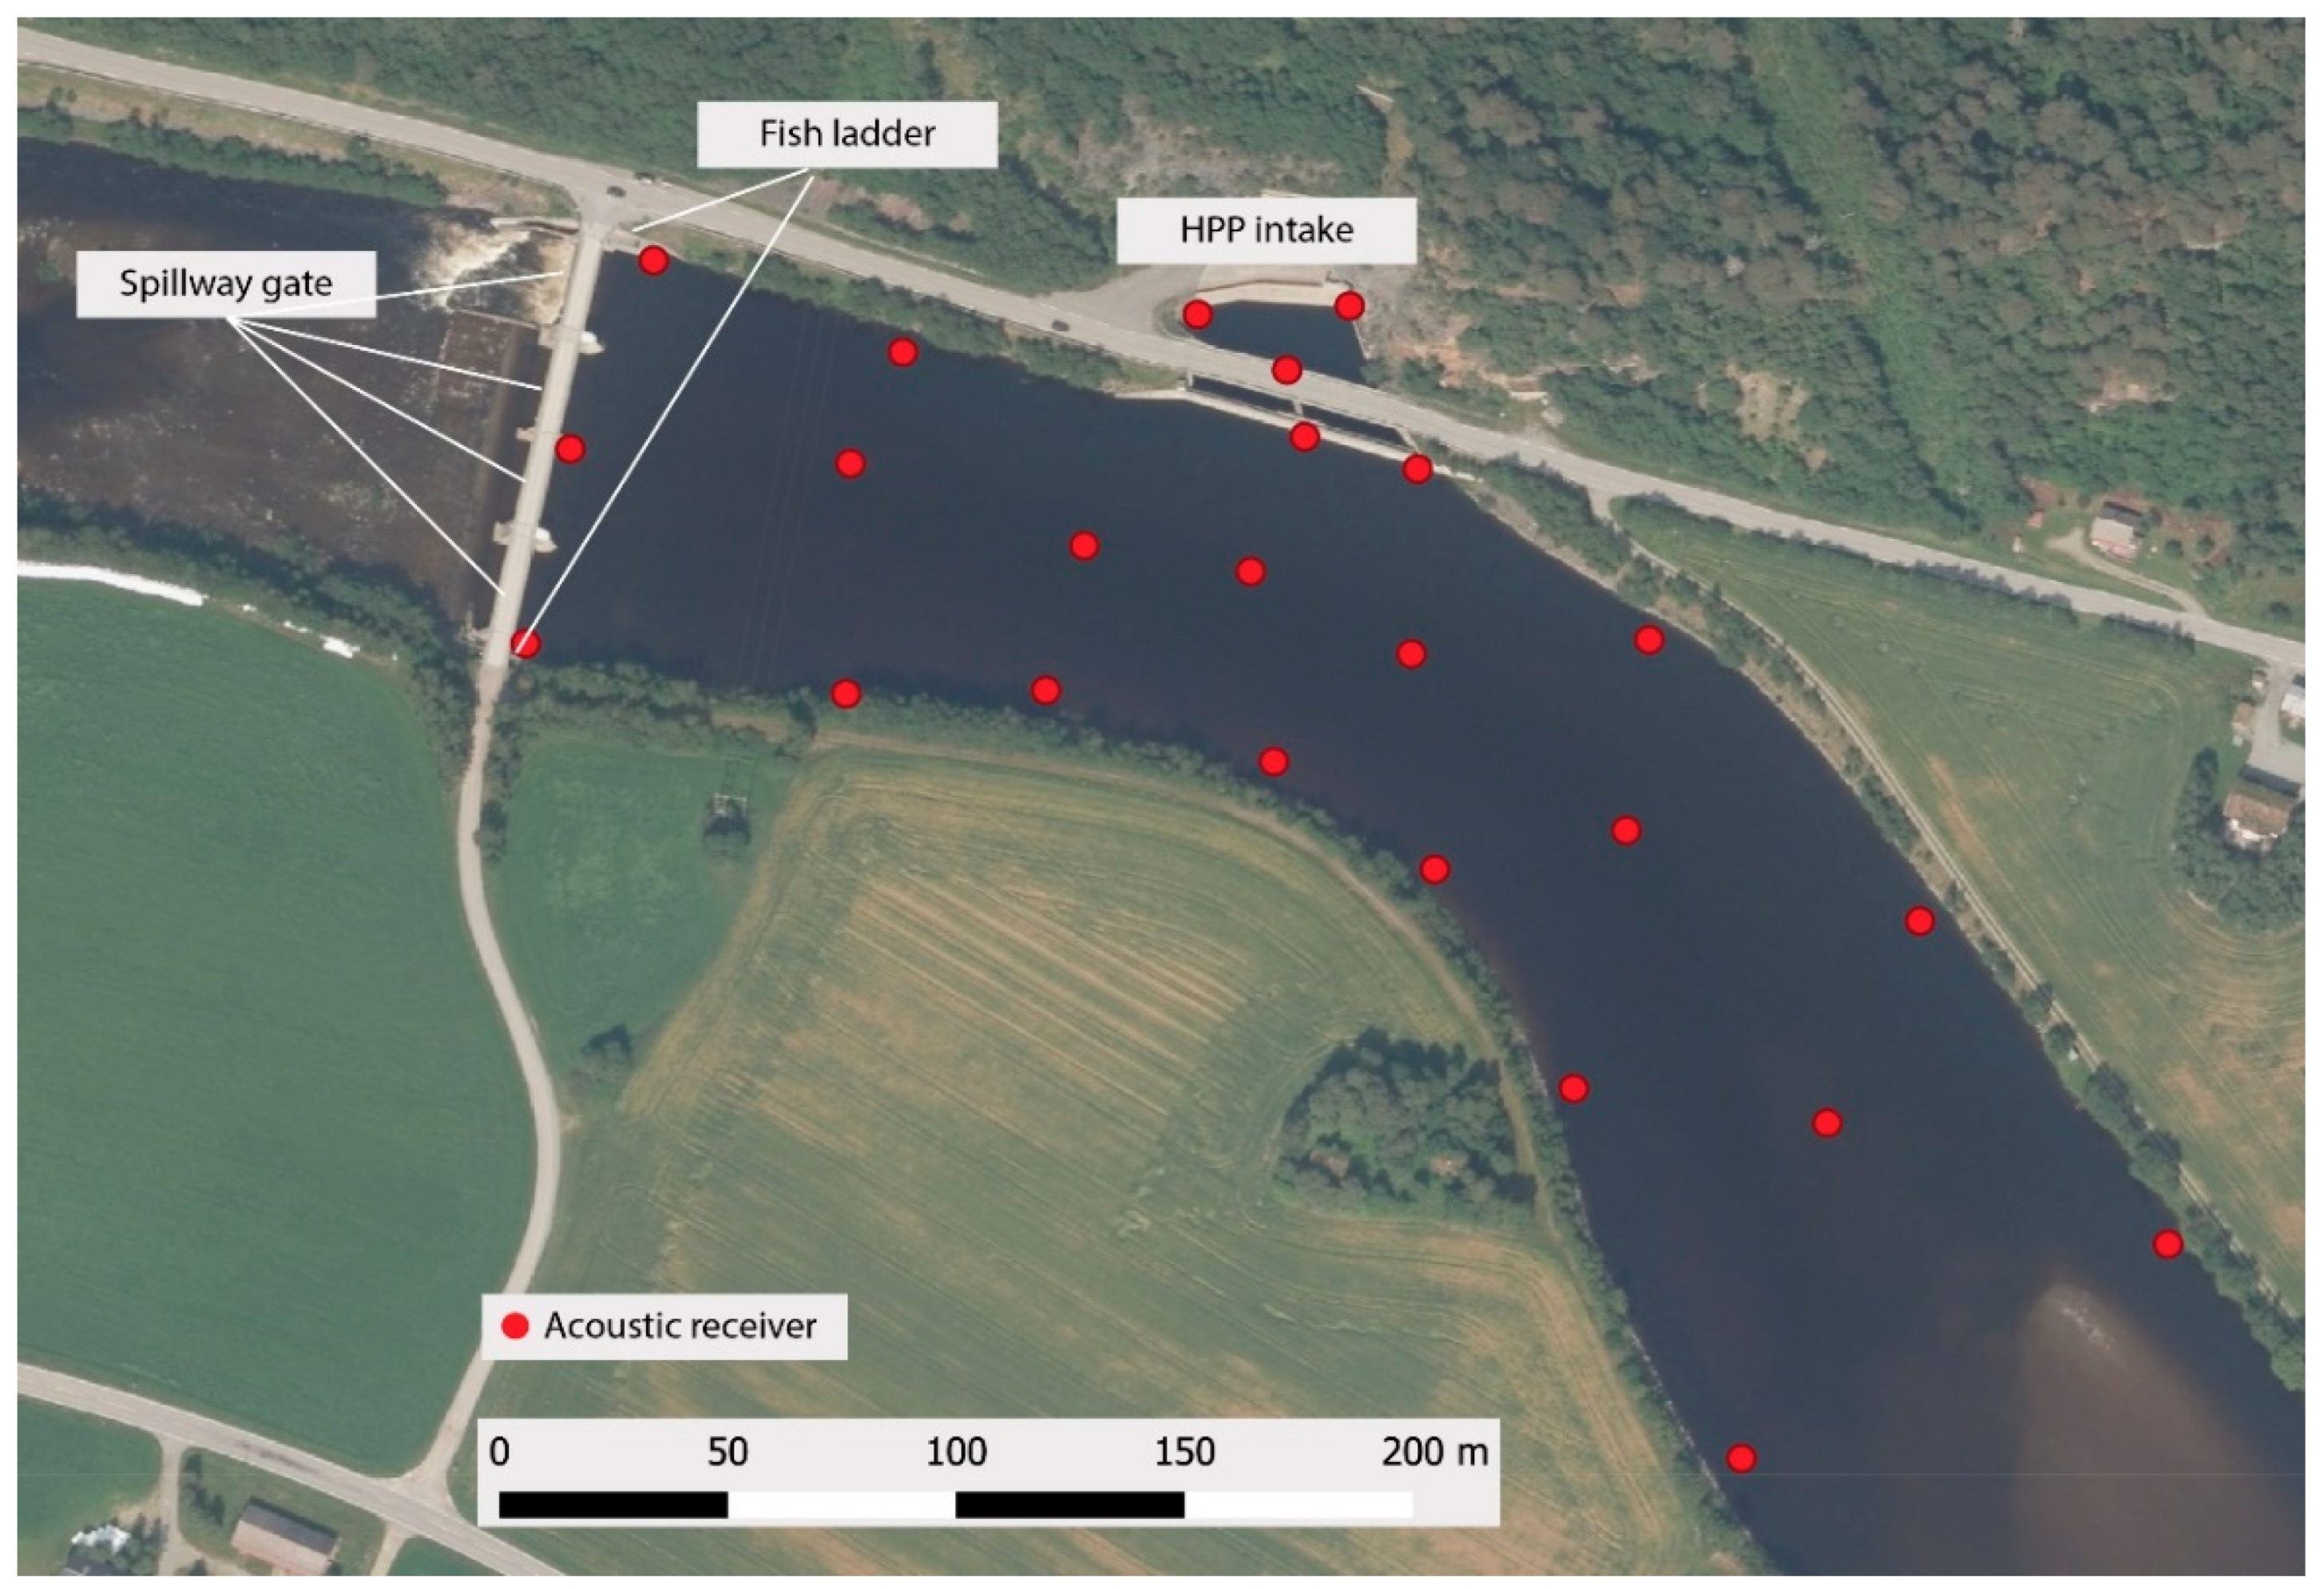
–1. River connectivity is fragmented by several HPPs, however fish have particular difficulties negotiating the lowermost intake where water is directed to the Svorkmo HPP. The impounded section is controlled by the Bjørset dam located 100 m downstream of the Svorkmo intake tunnel. The dam consists of four spillway gates controlling the overall river flow regime at the site. One of these is open from May 1st each year to release a minimum flow following operational legislations. Additionally, the dam contains two fish ladders, positioned at the northern and southern end of the dam. During winter, all spillway gates are closed and only 4 m
3s
–1 water is released downstream through the northern fish ladder. Water withdrawal towards the HPP typically varies between 20 and 55 m
3s
−1 through the intake tunnel. Entrance to the intake area is covered by an offset concrete wall with two submerged openings (1.5 m × 25.8 m each; approximately 2.2 m below the surface), constructed to prevent ice, debris and salmonid smolts from entering the HPP. Immediately in front of the intake, a trash rack is installed. See Szabo-Meszaros et al. (2019) [
16] for further details on the study site.
2.2. Fish Tagging and Tracking
An array of 24 autonomous acoustic receivers (WHS3250, 76 kHz, Lotek Wireless Inc., Newmarket, ON, Canada) were deployed to enable high-resolution 3D tracking of tagged kelts (
Figure 1). All receivers were kept at fixed positions by either mounting them to solid structures such as concrete walls or attaching them to weighted cross-like structures placed on the river floor. Receivers were positioned using a GNSS receiver (Trimble Geo7x) with a VRS-service providing 2 cm accuracy (CPOS-service from the Norwegian Mapping Authority). To allow for post-process synchronization of the receiver array, each receiver emitted a uniquely identifiable signal every 45 s using an internal transmitter. The receiver array was functional from 16 April 2016 to 1 June 2016.
Fifty Atlantic salmon kelts were caught by local anglers using rod and reel during April 2016 at the study site (N = 16) or on the river stretches 0.8–10.5 km upstream (N = 34). Upon capture, each kelt was anesthetized (0.7 mL 2-phenoxyethanol per liter water, mean time in anesthetic bath 2 min 12 s), length measured to nearest centimeter and mass measured to nearest 0.1 kg. An acoustic transmitter with on-board pressure sensor (Lotek MM-M-11-28-PM (76 kHz), 12 × 65 mm, 5.6 g in water, Lotek Wireless Inc., Newmarket, ON, Canada) was inserted into the body cavity through an incision. The incision was closed using two sutures (Ethicon Perma-hand, 5-0/FS-2). During surgery, kelts were kept in an anesthetics maintenance flow at half concentration (i.e., 0.35 mL 2-phenoxyethanol per liter water). The kelts were allowed to recover fully before being released back into the river. All tagged kelts were released at the same location they were caught. All handling and tagging were conducted according to the Norwegian regulations for treatment and welfare of animals (FOTS ID 8406).
Movement trajectories of tagged kelts were estimated based on detections by the receivers using the framework of Yet Another Positioning Solver [
20] implemented in R package YAPS following the procedure outlined in Baktoft et al. (2019) [
21]. YAPS has been shown to perform very well in acoustically challenging environments such as HPP intake areas [
20,
22]. Kelts were not necessarily detected continuously in the study area as they could utilize the upstream stretches of the river beyond receiver detection ranges and they could pass the area in downstream direction through the fish ladder to continue their migration. In situations where the kelts moved upstream of the receiver array, the estimated trajectories were fragmented.
2.3. Hydraulic Modelling
Simulations of the complex flow environment were performed using OpenFoam [
23] computational fluid dynamics (CFD) on a digital model of the study site. The digital model extended to approximately 700 m upstream of the Bjørset dam and was bounded by the river bottom and by the hydropower structures (intake channel and dam with spillway gates and fish ladder). For detailed information about the hydraulic modeling approach and setup, see Szabo-Meszaros et al. (2019) [
16].
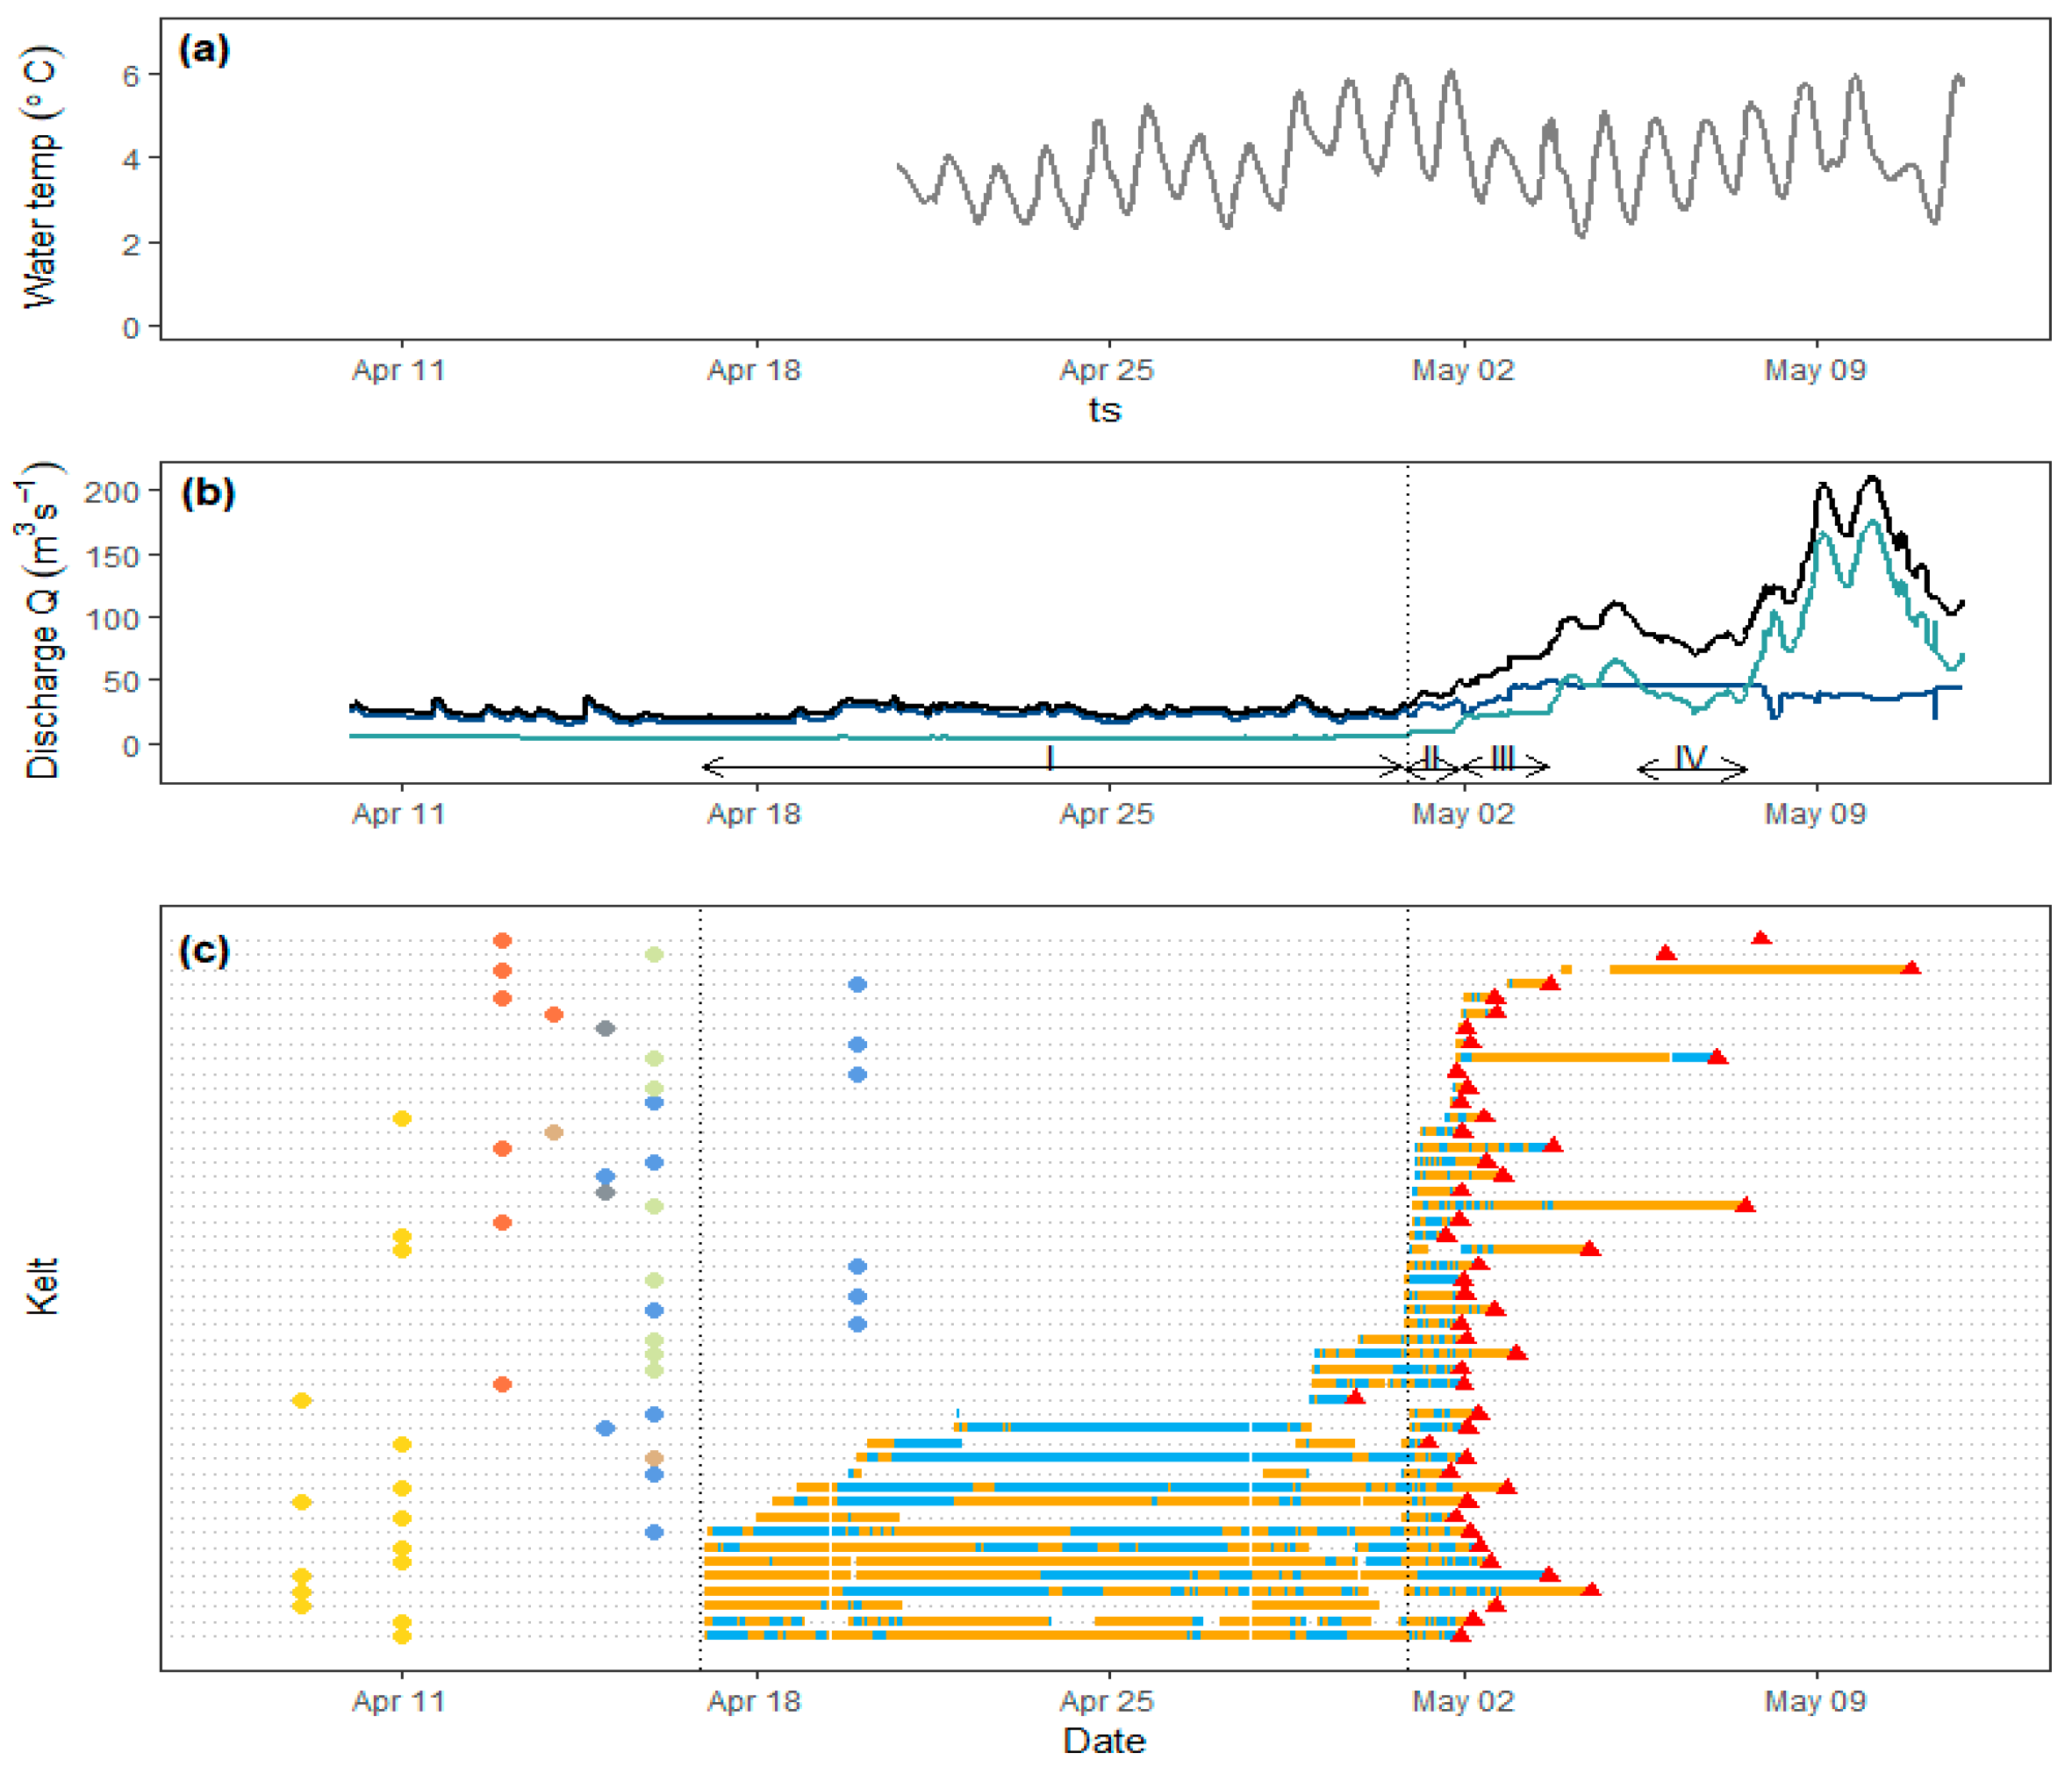
Four different scenarios were selected to represent the temporal changes in water flow regime at the study site (
Figure 2 and
Figure 3;
Table 1). Specification and selection of the four scenarios was based on two prioritized parameters: the number of tagged kelts present in the area and the dam operation scheme (discharge through the HPP versus discharge through the spillway gates and fish ladder). Scenario I represents late winter conditions, when a majority of the river discharge was diverted to the HPP and only 4.0 m
3s
−1 was allowed through the fish ladder. Scenarios II and III represent a sudden change in both river discharge and dam operation in two steps as by 1st of May at least one gate was opened to release minimum discharge over the dam following local regulations. Scenario IV represents a situation characterized by high river discharge and a comparable amount of water going through the HPP and through the spillways (Q
dam/Q
tunnel = 0.85). Combined, these four scenarios cover the hydraulic conditions for 95% of the total time tagged kelts spent at the study site during the study period.
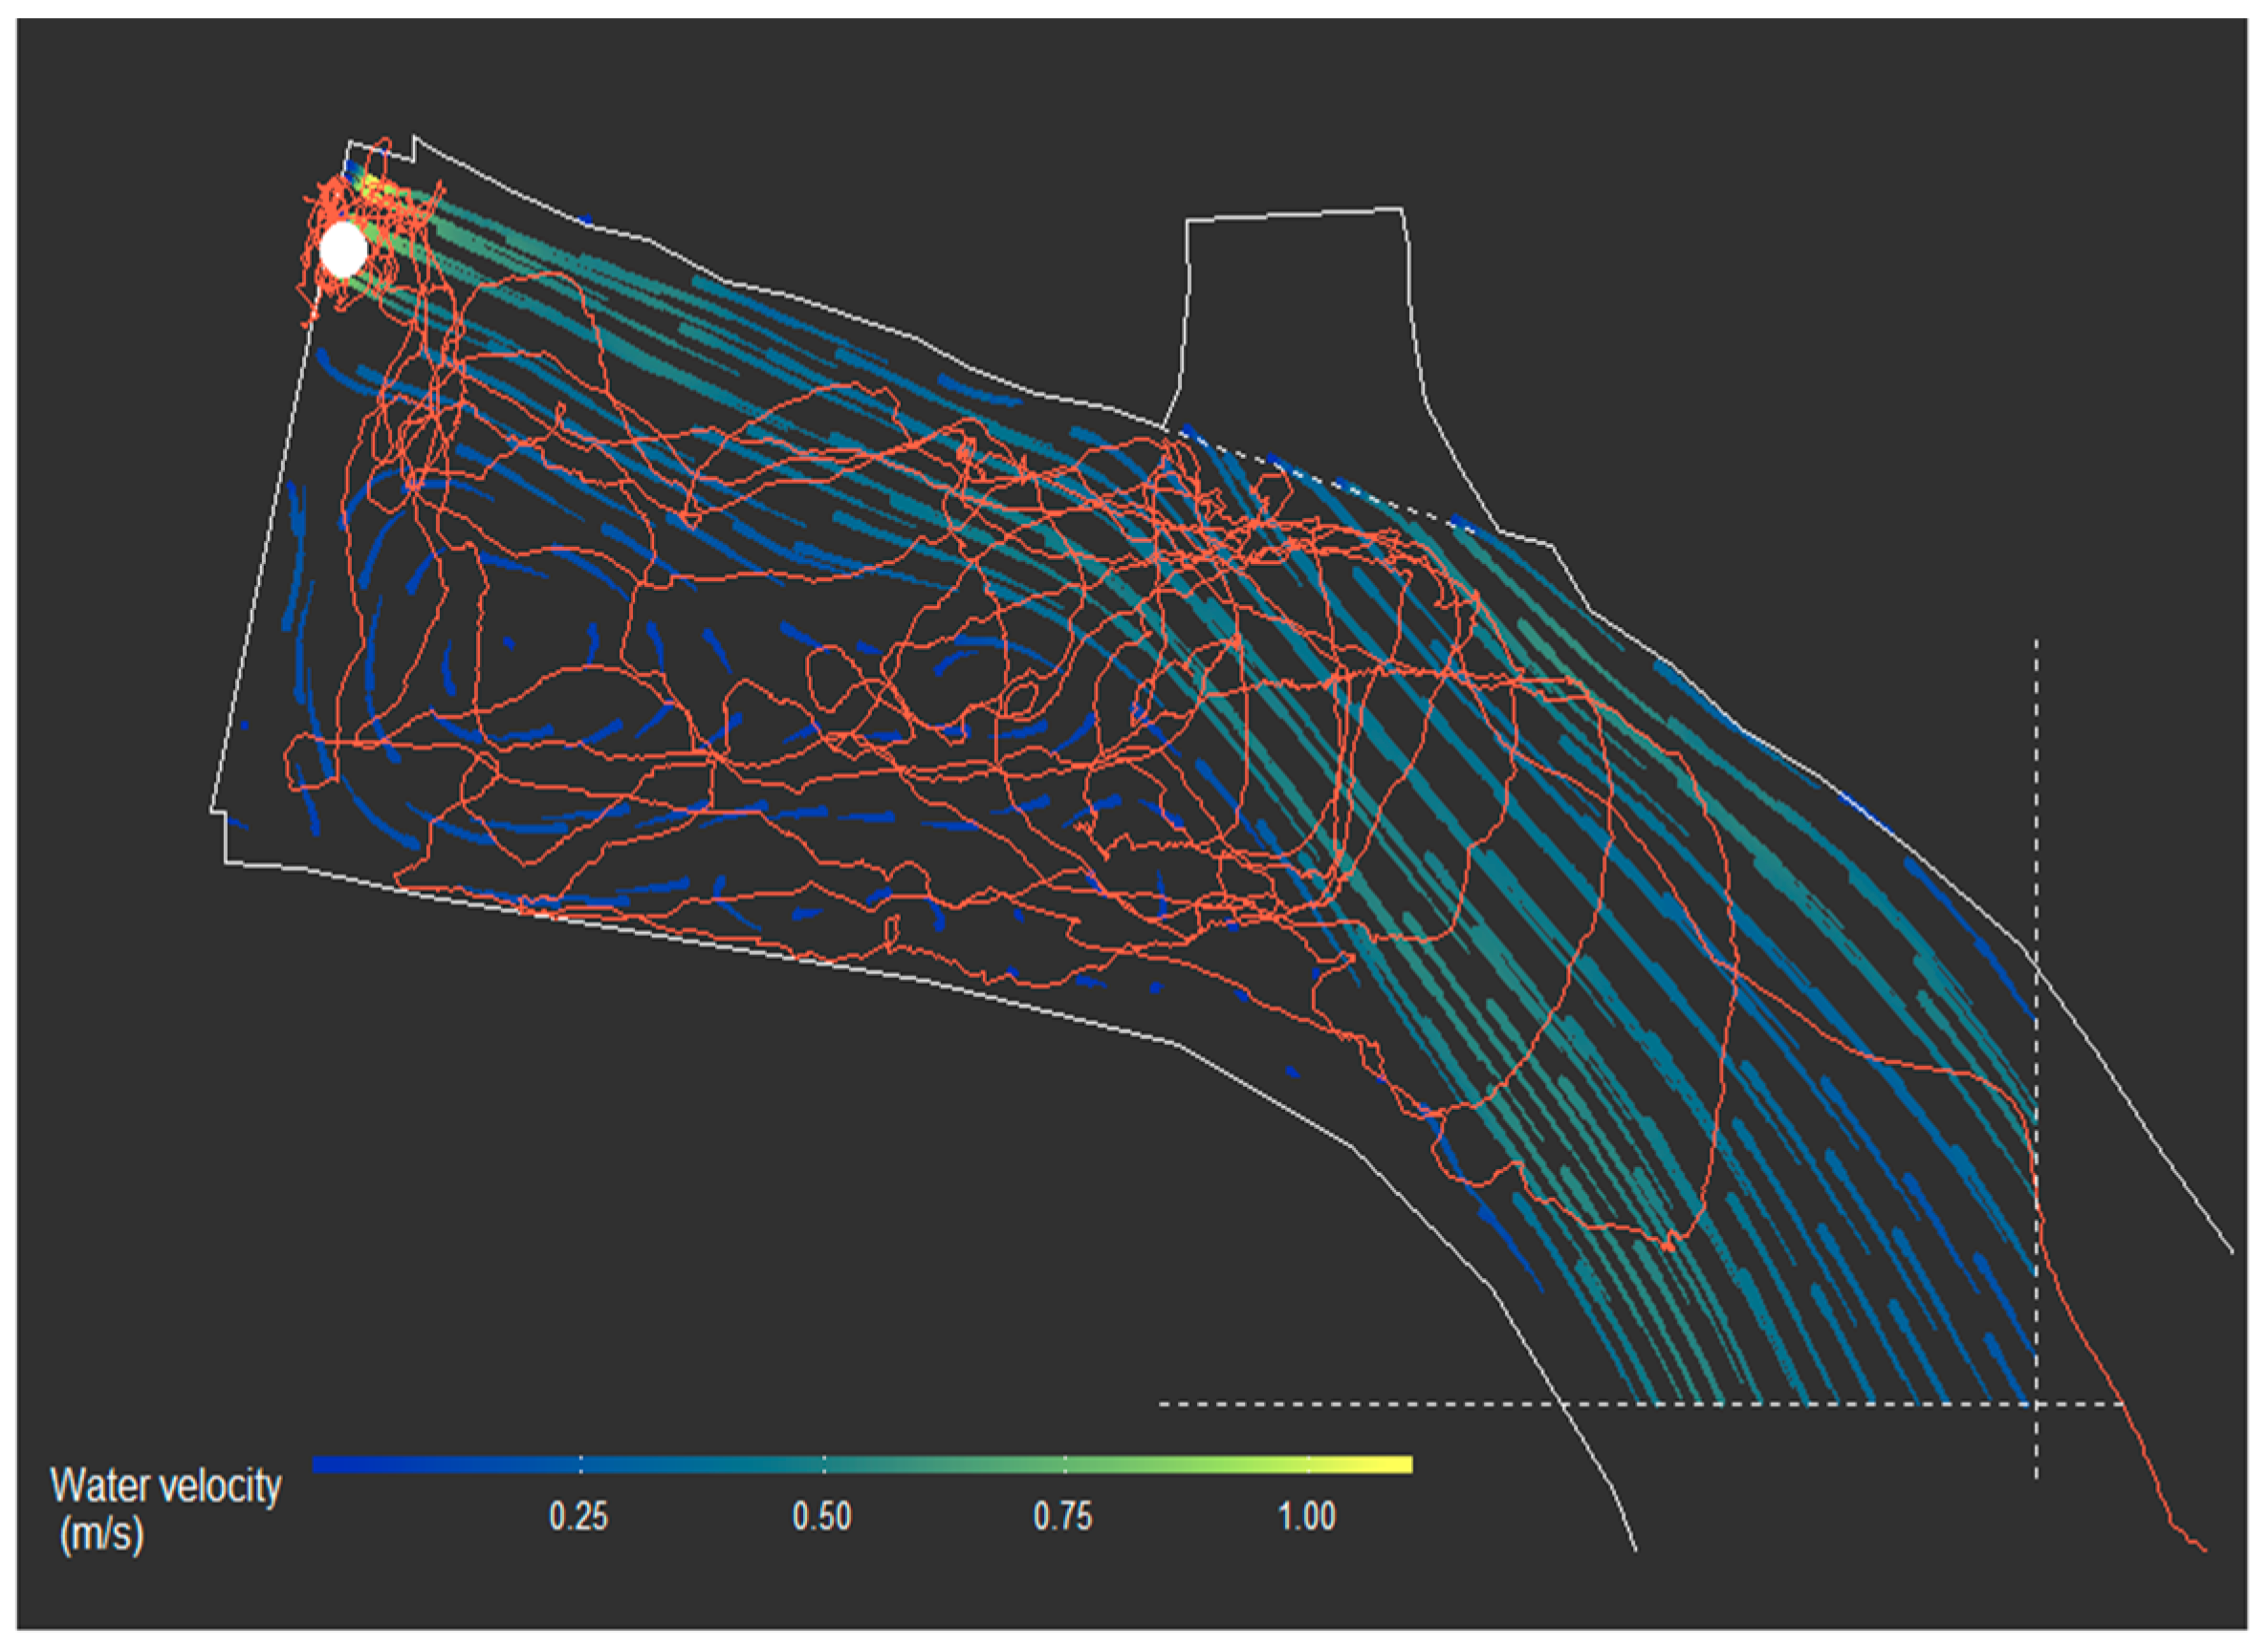
For each of the four scenarios, water velocity vectors were sampled from the hydraulic model simulations on a predefined grid with 1 × 1 m resolution in the horizontal plane at multiple depths with 0.25 m intervals below the surface. Using these grids, each position in the estimated kelt tracks was assigned the temporally relevant water velocity vectors corresponding to the 3D fish position.
Simulations of the hydraulic model were carried out using the pimpleFoam utility of the OpenFOAM software for CFD applications [
23].
2.4. Energetic Models
To enable quantification of movement based energy expenditure, we used already established equations for temperature and movement specific oxygen consumption in adult Atlantic salmon to construct a single unified model describing oxygen consumption as a function of water temperature, fish size and swimming speed. Using six separate equations for specific Atlantic salmon sizes (63.5 cm, 89.0 cm and 119.0 cm) and swimming speeds (0 bl s
−1, 0.5 bl s
−1, 0.7 bl s
−1 and 1.0 bl s
−1) presented in Lennox et al. (2018) [
24], we created an artificial data set covering relevant ranges of water temperature (0–20 °C), fish sizes (63.5–119.0 cm) and swimming speeds (0–1 bl s
−1). Based on this data set, we developed the following model through an iterative model selection process:
This model assumes that oxygen consumption (MO
2; unit mgO
2 kg
−1 min
−1) is normally distributed with mean
µ and variance σ
2. Furthermore, the model states that the expected oxygen consumption of a kelt with total body length L
T, swimming at a speed of
BLs body lengths per second in water with a temperature of T degrees Celsius is given by the predictor function
µ. Oxygen consumption estimates obtained using our unified model correspond very well to estimates based on the original six separate equations established in Lennox et al. (2018) [
24] (Pearson correlation: 0.98). The model was developed in a Bayesian framework using JAGS [
25] and the R package R2jags [
26]. Uninformative priors were used for all estimated parameters. Three chains of 100,000 iterations, thinning rate of 10 and a burn-in of 10,000 were used. All chains showed good mixing. See
Supplementary Material S1 for additional details.
To enable quantification of the energy consumption relative to total kelt energy content, length dependent total energy content of the tagged kelts pre- and post-spawning were estimated using equations established in Jonsson, Jonsson and Hansen (1997) [
11]. Specifically, Jonsson, Jonsson and Hansen (1997) [
11] found that pre-spawning total energy content (E
T,pre-spawn; kJ) of Norwegian Atlantic salmon could be estimated from body length as:
Similarly, we used the following equation from Jonsson, Jonsson and Hansen (1997) [
11] to obtain estimates of post-spawning total energy content (E
T,post-spawn; kJ):
2.5. Hourly Energy Expenditure
To allow estimation of kelt movement through water, only estimated kelt positions within coverage of the hydraulic model were included in analyses of hourly energy expenditure. Furthermore, kelt movement trajectories were split into 10 min sequences and only sequences where at least 95% of all potential positions were available and within coverage of the hydraulic model were included in the analyses. Within each 10 min trajectory sequence, we estimated instantaneous 2D kelt over ground swimming speed vector components (ΔX
og; ΔY
og) for each position (except the last in each sequence) as:
In which X and Y are estimated kelt positions and ToP is the estimated time of ping, in other words, time of signal transmission. Using these, we estimated 2D kelt movement speed through water by accounting for water velocity as:
In which u
s and v
s are the flow velocity components in x and y, respectively, obtained from the hydraulic model for the temporally relevant scenario s. Subsequently, instantaneous movement speed through water measured as body lengths per second (BLs
tw) was calculated by dividing by kelt total length L
T:
Values for BLs
tw were then used in our model for oxygen consumption to obtain instantaneous oxygen consumption (MO
2,n) for each estimated position. To avoid extrapolating beyond the maximum swimming speed used to construct our unified energy consumption model, values of BLs
tw higher than 1 bl s
−1 were truncated to 1 bl s
−1. However, kelts were rarely observed swimming at speeds above 1 bl s
−1 (<1% of observations). Based on these individual and sequence specific values for oxygen consumption, we then calculated expected average hourly energy consumption for each ten minute sequence as:
where W
kelt is mass of the kelt (in kilograms) at time of tagging. The constant is a factor converting oxygen consumption to energy in kilojoules based on the caloric conversion factor used in Lennox et al. (2018) [
24]. Finally, n is total number of observations in each sequence. Thus, for all 10 min trajectory sequences included in this analysis, we obtained an estimate of average energy consumption per hour. To generalize this to a kelt length specific population level estimate of energy consumption, we used the following simple linear mixed effect model:
This model assumes that the expected mean energy consumption per hour (E
mean, hour) is normally distributed with mean µ
E and an exponential variance structure (σ
E2 × exp(2 × δ × L
T)) modeling variance of the residuals as a function of kelt total length (L
T), thereby allowing heterogeneity in the residuals. Parameters σ
E and δ are estimated. This variance structure was included as preliminary analyses suggested that heterogeneity of model residuals increased as a function of kelt total length. Furthermore, comparison of AIC (Akaike information criterion) values for models with and without the exponential variance structure clearly supported inclusion (ΔAIC = −129). The linear predictor function (µ
E) is defined as the sum of a common intercept (α), an effect of kelt total length (L
T) modeled as a continuous covariate and kelt is modeled as a random effect with mean zero and variance σ
a2 to account for repeated measures on each kelt. This model was fitted using the R package nlme [
27]. Model assumptions were validated using visual inspection of model residuals following Zuur et al. (2009) [
28].
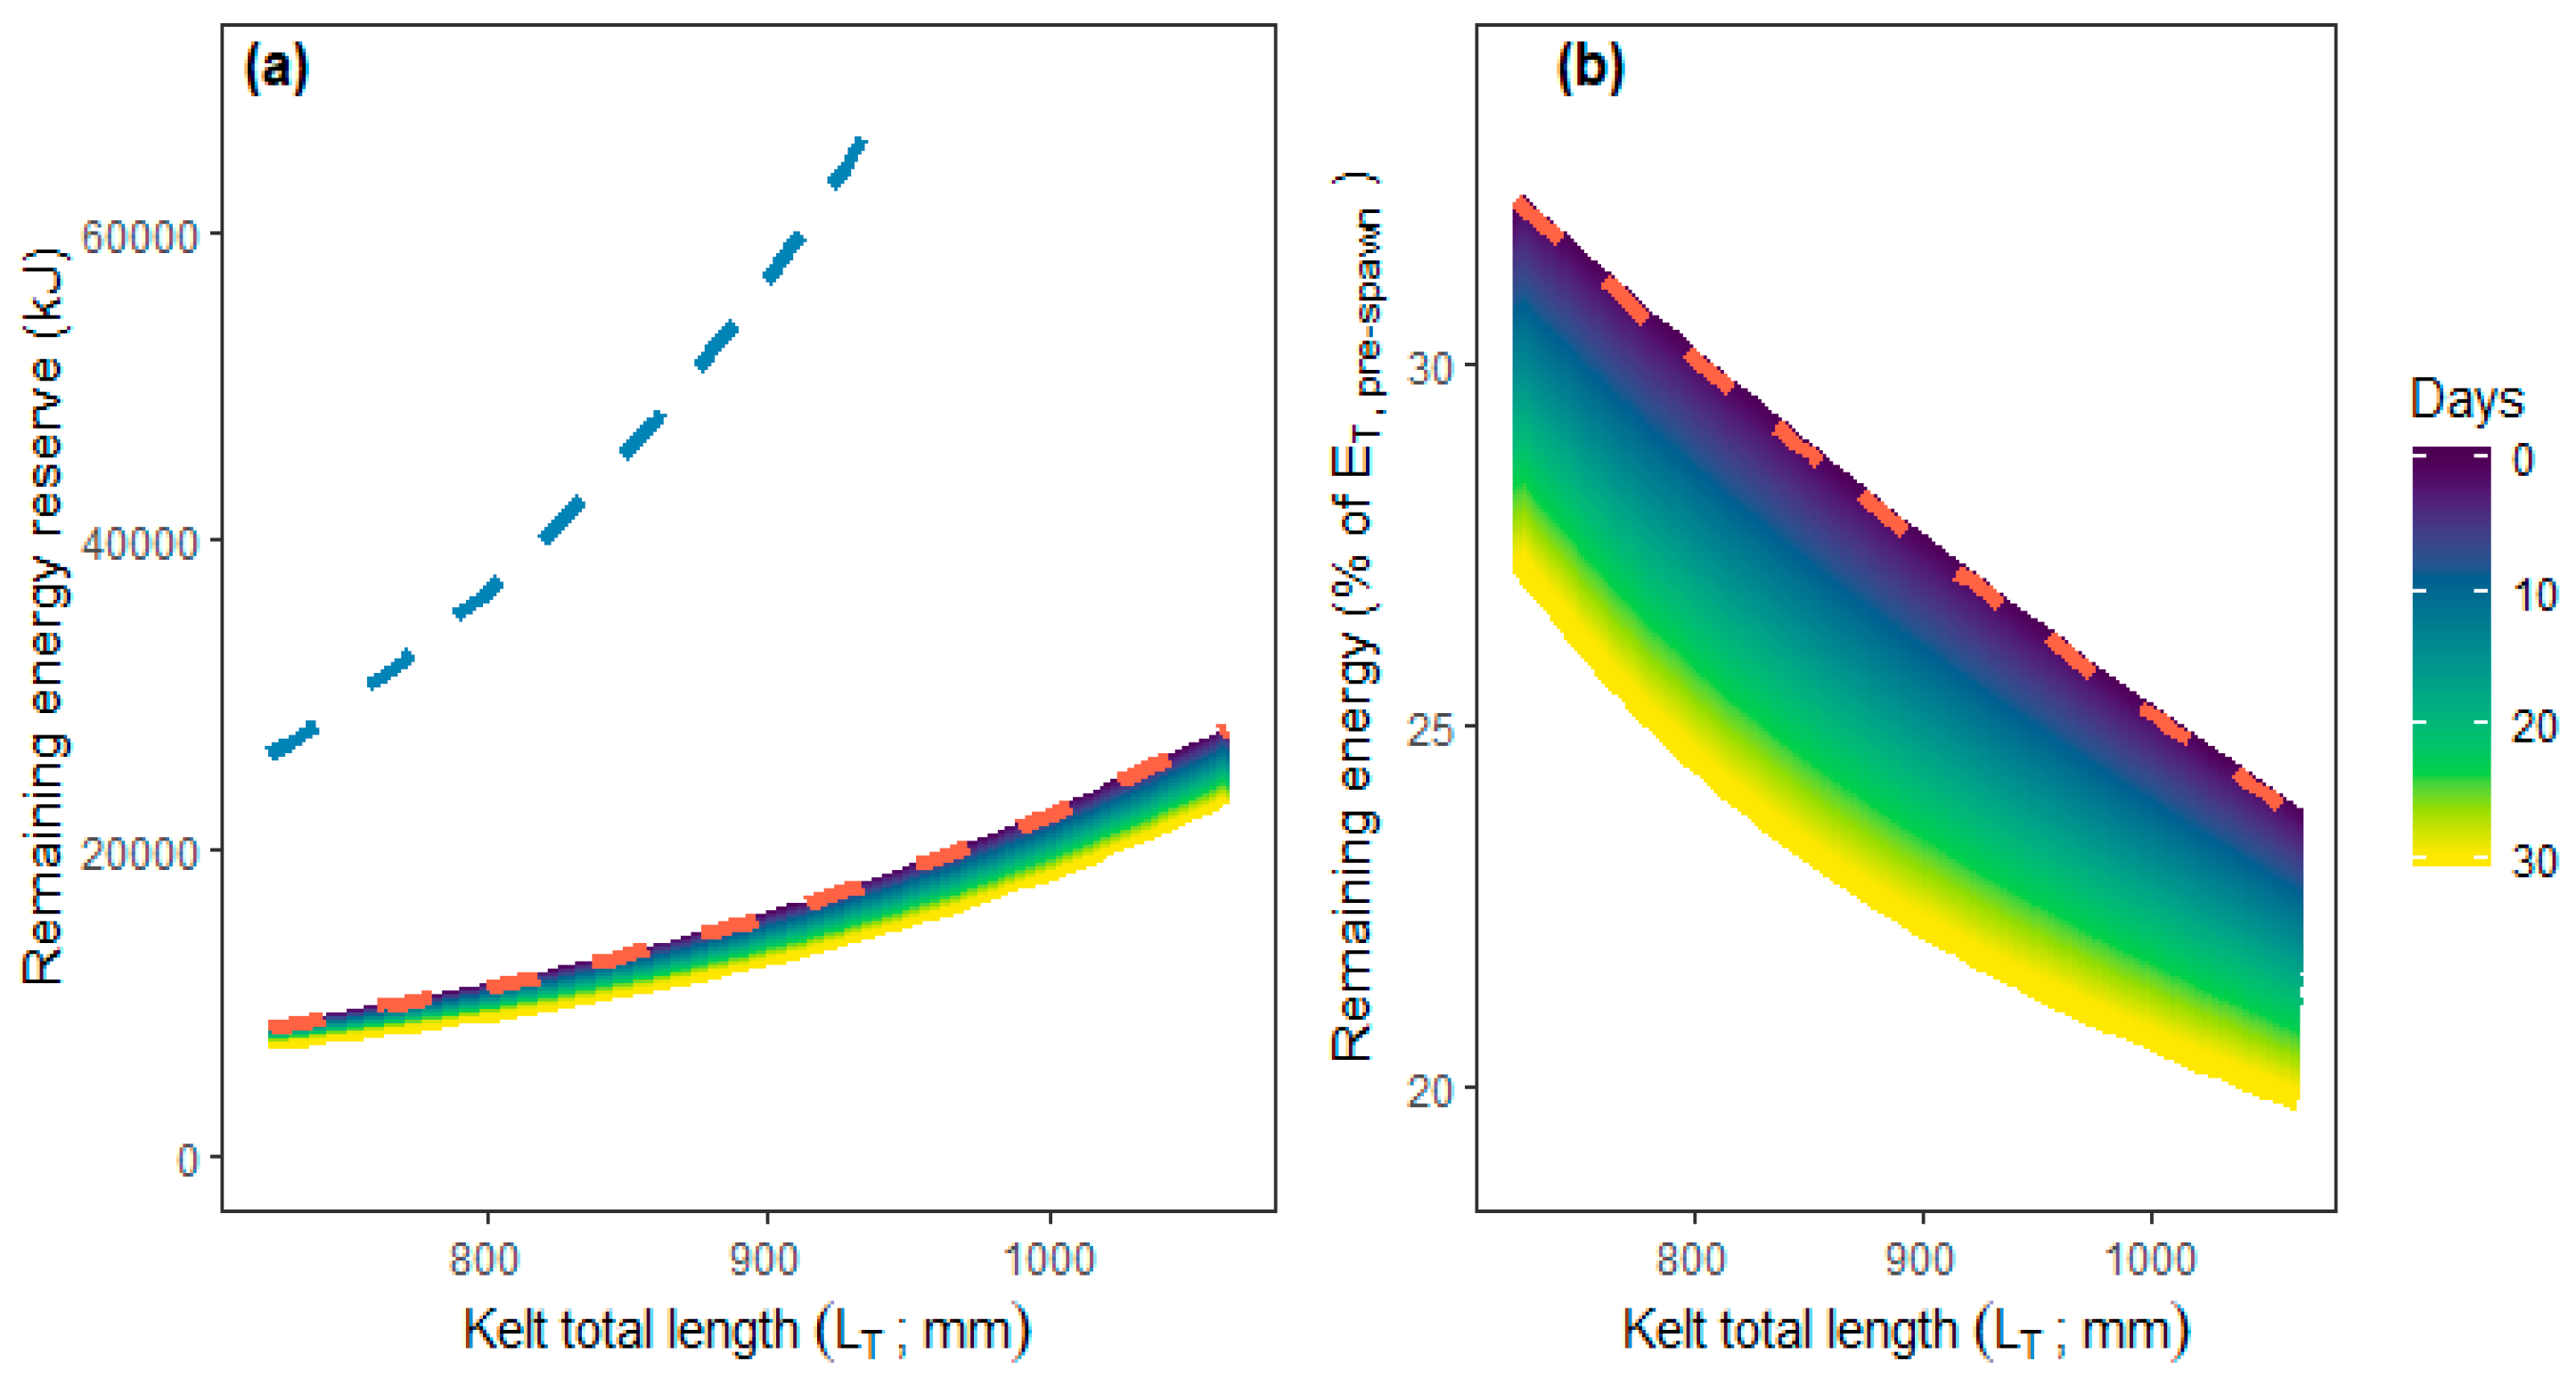
To quantify the effect of increased energy expenditure caused by HPP-induced migration delays on total kelt energy reserves, we related the cumulative effect of predicted hourly energy expenditure for t = [1; 30] days to expected pre-spawning total energy reserves as:
Estimation of kelt movement trajectories and all statistical analyses were performed in R [
29].
3. Results
Tracks were obtained from 48 of the 50 tagged kelts (example in
Figure 3). Individual kelt track duration varied considerably as some kelts remained within the surveyed area the entire study period, whereas others moved upstream and thus resided outside hydrophone detection range for extended periods. No mortality of tagged kelt were observed within the study area. All 48 tracked kelts left the study area by going either through the fish ladder or through the spillway gates, evidenced by their tracks ending at or in close proximity to the dam. Additionally, one kelt left the study area before the tracking system was fully operational.
In total, ca. 7.8 million kelt positions were estimated of which 3.3 million (42%) were inside the area and period covered by the hydraulic model. Of these, 2.9 million (88%) were included in analyses of energy expenditure as at least 95% of the expected positions in each 10 min sequence were available.
Generally, kelt downstream migration was seemingly influenced by changes in river discharge and the operation scheme of the HPP. Entrance to the study area from upstream stretches coincided with increase in river discharge for a slight majority of the tagged kelts. Moreover, only two kelts were found to successfully pass the study area prior to opening the spillway gates on 1st May (
Figure 2). The successful passage of one of these was documented by the tracking system; whereas the other is based on raw hydrophone detections in the early phases before the tracking system was completely operational (this kelt is not included in subsequent analyses).
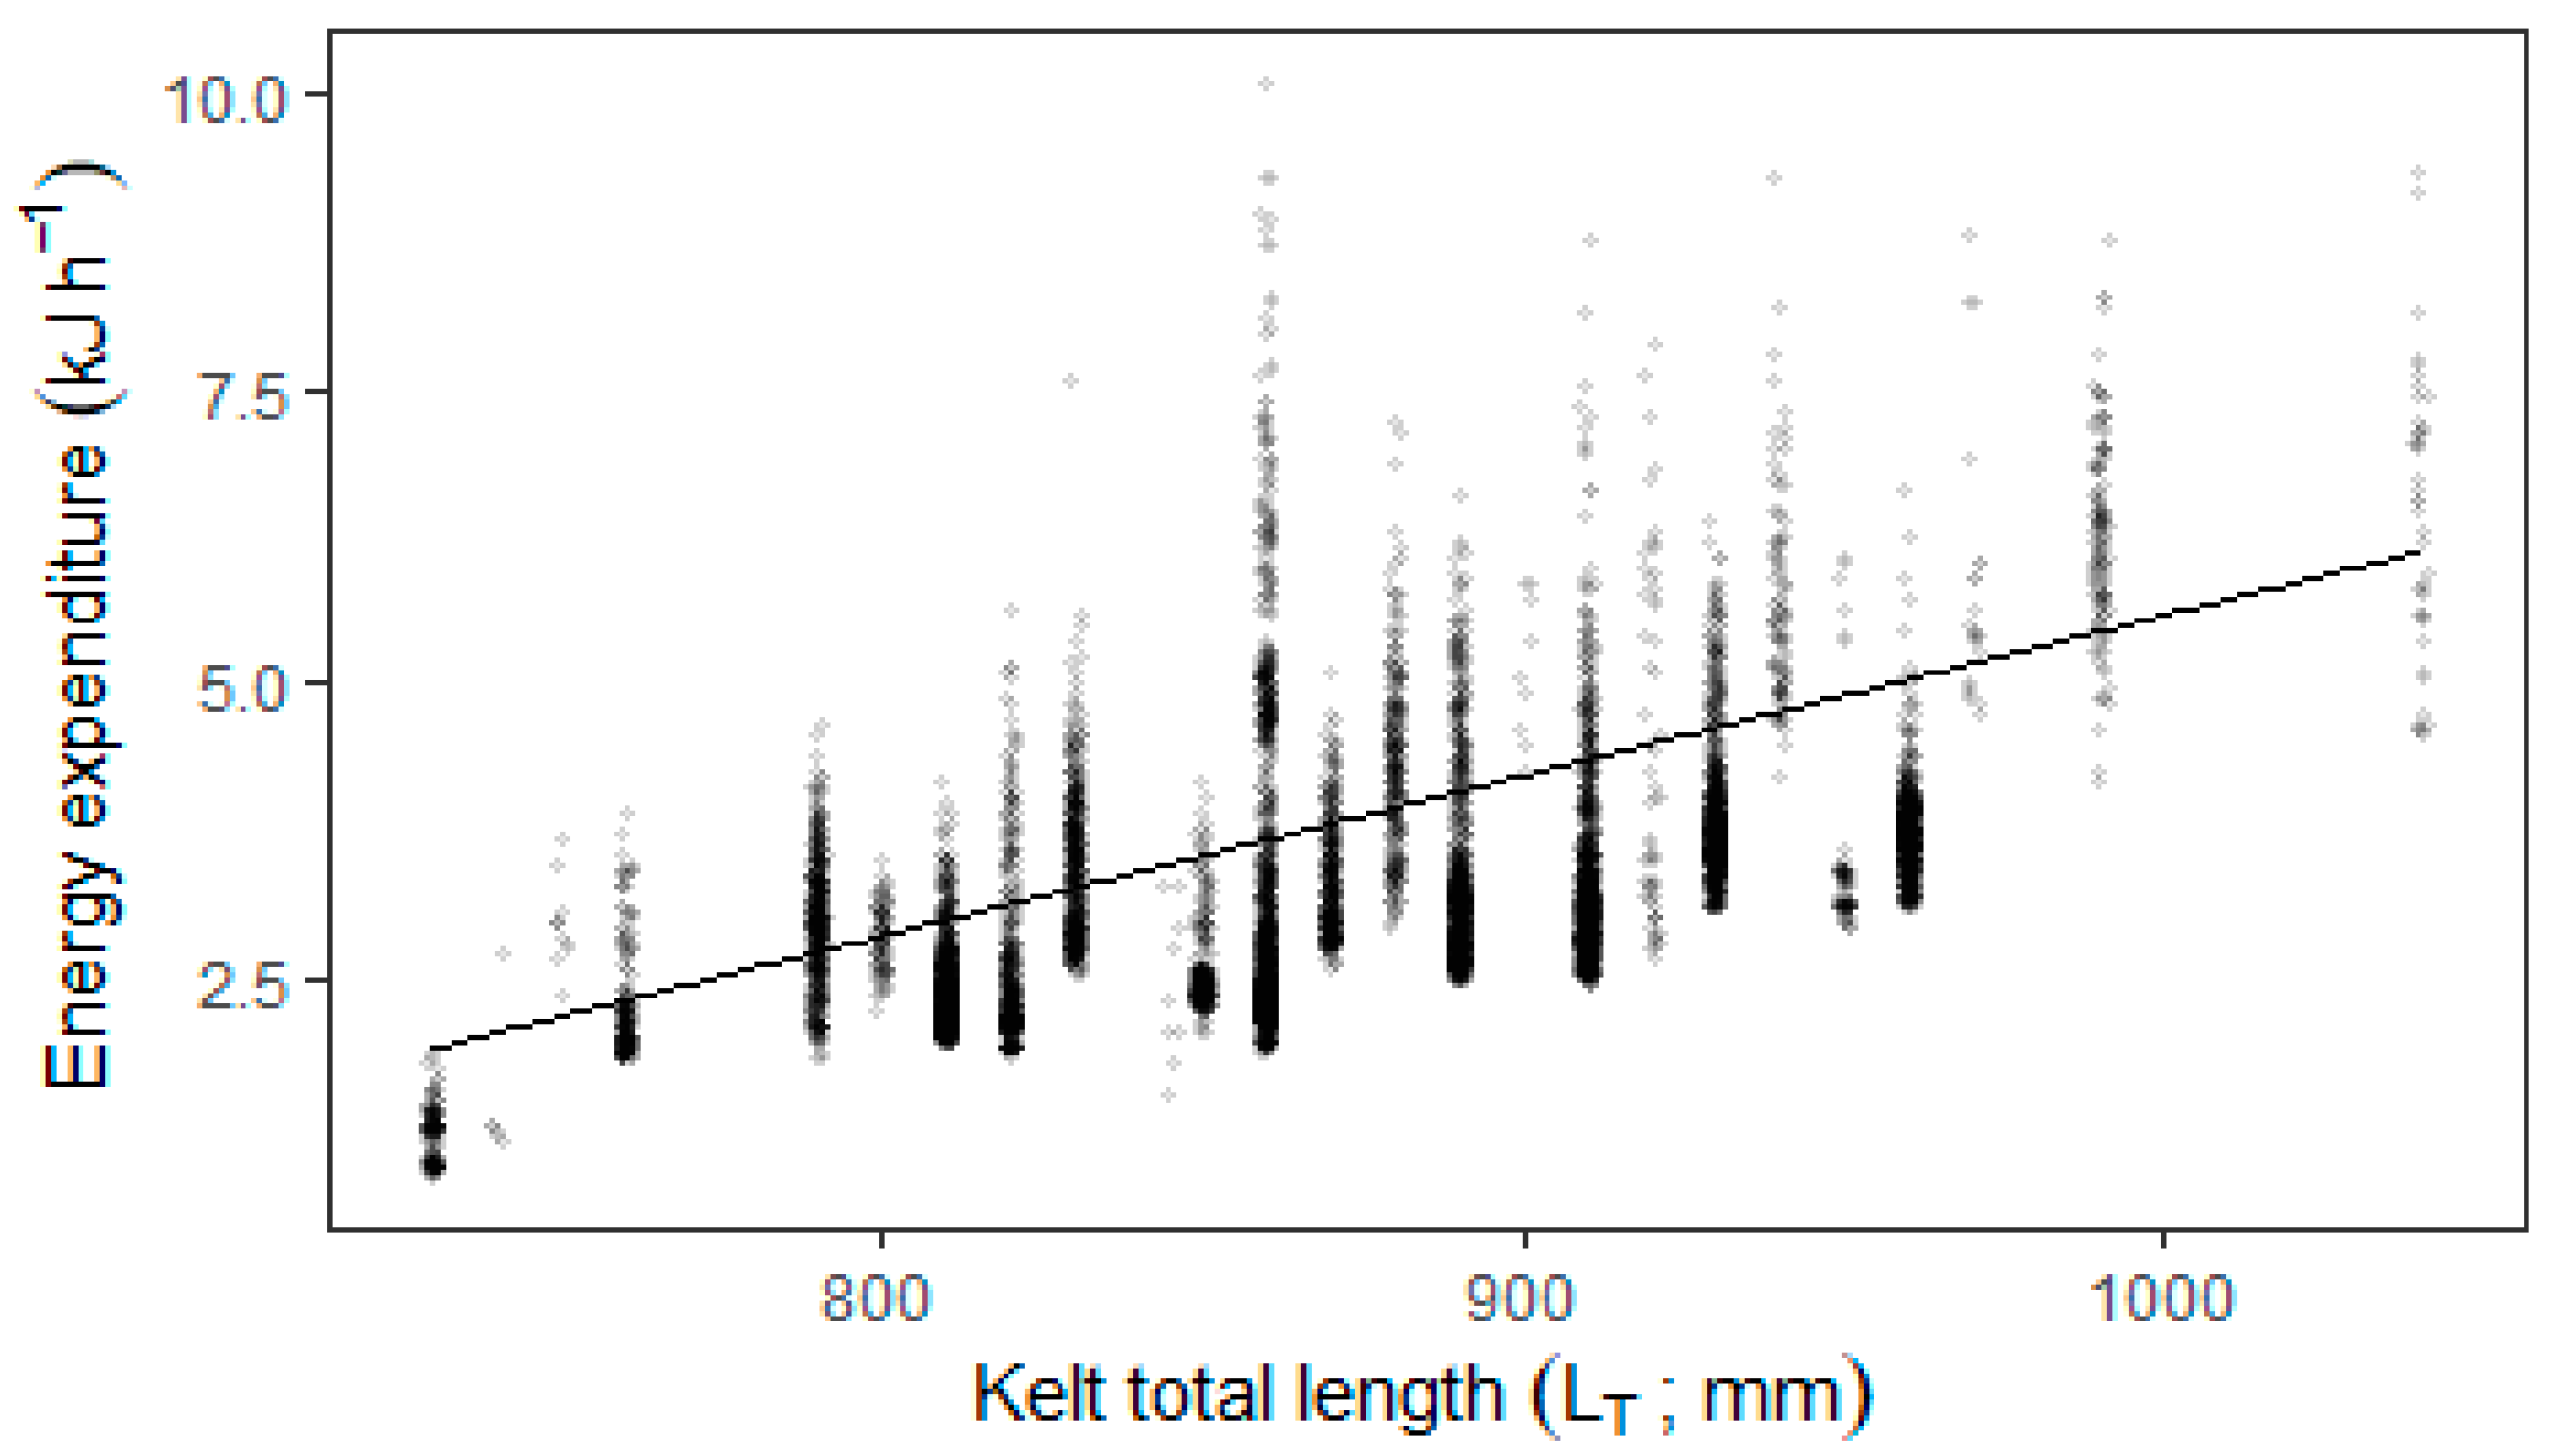
Duration from tagging until leaving the study area ranged from approximately 11 to 28 days. The estimated energy expenditure per hour for the tagged kelts while inside the area covered by the hydraulic model, varied between 0.8 and 10.1 kJ × h
−1 (minimum and maximum) and was dependent on kelt total length (
Figure 4; linear mixed effect model:
p < 0.001). Forecasting this hourly energy expenditure for up to 30 days results in relative remaining energy dropping by approximately 4 to 5 percentage points dependent on kelt length (
Figure 5).
4. Discussion
Our study indicates that Atlantic salmon kelts can be exposed to substantial additional depletion of energy reserves if their successful passage of migration barriers (e.g., HPP dams and weirs) is delayed. In our study, only 2 out of 50 tagged kelts successfully negotiated the study area before one or more of the spillway gates were lowered allowing water to pass through. This suggests that the HPP operation scheme effectively controlled the kelt downstream migration and that the observed persistent presence of kelts in the study area and upstream sections indeed reflected a delay caused by the HPP. Although all tagged kelts appearing in the intake area finally successfully passed, the delay may have profound consequences for the remaining energy reserves and subsequent survival.
Forecasting the estimated hourly energy expenditure while negotiating the HPP facility to 30 days indicated that kelts will suffer additional energy depletion amounting to 4–5 percent of pre-spawning energy content compared to a no-delay scenario. Jonsson, Jonsson and Hansen (1997) [
11] found that even minor additional energy depletion lead to considerable reduction in kelt post-spawning survival rates. Specifically, increasing energetic loss by 4 percentage points reduces the already low kelt survival rate by approximately 10 percentage points [
11]. This is further corroborated by Nyqvist et al. (2016) [
17] reporting that delays may result in reduced overall passage success.
Our study documents that the delay caused by HPPs does indeed have an energetic cost which ultimately can result in reduced kelt survival. Although outside the scope of the present study, we advocate the importance of knowledge based and flexible HPP operation schemes to allow efficient passage of kelts. Many salmon rivers are equipped with multiple HPPs positioned from high upstream to near the river mouth. In these rivers, delays caused by individual HPP facilities and associated increase in energy expenditure can be cumulative, further strengthening the need for proper HPP operation schemes.
Variation in river discharge and water temperature are important cues initiating and controlling salmonid migration [
30,
31]. At the study site, river discharge was to a large extent regulated by upstream HPP facilities effectively enshrouding the natural fluctuations. This may have influenced kelt migratory behavior as natural cues to initiate or continue downstream migration might have been obliterated. Such anthropogenic alterations of the river flow combined with influence of the dam at the study site makes it impossible to separate effects of natural variation in river discharge and HPP operation scheme on kelt passage time and behavior. Additionally, it is impossible to predict what passage times of the focal river stretch would be under natural conditions. However, previous studies show that in-river downstream migration of post-spawned Atlantic salmon generally is relatively fast (median values of 3.7 km d
−1 and 9.3 km d
−1 reported in [
9,
17]) and that HPP dams can cause severe delays [
17]. Furthermore, successful passage of HPP dams has previously been shown to predominantly occur through open spillway gates [
17]. In our study, open spillway gates were not available until towards the end of the migration period. The fact that most kelts rapidly passed as soon as the gates opened is indeed a strong indication that the regulation management influenced migration behavior. Although the discharge was increasing at the same time, many kelts migrated at discharges also observed a couple of days earlier without such migration from the dam (see
Figure 2). The alternative explanation that this rapid response was initiated by increasing discharge seems much more speculative. Therefore, we regard it as a fair assumption that the observed prolonged residence times at the focal river stretch were caused by the HPP structures and that given natural conditions in the River Orkla, residence time and associated energy consumption at the focal river stretch would be negligible in comparison to the observed delays.
Our estimates on energy expenditure are based on previously established models. Specifically, we used models on energy consumption of discrete body sizes, at discrete water temperatures and discrete activity levels [
24] to obtain a unified continuous model accommodating the ranges of fish sizes, water temperatures and activity levels observed in this study. However, results in Lennox et al. (2018) [
24] are based on farmed Atlantic salmon in good condition, while the salmon in our study were energy deprived Atlantic salmon kelt of wild origin. The implications of this on the estimates of energy expenditure are unknown, but Robertsen et al. (2019) [
32] did not find conclusive evidence that farmed Atlantic salmon juveniles differ in standard metabolic rate from their wild counterparts. Additionally, maximum activity levels in Lennox et al. (2018) [
24] were limited to swimming activities corresponding to one body length per second. While a majority of the tagged kelts (78%) occasionally were registered to swim faster than that, more than 99% of the registered swimming speeds were within range of the underlying model, in other words, between zero and one body length per second. Furthermore, any bias introduced by truncating the maximum swimming speed would result in more conservative (i.e., lower) estimates of energy expenditure. We acknowledge that our model-based approach potentially introduces uncertainties and biases. Optimally, measurements of energy expenditure should have been performed on the tracked kelts, but such activities were beyond the scope of the present study.

 ,
, 


