Article

Influence of a phyA Mutation on Polyamine Metabolism in Arabidopsis Depends on Light Spectral Conditions

1
Agricultural Institute, Centre for Agricultural Research, Eötvös Loránd Research Network, 2462 Martonvásár, Hungary
2
Laboratory of Hormonal Regulations in Plants, Institute of Experimental Botany, Czech Academy of Sciences, 11720 Prague, Czech Republic
*
Author to whom correspondence should be addressed.
Plants 2023, 12(8), 1689; https://doi.org/10.3390/plants12081689
Submission received: 20 March 2023 / Revised: 13 April 2023 / Accepted: 15 April 2023 / Published: 18 April 2023
(This article belongs to the Special Issue The Effects of LED Light Spectra and Intensities on Plant Growth 2.0)

Abstract

:
The aim of the study was to reveal the influence of phyA mutations on polyamine metabolism in Arabidopsis under different spectral compositions. Polyamine metabolism was also provoked with exogenous spermine. The polyamine metabolism-related gene expression of the wild type and phyA plants responded similarly under white and far-red light conditions but not at blue light. Blue light influences rather the synthesis side, while far red had more pronounced effects on the catabolism and back-conversion of the polyamines. The observed changes under elevated far-red light were less dependent on PhyA than the blue light responses. The polyamine contents were similar under all light conditions in the two genotypes without spermine application, suggesting that a stable polyamine pool is important for normal plant growth conditions even under different spectral conditions. However, after spermine treatment, the blue regime had more similar effects on synthesis/catabolism and back-conversion to the white light than the far-red light conditions. The additive effects of differences observed on the synthesis, back-conversion and catabolism side of metabolism may be responsible for the similar putrescine content pattern under all light conditions, even in the presence of an excess of spermine. Our results demonstrated that both light spectrum and phyA mutation influence polyamine metabolism.

1. Introduction

Light, as the major energy source for plants, is one of the most important environmental factors, and its characteristics, namely the intensity, the spectral composition, and even the direction affect plant growth and development, including net photosynthesis and chemical composition. These changes, in turn, modify plant morphology and tissue anatomy and, in the long term, influence plant biomass parameters and reproduction-related rates [1]. Plants sense different wavelengths using distinct photoreceptors; among them, one superfamily is phytochromes (Phys), the receptors of red/far-red light [2]. Angiosperm Phys are divided into two groups; type I is characterized as light labile, while the members of type II are light stable [3]. In Arabidopsis, there are five Phy genes encoding the apoproteins of Phy A-E [4]. The PhyA protein is considered primarily as a far-red sensor, while the PhyB is rather a red sensor [5]. The effects of phyA mutation have been studied with the usage of, for example, T-DNA insertion Arabidopsis mutants. Besides the effect of far-red light and darkness in mutant plants on dormancy and germination or hypocotyl elongation [6,7,8], the role of phyA mutation has also been investigated in jasmonic acid-mediated defense response against Botrytis cinerea [9], in peroxisome proliferation during photomorphogenesis [10], and in cold acclimation under different light quality and intensity conditions in Arabidopsis [11].
PhyA-regulated responses involve metabolite and gene expression fine-tuning mechanisms [12,13,14,15]. Investigation on phyA and phyB mutant Arabidopsis plants also revealed that PhyA and PhyB signaling has essential roles in the control of primary metabolism, including starch and sugar content, and other metabolites involved amino acids, polyamines (PAs) and the members of the tricarboxylic cycle in response to light [14], and phytohormone levels [11]. The most detailed study on the relationship between phyA mutation and PA metabolism performed under white and far-red light conditions revealed the involvement of PhyA in putrescine (PUT) biosynthesis and its role in the regulation of S-adenosylmethionine decarboxylase 2 and 4 in response to far-red light [12]. Some interesting results also revealed the role of PhyA in mediating the blue light/UV-A photoresponses during chloroplast biogenesis [16] and phototropism [17]. Mesophyll-specific PhyA is involved in the blue-light-dependent regulation of anthocyanin levels [18]. Investigation on quintuple phy mutant (phyA phyB phyC phyD phyE) Arabidopsis plants also revealed that Phys play a role in blue-light-mediated stem elongation and the associated shade-avoidance responses [19] or chloroplast development in Arabidopsis under blue light [20]. However, the involvement of Phys in blue light-induced processes is still less known.
PAs are small N-containing polycationic compounds with various roles in plant physiological and molecular processes, such as biosynthesis, structural maintenance, stabilization and function of proteins and nucleic acids, photosynthesis, plant growth and development, and stress signaling [21]. Thus, the maintenance of a proper level of PA pool is important for normal plant growth and development [22]. In plants, the diamine PUT can be synthesized mainly by ornithine decarboxylase (ODC) or arginine decarboxylase (ADC), with one well-known exception, as in Arabidopsis the ODC pathway is lacking, but this species displays two ADCs genes (AtADC1 and AtADC2) [23]. Light and several stress factors have been shown to have more influence on ADC2 promoter activity [24,25]. PUT can be converted to the triamine spermidine (SPD), which can be further converted to the tetramine spermine (SPM) by the repetitive addition of an aminopropyl moiety in reactions catalyzed by two closely related but specific enzymes, SPD synthase (SPDS) and SPM synthase (SPMS) [22]. The Arabidopsis genome carries two genes encoding SPDSs (AtSPDS1 and AtSPDS2) and one encoding SPMS (AtSPMS) [26]. The expression of AtSPDS1 and AtSPDS2 have been reported to be constitutive in all organs [27], but AtSPDS2 was found to be inducible by plant hormones, such as indoleacetic acid, gibberellin A3 and abscisic acid [28]. The fine-tuning of the PA metabolism is achieved by the balance between the synthesis and catabolism, uptake and conjugation of PAs, and it can also be assumed that light may affect not only the synthesis but also the catabolism of Pas [24]. Among the ten annotated Copper-Containing Amine Oxidase (CuAOs) genes in Arabidopsis, AtCuAO1, AtCuAO2 and AtCuAO3 have been well characterized. These genes encode functional CuAOs that use PUT and SPD as substrates and are responsible for terminal catabolism. CuAO1 has extracellular, while CuAO2 and CuAO3 have peroxisomal localization. The three genes present different expression profiles [29]. AtCuAO1 transcripts were abundant in rosette leaves, and the expression increased continuously during development. Similarly, the expression pattern of AtCuAO3 increased during development, and its transcript level was high both in the leaves and in the stems. While the expression level of AtCuAO2 was abundant rather in stems and was low in the leaves, in addition did not increase during the developmental stages. Plant hormone treatments, such as abscisic acid or salicylic acid, also induced the gene expression of AtCuAO1 and AtCuAO3 but not that of AtCuAO2 [29]. In Arabidopsis, all the known polyamine oxidases (PAOs) are responsible for the back conversion of higher PAs. Characterization of five PAO isoforms in Arabidopsis revealed that AtPAO1 has a specific role in flowers, AtPAO2 was expressed in shoot and root meristems, and to a greater extent at later growth stage in the rosette, stem and in flowers. The expression of AtPAO3 was constitutive in the whole plant body but was the highest in flowers. AtPAO4 was expressed in young and adult plants, especially in the roots and floral organs, while AtPAO5 expression was observed in all the organs throughout various growth stages [30]. AtPAO1 and AtPAO5 are located in the cytoplasm, while AtPAO2, AtPAO3, and AtPAO4 are in peroxisomes. AtPAO1 and AtPAO5 prefer thermospermine, whereas AtPAO4 has higher substrate specificity for SPM and converts it to SPD, while AtPAO2 and AtPAO3 mainly convert SPD to PUT [31,32]. AtPAO2 and AtPAO5 have been reported to be inducible by, for example, salt stress and plant hormones or Pas [33,34,35,36].
It has also been demonstrated that the actual PA pool is influenced by light intensity and light composition [37,38,39]. In addition, it was found that far-red and blue lights induced opposite responses in PA metabolism-related gene expression in wheat plants [39]. Pas increasingly accumulated in tomato leaves from the beginning of illumination [40]. Furthermore, light-responsive elements in the promoter region of genes involved in PA synthesis, such as SAMDC encoding S-adenosylmethionine decarboxylase, have been identified in Arabidopsis [41].
Although there are some limited results on the changes in PA metabolism in phy mutant Arabidopsis plants, these studies focused on the modifying effect of the red/far-red ratio with the investigation of only dedicated parts of PA metabolism (just one polyamine compound, or only one of the synthesis/catabolite gene) (reviewed in [24]). Furthermore, these studies examined the effects of the mutation during alternating light conditions or pulse-like light treatments. However, the relationship between light perception and PA metabolism has still not been fully understood.
The present study aimed to reveal the influence of PhyA on PA synthesis and catabolism. Therefore, PA metabolism changes in phyA insertion mutant Arabidopsis plants were compared to the wild type. As PhyA responds to far-red, plants were exposed to white light, as well as white light with an enhanced far-red spectrum. Moreover, the effect of supplemental blue light also was investigated because some studies suggested that Phys play a role in special blue-light-mediated responses [16,17,19]. In order to estimate the direct impact of PhyA on PA catabolism, some plants were supplemented by exogenous SPM.

2. Results

2.1. Measurements of the Shoot Weight and Chlorophyll-A Fluorescence Induction Parameters

Wild type Col-0 and phyA mutant Arabidopsis plants were grown at different light spectral conditions (the light source for L1: “white light” was a continuous wide-spectrum LED, in the case of the L2 regimen: “red light”, elevated far-red component was applied, while under L3 light condition: “blue light” the blue light component was the most dominant), with or without exogenous SPM treatment. In order to characterize the physiological status of the plants, shoot weight and the maximum quantum efficiency (Fv/Fm) chlorophyll-a fluorescence induction parameter representing the maximum quantum efficiency of Photosystem II (PSII) was measured first. The phyA mutation did not significantly influence the shoot weight under any of the light conditions (Figure 1A). However, the L2 and L3 light treatments increased it in both genotypes compared to the control, white light (L1), indicating that light quality has more influence on plant growth rate than the mutation. The one-day SPM treatment also did not significantly influence the shoot weight of the plants under different light conditions (Figure 1A). The Fv/Fm parameter was around 0.8, and neither the treatments nor the genotypes influenced it, indicating that the plants were under optimal growth conditions (Figure 1B).
Besides the Fv/Fm, the actual quantum yield [Y(II)] of PSII was also measured. Under L1 and L2 light conditions, no differences were detected between the wild type and the mutant plants in Y(II). Under L3 light, slightly lower Y(II) was measured for the phyA mutants compared to the Col-0 (Supplementary Figure S1b). It has also been shown that the actual quantum yield was slightly more sensitive to the SPM treatment in the wild genotypes than in the phyA mutant plants under L1 and L3 light conditions (Supplementary Figure S1a,b). At L2 treatment, SPM application slightly increased the Y(II) in the phyA mutant plants. Despite a few statistically significant differences, these changes were not substantial.

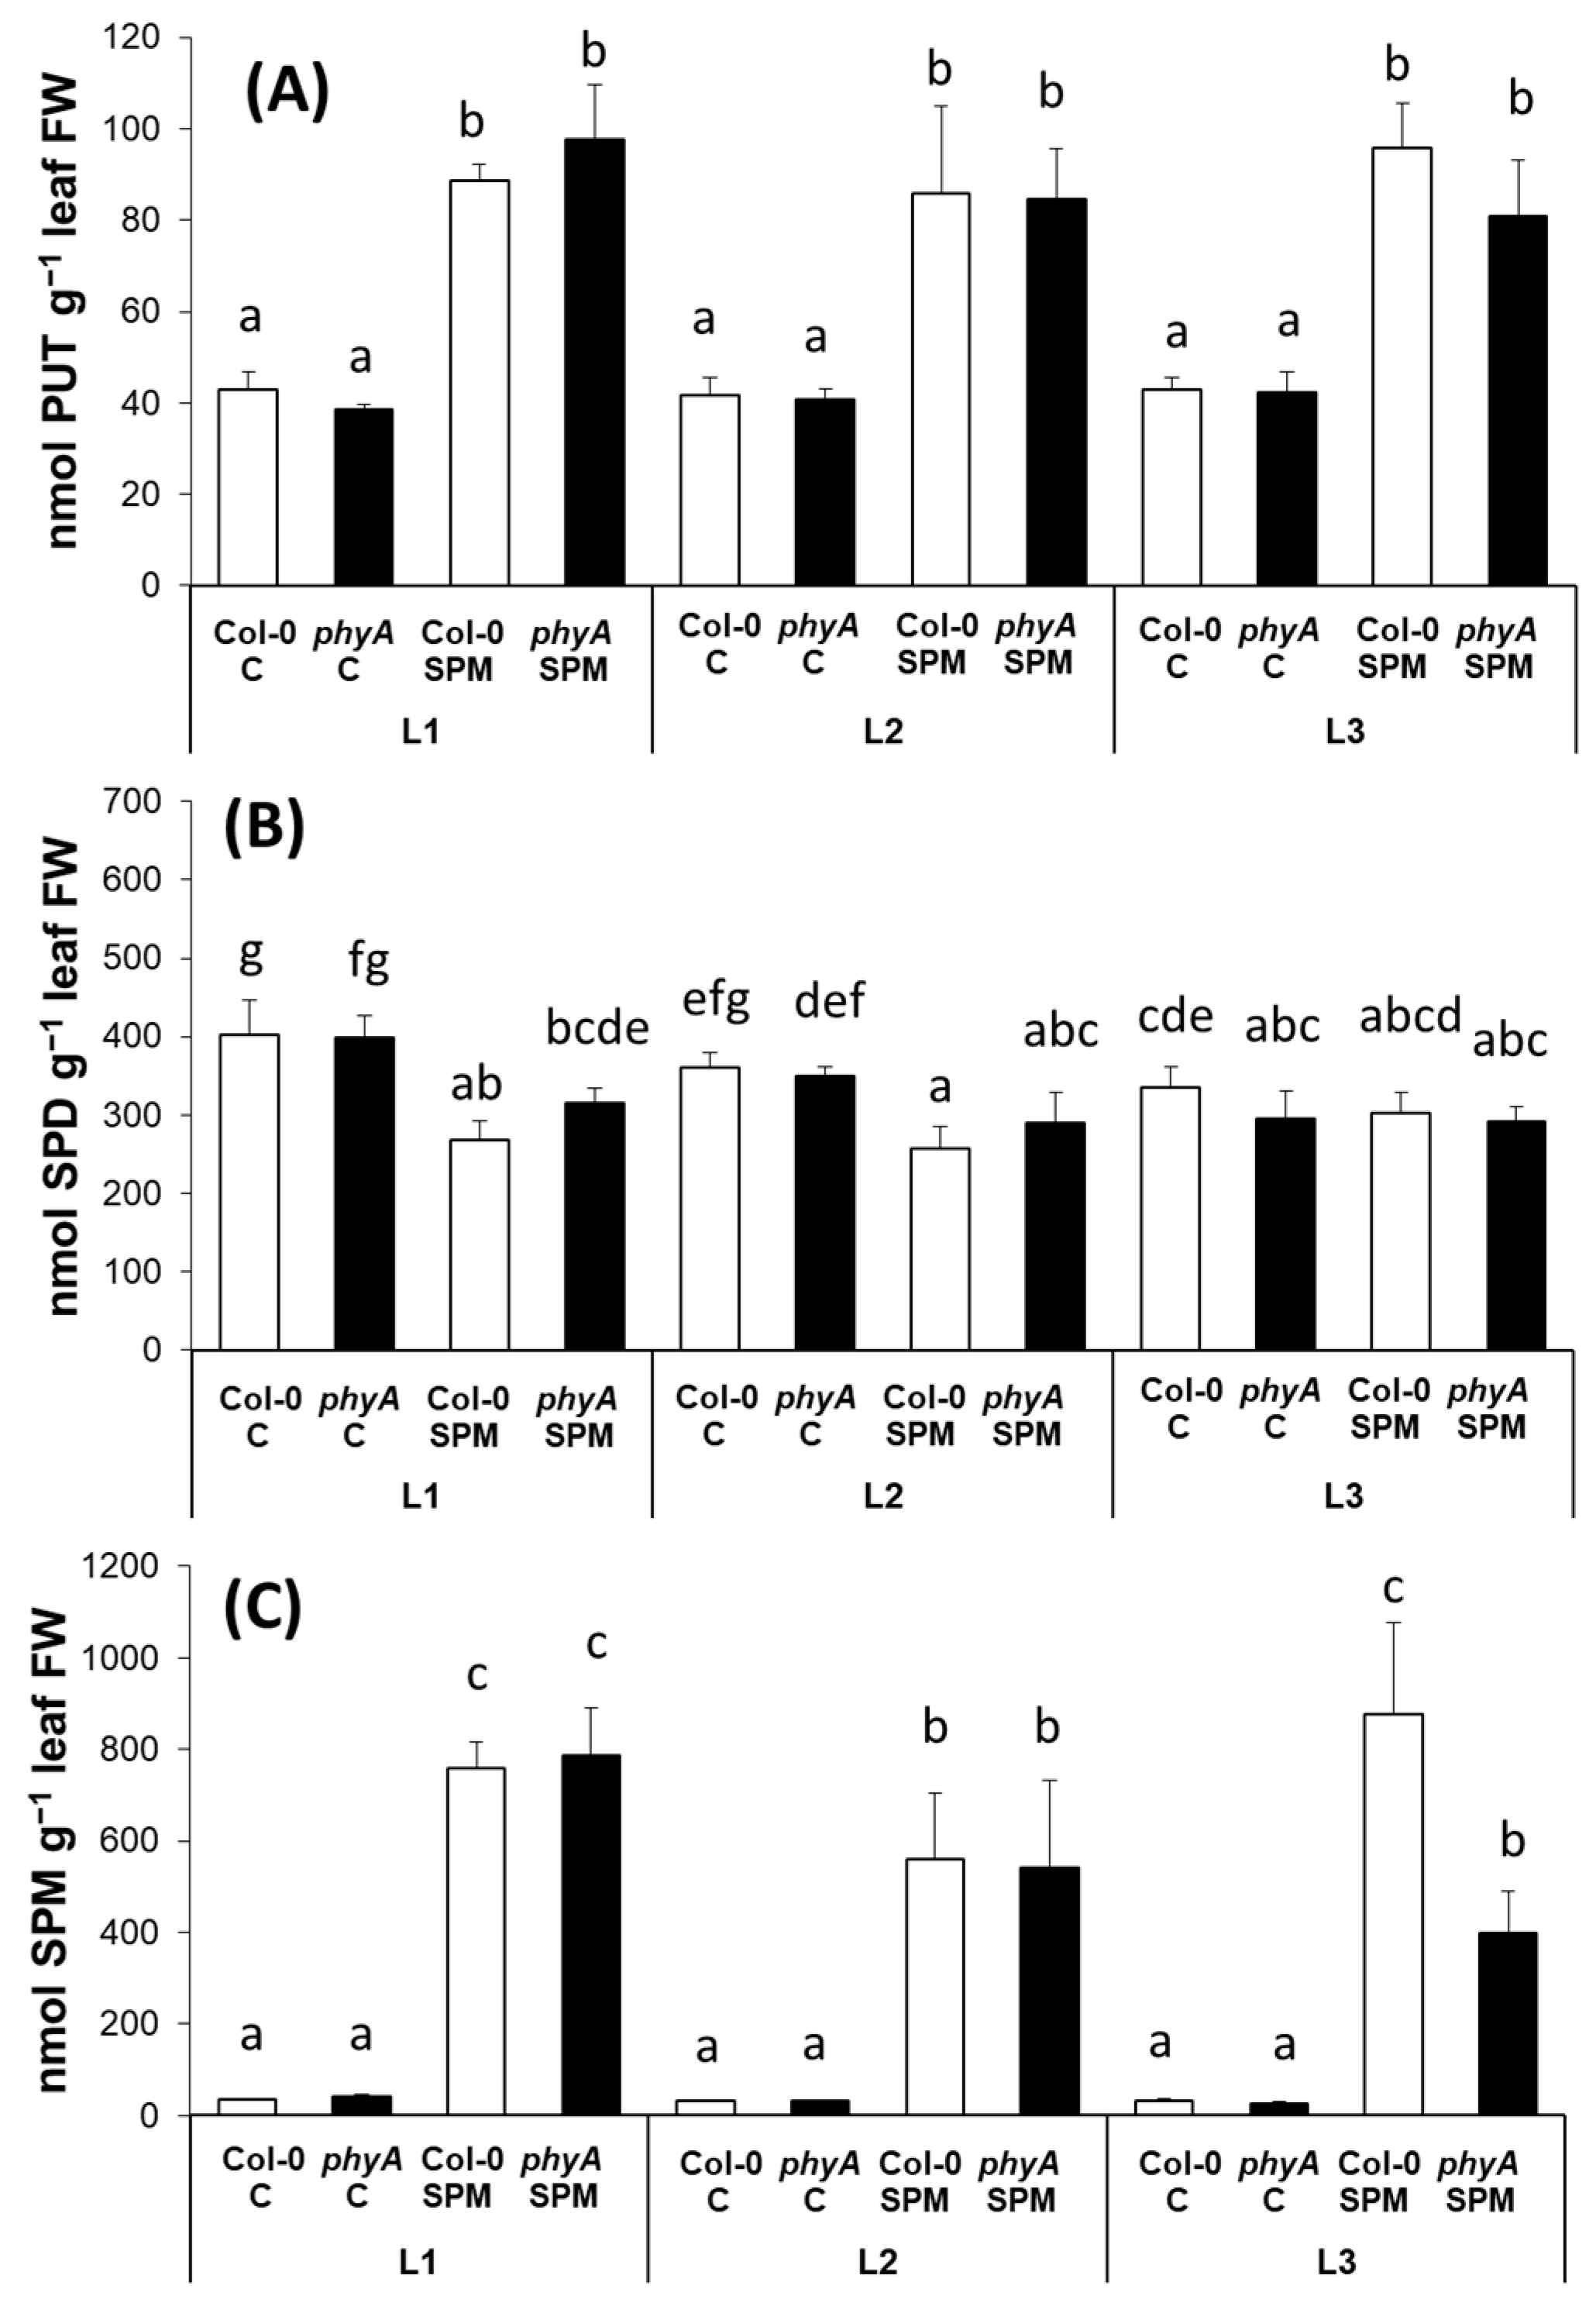
2.2. Modulation of Polyamine Content and Polyamine Metabolism-Related Gene Expression by Light Spectra

As light and several stress factors have been shown to be important regulators of ADC2 promoter activity, here, the ADC2 gene was in focus. In accordance, we detected downregulated expression of AtADC2 by L2 and L3 treatments in Col-0 plants (Figure 2A). In addition, the expression of AtADC2 was lower in the mutant plants under L1 but the same under L2 and L3 light conditions. A much stronger effect was found in the case of SPM-treated plants (Figure 2A). After the SPM application, AtADC2 expression increased in both genotypes, which suggested that the SPM treatment induced de novo synthesis of PUT. AtADC2 expression increased, especially in the case of the mutant plants, with a higher degree under L1 and L3 light conditions (Figure 2A).
As the expression of AtSPDS2 was found to be inducible by plant hormones, such as indoleacetic acid, gibberellin A3 and abscisic acid, here, we focused only on AtSPDS2. Without SPM treatment, the AtSPDS2 transcription levels did not differ between the two genotypes under L1 and L3 conditions, and under L2, it was only slightly higher in phyA mutant than in Col-0 (Figure 2B). The lowest AtSPDS2 expression level was found in both genotypes under the L3 light treatment. SPM treatment decreased the expression of AtSPDS2 in both genotypes under L1 and L2 conditions, while under L3 conditions, where the expression level was initially lower, no pronounced differences were induced (Figure 2B).
The expression level of AtSPMS downregulated in phyA mutant compared to the wild type under L1 and L2 light treatments, but not under L3 light conditions, where the expression level was similar to the wild type and initially lower (Figure 2C). SPM treatment induced the highest increment under L3 in Col-0, a slight increase in both genotypes was induced under L2, while under L1, the transcript level of AtSPMS increased only in the mutant.
PUT content was similar in the wild type and the phyA mutant plants under all the light spectral conditions tested here (Figure 3A). A substantial increase was detected in the SPM-treated plants compared to their corresponding control. Despite the well-recognized differences between the expression of AtADC2 in the two SPM-treated genotypes, as well as under different light regimes, SPM treatment increased the PUT level similarly in both genotypes, which was independent of the light conditions.
Under the present conditions, the most abundant PA in the leaves of Arabidopsis plants was SPD (Figure 3B), the amounts of PUT and SPM were about an order of magnitude lower compared to SPD, and no remarkable changes were observed in the SPD levels after the treatments compared to changes in PUT and SPM. In addition, SPM treatment only slightly decreased SPD levels, especially under white and far-red light conditions.
Despite the modifications of the enzyme expression, the pattern of SPM changes did not follow the tendency of AtSPMS expression levels. The SPM concentration was similar in both genotypes under the three applied light treatments (Figure 3C), and exogenous SPM increased equally in Col-0 and phyA under L1 and L2 light conditions, with a lower extent in the case of L2. Interestingly, under the L3 condition, the SPM accumulation in SPM-treated Col-0 was double that of the phyA mutant.
Based on the localization of the CuAO and PAO enzymes, organ-specific expression and plant hormone inducibility of their genes here, the changes in the transcript level of AtCuAO1 and AtCuAO3, in addition to AtPAO2 and AtPAO5 were studied.
Under the present conditions, it was found that the AtCuAO1 expression was independent of the light condition or the phyA mutation. However, in the presence of an excess SPM, AtCuAO1 expression was induced in the mutant genotypes under L1 and L3 light conditions (Figure 4A).
The expression level of AtCuAO3 did not show pronounced changes, except downregulation under L3 conditions in Col-0 (Figure 4B). The initially higher AtCuAO3 expression in phyA mutant under the L3 regime might reflect the involvement of PhyA in this process, which is similar to the above-mentioned modifications in AtCuAO1 expression under SPM treatment combined with L3 conditions. A slight increase of AtCuAO3 expression was detected after SPM application in both genotypes under L1 light and in Col-0 under L3 (Figure 4B), which also indicates that this process is dependent on the actual level of PAs.
In the present study, the increased SPM content in the leaves, due to the excess of SPM in the nutrition solution, induced the expression of AtPAO2 under all the light conditions regardless of the genotypes (Figure 4C). Compared to this, the AtPAO5 levels showed more differences. Its transcript level was initially the lowest under L3 conditions in Col-0 plants (Figure 4D), and its expression was mostly elevated after SPM treatment, especially under L2 conditions in both genotypes, while under L3 conditions only in Col-0 plants. The transcript level of AtPAO5 was significantly higher in the mutant plant compared to the wild type under L3 conditions, and excess SPM could not increase further it. It should also be noticed that under the L2 condition in both genotypes, the initial level of AtPAO5 expression was higher than that was detected under L1 conditions in Col-0 or phyA mutant plants.

2.3. Correlation Analyses and Principal Components Analysis (PCA) of the Measured Parameters

The correlation analyses (Table 1) showed that PUT content was in a close, positive relationship with the SPM content, and both PUT and SPM contents were in a close, positive relationship with the ADC2, SPMS and PAO2 expression levels. Additionally, high and positive correlations were detected between the expression levels of ADC2, SPMS, CuAO1 and PAO2. However, close, negative relations were found between PUT or SPM levels and SPD content, and SPDS2 transcript level. Furthermore, SPD content also showed a strong, negative correlation with PAO2 and PAO5 expression levels.
The principal component analysis (PCA) analysis of the PA metabolism-related parameters (Figure 5) showed great separation in some of the treatment groups based on their measured genetic and biochemical variables. This multivariate analysis reflected that L3 light conditions had a specific effect on PA metabolism. On the other hand, SPM treatment was a more significant factor in the distinction of treated plants. Three variable groups, SPD—SPDS2, ADC2CuAO1SPMS, and PAO2—PUT—SPM, were responsible for the differences among the twelve treated populations. The changes in the first two variables were responsible for the altered PA metabolism in the Col-0 and phyA populations without SPM treatment under L1 and L2 and, to a lesser extent, under L3 light treatment. The second group of three genes led to the discrimination of SPM-treated phyA mutant under L1 and L3, and the third group differentiated the SPM-treated Col-0 genotype at each of the lights and the mutant one under the L2 condition.

3. Discussion

PA biosynthesis is controlled by light (light quality and quantity) [38,39], and on the other hand, PAs are able to influence photosynthesis in several ways (reviewed in [24]). PhyA is a unique photoreceptor responsible for the high far-red light irradiance response of seedlings, and PhyA regulates various light-dependent responses at metabolite and gene expression levels; however, PhyA may regulate genes other than light-responsive ones through the interaction with corresponding transcription factors [23]. In addition, some results suggest the involvement of PhyA in mediating the blue light photoresponses, such as chloroplast biogenesis, phototropism, anthocyanin synthesis or stem elongation and shade-avoidance responses [16,17,18,19]. Although some limited information suggests a relationship between PhyA and PA metabolism under white and far-red light conditions [12], until now, no information has been available on the involvement of PhyA in blue light-influenced regulation of the PA metabolism in plants. Therefore, the present study attempts to uncover the impact of far-red and blue light on PA production through the investigation of phyA mutant plants, as well as changed light spectra and supplementation by exogenous PA.
The phyA mutation did not influence the shoot weight under the different light conditions compared to the adequate wild-type controls. At the same time, the light quality has more influence on the shoot weight than the mutation, as L2 and L3 light treatments increased it in both genotypes compared to the control white light (L1) condition. Similarly to these results, the biomass of individual monogenic phyA or phyB mutant plants was the same as that of the wild type, suggesting that the action of either phyA or phyB is sufficient for normal biomass production [42]. Arabidopsis leaf area and petiole length also showed a correlation with blue light irradiance levels [43], and a decrease in the R/FR ratio has also been reported to significantly increase petiole elongation and leaf area expansion of the Col-0 line [44]. In addition, the biomass parameters of the phyA mutant were similar to that of the wild type, even under far-red light supplementation [42].
Although the effects of exogenous Pas have been tested in Arabidopsis mutants, especially in PA metabolism mutants [35,45], no information is about the effect of exogenous SPM on phyA mutants. Previously we also demonstrated that one-day treatment with 0.5 mM SPM was enough to induce changes in PA metabolism in Arabidopsis Col-0 and salicylic acid-related mutants [36]. In the present study, the SPM treatment did not influence remarkable changes in the shoot weight or chlorophyll-a induction parameters of the plants, indicating that the plants were under optimal growth conditions. In order the better understand the biological effect of PA metabolism and its relationship with the PhyA, PA metabolism was investigated at metabolite and gene expression levels.
The expression of AtADC2 was lower in the mutant plants under L1 but the same under L2 and L3 light conditions; in addition, it was downregulated by L2 and L3 treatments in Col-0 plants. This indicates that the expression of AtADC2 is dependent on far-red, as well as blue light signaling and that this signaling pathway goes through PhyA. SPM treatment increased AtADC2 expression in both genotypes, suggesting that exogenous SPM induced de novo synthesis of PUT. As AtADC2 expression increased, especially in the case of the mutant plants, with a higher degree under L1 and L3 light conditions, these results support that PhyA is involved in the regulation of PUT synthesis, but also another pathway regulated by far-red light is probably included, for example, PhyB might play a role in the process [5]. As it has been demonstrated, PUT and SPD contents only decreased in phyB mutants under far-red light in contrast to the white light conditions [14]. It was also reported that the stimulating effect of red light on the activities of ADC and S-adenosylmethionine decarboxylase enzymes could be reversed with the application of far-red light, implicating Phy again in the regulation of PA biosynthesis. While blue light-induced changes in PA synthesis enzyme activity could not be reversed by far-red light, thus the influence of PA synthesis via different signal transduction pathways suggests the involvement of a separate blue-light receptor [46,47]. Despite the well-recognized differences between the expression of AtADC2 in the two SPM-treated genotypes, as well as under different light regimes, SPM treatment increased the PUT level similarly in both genotypes, which was independent of the light conditions, suggesting that other processes than the synthesis are involved.
The AtSPDS2 transcription levels did not differ pronouncedly between the two genotypes under L1, L2 and L3 conditions indicating less influence of PhyA and, in turn, far-red light on the regulation of SPD synthesis than on PUT synthesis. In addition, the lowest AtSPDS2 expression level was found in both genotypes under the L3 light treatment, which suggests the negative impact of blue light on this PA biosynthetic enzyme. Nevertheless, no remarkable changes were observed in the SPD levels after the treatments. SPM treatment decreased the expression of AtSPDS2 in both genotypes; in addition, it slightly decreased SPD levels under L1 and L2 conditions.
The expression level of AtSPMS downregulated in phyA mutant compared to the wild type under L1 and L2 light treatments, while under L3 light conditions, it was initially the lowest. These results further support the hypothesis that PhyA has a role in the synthesis of PAs (in this case, that of SPM), and blue light suppresses it. However, SPM treatment induced the highest increment under L3 in Col-0; a slight increase in both genotypes was induced under L2, while under L1, the transcript level of AtSPMS increased only in the mutant. This is in contradiction with the response of SPM non-treated plants, which means that the high concentration of SPM could influence PhyA signaling in opposite feedback, at least under white light conditions. Moreover, AtSPMS upregulation under L3 conditions after SPM treatment indicates that the high SPM level stimulated the production of SPM biosynthetic enzyme by a blue light signal. Despite the modifications of the enzyme expression, the pattern of SPM changes did not follow the tendency of AtSPMS expression levels, as the SPM concentration was very similar in both genotypes under the three applied light treatments. Exogenous SPM increased the SPM level in Col-0 and phyA under L1 and L2 light conditions equally, suggesting that SPM was transported from the roots to the leaves. Moreover, lower SPM accumulation under higher far-red light irradiance may have resulted from the conversion of SPM, but this process was not driven by PhyA. The SPM accumulation in SPM-treated Col-0 was double that of the phyA mutant under the L3 condition, which is clear evidence that PhyA-induced accumulation of SPM under higher blue light irradiance and high SPM concentrations and that PhyA is influenced by blue light. This process was probably regulated at the level of PA degradation and SPM back-conversion and not by PA synthesis. However, modification in the PA uptake transport mechanisms cannot be excluded too.
The AtCuAO1 expression was independent of the light condition or the phyA mutation. However, SPM induced AtCuAO1 expression in the mutant genotypes under L1 and L3 light conditions. Therefore, the gene expression pattern of AtCuAO1 was partly similar to that of AtADC2 under L1 and L3, suggesting that the higher SPM concentration-induced de novo synthesis of PUT was compensated by its higher degradation in the mutant plants. In turn, no differences were observed in the actual PUT contents. The expression level of AtCuAO3 did not show pronounced changes but was downregulated under L3 conditions in Col-0. It indicates that higher blue light irradiance diminished the degradation of PUT under the control of PhyA. The initially higher AtCuAO3 expression in phyA mutant under the L3 regime might reflect the involvement of PhyA in this process, which is similar to the above-mentioned modifications in AtCuAO1 expression under SPM treatment combined with L3 conditions. Slight increases in AtCuAO3 expression after SPM application in both genotypes under L1 light and in Col-0 under L3 indicate that this process is dependent on the actual level of PAs. It is possible that PAs might affect the phosphorylation of light receptors, probably not only PhyA [48] and enhance their role in gene transcription [49], or that PAs directly stimulate the translation of PhyA and other genes [50].
Excess SPM in the nutrition solution increased SPM content in the leaves, which in turn induced the expression of AtPAO2 under all the light conditions regardless of the genotypes. At the same time, AtPAO5 levels were initially the lowest under L3 conditions in Col-0 plants indicating suppressed back-conversion and suggesting again the influence of PhyA under intensive blue light irradiance (similarly to genes of biosynthetic: AtADC2, AtSPDS and AtSPMS, and degradation enzymes: AtCuAO3). SPM treatment mostly induced the AtPAO5 expression, especially under L2 conditions, but under L3 conditions only in Col-0 plants. Under the L2 condition in both genotypes, the initial level of AtPAO5 expression was higher than that was detected under L1 conditions in Col-0 or phyA mutant plants. This higher expression already without SPM treatment under far-red light suggests a higher inducibility of the back-conversion mechanism, which in turn can be responsible for the lower SPM accumulation after SPM treatment under L2 light condition. The initially higher transcript level of AtPAO5 in the mutant plant compared to the wild type under L3 conditions can be again in relation to the observed lower SPM content in SPM-treated mutants under L3 light conditions.
A close, positive relation between PUT the SPM content, and both PUT and SPM contents with ADC2, SPMS and PAO2 expression levels showed that the increase in SPM content not only resulted from the uptake of SPM from the hydroponic solution but the in vivo synthesis of SPM was also induced. SPM treatment also increased the PUT content due to the activation of the in vivo PUT synthesis, and parallel with it, the more intensive SPM-SPD-PUT back-conversion pathway could be responsible, too. Close, negative relations between PUT or SPM levels and SPD content and SPDS2 transcript level indicate that the accumulation of PUT and SPM occurred at the expense of SPD content. Furthermore, a strong, negative correlation between SPD content and PAO2 and PAO5 expression levels confirmed that lower SPD content has resulted from not only the decreased SPDS expression but also the induced back conversion. The PCA analysis reflected that L3 light conditions had a specific effect on the PA metabolism, and SPM treatment was a more significant factor for the distinction of treated plants. Without SPM treatment, the treatments groups of L1 and L2 light conditions, both of the wild type and mutant genotypes, were separated from that of the L3 light, while after SPM treatment, the treatment group of mutant plants under L1 and L3 were similar to each other and partly different from the others (mutant under L2 light and wild type under all light conditions).
Previously, we have demonstrated that among PAs applied hydroponically, especially SPM-induced rapid PA responses in the leaves of Col-0 Arabidopsis plants under white light conditions. The SPM application induced the PUT accumulation due to the increased expression level of AtADC2; the level of SPD did not change; however, the transcript levels of AtSPDS1 and two slightly decreased, while the expression of AtSPMS increased [36]. These results indicate that SPM could influence the de novo synthesis of PAs. Partly similar results were found in the present experiment, as SPM induced the synthesis of PUT and activated the expression of AtADC2 and AtSPMS but decreased that of the AtSPDS2. In wheat, it was also demonstrated that the effect of supplementary blue and far-red light was opposite on the PA metabolism-related gene expression in the leaves; in addition, PA treatment could partly reverse these differences [39]. Nevertheless, in the present study, we first demonstrated that the responses of wild-type and phyA mutant plants are partly different and depend on the light spectral conditions. Our results on changes induced by SPM treatment reflected that PhyA under blue light might primarily inhibit SPM back-conversion and subsequently downregulate PUT synthesis.

4. Materials and Methods

4.1. Plant Material, Plant Growth Conditions and Treatments

In the present experiment, the phyA-T mutant Arabidopsis (SALK_014575C), T-DNA insertion line in Col-0 background [51] was investigated, where Col-0 ecotype was used as control. Seeds were obtained from the European Arabidopsis Stock Centre (NASC, Sutton Bonington Campus, Loughborough, LE125RD, United Kingdom). The plants were self-pollinated for two generations, and the presence of the mutation was confirmed by genotyping (Supplementary Figure S2). The phyA mutant is a T-DNA insertion line created by SALK Institute/SAIL, so the genotyping primers (Supplementary Table S1) were designed with the help of signal.salk.edu/tdnaprimers.2.html website.
Plants were cultivated hydroponically using an Araponics system (Araponics, Liège, Belgium). For hydroponic solution, 25% Murashige and Skoog Medium (Duchefa) were used. Plants were grown in a Conviron GB-48 phytochamber (Controlled Environments, Winnipeg, MB, Canada) under control conditions at 22/20 °C with 8/16 h light/dark period and 75% humidity for 28 days.
Plants were grown under different spectral conditions at the same light intensity from germination (100 µmol m−2 s−1). Three different light regimens were established using modules equipped with a continuous wide spectrum LED (Philips Lumileds, LXZ2-5790-y) and three narrow bands of LEDs with the dominant wavelengths of 448 nm (Philips Lumileds, LXZ1-PR01); 655 nm (Philips Lumileds, LXZ1-PA01); 750 nm (Edison Edixeon, 2ER101FX00000001). All light source modules were equipped with these LEDs, and each type of LED could be independently controlled within the module. The spectral composition of the three applied light treatments used in the experiments is described in Table 2. The spectral composition was chosen with some modifications based on our previous study, where the effects of supplementary blue and far-red light and their combination was investigated on PA metabolism, and blue light caused a drastic decrease in the gene expression level of PA metabolism-related gene expression, while the far-red light-induced slight increase of them in the leaves of wheat plants [39].
Four-week-old plants were treated with 0.5 mM spermine (SPM) for one day, which was added directly to the nutrient solution. The concentration and the duration of SPM treatment were chosen based on our previous study, where 1 day 0.5 mM SPM treatment was sufficient and induced the most pronounced changes in polyamine metabolism compared to putrescine or spermidine application [36]. Thereafter shoots were collected, measured for shoot weight parameter, and fully developed leaves were frozen immediately in liquid nitrogen. Samples were stored at −80 °C until further analysis.

4.2. Chlorophyll-A Fluorescence Induction (FI) Analysis

The FI analysis was carried out using pulse amplitude modulated fluorometer (PAM) with a blue LED-Array Illumination Unit IMAG-MAX/L (λ = 450 nm) (Imaging-PAM M-Series, Walz, Effeltrich, Germany) on the fully expanded leaves of Arabidopsis plants, which were exposed to dark for 15 min in order to reach the open state of the acceptor side of the electron transport chain. The determination of the maximum quantum efficiency (Fv/Fm) and the actual quantum yield [Y(II)] of photosystem 2 was carried out as it was described in [39].

4.3. Polyamine Analysis

Leaf samples were homogenized in 2 mL 0.2 N HClO4, and the homogenates were centrifuged at 4 °C for 10 min, with 10,000× g. The supernatant was used for the pre-column derivatization with dansyl chloride. PUT, SPD, SPM, and one of the products of terminal catabolism of SPD and SPM, 1,3-diaminopropane (DAP), were analyzed on a reverse phase Kinetex column (C18, 100 × 2.1 mm, 5 μm, Phenomenex, Inc., Torrance, CA, USA) by HPLC consists of a W2690 separation module and a W474 scanning fluorescence detector with excitation at 340 nm and emission at 515 nm (Waters, Milford, MA, USA) according to [39]. 2 μL of the derivatized sample injected onto the column, two types of solvents were used during the measurement (A: 44%ACN C: ACN: MeOH = 7:3). Gradient program was used for separation and during the analysis the flow rate was 0.5 mL min−1, and the column temperature was 40 °C. Data evaluation was performed using the Millenium32 program (WATERS, Milford, MA, USA).

4.4. Gene Expression Analysis

For gene expression studies, fully developed leaves of the wild type and the phyA mutant were taken at the end of the treatments and immediately stored in liquid nitrogen. Total RNA extraction and cDNA synthesis was performed as described in [36] using TRI Reagent, Direct-zol™ RNA MiniPrep Kit (Zymo Research, Irvine, CA, USA), including on-column Dnase I treatment for RNA purification and with M-MLV Reverse Transcriptase (Promega Corporation, Madison, WI, USA) and oligo (dT)18 (Thermo Fisher Scientific Inc., Wilmington, MA, USA) for cDNA synthesis according to the manufacturer’s instructions. For RT-qPCR measurements, a BioRad CFX96 Touch Real-Time Detection System was used with 1 µL 4-fold diluted cDNA, 200 nM forward and reverse primers (primer sequences are available in Table 3), 2.5 uL PCRBIO Mastermix (PCR Biosystem Ltd., London, United Kingdom) and 2.5 ul molecular grade water. Relative transcript levels were determined with the 2−ΔΔCt method [52], with AtActin8 as the internal control gene, and values were compared to the control Col-0 genotype grown under L1 light condition.

4.5. Statistical Analysis

The results are the means of 14 biological replicates for biomass parameters, five biological replicates for chlorophyll-a fluorescence induction measurement, and at least three biological replicates for chromatographic determinations. All reactions for gene expression analyses were performed in triplicate using 3 biological and 3 technical repetitions. The data were statistically evaluated using the standard deviation in Microsoft Excel (STDEV.S function) with n ≥ 3. Different letters indicate statistically significant differences (p < 0.05) between multiple groups (one-way ANOVA with Duncan’s post hoc test was performed using SPSS 16.0). Pearson’s correlation coefficients were calculated using the SPSS 16.0 version. The principal component analysis (PCA) was carried out in the R environment (ver. 4.0.3) using the packages FactoMineR, factoextra and ggplot2.

5. Conclusions

Light spectrum significantly affects PA metabolism-related genes. Under the used experimental conditions, the blue light influences the synthesis side, while the far-red light affects on the catabolism and back-conversion of the PAs. The observed responses to elevated far-red light were found to be less dependent on PhyA, as the mutation alone induced no remarkable differences. Contrarily, the blue light response seems to be highly dependent on PhyA signaling. PhyA under higher blue light irradiance downregulated the transcript levels of genes involved in PA synthesis, back-conversion and degradation compared to the white light.
Our results demonstrated that phyA mutation has some influence on PA metabolism. The PA metabolism-related gene expression of the wild type and the phyA mutant plants responded more similarly under white and far-red light conditions than under blue light conditions. The highest differences between the two genotypes were observed under the blue light treatment. Nevertheless, the PA contents were similar under all the light conditions in the two genotypes without SPM application, suggesting that a stable PA pool is important for normal plant growth conditions even under different light spectral conditions. The proper shift in PA levels required a well-maintained dynamic balance of PAs through fine-tuning of PA metabolism. However, SPM treatment brought out more differences in metabolite and gene expression levels. After SPM treatment, the blue dominant spectral regime has more similar effects on PUT synthesis/catabolism and SPM to PUT canalization to the white light than the far-red light conditions. The additive effect of differences observed on the synthesis, back-conversion and catabolism side of PUT metabolism may be responsible for the similar PUT content pattern under all light conditions, even in the presence of an excess SPM. However, the regulatory system was well fine-tuned, and no alterations were detected at the level of PAs; only the SPM content differed significantly between the two genotypes after SPM treatment under blue light conditions. Figure 6. presents the hypothesized mode of action of SPM treatment on PA metabolism under different light spectral compositions and the influence of PhyA on it.
Nevertheless, as PhyA may not only serve as a photoreceptor but regulates genes other than light-responsive ones (including members of morphogenesis, hormone, stress, and defense signaling pathways) through the interaction with corresponding transcription factors, further research is necessary to uncover the proper mechanisms of interaction between PAs and light-regulated processes.

Supplementary Materials

The following supporting information can be downloaded at: https://www.mdpi.com/article/10.3390/plants12081689/s1, Supplementary Figure S1. (a) The actual quantum efficiency of photosystem II [Y(II)] chlorophyll-a fluorescence induction parameter determined at the steady state level of photosynthesis of the leaves (b) of wild type (Col-0) and mutant (phyA) Arabidopsis plants grown under three different light regimes (L1: blue%: 19.139, green%: 30.62, red%: 48.8 and far-red%: 1.44; L2: blue%: 19.57, green%: 29.57, red%: 40.43 and far-red%: 10.43; L3: blue%: 39.38, green%: 28.76, red%: 30.53 and far-red%: 1.33) treated with or without 0.5 mM spermine (control: C and spermine: SPM). Values are means ± SD (n = 5 for Y(II)). Different letters indicate statistically significant differences at p < 0.05 level, using Duncan’s post hoc test. (b) The chlorophyll fluorescence imaging screens of Y(II) in the leaves under different treatments and light conditions created by the Imaging PAM instrument. The colored bar shows the range of pixel intensity values. Supplementary Figure S2. Confirmation of T-DNA inzertion in phyA mutant. PCR of the genomic DNA of Col-0 and phyA mutant plants. PCR fragments were obtained using the primer pairs LP and RP and/or LBb1.3 (T-DNA specific primer) and RP, respectively. Primers are listed in Supplemental Table S1. Supplementary Table S1. Primer sequences for genotyping of phyA mutation.

Author Contributions

M.P.: conceptualization, supervision, investigation, visualization, analysis, writing, funding. A.R. and J.T.: investigation and analysis, writing, review editing. I.M.: investigation and analysis, review editing. M.A.: methodology, analysis. S.P. and T.J.: data curation, writing, review and editing. All authors have read and agreed to the published version of the manuscript.

Funding

This work was financed by a grant from the National Research Development and Innovation Office, Hungary (NKFIH K134395) and by the Czech-Hungarian Academical Bilateral Grant (NKM-4/2022).

Data Availability Statement

Data is contained within the article or Supplementary Material.

Conflicts of Interest

The authors declare no conflict of interest.

References

  1. Poorter, H.; Niinemets, Ü.; Ntagkas, N.; Siebenkäs, A.; Mäenpää, M.; Matsubara, S.; Pons, T. A meta-analysis of plant responses to light intensity for 70 traits ranging from molecules to whole plant performance. New Phytol. 2019, 223, 1073–1105. [Google Scholar] [CrossRef] [PubMed]
  2. Sharrock, R.A. The phytochrome red/far-red photoreceptor superfamily. Genome Biol. 2008, 9, 230. [Google Scholar] [CrossRef] [PubMed]
  3. Legris, M.; Ince, Y.Ç.; Fankhauser, C. Molecular mechanisms underlying phytochrome-controlled morphogenesis in plants. Nat. Commun. 2019, 10, 5219. [Google Scholar] [CrossRef]
  4. Sharrock, R.A.; Clack, T. Patterns of expression and normalized levels of the five Arabidopsis phytochromes. Plant Physiol. 2002, 130, 442–456. [Google Scholar] [CrossRef] [PubMed]
  5. Fankhauser, C. The phytochromes, a family of red/far-red absorbing photoreceptors. J. Biol. Chem. 2001, 276, 11453–11456. [Google Scholar] [CrossRef]
  6. Oh, S.; Warnasooriya, S.N.; Montgomery, B.L. Downstream effectors of light- and phytochrome-dependent regulation of hypocotyl elongation in Arabidopsis thaliana. Plant Mol. Biol. 2013, 81, 627–640. [Google Scholar] [CrossRef]
  7. Wimalasekera, R.; Villar, C.; Begum, T.; Scherer, G.F. COPPER AMINE OXIDASE1 (CuAO1) of Arabidopsis thaliana contributes to abscisic acid- and polyamine-induced nitric oxide biosynthesis and abscisic acid signal transduction. Mol. Plant 2011, 4, 663–678. [Google Scholar] [CrossRef]
  8. Arana, M.V.; Tognacca, R.S.; Estravis-Barcalá, M.; Sánchez, R.A.; Botto, J.F. Physiological and molecular mechanisms underlying the integration of light and temperature cues in Arabidopsis thaliana seeds. Plant Cell Environ. 2017, 40, 3113–3121. [Google Scholar] [CrossRef]
  9. Xiang, S.; Wu, S.; Jing, Y.; Chen, L.; Yu, D. Phytochrome B regulates jasmonic acid-mediated defense response against Botrytis cinerea in Arabidopsis. Plant Divers. 2022, 44, 109–115. [Google Scholar] [CrossRef]
  10. Desai, M.; Hu, J. Light induces peroxisome proliferation in Arabidopsis seedlings through the photoreceptor phytochrome A, the transcription factor HY5 HOMOLOG, and the peroxisomal protein PEROXIN11b. Plant Physiol. 2008, 146, 1117–1127. [Google Scholar] [CrossRef]
  11. Prerostova, S.; Dobrev, P.I.; Knirsch, V.; Jarosova, J.; Gaudinova, A.; Zupkova, B.; Prášil, I.T.; Janda, T.; Brzobohatý, B.; Skalák, J.; et al. Light quality and intensity modulate cold acclimation in Arabidopsis. Int. J. Mol. Sci. 2021, 22, 2736. [Google Scholar] [CrossRef] [PubMed]
  12. Jumtee, K.; Bamba, T.; Okazawa, A.; Fukusaki, E.; Kobayashi, A. Integrated metabolite and gene expression profiling revealing phytochrome A regulation of polyamine biosynthesis of Arabidopsis thaliana. J. Exp. Bot. 2008, 59, 1187–1200. [Google Scholar] [CrossRef] [PubMed]
  13. Jumtee, K.; Okazawa, A.; Harada, K.; Fukusaki, E.; Takano, M.; Kobayashi, A. Comprehensive metabolite profiling of phyA phyB phyC triple mutants to reveal their associated metabolic phenotype in rice leaves. J. Biosci. Bioeng. 2009, 108, 151–159. [Google Scholar] [CrossRef]
  14. Han, X.; Tohge, T.; Lalor, P.; Dockery, P.; Devaney, N.; Esteves-Ferreira, A.A.; Fernie, A.R.; Sulpice, R. Phytochrome A and B regulate primary metabolism in Arabidopsis leaves in response to light. Front. Plant Sci. 2017, 8, 1394. [Google Scholar] [CrossRef] [PubMed]
  15. Kim, W.; Źeljković, S.C.; Piskurewicz, U.; Megies, C.; Tarkowski, P.; Lopez-Molina, L. Polyamine uptake transporter 2 (put2) and decaying seeds enhance phyA-mediated germination by overcoming PIF1 repression of germination. PLoS Genet. 2019, 15, e1008292. [Google Scholar] [CrossRef]
  16. Chun, L.; Kawakami, A.; Christopher, D.A. Phytochrome A mediates blue light and UV-A-dependent chloroplast gene transcription in green leaves. Plant Physiol. 2001, 125, 1957–1966. [Google Scholar] [CrossRef]
  17. Sullivan, S.; Hart, J.E.; Rasch, P.; Walker, C.H.; Christie, J.M. Phytochrome A mediates blue-light enhancement of second-positive phototropism in Arabidopsis. Front. Plant Sci. 2016, 7, 290. [Google Scholar] [CrossRef]
  18. Warnasooriya, S.N.; Porter, K.J.; Montgomery, B.L. Tissue- and isoform-specific phytochrome regulation of light-dependent anthocyanin accumulation in Arabidopsis thaliana. Plant Signal. Behav. 2011, 6, 624–631. [Google Scholar] [CrossRef]
  19. Kong, Y.; Zheng, Y. Phototropin is partly involved in blue-light-mediated stem elongation, flower initiation, and leaf expansion: A comparison of phenotypic responses between wild Arabidopsis and its phototropin mutants. Environ. Exp. Bot. 2020, 171, 103967. [Google Scholar] [CrossRef]
  20. Usami, T.; Mochizuki, N.; Kondo, M.; Nishimura, M.; Nagatani, A. Cryptochromes and phytochromes synergistically regulate Arabidopsis root greening under blue light. Plant Cell Physiol. 2004, 45, 1798–1808. [Google Scholar] [CrossRef]
  21. Sheng, S.; Wu, C.; Xiang, Y.C.; Pu, W.X.; Duan, S.H.; Huang, P.J.; Cheng, X.Y.; Gong, Y.Y.; Liang, Y.L.; Liu, L.H. Polyamine: A potent ameliorator for plant growth response and adaption to abiotic stresses particularly the ammonium stress antagonized by urea. Front. Plant Sci. 2022, 13, 783597. [Google Scholar] [CrossRef] [PubMed]
  22. Pál, M.; Szalai, G.; Janda, T. Speculation: Polyamines are important in abiotic stress signaling. Plant Sci. 2015, 237, 16–23. [Google Scholar] [CrossRef] [PubMed]
  23. Chen, F.; Li, B.; Li, G.; Charron, J.-B.; Dai, M.; Shi, X.; Deng, X.W. Arabidopsis Phytochrome A directly targets numerous promoters for individualized modulation of genes in a wide range of pathways. Plant Cell 2014, 26, 1949–1966. [Google Scholar] [CrossRef]
  24. Pál, M.; Szalai, G.; Gondor, O.K.; Janda, T. Unfinished story of polyamines: Role of conjugation, transport and light-related regulation in the polyamine metabolism in plants. Plant Sci. 2021, 308, 110923. [Google Scholar] [CrossRef] [PubMed]
  25. Hummel, I.; Bourdais, G.; Gouesbet, G.; Couée, I.; Malmber, R.L.; El Amrani, A. Differential gene expression of arginine decarboxylase ADC1 and ADC2 in Arabidopsis thaliana: Characterization of transcriptional regulation during seed germination and seedling development. New Phytol. 2004, 163, 519–531. [Google Scholar] [CrossRef]
  26. Marco, F.; Busó, E.; Carrasco, P. Overexpression of SAMDC1 gene in Arabidopsis thaliana increases expression of defense-related genes as well as resistance to Pseudomonas syringae and Hyaloperonospora arabidopsidis. Front. Plant Sci. 2014, 5, 115. [Google Scholar] [CrossRef]
  27. Urano, K.; Yoshiba, Y.; Nanjo, T.; Igarashi, Y.; Seki, M.; Sekiguchi, F.; Yamaguchi-Shinozaki, K.; Shinozaki, K. Characterization of Arabidopsis genes involved in biosynthesis of polyamines in abiotic stress responses and developmental stages. Plant Cell Environ. 2003, 26, 1917–1926. [Google Scholar] [CrossRef]
  28. Hanzawa, Y.; Imai, A.; Michael, A.J.; Komeda, Y.; Takahashi, T. Characterization of the spermidine synthase-related gene family in Arabidopsis thaliana. FEBS Lett. 2002, 527, 176–180. [Google Scholar] [CrossRef]
  29. Planas-Portell, J.; Gallart, M.; Tiburcio, A.F.; Altabella, T. Copper-containing amine oxidases contribute to terminal polyamine oxidation in peroxisomes and apoplast of Arabidopsis thaliana. BMC Plant Biol. 2013, 13, 109. [Google Scholar] [CrossRef]
  30. Takahashi, Y.; Cong, R.; Sagor, G.H.; Niitsu, M.; Berberich, T.; Kusano, T. Characterization of five polyamine oxidase isoforms in Arabidopsis thaliana. Plant Cell Rep. 2010, 29, 955–965. [Google Scholar] [CrossRef]
  31. Fincato, P.; Moschou, P.N.; Ahou, A.; Angelini, R.; Roubelakis-Angelakis, K.A.; Federico, R.; Tavladoraki, P. The members of Arabidopsis thaliana PAO gene family exhibit distinct tissue- and organ-specific expression pattern during seedling growth and flower development. Amino Acids 2012, 42, 831–841. [Google Scholar] [CrossRef] [PubMed]
  32. Kim, D.W.; Watanabe, K.; Murayama, C.; Izawa, S.; Niitsu, M.; Michael, A.J.; Berberich, T.; Kusano, T. Polyamine oxidase5 regulates Arabidopsis thaliana growth through a thermospermine oxidase activity. Plant Physiol. 2014, 165, 1575–1590. [Google Scholar] [CrossRef] [PubMed]
  33. Zarza, X.; Atanasov, K.E.; Marco, F.; Arbona, V.; Carrasco, P.; Kopka, J.; Fotopoulos, V.; Munnik, T.; Gómez-Cadenas, A.; Tiburcio, A.F.; et al. Polyamine oxidase 5 loss-of-function mutations in Arabidopsis thaliana trigger metabolic and transcriptional reprogramming and promote salt stress tolerance. Plant Cell Environ. 2017, 40, 527–542. [Google Scholar] [CrossRef] [PubMed]
  34. Kaszler, N.; Benkő, P.; Bernula, D.; Szepesi, Á.; Fehér, A.; Gémes, K. Polyamine metabolism is involved in the direct regeneration of shoots from Arabidopsis lateral root primordia. Plants 2021, 10, 305. [Google Scholar] [CrossRef]
  35. Wimalasekera, R.; Schaarschmidt, F.; Angelini, R.; Cona, A.; Tavladoraki, P.; Scherer, G.F. POLYAMINE OXIDASE2 of Arabidopsis contributes to ABA mediated plant developmental processes. Plant Physiol. Biochem. 2015, 96, 231–240. [Google Scholar] [CrossRef]
  36. Tajti, J.; Hamow, K.Á.; Majláth, I.; Gierczik, K.; Németh, E.; Janda, T.; Pál, M. Polyamine-induced hormonal changes in eds5 and sid2 mutant Arabidopsis plants. Int. J. Mol. Sci. 2019, 20, 5746. [Google Scholar] [CrossRef]
  37. Hunter, D.C.; Burritt, D.J. Light quality influences the polyamine content of lettuce (Lactuca sativa L.) cotyledon explants during shoot production in vitro. Plant Growth Regul. 2005, 45, 53–61. [Google Scholar] [CrossRef]
  38. Gondor, O.K.; Tajti, J.; Hamow, K.Á.; Majláth, I.; Szalai, G.; Janda, T.; Pál, M. Polyamine metabolism under different light regimes in wheat. Int. J. Mol. Sci. 2021, 22, 11717. [Google Scholar] [CrossRef]
  39. Pál, M.; Hamow, K.Á.; Rahman, A.; Majláth, I.; Tajti, J.; Gondor, O.K.; Ahres, M.; Gholizadeh, F.; Szalai, G.; Janda, T. Light spectral composition modifies polyamine metabolism in young wheat plants. Int. J. Mol. Sci. 2022, 23, 8394. [Google Scholar] [CrossRef]
  40. Takács, Z.; Poór, P.; Tari, I. Comparison of polyamine metabolism in tomato plants exposed to different concentrations of salicylic acid under light or dark conditions. Plant Physiol. Biochem. 2016, 108, 266–278. [Google Scholar] [CrossRef]
  41. Majumdar, R.; Shao, L.; Turlapati, S.A.; Minocha, S.C. Polyamines in the life of Arabidopsis: Profiling the expression of S-adenosylmethionine decarboxylase (SAMDC) gene family during its life cycle. BMC Plant Biol. 2017, 17, 264. [Google Scholar] [CrossRef] [PubMed]
  42. Devlin, P.F.; Halliday, K.J.; Harberd, N.P.; Whitelam, G.C. The rosette habit of Arabidopsis thaliana is dependent upon phytochrome action: Novel phytochromes control internode elongation and flowering time. Plant J. 1996, 10, 1127–1134. [Google Scholar] [CrossRef] [PubMed]
  43. Eskins, K. Light-quality effects on Arabidopsis development. Red, blue and far-red regulation of flowering and morphology. Physiol. Plant 1992, 86, 439–444. [Google Scholar] [CrossRef]
  44. Kurepin, L.V.; Walton, L.J.; Hayward, A.; Emery, R.J.N.; Pharis, R.P.; Reid, D.M. Interactions between plant hormones and light quality signaling in regulating the shoot growth of Arabidopsis thaliana seedlings. Botany 2012, 90, 237–246. [Google Scholar] [CrossRef]
  45. Liu, T.; Dobashi, H.; Kim, D.W.; Sagor, G.H.; Niitsu, M.; Berberich, T.; Kusano, T. Arabidopsis mutant plants with diverse defects in polyamine metabolism show unequal sensitivity to exogenous cadaverine probably based on their spermine content. Physiol. Mol. Biol. Plants 2014, 20, 151–159. [Google Scholar] [CrossRef]
  46. Dai, Y.R.; Galston, A.W. Simultaneous phytochrome controlled promotion and inhibition of arginine decarboxylase activity in buds and epicotyls of etiolated peas. Plant Physiol. 1981, 67, 266–269. [Google Scholar] [CrossRef]
  47. Yoshida, I.; Yamagata, H.; Hirasawa, E. Signal transduction controlling the blue- and red-light mediated gene expression of S-adenosylmethionine decarboxylase in Pharbitis nil. J. Exp. Bot. 2002, 53, 1525–1529. [Google Scholar]
  48. Yadav, A.; Singh, D.; Lingwan, M.; Yadukrishnan, P.; Masakapalli, S.K.; Datta, S. Light signaling and UV-B-mediated plant growth regulation. J. Integr. Plant Biol. 2020, 62, 1270–1292. [Google Scholar] [CrossRef]
  49. Chen, D.; Shao, Q.; Yin, L.; Younis, A.; Zheng, B. Polyamine function in plants: Metabolism, regulation on development, and roles in abiotic stress responses. Front. Plant Sci. 2019, 9, 1945. [Google Scholar] [CrossRef]
  50. Sakamoto, A.; Terui, Y.; Uemura, T.; Igarashi, K.; Kashiwagi, K. Polyamines regulate gene expression by stimulating translation of histone acetyltransferase mRNAs. J. Biol. Chem. 2020, 295, 8736–8745. [Google Scholar] [CrossRef]
  51. Alonso, J.M.; Stepanova, A.N.; Leisse, T.J.; Kim, C.J.; Chen, H.; Shinn, P.; Stevenson, D.K.; Zimmerman, J.; Barajas, P.; Cheuk, R.; et al. Genome-wide insertional mutagenesis of Arabidopsis thaliana. Science 2003, 301, 653–657. [Google Scholar] [CrossRef] [PubMed]
  52. Livak, K.J.; Schmittgen, T.D. Analysis of relative gene expression data using real-time quantitative PCR and the 2−ΔΔCT. Methods 2001, 25, 402–408. [Google Scholar] [CrossRef] [PubMed]
  53. Jubault, M.; Hamon, C.; Gravot, A.; Lariagon, C.; Delourme, R.; Bouchereau, A.; Manzanares-Dauleux, M.J. Differential regulation of root arginine catabolism and polyamine metabolism in clubroot-susceptible and partially resistant Arabidopsis genotypes. Plant Physiol. 2008, 146, 2008–2019. [Google Scholar] [CrossRef] [PubMed]
  54. Kamada-Nobusada, T.; Hayashi, M.; Fukazawa, M.; Sakakibara, H.; Nishimura, M. A putative peroxisomal polyamine oxidase, AtPAO4, is involved in polyamine catabolism in Arabidopsis thaliana. Plant Cell Physiol. 2008, 49, 1272–1282. [Google Scholar] [CrossRef] [PubMed]
  55. Sagor, G.H.M.; Kusano, T.; Berberich, T. A polyamine oxidase from Selaginella lepidophylla (SelPAO5) can replace AtPAO5 in Arabidopsis through converting thermospermine to norspermidine instead to spermidine. Plants 2019, 8, 99. [Google Scholar] [CrossRef]
Figure 1. Shoot weight (A) and the maximum quantum efficiency of photosystem II (Fv/Fm) chlorophyll-a fluorescence induction parameter determined at the steady state level of photosynthesis of the leaves (B) of wild type (Col-0) and mutant (phyA) Arabidopsis plants grown under three different light regimes (L1: blue%: 19.139, green%: 30.62, red%: 48.8 and far-red%: 1.44; L2: blue%: 19.57, green%: 29.57, red%: 40.43 and far-red%: 10.43; L3: blue%: 39.38, green%: 28.76, red%: 30.53 and far-red%: 1.33) treated with or without 0.5 mM spermine (control: C and spermine: SPM). Values are means ± SD (n = 14 for shoot weight and n = 5 for Fv/Fm). Different letters indicate statistically significant differences at p < 0.05 level, using Duncan’s post hoc test.
Plants 12 01689 g001
Figure 2. Changes in the expression levels of polyamine synthesis-related genes, namely arginine decarboxylase (AtADC2) (A), spermidine synthase (AtSPD2) (B) and spermine synthase (AtSPMS) (C) of wild type (Col-0) and mutant (phyA) Arabidopsis plants grown under three different light regimes (L1: blue%: 19.139, green%: 30.62, red%: 48.8 and far-red%: 1.44; L2: blue%: 19.57, green%: 29.57, red%: 40.43 and far-red%: 10.43; L3: blue%: 39.38, green%: 28.76, red%: 30.53 and far-red%: 1.33) treated with or without 0.5 mM spermine (control: C and spermine: SPM). Values are means ± SD (n = 3). Different letters indicate statistically significant differences at p < 0.05 level, using Duncan’s post hoc test.
Plants 12 01689 g002
Figure 3. Polyamine contents, namely putrescine (PUT) (A), spermidine (SPD) (B) and spermine (SPM) (C) of wild type (Col-0) and mutant (phyA) Arabidopsis plants grown under three different light regimes (L1: blue%: 19.139, green%: 30.62, red%: 48.8 and far-red%: 1.44; L2: blue%: 19.57, green%: 29.57, red%: 40.43 and far-red%: 10.43; L3: blue%: 39.38, green%: 28.76, red%: 30.53 and far-red%: 1.33) treated with or without 0.5 mM spermine (control: C and spermine: SPM). Values are means ± SD (n = 3). Different letters indicate statistically significant differences at p < 0.05 level, using Duncan’s post hoc test.
Plants 12 01689 g003
Figure 4. Changes in the expression levels of polyamine metabolism-related genes, namely copper-containing amine oxidases (AtCuAO1: (A) and AtCuAO3: (B)), and polyamine oxidases (AtPAO2: (C) and AtPAO5: (D)) in the leaves of wild type (Col-0) and mutant (phyA) Arabidopsis plants grown under three different light regimes (L1: blue%: 19.139, green%: 30.62, red%: 48.8 and far-red%: 1.44; L2: blue%: 19.57, green%: 29.57, red%: 40.43 and far-red%: 10.43; L3: blue%: 39.38, green%: 28.76, red%: 30.53 and far-red%: 1.33) treated with or without 0.5 mM spermine (control: C and spermine: SPM). Values are means ± SD (n = 3). Different letters indicate statistically significant differences at p < 0.05 level, using Duncan’s post hoc test.
Plants 12 01689 g004
Figure 5. The biplot illustration of PCA analysis was carried out on the standardized concentration values of polyamines and the relative expression values of polyamine metabolism-related genes. Squared cosine (cos2) shows how accurate the representation of our variables or individuals on the PC plane is. Dim1 and Dim2 are equivalent to principal components 1 and 2 (PC1 and PC2). Investigated parameters: PUT: putrescine content, SPD: spermidine content, SPM: spermine content, ADC2: expression level of arginine decarboxylase 2, SPDS2: expression level of spermidine synthase 2, SPMS: expression level of spermine synthase, CuAO1 and CuAO3: expression level of cooper amine-oxidase 1 and 3, PAO2 and PAO5: polyamine oxidase 2 and 5 genes. (Col-0 and phyA Arabidopsis plants grown under L1: blue%: 19.139, green%: 30.62, red%: 48.8 and far-red%: 1.44; L2: blue%: 19.57, green%: 29.57, red%: 40.43 and far-red%: 10.43; L3: blue%: 39.38, green%: 28.76, red%: 30.53 and far-red%: 1.33) treated with or without 0.5 mM spermine (control: C and spermine: SPM). Different colors and numbers indicate the 12 treatment combinations.
Plants 12 01689 g005
Figure 6. Schematic mode of action of spermine (SPM) treatment on polyamine metabolism under different light spectral compositions and influence of PhyA on it. PUT: putrescine, SPD: spermidine, SPM: spermine content, AtADC2: arginine decarboxylase 2, AtSPDS2: spermidine synthase 2, AtSPMS: spermine synthase, AtCuAO3: cooper amine-oxidase 3, AtPAO2 and AtPAO5: polyamine oxidase 2 and 5. Blue lightning arrows indicate blue light treatment, red lightning arrows indicate far-red light treatment, SPM indicates spermine treatment, and PhyA means the presence of the wild type of phytochrome A. Different letters indicate statistically significant differences at p < 0.05 level, using Duncan’s post hoc test.
Plants 12 01689 g006
Table 1. Correlation analysis on the polyamine metabolism-related parameters. Strong significant correlations at 0.05 are in bold; a positive correlation is highlighted in green, and a negative correlation is highlighted in red. PUT: putrescine content, SPD: spermidine content, SPM: spermine content, ADC2: expression level of arginine decarboxylase 2, SPDS2: expression level of spermidine synthase 2, SPMS: expression level of spermine synthase, CuAO1 and CuAO3: expression level of cooper amine-oxidase 1 and 3, PAO2 and PAO5: polyamine oxidase 2 and 5 genes.
PUTSPDSPMADC2SPDS2SPMSCuAO1CuAO3PAO2PAO5
PUT1
SPD−0.5551
SPM0.915−0.5721
ADC20.688−0.3790.6171
SPDS2−0.5240.559−0.502−0.1881
SPMS0.737−0.2930.7530.710−0.1391
CuAO10.414−0.1470.3450.820−0.0950.5531
CuAO30.169−0.1240.1590.4130.1300.2610.4101
PAO20.834−0.5930.8290.688−0.4310.6660.4700.3991
PAO50.469−0.5000.4230.157−0.1350.334−0.0500.2600.4231
Table 2. Characteristics of the applied three light regimes. Light treatments are colored according to their typical characteristic; the light source for (L1: white color) was a continuous wide-spectrum LED; in the case of the L2 regimen (red color) elevated far-red component was applied, while under L3 light condition (blue color) the blue light component was the most dominant.
TreatmentIntensity PAR (µmol m−2 s−1)Blue µW/cm2 (400–500 nm)Green µW/cm2 (500–600 nm)Red µW/cm2 (600–700 nm)Far-red µW/cm2
(700–800 nm)
Blue/
Red
Red/
Far-Red
Blue%Green%Red%Far-Red%
L11004006401020300.393419.1430.6248.81.44
L21004506809302400.483.8819.5729.5740.4310.43
L3100890650690301.292339.3828.7630.531.33
Table 3. Primer sequences.
Gene NamePrimer Sequences (5′ → 3′)Amplicon
Size (bp)
References
AtActin8forwardTTACCCGACGGACAAGTGATC73[53]
reverseATGATGGCTGGAAAAGGACTTC
AtADC2forwardGCGATGGACCACACAGCTTT64
reverseAGAACATCCGCTGAGGACTGA
AtSPDS2forwardTTGCCCGTGAAGAGACCTAGA72
reverseTCCACCGTTCTCTGTTTCCAT
AtSPMSforwardTGGCTCCATACTCATCTTATTGAA72
reverseCGCATAGTGAACACTTTTGAATG
AtPAO2forwardGGAATGCCGGAAGATCTTCCGTGATTGTGATCGG142[54]
reverseCGATTCCAACACCGAGATTTGCATACTCCATGCAGC
AtPAO5forwardGTTGGGATGAACCAGAAGGA132[55]
reverseGAGGAGCCTCGGTAAGAAGA
AtCuAO1forwardAGCTGGCGACATTCTGAGAT238[29]
reverseGTCCAGCATCATCCTCCCTA
AtCuAO3forwardGTAAGTTTGTGCCACTCCCCC153
reverseGCCACTCGACAAAGTACCCCC
Disclaimer/Publisher’s Note: The statements, opinions and data contained in all publications are solely those of the individual author(s) and contributor(s) and not of MDPI and/or the editor(s). MDPI and/or the editor(s) disclaim responsibility for any injury to people or property resulting from any ideas, methods, instructions or products referred to in the content.

