Article

In-Situ Synchrotron X-Ray Diffraction of Ti-6Al-4V During Thermomechanical Treatment in the Beta Field

by
Fernando Warchomicka
1,*,
David Canelo-Yubero
1,2,
Egon Zehetner
3,
Guillermo Requena
4,5,
Andreas Stark
6 and
Cecilia Poletti
1,7
1
Institute of Materials Science, Joining and Forming, Graz University of Technology, A-8010 Graz, Austria
2
Nuclear Physics Institute ASCR, CZ-25068 Řež near Prague, Czech Republic
3
Institute of Food Technology, University of Natural Resources and Life Sciences, A-1180 Vienna, Austria
4
Institute of Materials Science, German Aerospace Center (DLR), D-51147 Cologne, Germany
5
Metallic Structures and Materials Systems for Aerospace Engineering, Institute of Metal Forming, RWTH Aachen University, D-52062 Aachen, Germany
6
Institute of Materials Research, Helmholtz-Zentrum Geesthacht, D-21502 Geesthacht, Germany
7
Christian Doppler Laboratory for Design of High-Performance Alloys by Thermomechanical Processing, A-8010 Graz, Austria
*
Author to whom correspondence should be addressed.
Metals 2019, 9(8), 862; https://doi.org/10.3390/met9080862
Submission received: 25 June 2019 / Revised: 26 July 2019 / Accepted: 31 July 2019 / Published: 7 August 2019
(This article belongs to the Special Issue The Behaviours of Alloys under Thermo-Mechanical Treatment)

Abstract

:
This work aims to identify the mechanisms of restoration occurring in Ti-6Al-4V during hot plastic deformation and subsequent heat treatment. The allotropic phase transformation that occurs during cooling distorts the interpretation of the restoration mechanisms taking place at high temperatures. Therefore, analysis of deformed samples by conventional microscopy have led to controversies in the interpretation of the main dynamic restoration mechanism. Additionally, static restoration of the microstructure can occur during slow cooling, modifying the microstructure. These facts were mainly the reasons why discontinuous dynamic recrystallization and/or dynamic recovery has been reported as the main dynamic restoration mechanism for Ti-6Al-4V. In this work, we use in-situ synchrotron X-ray diffraction combined with conventional microscopy to determine the dynamic and static mechanisms of restoration during and after deformation at different strain rates. The results show dynamic recovery as main mechanism of restoration during deformation in the β field, denoted by sub-grain formation and a misorientation dependency of the strain rate. After deformation, static recrystallization, grain growth, and coarsening of the β grains can be observed, especially at strain rates higher than 0.1 s−1. It is also demonstrated that the nucleation of new grains can occur within the very first seconds of the isothermal heat treatment.

1. Introduction

The use of high performance materials has been continuously increased in different application fields due to the advances in the mechanical design and the evolution and optimization of the industrial processes [1,2]. Titanium α + β alloys are attractive for a wide range of applications such as aerospace, automotive, and medicine. This is due to their high specific bending stiffness and strength, together with a good corrosion resistance compared to other engineering alloys [3]. The material presents a large variety of microstructures and of mechanical properties after the thermomechanical processes. The best way of tuning these properties is to select the appropriate parameters and sequences for hot forming and heat treatments. Semiatin et al. summarized recently the importance of the β field processing to achieve certain mechanical properties in α + β titanium alloys. Therefore, they paid particular attention to the behavior of the β grains during recrystallization [4].
The deformation behavior of the β phase is strongly related to the stacking fault energy of the alloy. Titanium alloys with high stacking fault energy are prone to dynamic recovery at moderate deformation followed by geometrical or continuous dynamic recrystallization at larger deformations. The behavior is similar to what is observed in aluminum alloys [5,6]. If the chemical composition influences the stacking fault energy, it may affect the mechanism active during deformation [5,7]. Several works have analyzed the flow behavior of different titanium alloys during hot deformation, and different conclusions were drawn. In some cases, dynamic recovery was inferred from the steady state of the flow stress combined with low values of the strain rate sensitivity [8,9,10]. Discontinuous dynamic recrystallization (dDRX) was reported mostly after metallographic observations in samples of Ti-6Al-4V after deformation followed by uncontrolled cooling rate (e.g., [11,12,13]). A study in a near β titanium alloy combined water quenching immediately after hot compression with electron backscattered diffraction (EBSD) characterization to reveal that dominant mechanisms of the β-phase deformation were dynamic recovery (DRV) followed by continuous dynamic recrystallization (cDRX) [14]. The observation was possible because the β phase was fully retained at room temperature. The same procedure can be used for Ti-6Al-4V, although the formation of martensite α’ during quenching distorts the observation of the deformed β grains. The use of parent crystal reconstruction to reveal the β grains [15] was implemented to reconstruct the high temperature phase after deformation [16,17] and solidification [18]. Poletti et al. [16] analyzed the behavior of Ti-6Al-4V after hot deformation and water quenching by the reconstruction of the parent β. They could reconstruct sub-grains and account for the local misorientation to conclude that DRV followed by cDRX is the main mechanism of restoration. In this way, previous works of Warchomicka et al. suggesting dDRX in a Ti-6Al-4V deformed in a servotest machine [19] was in fact an effect of retarded water quenching after deformation [20]. This misinterpretation was associated to the exposure of the sample at high temperatures after deformation, as concluded for Mg-3Al-1Zn alloy [21].
The use of high energy x-ray diffraction (HEXRD) has become a valuable technique to track the microstructural evolution of crystalline materials exposed to mechanical and thermal loads to understand the governing physical phenomena [22]. The analysis of the Debye-Scherrer rings is a suitable tool to investigate the evolution of the microstructure during plastic deformation or thermal treatments of metals. Fast acquisition rates (<1 s) can be achieved with third generation of synchrotron radiation sources. HEXRD experiments are essentially used to follow and identify mechanisms of restoration (i.e., static/dynamic recovery and recrystallization), grain rotation and texture evolution. Liss et al. summarized some of the main representative results for different metallic materials during thermomechanical processing [23]. Some recent works in titanium alloys dealt with in situ thermo-mechanical deformation in the α + β field [24,25] and with phase transformation kinetics during heating in metastable titanium alloys [26,27] and Ti-6Al-4V [28].
This work aims to investigate the evolution of β grains in a Ti-6Al-4V alloy deformed in the single β phase field and to study the response of the microstructure to the isothermal heat treatment immediately after deformation. The in situ synchrotron experiments combined with previous work results were used to clarify the restoration phenomena of the β phase during the thermomechanical process.

2. Materials and Methods

The present work investigated the Ti-6Al-4V alloy with the following chemical composition in wt.%: 6.45Al, 4.33V, 0.18Fe, 0.18O, 0.006N, 0.03C, and balance Ti. This alloy has a β transus temperature (Tβ) of 1000 °C. The starting condition of the material was obtained after several forging steps (cogging) in the α + β field followed by an annealing heat treatment at 730 °C during 60 min and final air cooling, as reported in [29].
Cylindrical samples were machined to 10 mm length and 5 mm diameter with the load axis parallel to the cogging direction of the ingot. They were subjected to compression tests followed by an isothermal heat treatment. For that, a dilatometer (Bähr DIL 805 A/D, Bähr Thermoanalyse GmbH, Hüllhorst, Germany) with compression module and induction heating system was modified for HEXRD experiments, with two Kapton windows to allow the transmission of the incident and diffracted beams. The experiments were carried out at the beamline HARWI-II of the DORIS synchrotron source, at DESY (Deutsches Elektronen-Synchrotron, Hamburg, Germany) [30]. Samples were heated up to 1030 °C at 300 K·min−1 and then soaked during 10 min in an inert atmosphere of helium to obtain a homogeneous microstructure. The samples were compressed up to 0.6 of total true strain with strain rates 0.001, 0.1, 1, and 5 s−1, followed by a soaking step of ~11min at the same deformation temperature.
HEXRD measurements were performed in transmission mode with a monochromatic beam with energy E = 100 keV (λ = 0.124 Å) and slit dimensions of 1 × 1 mm2. The acquisition rate was set to 0.25 Hz and the diffraction images were collected in a 2D mar555 flat panel detector with an array of 2560 × 3072 pixels and pixel size of 139 × 139 μm2. The sample-detector distance was set to 1528 mm and the instrumental broadening was calibrated with a LaB6 capillary placed at the same distance. A type S thermocouple spot welded at the sample was used to measure and control the temperature. The incident beam reached the sample in a fixed position at 3.5 mm from one side of the sample. Since the sample is being compressed, there is a maximum change in the diffracted volume of about 28% at the end of the deformation. The setup sketch can be found elsewhere [24]. Figure 1 depicts half of the Debye-Scherrer rings, along with the identified crystallographic planes of α and β phases at room temperature (Figure 1a) and of the β phase at 1030 °C (Figure 1b).
The evolution of the recorded Debye-Scherrer rings during the thermomechanical treatments was analysed with the methodology detailed in [23]. The steps followed are described briefly:
(1)
2D diffraction images were stacked sequentially using the software ImageJ [31].
(2)
A polar transformation was applied to the stacked volume to originate a 3D volume with axis corresponding to the 2θ angle, the azimuthal angle ψ, and the strain ε (during deformation) or time t (during isothermal treatment).
(3)
One diffraction ring was selected and projected over the ψ-ε/t plane. The final representation corresponds to the evolution during deformation or heat treatment of coherent crystallographic domains (crystallite hereafter for simplicity) of β phase.
The evolution of the microstructure observed by HEXRD experiments was correlated with light optical microscopy (LOM) of cylindrical samples (16 mm length and 10 mm in diameter) deformed in a Gleeble® 1500 machine (Dynamic Systems Inc., Poestenkill, NY, USA) with the same parameters used during the in-situ synchrotron experiments and similar conditions as described in [20]. All the compressed specimens were water quenched immediately after the experiment to freeze the microstructure. The deformed specimens were cut parallel to the load axis and mechanically ground and polished up to 0.05 μm colloidal silica suspension. Subsequently they were etched with Kroll reagent (100 mL distilled water, 3 mL HF, and 6 mL HNO3) up to 50 s. LOM with polarized light was used to obtain a good contrast of the martensite arrangement related to the prior β grains.

3. Results

3.1. Hot Deformation

The sample heat treated at 1030 °C and soaked during 10 min showed a fully β microstructure with grains of around 400 µm diameter (Figure 2a). After deformation with the Gleeble® 1500 machine, the morphology of the β grains evidenced the effect of the strain rate. At a strain rate of 0.001 s−1, grains are slightly elongated and serrated (Figure 2b), while at 0.1 s−1 serrated grain boundaries can be easily observed and few isolated small equiaxed grains are distinguishable at the highly elongated grain boundaries (indicated with arrows in Figure 2c).
Figure 3 shows the steady state flow stress reached after strain hardening at very low strains for all the in situ HEXRD tested specimens at different strain rates.
The evolution of intensity of the reflections at the azimuthal angle with the strain (AS) at strain rate of 0.001 s−1 is presented in Figure 4 for the crystallographic planes β-110, β-200, and β-211. The x axis indicates the azimuthal angle ψ. The flow stress are plotted on the left of the figure to correlate changes in the microstructure and developed stresses with the true strain. At the top of the figures, load (LD) and radial (RD) directions are depicted. Some isolated diffraction spots can be distinguished along the ψ axis before deformation starts (true strain 0) for all the analyzed planes. This is due to the initially large β crystallite size within the gauge volume. The reflections of the β phase change as deformation proceeds, producing (1) some changes in the intensity, (2) broadening of the initial azimuthal angle covered by the initial spots, and (3) changes in the positions of ψ. The fixed beam position and the relative movement during compression induced some new grains to come into diffraction condition, while a smaller number were moving out of the Ewald’s sphere during the experiment [24]. Therefore, some new spots appear randomly with respect to ψ when increasing the strain for all planes due to a continuous increment of the diffracted volume. High intensity regions remain close to the axial and radial directions at the end of the compression for the β-200 plane (i.e., certain degree of texture was developed during deformation).
The AS-plots for higher strain rates could not be generated due to the low amount of 2D diffraction images acquired during short duration tests. Figure 5 shows only half of the Debye-Scherrer rings just before (left) and after (right) deformation. The initial microstructure consists of a limited number of β spots as well. After deformation some regions of high intensity can be distinguished at certain ψ positions (except for the 0.001 s−1 strain rate), indicating a texture development during the deformation. The β-110 plane exhibits high intensity zones placed mainly at 45° with respect to the load direction (horizontal) and at 90° or radial direction (indicated by blue arrows in Figure 5). The β-200 plane shows a certain preferred orientation parallel to the load direction and only orthogonally to the external load for the 0.1 and 1 s−1 conditions (red arrows in Figure 5). Moreover, the Debye-Scherrer rings became more continuous: The higher the strain rate, the more continuous the rings. This supports the dynamic recovery phenomenon: The higher the strain rate, the smaller the sub-grain size formed and the larger the crystallographic misorientation distribution within the grains.

3.2. Heat Treatment after Deformation

The results of the azimuthal angle–time (AT) plots during isothermal heat treatments carried out immediately after deformation are shown in Figure 6 for samples deformed at strain rates of 5, 1, 0.1, and 0.001 s−1. The β-200 crystallographic plane was selected to display the behavior of the microstructure. All the crystallographic planes showed similar evolution of the intensities with time. At the beginning of the heat treatments, the regions of highest intensity are mainly localized close to the load and radial directions. As the time proceeds the reflections band width (i.e., azimuthal angle range) is reduced. The larger the strain rate, the faster the width reduction. This reduction starts very late, after 500 s, for the sample deformed at 0.001 s−1. In addition, some reflections appear at new azimuthal angle positions.
Ex situ analysis of samples heat treated isothermally immediately after deformation were used to correlate the HEXRD observations described before. Figure 7 illustrates some representative examples for samples deformed at 0.001, 0.1, and 5 s−1 of strain rate after 30 to 600 s of holding time at the same temperature of deformation.
In general, elongated grains with serrated grain boundaries are characteristic of hot deformed grains, while static recrystallized grains are equiaxed with straight boundaries [5]. By increasing the strain rate and the time, the percentage of statically recrystallized grains increases. At lower strain rate (0.001 s−1), a few new grains are identified after 600 s (indicated with arrows in Figure 7). Samples treated after deformation at strain rates higher than 0.1 s−1 showed new grains formed in the first seconds, reaching around 50% recrystallized grains at 0.1 s−1 and a fully recrystallized grains at sample deformed at 5 s−1 after 120 s. The microstructure is fully recrystallized for specimens deformed at strain rates higher than 0.1 s−1 after 600 s.

4. Discussion

The mechanisms of restoration were identified and analyzed during and after the hot deformation (i.e., in the holding period). The information obtained by in-situ HEXRD tests for each crystallographic β plane helped to isolate special features of the microstructure and to get time information of the kinetics of the phenomena, both not possible to determine with standard microstructural characterization of post mortem samples. The low amount of grains diffracted during deformation cannot be considered for statistical analysis (e.g., quantification of microstructural features).

4.1. Hot Deformation

During the deformation in the β field, some representative microstructural features can be extracted from the AS-plots at 0.001 s−1 of strain rate, as summarized in Figure 8 for some β planes using magnified regions of Figure 4. Following similar analysis as carried out by Liss et al. [23], the microstructural features can be interpreted as follows:
(1)
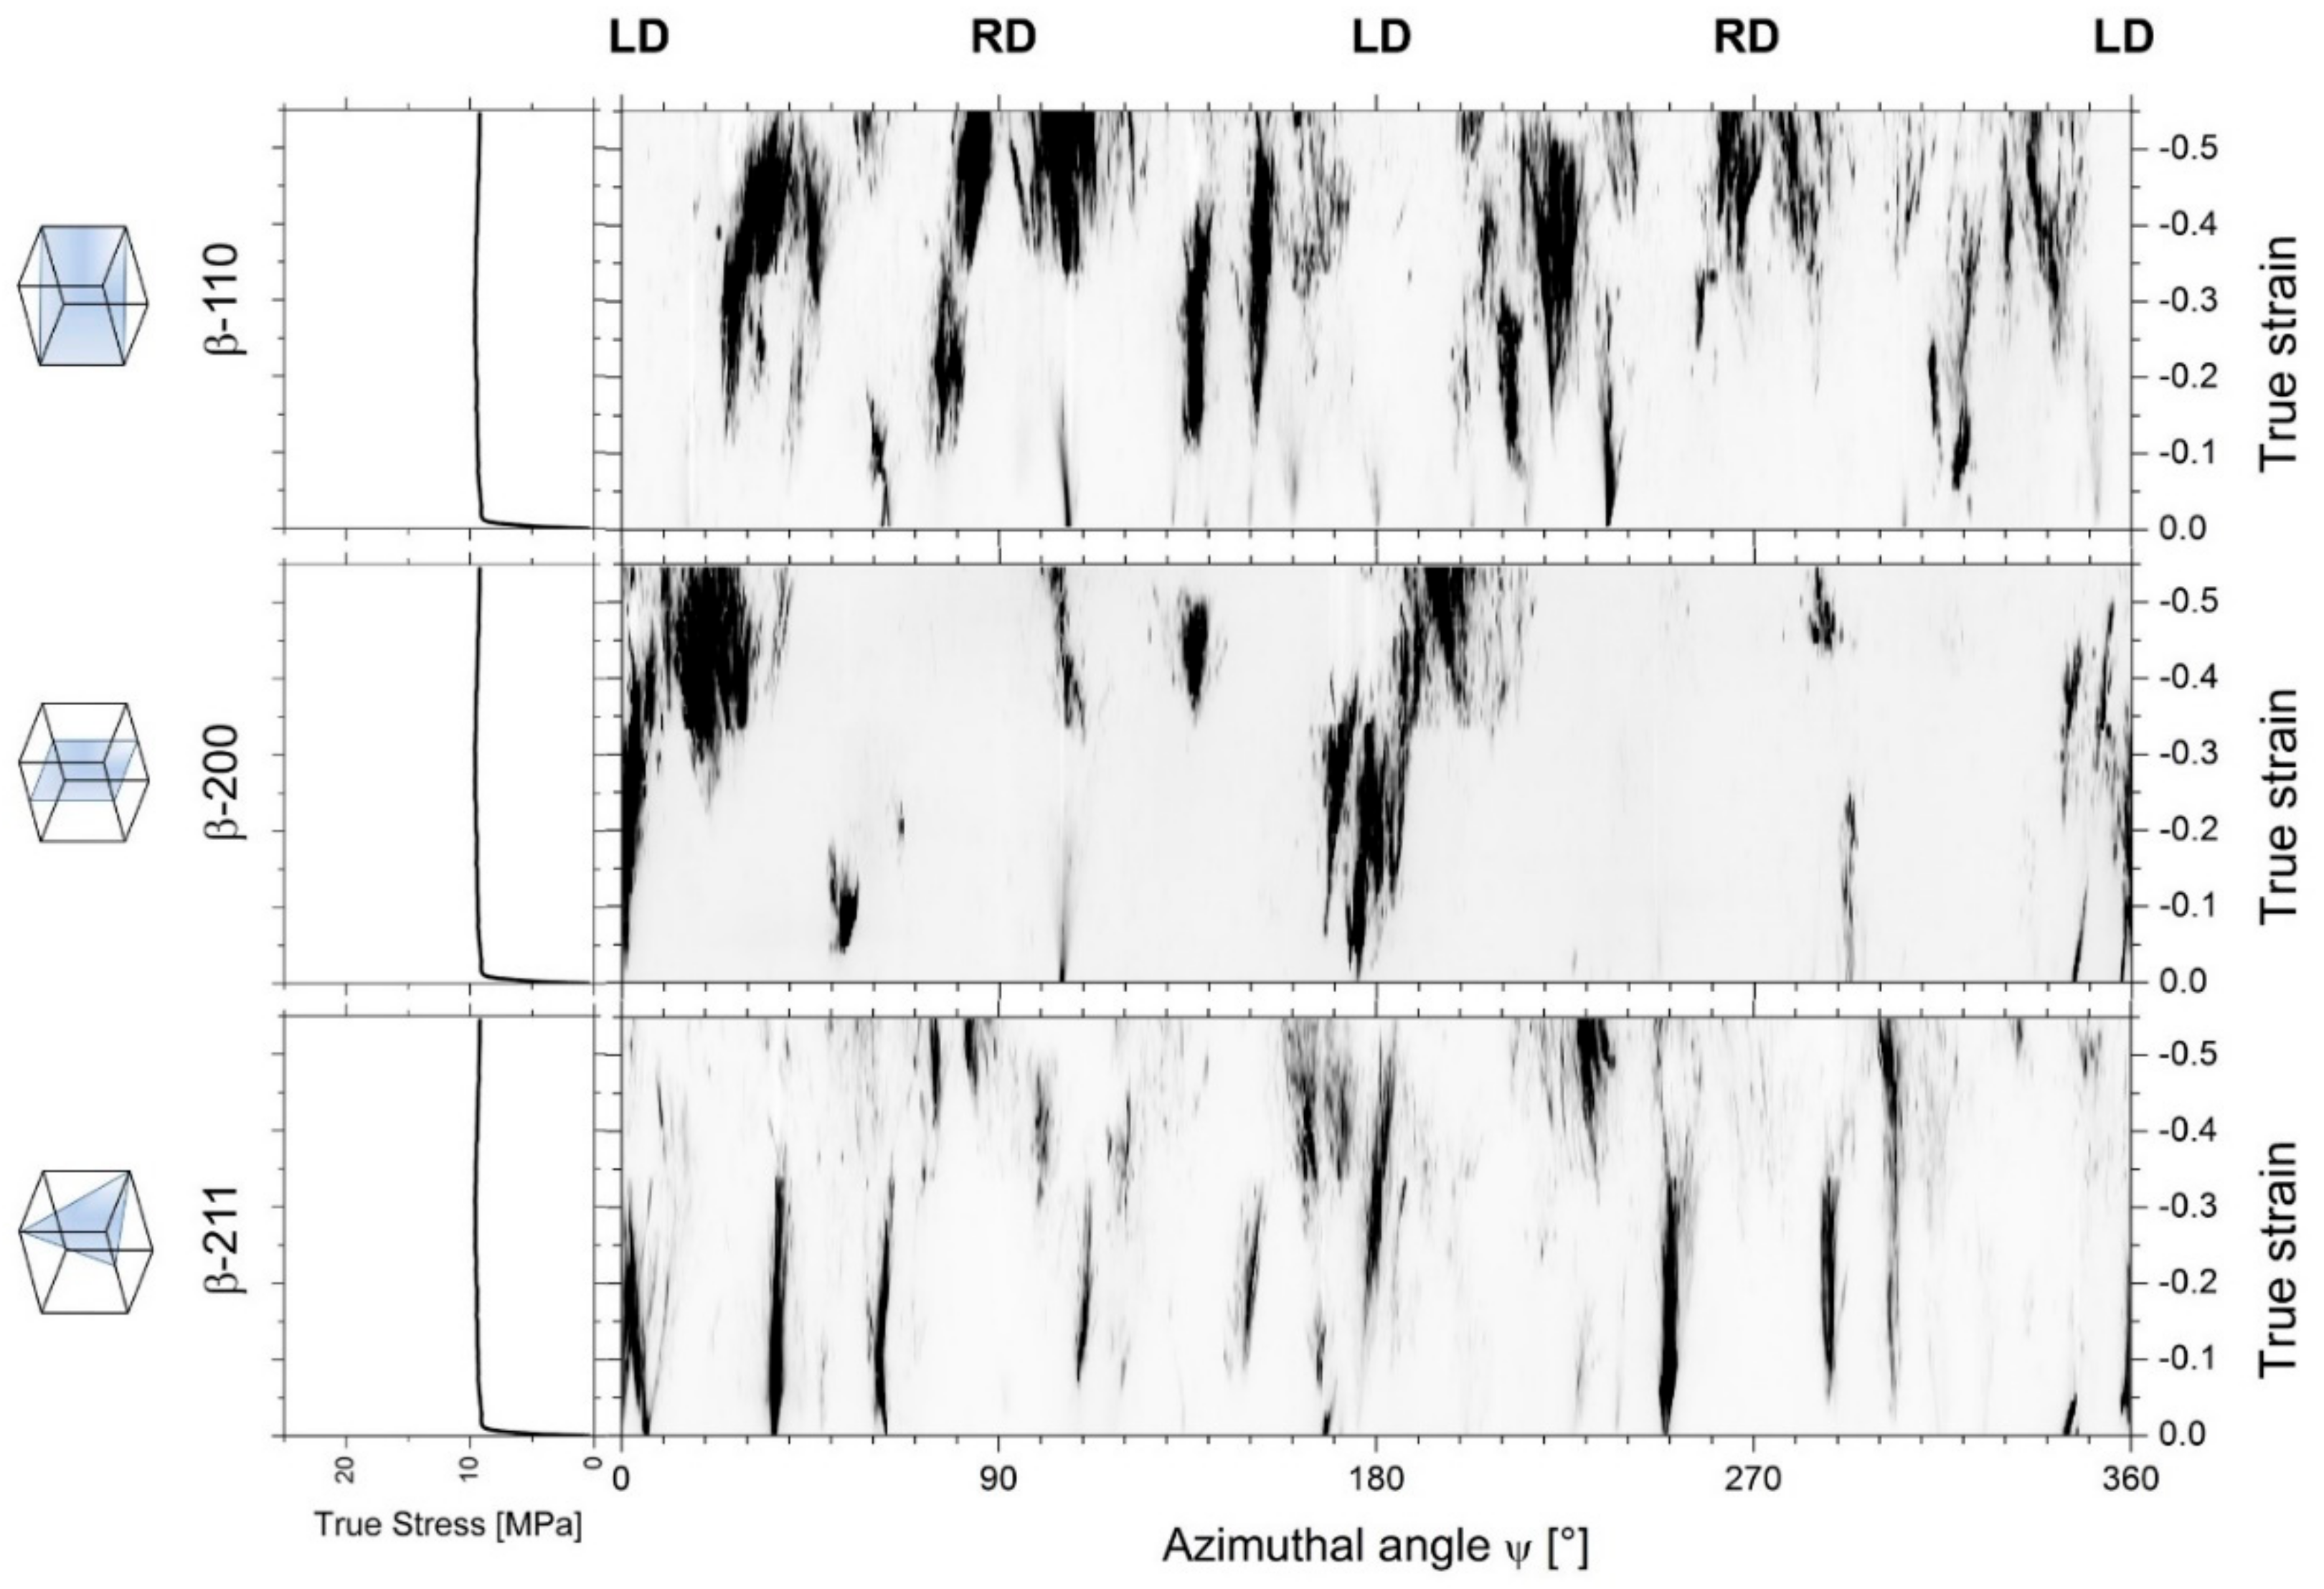
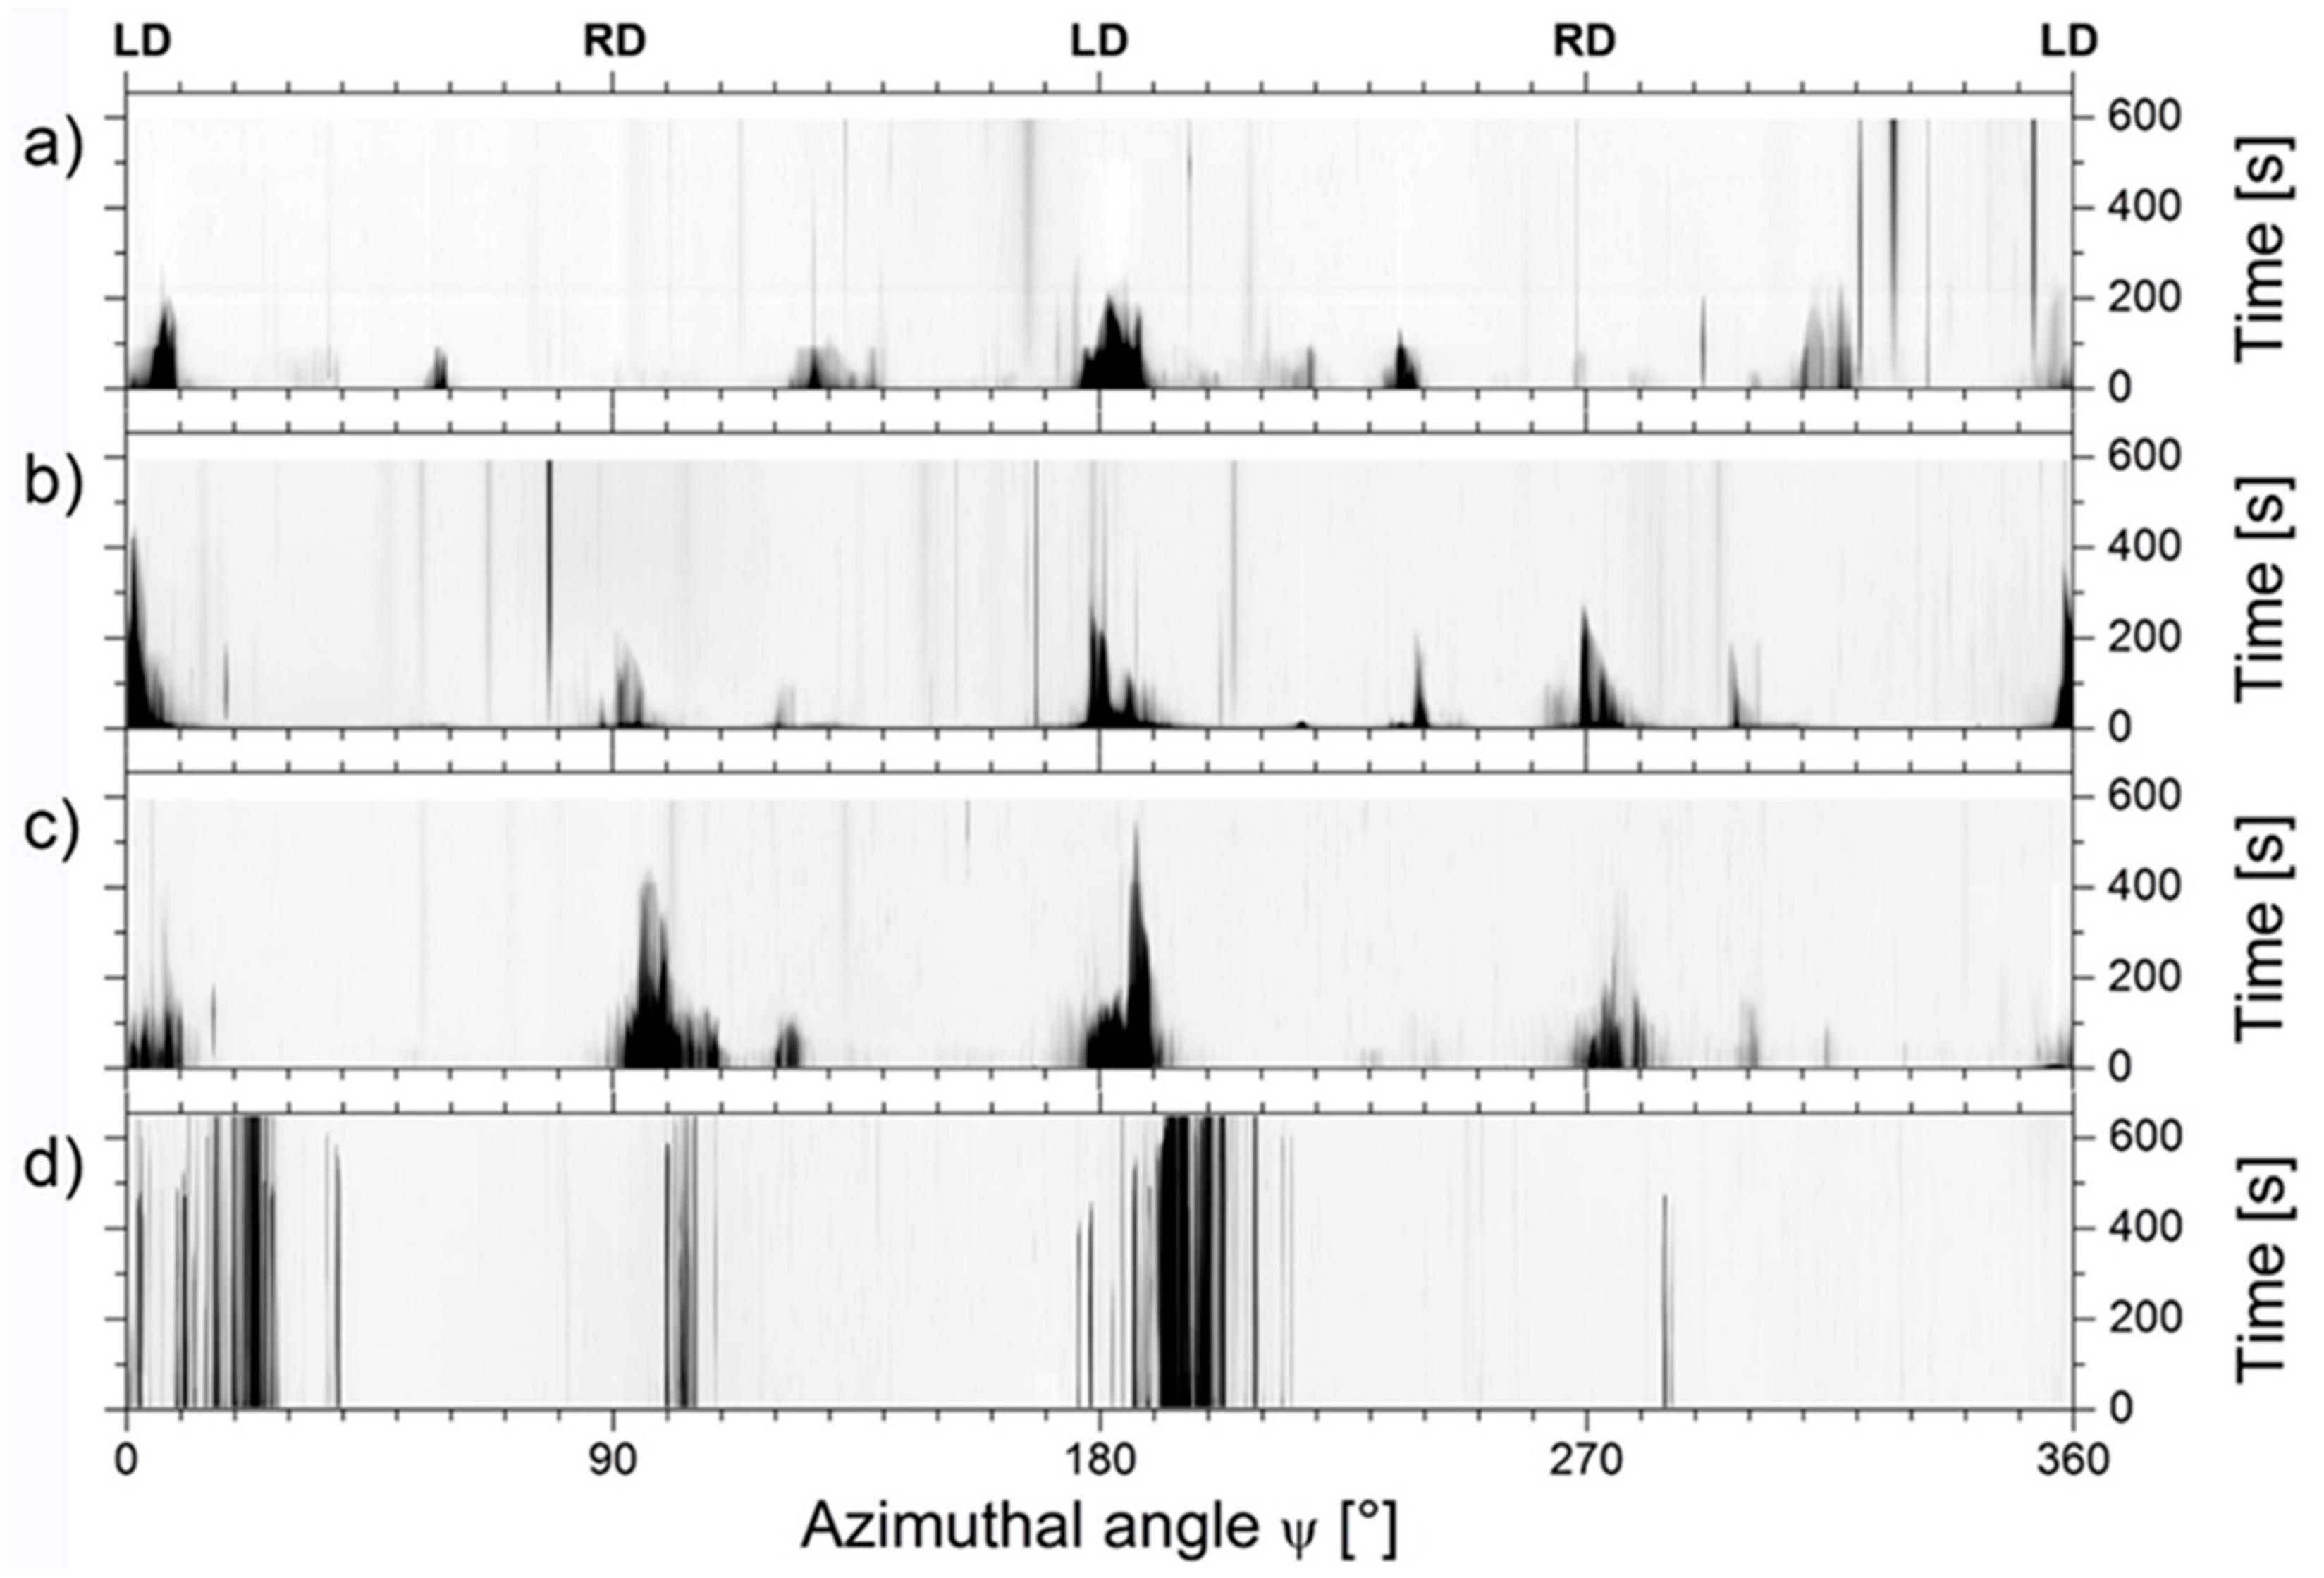
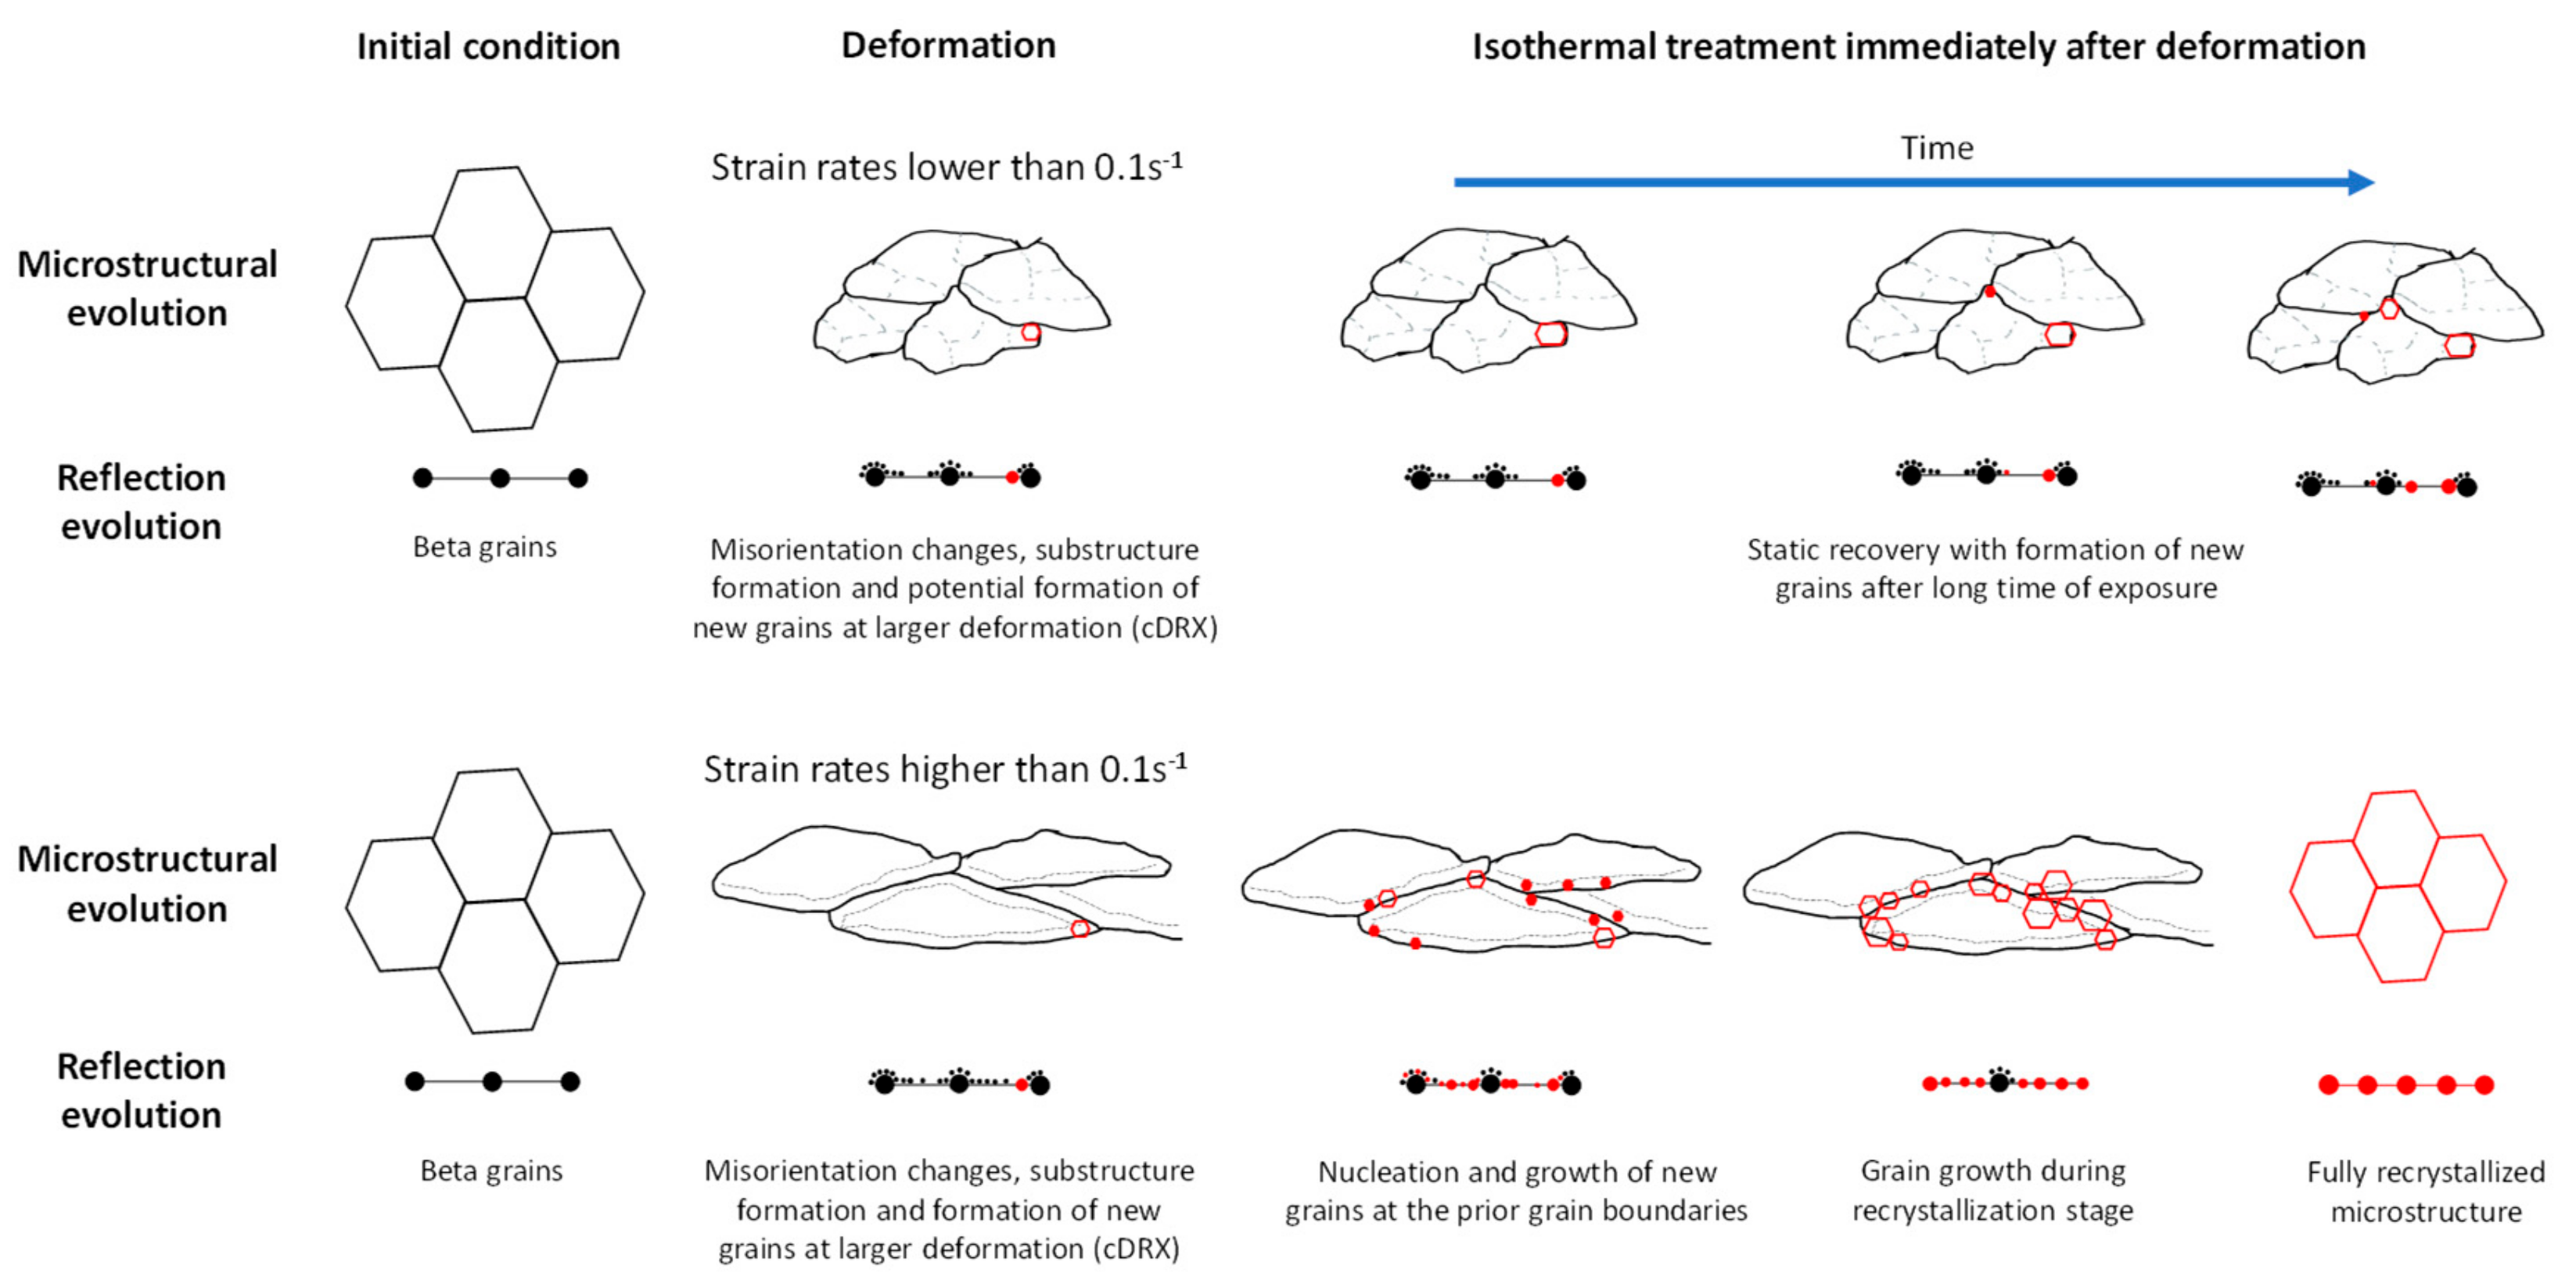
Crystallite rotation is revealed by a continuous change of the azimuthal angle of the reflections, as depicted in Figure 8a.
(2)
Increment of the misorientation within the grains, denoted by a cone shape (broadening) of reflections (Figure 8b). The broadening can reach up to 15–20° and this effect must be related to the formation of misorientations.
(3)
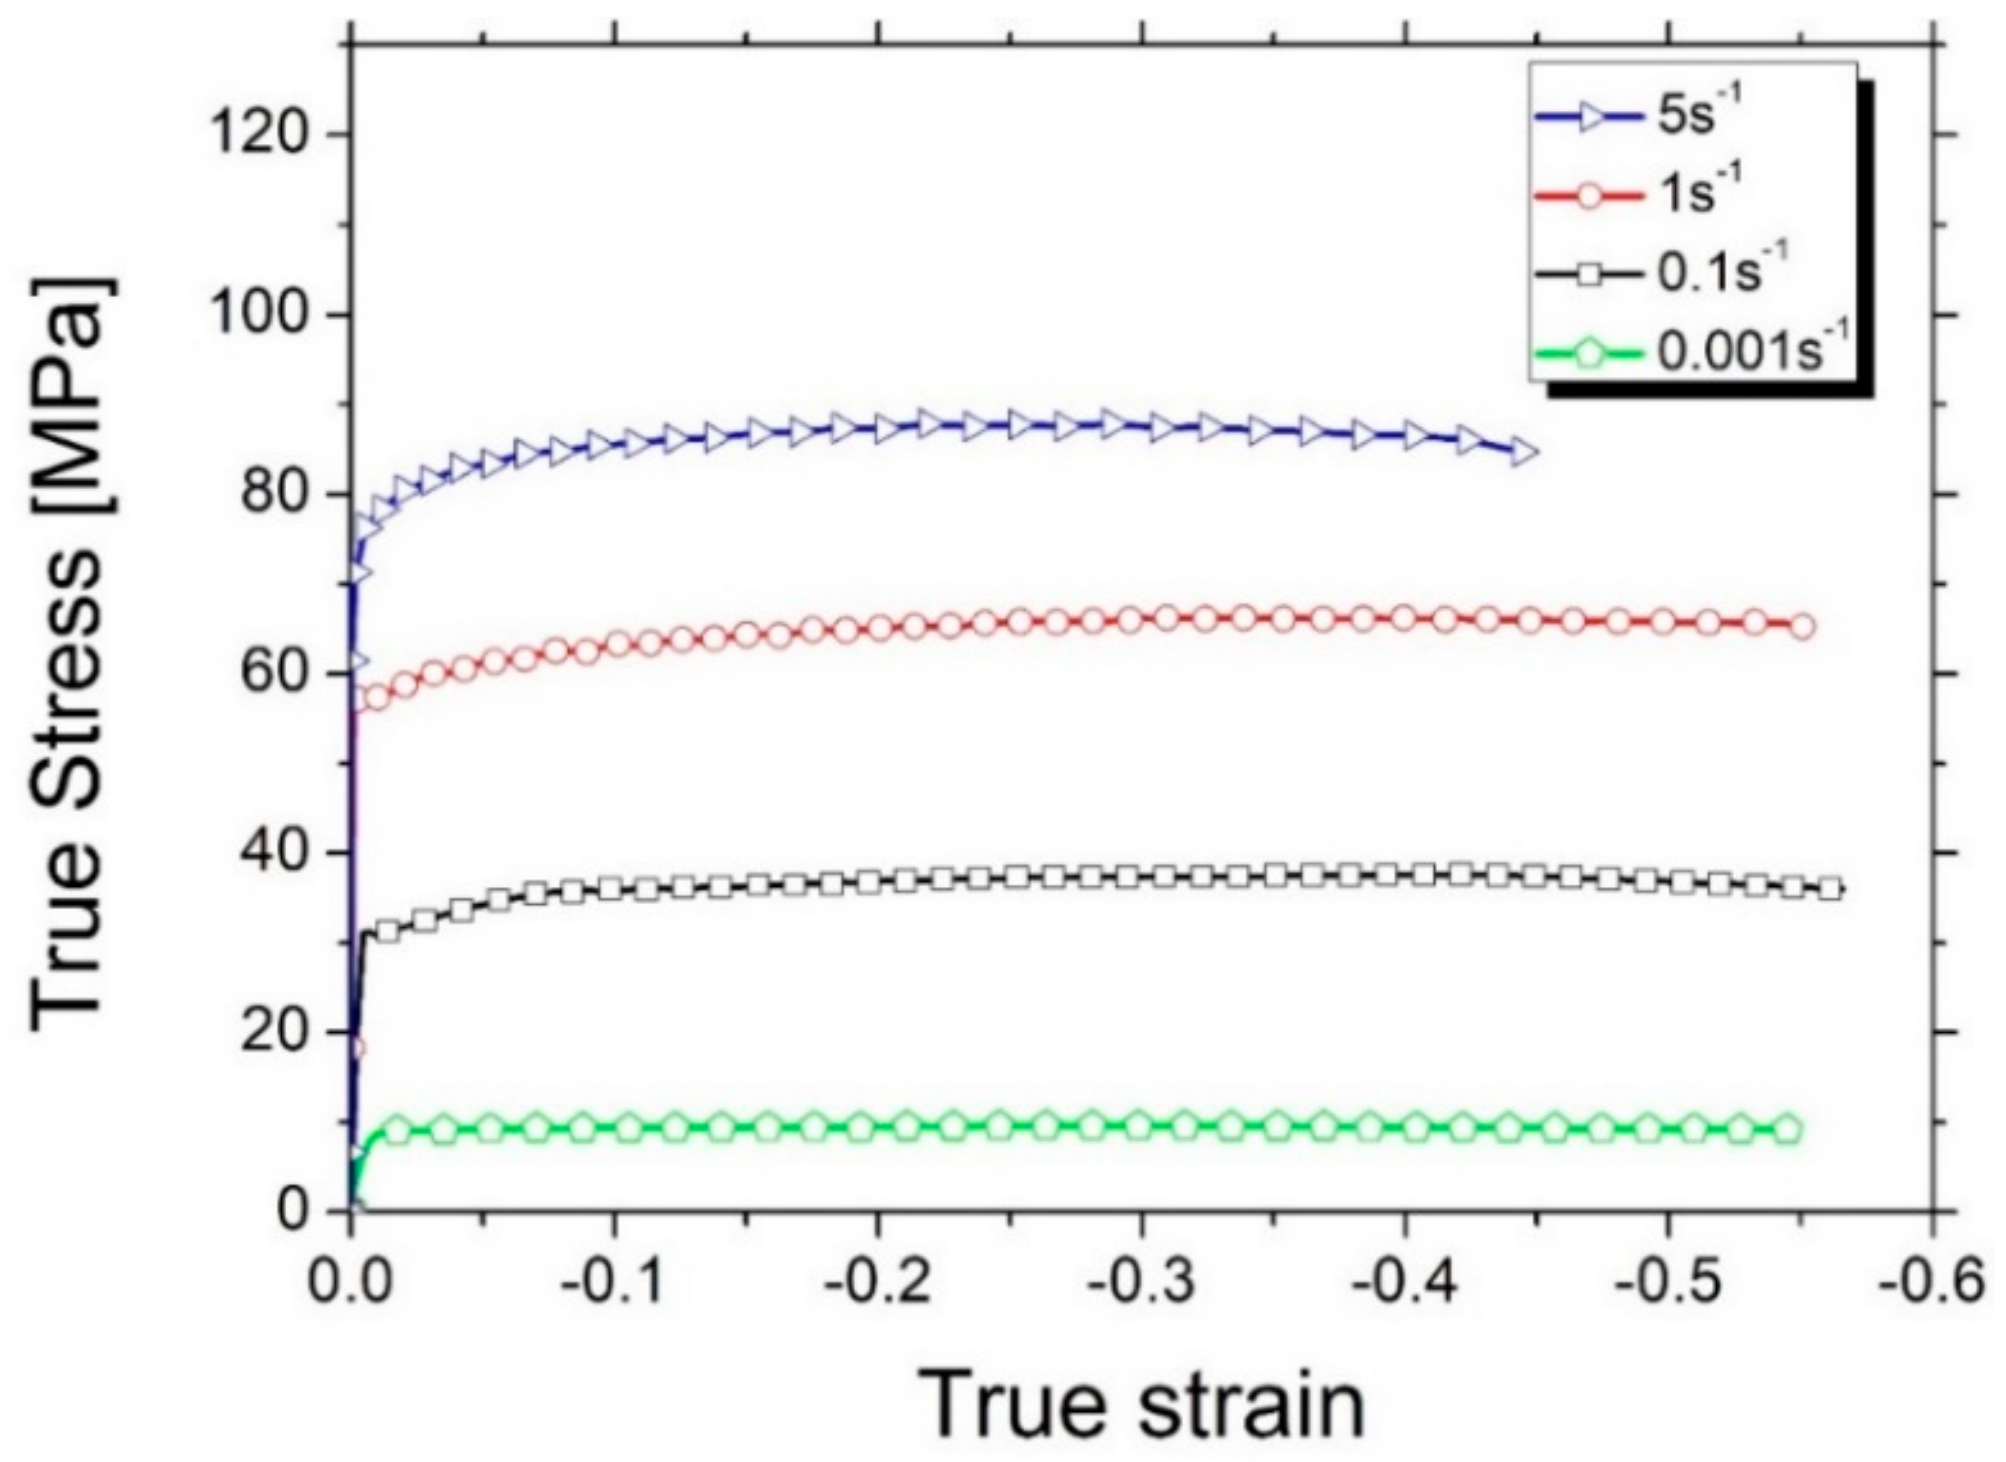
Dynamic recovery (DRV). The material undergoes dislocation annihilation and re-arrangement in sub-grain boundaries, producing a dotted (mosaic) cone in the plots. Crystallites evolve like strain-lines or eventually spots becoming narrower and differing in the azimuthal angle by ~1–2° from the parent grain. Some of these features are also present in Figure 8c. This observation agrees with the flow stress steady state observed for all the strain rates.
The evolution of the diffraction spots/strain-lines and the metallographic observations proved that there is no indication of discontinuous dynamic recrystallization (dDRX) since this phenomenon would produce strain-line islands in the AS-plots as a consequence of the formation of high-angle grain boundaries (HAGB). Likewise, as a consequence of the increase of misorientation within the grains, Debye-Scherrer rings become more homogeneous (Figure 5). The evolution of the microstructure due to dDRX must result in more inhomogeneous intensity distribution of the Debye-Scherrer rings that would be formed mainly by spots [22,32,33]. This characteristic was not observed in this work. All the observations showed to be in agreement with the expected DRV phenomena that has to take place during the hot deformation of high stacking fault energy materials, such as the β phase of Ti-6Al-4V [34].
Possible texture developed (Figure 5) during compression tests at high strain rates (from 0.1 to 5 s−1) also agrees with findings in thermomechanically-processed bcc metals where <100> is the typical deformation fiber texture [35,36,37].
Flow steady state observed in Figure 3 is mainly related to dynamic recovery as the main mechanism of restoration due to the high stacking fault energy of the β phase. The reflections evolution (Figure 4, Figure 5 and Figure 8) agrees with the reconstructed orientation maps of deformed β grains in [16], where misorientation within the grains with substructure formation were observed. A homogeneous substructure is developed at the low strain rate, while heterogeneous misorientation distribution mainly near the β grain boundaries is observed at the highest strain rate of deformation [16]. The serration of HAGB grains and the apparent grain boundary migration determine also that cDRX can proceed at larger strains [38].

4.2. Heat Treatment after Deformation

The diffraction spots from Figure 6 helped to identify and find the kinetics of the restoration mechanisms occurring during the isothermal treatments immediately after deformation. The large size of the crystallites during the heat treatments does not allow reliable Rietveld refinements. An alternative analysis was performed by re-processing the intensity of each crystallographic plane. The Debye-Scherrer ring corresponding to a specific crystallographic plane was selected and azimuthally integrated. Then, the calculated intensities were normalized by the values corresponding to the beginning of the isothermal treatment. The intensity evolution is shown in Figure 9a for the β-200 plane for all the studied conditions and in Appendix A for the rest of the analyzed planes (β-211 and β-110). For samples deformed at 0.1 s−1 or higher, all curves reduce their intensity significantly within the first 200 s until reaching a steady-state condition.
When the strain rate increases, the steady state is reached faster. In the case of the sample deformed at 0.001 s−1, the normalized intensity decreases continuously with negligible change in the microstructure (see Figure 6 and Figure 7). Its intensity reduction represents the reduction of lattice imperfections (e.g., dislocations) [39]. When only recovery takes place, dislocations anneal and, consequently, the mosaic cone reflections become narrower in Figure 6, affecting also the total observed intensity. The incubation time to nucleate new grains for 0.001 s−1 condition is reached at about 500 s. The finding is in agreement with the low recrystallization grade observed in the micrograph showed in Figure 7 after 600 s of isothermal treatment.
The energy stored during hot deformation affects the kinetics of recrystallization. With the exception of samples deformed at 0.001 s−1, the evolution of the intensity in Figure 9a follows a modified Johnson–Mehl–Avrami–Kolmogorov (JMAK) model [40,41] in the studied temperature and range of time, and it can be used to describe crystallite nucleation and growth [5,42]. Similar analysis was implemented to determine the phase transformation kinetics by resistivity measurements in titanium alloys [43] and by neutron diffraction in Zr based alloy [39]. In the case of neutron diffraction, this assumption was valid when the intensity of the spots is strictly related to microstructure features. From the JMAK equation, the fraction of recrystallized grains X is described as:
X = 1 − exp(−A·tn),
and the intensity variation, Y, related to X reads as:
Y = exp(−A·tn),
where A is a constant, t is time, and the exponent n contains information relative to the nucleation rate and growth. This value is associated to the type of nucleation and the three-dimensional growth of the crystallite. A maximum value of 4 can be reached if nucleation (n = 1) and unhindered crystallite growth (n = 3) are assumed constant during the recrystallization process without any type of restriction in the microstructure [5,42].
Equation (2) can be re-written as:
ln(−ln(Y)) = lnA + nln(t).
According to Equation (3), the expression is linear in a double logarithmic scale in ordinates and logarithmic in abscissas, which permit to determine the n-value. Figure 9b depicts the corresponding double logarithmic intensities for the different strain rates conditions, where the slope is the exponent n. It was found that the n exponent starts with values of 1 during the first 30 s for the 1 and 5 s−1 conditions. This finding is ascribed to a linear crystallite nucleation rate during the first stages of the thermal treatment. Up to 100 s after deformation at 5 s−1, n decreases to 0.5, while for the 1 s−1 condition, n decreases to 0.4 up to 200 s. The reduction of the n value indicates the end of nucleation and one-dimensional grain growth at the previous migrated grain boundaries [44] by diffusion-controlled growth.
The 0.1 s−1 condition shows a variation of the n value in three stages up to reach the steady state at 250 s. Static process begins with a n value of 1.5 for the first 50 s. The nucleation rate is slower, affected by the stored energy, the substructure formation during deformation and predominant grain growth of the new recrystallized grains. The n value decreases first to 1 up to ~90 s, remaining some grain nucleation in the material, and then to 0.35 up to 250 s, where diffusional growth governs the microstructure evolution.
The 5 s−1 condition ends this nucleation and grain growth process after 100 s, while experiments at 1 and 0.1 s−1 exhibit an end of the recrystallization by 200 and 250 s, respectively. The observed microstructures (Figure 7) agree with the JMAK graphs.
The planes β-211 and β-110 show similar behavior during the heat treatment, as illustrated in Figure A1b and Figure A2b.
Magnified regions of selected portions of the Debye-Scherrer rings (Figure 10) confirm that new nucleated crystallites (examples enclosed by circles) can be distinguished within the first 7 s (i.e., nucleation starts right after the deformation for the 0.1 and 5 s−1 strain rates). The identification of new grains formed immediately after deformation proves that static recrystallization is the mechanisms that takes place for restoration. The short incubation times may have led to the misinterpretation of the post-mortem microstructures analyzed in the literature. In this work, we proved that the observed recrystallized grains after cooling are formed statically, and not dynamically as reported, for example, in [8,12].
Figure 11 summarizes the evolution of the microstructure during deformation and isothermal heat treatment. Sub-grains are formed during hot deformation by dynamic recovery. Misorientation increases with increasing strain rate and thus smaller sub-grains can be formed due to less restoration time. The subsequent annealing at the same temperature promotes the formation of new grains due to the evolution of sub-grains that produce the bulge of high angle grain boundaries. Static recrystallization starts by strain-induced boundary migration [5]. The energy stored in the material is directly related to the strain rate during deformation. At the lowest strain rate, the stored energy was small due to intense dynamic recovery. Therefore, static recrystallization could start after more than 500 s.

5. Conclusions

The present investigation determined the evolution of the microstructure by in-situ synchrotron diffraction experiments during hot deformation and subsequent heat treatment in the β phase field in Ti-6Al-4V. The combination of the evolution of the reflections for each crystallographic plane and the metallography observations provide univocal information to identify the physical processes occurring during the deformation and heat treatment immediately after deformation.
(1)
Dynamic recovery is the main mechanism of restoration observed during deformation for all the strain rates. Larger crystallographic misorientations are developed within the grains with increasing strain rate, also related to smaller sub-grains due to less restoration.
(2)
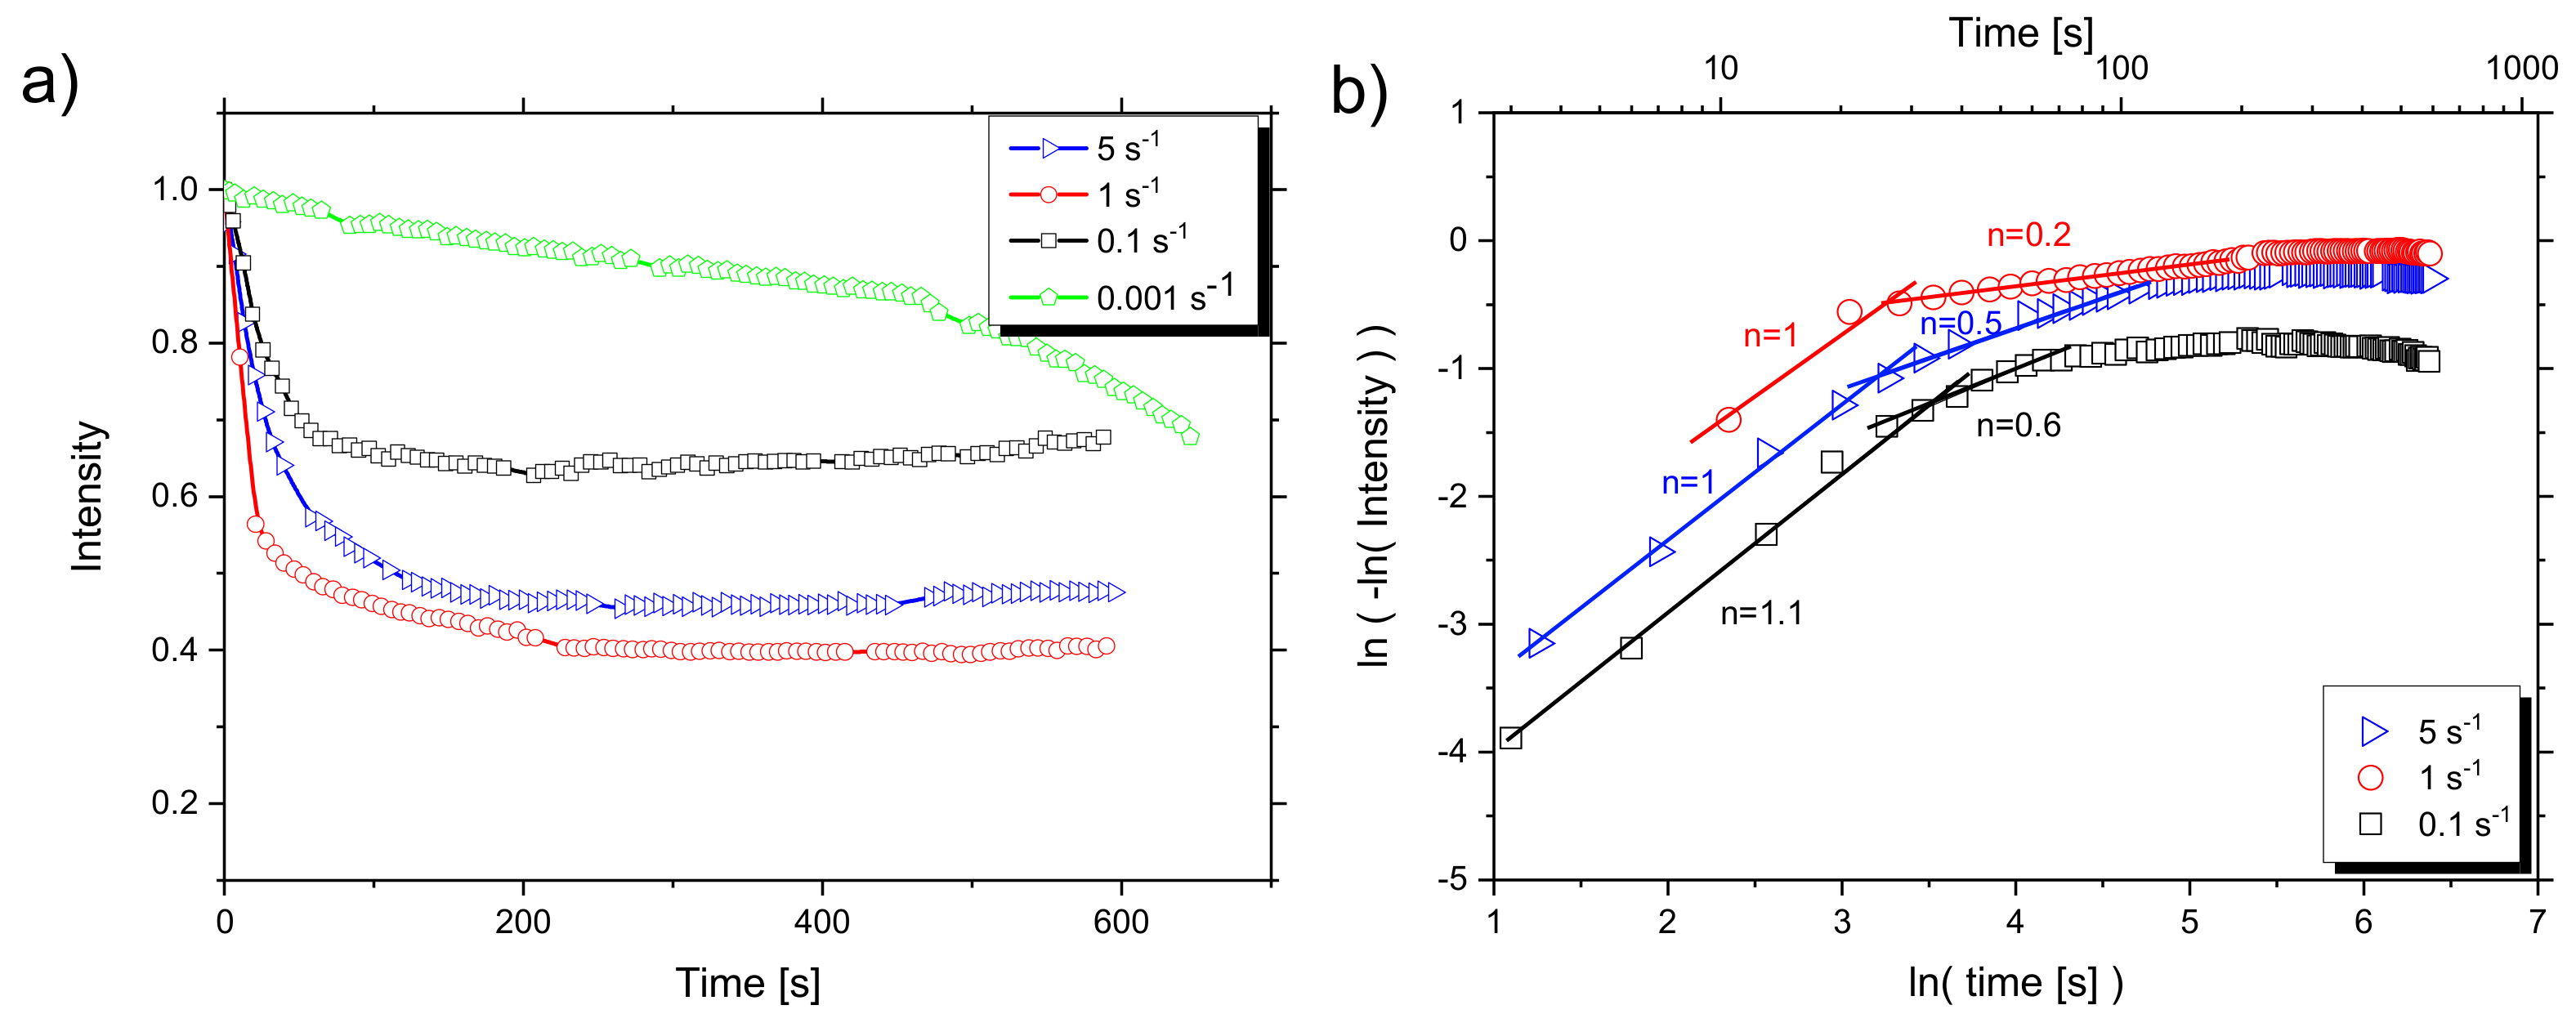
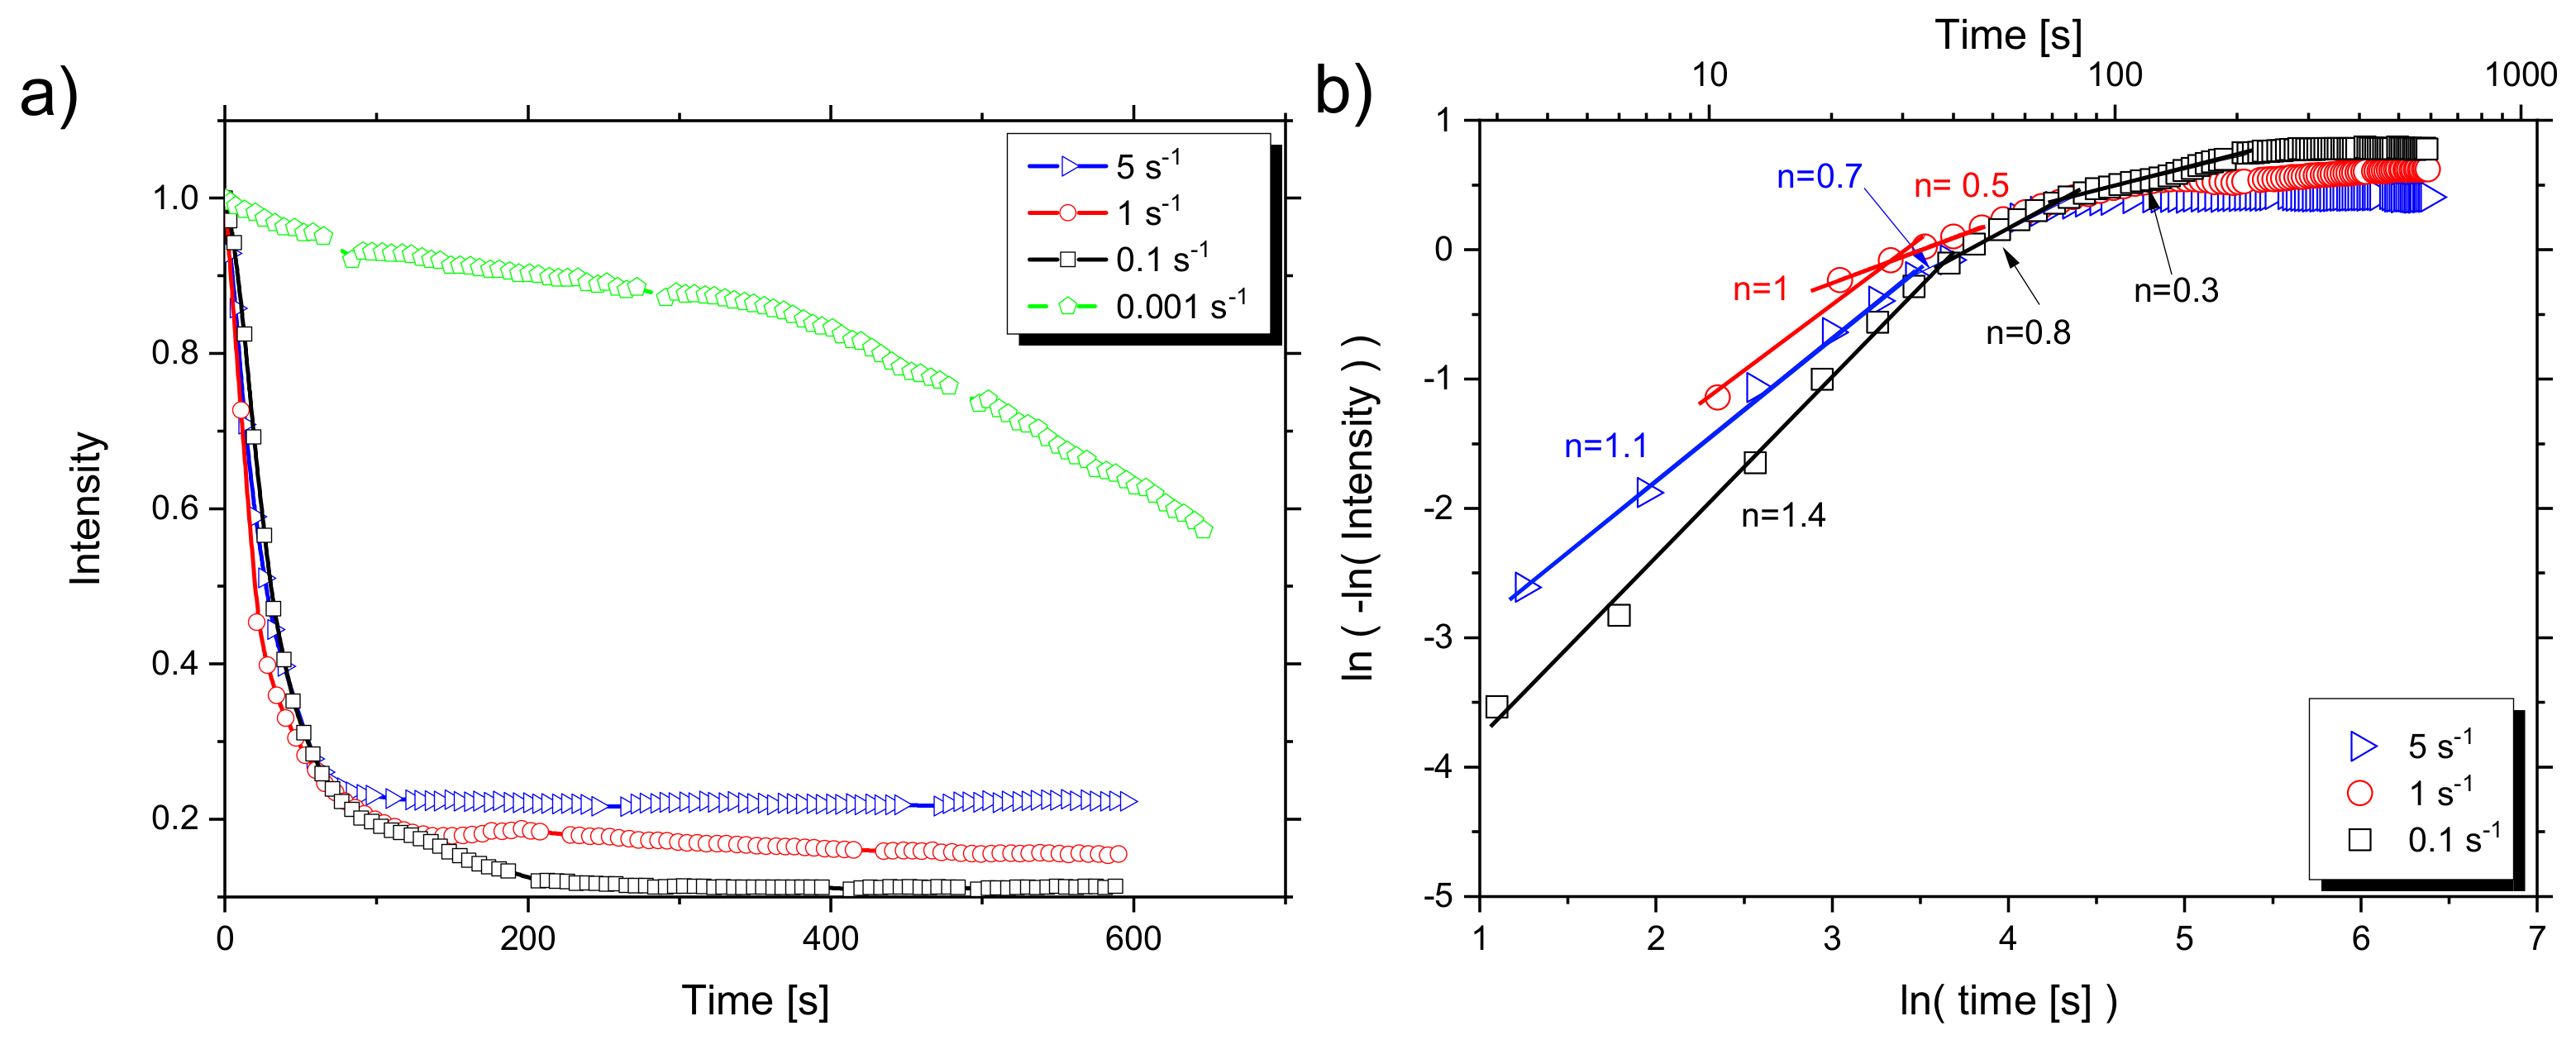
Static recrystallization of β grains can be described as nucleation within the first seconds after the deformation process. The nucleation is a function of the stored energy provided during the deformation (i.e., a function of the strain rate).
(3)
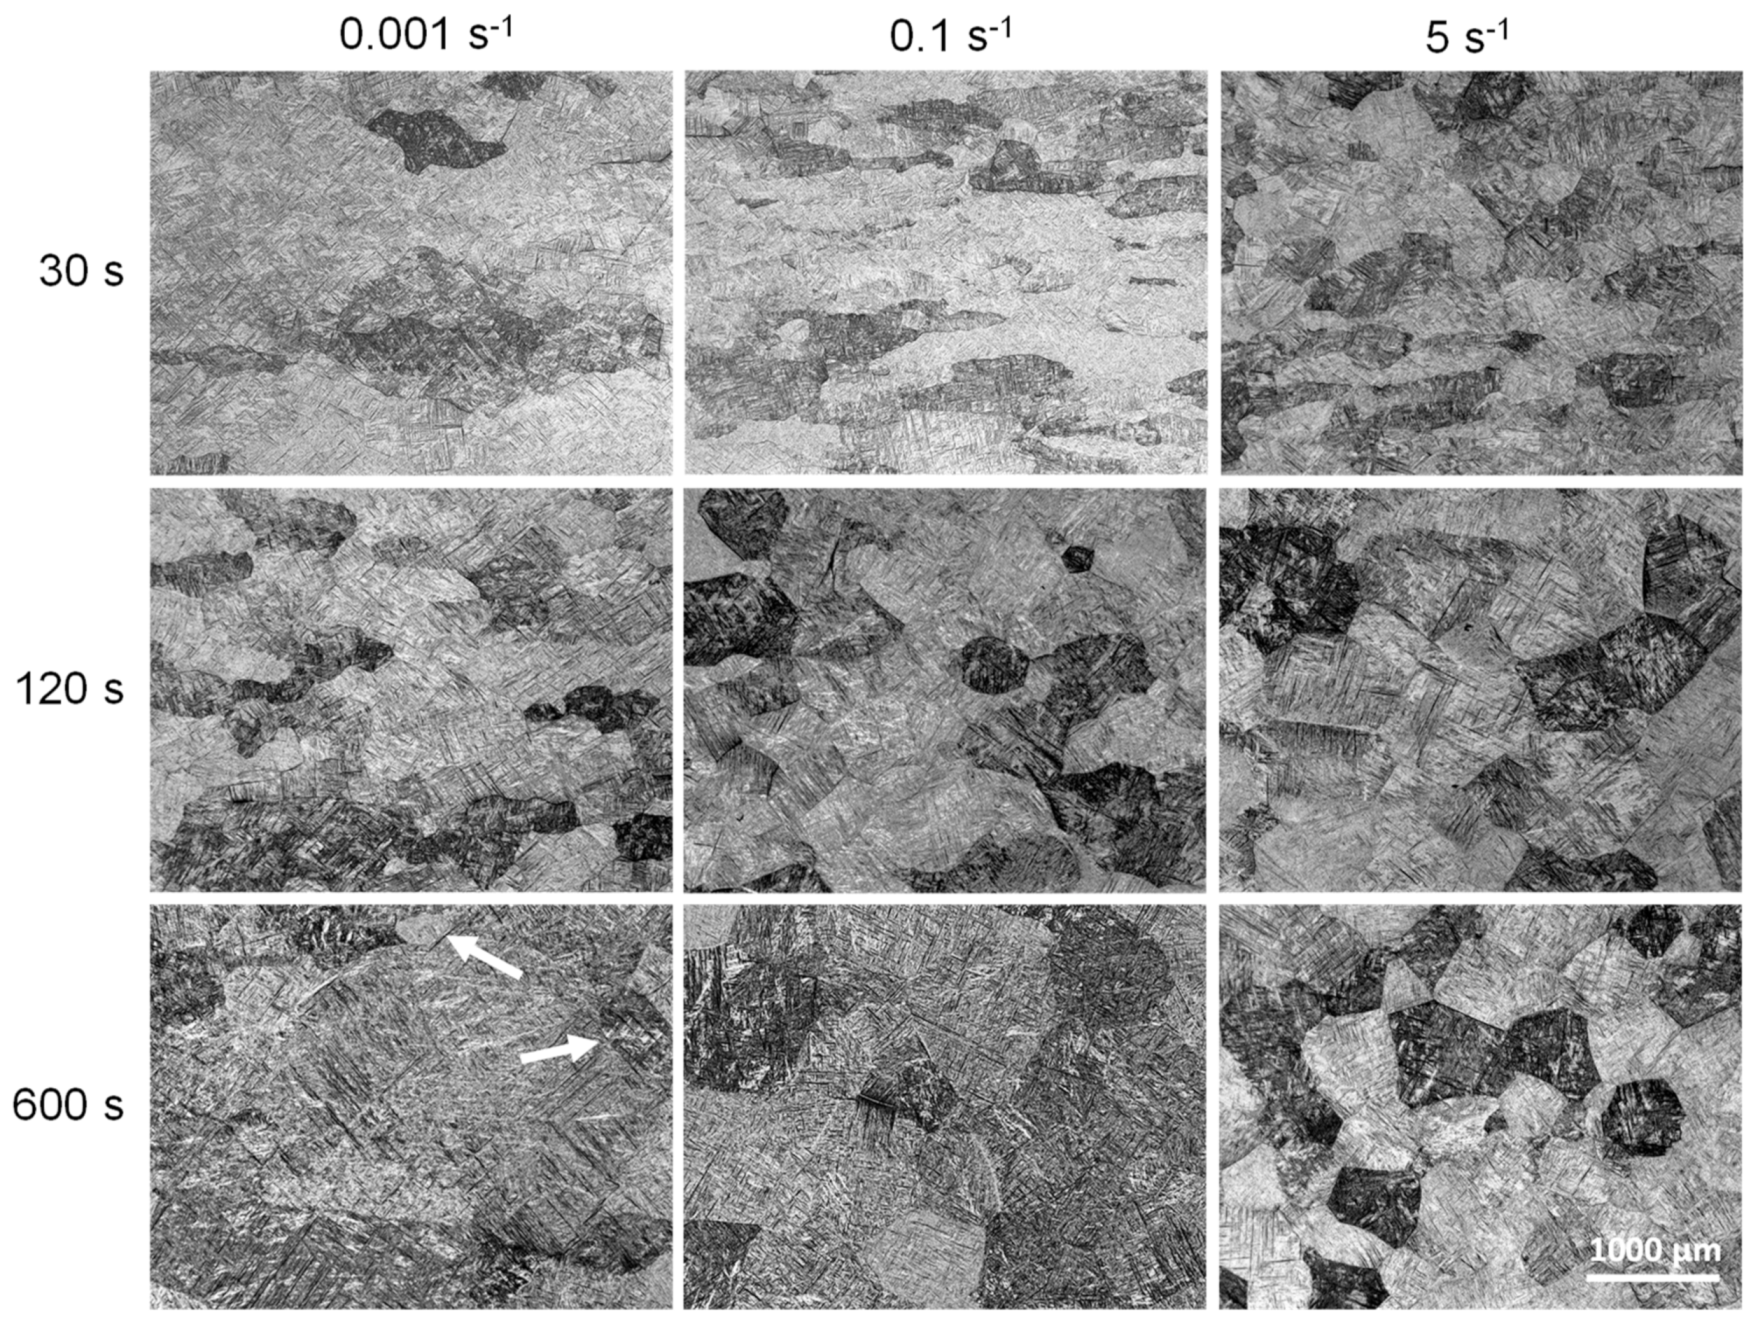
Grain growth occurs after nucleation and it ends after 100 s for the 5 s−1, 200 s for the 1 s−1, and 250 s after 0.1 s−1 strain rates.
(4)
The sample deformed with a strain rate of 0.001 s−1 shows no visible changes on the microstructure (by LOM or HEXRD) during the first 500 s. The decrement of the intensity must be related to a decrement in the dislocation density by static recovery. A few new grains are observed after 600 s of isothermal treatment.
The HEXRD measurements are useful to determine the active mechanisms during the deformation and heat treatment. The low amount of grains diffracted in this work is not enough for statistical considerations.
From the technological aspect, the tracking of the microstructure with similar process parameters is a powerful tool, especially for the monitoring of the β grain size during thermomechanical processes.

Author Contributions

Conceptualization, F.W., G.R and C.P.; methodology, F.W., E.Z., D.C.-Y, G.R. and A.S.; validation, F.W., E.Z., A.S. and D.C.-Y.; investigation, F.W., D.C.-Y., E.Z., G.R., A.S and C.P.; writing—original draft preparation, F.W., D.C.-Y. and C.P.; writing—review and editing, F.W., D.C.-Y., E.Z., G.R., A.S and C.P.; visualization, F.W., D.C.-Y., E.Z.; supervision, F.W. and C.P.

Funding

This research received no external funding.

Acknowledgments

The authors would like to thank the Deutsches Elektronen-Synchrotron (DESY) for the provision of synchrotron radiation facilities in the framework of the proposal I-20100329 EC. This work was sponsored by the Austrian Research Promotion Agency (FFG) in cooperation with Voestalpine Böhler Aerospace GmbH and Co KG and the K-Project Non-Destructive Testing and Tomography Plus funded by FFG, the Province of Upper Austria and the Province of Styria. C.P. and D.C.-Y. would like to thank the financial support from the Austrian Science Fund (FWF) projects P27471-N19 and P29727.

Conflicts of Interest

The authors declare no conflicts of interest.

Appendix A

Figure A1. Normalized intensity evolution as a function of time during heat treatment after compression for the β-211 plane. (b) A double logarithmic scale of (a) after Equation (3). Straight lines indicate the linear fit and besides corresponding slopes (n-exponent) are indicated.
Metals 09 00862 g0a1
Figure A2. Normalized intensity evolution as a function of time during heat treatment after compression for the β-110 plane. (b) A double logarithmic scale of (a) after Equation (3). Straight lines indicate the linear fit and besides corresponding slopes (n-exponent) are indicated.
Metals 09 00862 g0a2

References

  1. Banerjee, D.; Williams, J.C. Perspectives on Titanium Science and Technology. Acta Mater. 2013, 61, 844–879. [Google Scholar] [CrossRef]
  2. Ashby, M.; Shercliff, H.; Cebon, D. Materials: Engineering, Science, Processing and Design, 3rd ed.; Elsevier: Cambridge, UK, 2013. [Google Scholar]
  3. Lütjering, G.; Williams, J.C. Titanium, 2nd ed.; Springer: Berlin/Heidelberg, Germany, 2003. [Google Scholar]
  4. Semiatin, S.L.; Pilchak, A.L. Advances in the Development of Processing-Microstructure Relations for Titanium Alloys. In Proceedings of the 13th World Conference on Titanium; Venkatesh, V., Pilchak, A.L., Allison, J.E., Ankem, S., Boyer, R., Christodoulou, J., Fraser, H.L., Imam, M.A., Kosaka, Y., Rack, H.J., Eds.; John Wiley & Sons: Hoboken, NJ, USA, 2016; pp. 187–202. [Google Scholar] [CrossRef]
  5. Humphreys, F.J.; Hatherly, M. Recrystallization and Related Annealing Phenomena, 2nd ed.; Elsevier: Oxford, UK, 2004. [Google Scholar]
  6. Gourdet, S.; Montheillet, F. An experimental study of the recrystallization mechanism during hot deformation of aluminium. Mater. Sci. Eng. A 2000, 283, 274–288. [Google Scholar] [CrossRef]
  7. Huang, J.; Xing, H.; Sun, J. Structural stability and generalized stacking fault energies in β Ti–Nb alloys: Relation to dislocation properties. Scr. Mater. 2012, 66, 682–685. [Google Scholar] [CrossRef]
  8. Seshacharyulu, T.; Medeiros, S.C.; Morgan, J.T.; Malas, J.C.; Frazier, W.G.; Prasad, Y.V.R.K. Hot deformation mechanisms in ELI grade Ti-6A1-4V. Scr. Mater. 1999, 41, 283–288. [Google Scholar] [CrossRef]
  9. Fan, J.K.; Kou, H.C.; Lai, M.J.; Tang, B.; Chang, H.; Li, J.S. Characterization of hot deformation behavior of a new near beta titanium alloy: Ti-7333. Mater. Des. 2013, 49, 945–952. [Google Scholar] [CrossRef]
  10. Momeni, A.; Abbasi, S.M. Effect of hot working on flow behavior of Ti–6Al–4V alloy in single phase and two phase regions. Mater. Des. 2010, 31, 3599–3604. [Google Scholar] [CrossRef]
  11. Prasad, Y.V.R.K.; Seshacharyulu, T.T.; Medeiros, S.C.; Frazier, W.G. A study of beta processing of Ti-6Al-4V: Is it trivial? ASME J. Eng. Mater. Technol. 2001, 123, 355–360. [Google Scholar] [CrossRef]
  12. Ding, R.; Guo, Z.X. Microstructural evolution of a Ti–6Al–4V alloy during β-phase processing: Experimental and simulative investigations. Mater. Sci. Eng. A 2004, 365, 172–179. [Google Scholar] [CrossRef]
  13. Honarmandi, P.; Aghaie-Khafri, M. Hot Deformation Behavior of Ti–6Al–4V Alloy in β Phase Field and Low Strain Rate. Met. Microstruct. Anal. 2013, 2, 13–20. [Google Scholar] [CrossRef]
  14. Dikovits, M.; Poletti, C.; Warchomicka, F. Deformation Mechanisms in the Near-β Titanium Alloy Ti-55531. Met. Mater. Trans. A 2014, 45, 1586–1596. [Google Scholar] [CrossRef]
  15. Germain, L.; Gey, N.; Humbert, M. Reliability of reconstructed β-orientation maps in titanium alloys. Ultramicroscopy 2007, 107–112, 1129–1135. [Google Scholar] [CrossRef] [PubMed]
  16. Poletti, C.; Germain, L.; Warchomicka, F.; Dikovits, M.; Mitsche, S. Unified description of the softening behavior of beta-metastable and alpha + beta titanium alloys during hot deformation. Mater. Sci. Eng. A 2016, 651, 280–290. [Google Scholar] [CrossRef]
  17. Germain, L.; Gey, N.; Humbert, M. Reconstruction of deformed parent grains from microstructure inherited by phase transformations. Scr. Mater. 2019, 158, 91–94. [Google Scholar] [CrossRef]
  18. Donoghue, J.; Antonysamy, A.A.; Martina, F.; Colegrove, P.A.; Williams, S.W.; Prangnell, P.B. The effectiveness of combining rolling deformation with Wire–Arc Additive Manufacture on β-grain refinement and texture modification in Ti–6Al–4V. Mater. Charact. 2016, 114, 103–114. [Google Scholar] [CrossRef]
  19. Warchomicka, F.; Poletti, C.; Stockinger, M.; Henke, T. Microstructure evolution during hot deformation of Ti-6Al-4V double cone specimens. Int. J. Mater. Form. 2010, 3, 215–218. [Google Scholar] [CrossRef]
  20. Warchomicka, F.; Poletti, C.; Stockinger, M. Microstructural characterization of hot deformed Ti-6Al-4V. In Proceedings of the 12th World Conference on Titanium; Zhou, L., Chang, H., Lu, Y., Xu, D., Eds.; Science Press: Beijing, China, 2012; Volume 1, pp. 729–732. [Google Scholar]
  21. Beer, A.G.; Barnett, M.R. The post-deformation recrystallization behaviour of magnesium alloy Mg–3Al–1Zn. Scr. Mater. 2009, 61, 1097–1100. [Google Scholar] [CrossRef]
  22. Liss, K.-D. Metals Challenged by Neutron and Synchrotron Radiation. Metals 2017, 7, 266. [Google Scholar] [CrossRef]
  23. Liss, K.-D.; Yan, K. Thermo-mechanical processing in a synchrotron beam. Mater. Sci. Eng. A 2010, 528, 11–27. [Google Scholar] [CrossRef]
  24. Canelo-Yubero, D.; Requena, G.; Sket, F.; Poletti, C.; Warchomicka, F.; Daniels, J.; Schell, N.; Stark, A. Load partition and microstructural evolution during in situ hot deformation of Ti-6Al-2Sn alloys. Mater. Sci. Eng. A 2016, 657, 244–258. [Google Scholar] [CrossRef]
  25. Warwick, J.L.W.; Jones, N.G.; Bantounas, I.; Preuss, M.; Dye, D. In situ observation of texture and microstructure evolution during rolling and globularization of Ti-6Al-4V. Acta Mater. 2013, 61, 1603–1615. [Google Scholar] [CrossRef]
  26. Aeby-Gautier, E.; Settefrati, A.; Bruneseaux, F.; Appolaire, B.; Denand, B.; Dehmas, M.; Geandier, G.; Boulet, P. Isothermal α″ formation in β metastable titanium alloys. J. Alloy. Compd. 2013, 577, 439–443. [Google Scholar] [CrossRef]
  27. Barriobero-Vila, P.; Requena, G.; Warchomicka, F.; Stark, A.; Schell, N.; Buslaps, T. Phase transformation kinetics during continuous heating of a β-quenched Ti–10V–2Fe–3Al alloy. J. Mater. Sci. 2015, 50, 1412–1426. [Google Scholar] [CrossRef]
  28. Semiatin, S.L.; Obstalecki, M.; Payton, E.J.; Pilchak, A.L.; Shade, P.A.; Levkulich, N.C.; Shank, J.M.; Pagan, D.C.; Zhang, F.; Tiley, J.S. Dissolution of the alpha phase in Ti-6Al-4V during isothermal and continuous heat treatment. Meta. Mater. Trans. A 2019, 50, 2356–2370. [Google Scholar] [CrossRef]
  29. VSMOP-AVISMA Corporation. Heat Number: 8-33-5303, Certificate Report; Voestalpine Böhler Aerospace GmbH Co & KG: Kapfenberg, Austria, 2008. [Google Scholar]
  30. Beckmann, F.; Dose, T.; Lippmann, T.; Lottermoser, L.; Martins, R.V.; Schreyer, A. The new materials science beamline HARWI-II at DESY. AIP Conf. Proc. 2007, 879, 746–749. [Google Scholar]
  31. ImageJ. Available online: http://rsbweb.nih.gov/ij/ (accessed on 20 June 2019).
  32. Liss, K.-D.; Schmoelzer, T.; Yan, K.; Reid, M.; Peel, M.; Dippenaar, R.; Clemens, H. In situ study of dynamic recrystallization and hot deformation behavior of a multiphase titanium aluminide alloy. J. Appl. Phys. 2009, 106, 113526. [Google Scholar] [CrossRef]
  33. Liss, K.-D.; Garbe, U.; Li, H.; Schambron, T.; Almer, J.D.; Yan, K. In situ observation of dynamic recrystallization in the bulk of zirconium alloy. Adv. Eng. Mater. 2009, 11, 637–640. [Google Scholar] [CrossRef]
  34. Weiss, I.; Semiatin, S.L. Thermomechanical processing of beta titanium alloys—An overview. Mater. Sci. Eng. A 1998, 243, 46–65. [Google Scholar] [CrossRef]
  35. Hu, H. Texture of metals. Texture 1974, 1, 233–258. [Google Scholar] [CrossRef]
  36. Kad, B.K.; Schoenfeld, S.E.; Asaro, R.J.; Mckamey, C.G.; Sikka, V.K. Deformation textures in Fe3Al alloys: An assessment of dominat slip system activity in the 900-1325 K temperature range of hot working. Acta Met. 1997, 45, 1333–1350. [Google Scholar] [CrossRef]
  37. Roy, S.; Suwas, S.; Tamirisakandala, S.; Srinivisan, R.; Miracle, D.B. Microstructure and texture evolution during β extrusion of boron modified Ti-6Al-4V alloy. Mater. Sci. Eng. A 2012, 540, 152–163. [Google Scholar] [CrossRef]
  38. Huang, K.; Logé, R.E. A review of dynamic recrystallization phenomena in metallic materials. Mater. Des. 2016, 111, 548–574. [Google Scholar] [CrossRef]
  39. Kabra, S.; Yan, K.; Carr, D.G.; Harrison, R.P.; Dippenaar, R.J.; Reid, M.; Liss, K.-D. Defect dynamics in polycrystalline zirconium alloy probed in situ by primary extinction of neutron diffraction. J. Appl. Phys. 2013, 113, 063513. [Google Scholar] [CrossRef] [Green Version]
  40. Avrami, M. Kinetics of Phase Change. I General Theory. J. Chem. Phys. 1939, 7, 1103–1112. [Google Scholar] [CrossRef]
  41. Johnson, W.A.; Mehl, R.F. Reaction Kinetics in Processes of Nucleation and Growth. Trans. Metall. Soc. AIME. 1939, 135, 416–442. [Google Scholar]
  42. Christian, J.W. The Theory of Transformations in Metals and Alloys; Pergamon: Oxford, UK, 2002. [Google Scholar]
  43. Malinov, S.; Sha, W.; Markovsky, P. Experimental study and computer modelling of the β⇒α + β phase transformation in β21s alloy at isothermal conditions. J. Alloy. Compd. 2003, 348, 110–118. [Google Scholar] [CrossRef]
  44. Paggi, A.; Angella, G.; Donnini, R. Strain induced grain boundary migration effects on grain growth of an austenitic stainless steel during static and metadynamic recrystallization. Mater. Charact. 2015, 107, 174–181. [Google Scholar] [CrossRef]
Figure 1. Half of the Debye-Scherrer rings showing some identified crystallographic planes of α and β phases (a) at room temperature and (b) at 1030 °C.
Metals 09 00862 g001
Figure 2. LOM images of samples heat treated at 1030 °C with the Gleeble® 1500 machine and (a) soaked during 10 min, and (b,c) deformed at a strain rate of 0.001 and 0.1 s−1, respectively. Serrated grain boundaries are observed in both cases. Load axis is vertical.
Metals 09 00862 g002
Figure 3. Flow curves for the Ti-6Al-4V alloy obtained under compression at different strain rates at 1030 °C during the in-situ HEXRD radiation.
Metals 09 00862 g003
Figure 4. AS-plots under compression at 0.001 s−1 at 1030 °C for the (a) β-110, (b) β-200, and (c) β-211 crystallographic planes. The flow curves are plotted on the left, while at the bottom ψ is indicated. LD and RD correspond to the load and radial directions, respectively.
Metals 09 00862 g004
Figure 5. Half Debye-Scherrer rings before (left) and after (right) deformation at 0.001, 0.1, 1, and 5 s−1. Arrows indicate the high intensity spots for β-110 (blue) and β-200 (red) planes after deformation. Load direction is horizontal and radial direction is vertical.
Metals 09 00862 g005
Figure 6. AT-plots for the β-200 crystallographic plane during isothermal heat treatment after deformation at strain rates of (a) 5 s−1, (b) 1 s−1, (c) 0.1 s−1, and (d) 0.001 s−1. Isothermal treatment time is indicated on the right. LD and RD correspond to the load and radial directions, respectively.
Metals 09 00862 g006
Figure 7. LOM images of samples deformed at 1030 °C and 0.001, 0.1, and 5s−1, and isothermally heat treated for 30, 120, and 600 s. The load axis is vertical.
Metals 09 00862 g007
Figure 8. Magnified regions of Figure 4 showing details of (a) crystallite rotation, (b) misorientation formation, and (c) sub-grain formation.
Metals 09 00862 g008
Figure 9. Normalized intensity evolution as a function of time during heat treatment after compression for the β-200 plane. (b) A double logarithmic scale of (a) after Equation (3). Straight lines indicate the linear fit and besides corresponding slopes (n-exponent) are indicated.
Metals 09 00862 g009
Figure 10. Selected magnified regions of the Debye-Scherrer rings during the first 20 s of isothermal treatment for different conditions of deformation. The new observed spots (examples enclosed by circles) are indicative of new recrystallized crystallites.
Metals 09 00862 g010
Figure 11. Summary of the microstructural evolution during the studied thermomechanical process and its correlation with the reflections obtained from the β phase.
Metals 09 00862 g011

