
Dilation Characteristics of 3D PBF-LB/M AlSi10Mg Alloy

1
Department of Technical Studies, College of Polytechnics Jihlava, 586 01 Jihlava, Czech Republic
2
Institute of Theoretical and Applied Mechanics of the Czech Academy of Sciences, 190 00 Praha, Czech Republic
*
Author to whom correspondence should be addressed.
Metals 2023, 13(12), 1961; https://doi.org/10.3390/met13121961
Submission received: 2 November 2023
/
Revised: 26 November 2023
/
Accepted: 29 November 2023
/
Published: 30 November 2023
Abstract
:Application deployment of 3D-printed products represents a progressive area of industrial use of specific metal alloys. In parallel with starting points based on mechanical characteristics in the static and cyclic areas, dilation behavior is an important parameter. A typical application is, for example, components in the aerospace sector, where the components are exposed for a short period to a significant temperature difference in both positive and negative values. Current industrial trends lead to the deployment of additive technologies for producing aircraft system components and instrument parts. Testing of AlSi10Mg alloy samples prepared by direct metal laser sintering, in the past DMLS, now according to the standard laser powder bed fusion (PBF-LB/M) method, is carried out by measuring dilation during a controlled temperature course. The AlSi10Mg alloy is used for mechanically less stressed components, from which a high accuracy of functional dimensions is usually required, which can be affected by dilation characteristics in a wide temperature range. Additively produced components have different dilation characteristics within an identical alloy, often dependent on the production method and orientation during 3D printing. The article presents the testing results and subsequent application characteristics of an additively produced aluminum alloy, considering dilation characteristics.
1. Introduction
Additive technologies represent a significant technological trend in current industrial practice [1,2,3,4,5,6]. They represent a broad portfolio of methods for producing components of various categories of materials and shaping the final shape of the component [5,7,8]. The advantage of additive technologies is the rapid preparation of production and the subsequent relatively fast production of the component [9], usually with a minimal need for subsequent post-processing to achieve the required accuracy of functional dimensions [10,11,12,13,14]. The original meaning of rapid prototyping through additive manufacturing, usually to verify partial assembly characteristics, is extended to various series production levels [15,16,17]. The initial criteria for the application deployment of additively manufactured components are based on the mechanical characteristics of the primary material without significant consideration of the processing method [18,19]. Attributes of additively manufactured components show different mechanical characteristics in static [20,21] and cyclic [22,23] areas [24,25]. Differences in the mechanical characteristics field are necessary for advanced phases of application deployment [26,27], where the goal is to verify selected functional characteristics in the relevant spectrum of mechanical stress [3,28]. The use of additively manufactured components in the serial production of functional assemblies requires a complex specification of mechanical characteristics in the static and cyclic areas of mechanical stress in a temperature-variable environment [29,30,31,32,33]. The mentioned environment is characteristic, especially in the field of aircraft technology, where a temperature change from +60 °C to −60 °C can be expected within a relatively short period within the function of the components. The stated temperature range corresponds to the limit temperatures from the troposphere layers on the earth’s surface to the upper troposphere layers and the lower stratosphere layers with a constant temperature of −55 °C. In the indicated temperature range, the declared characteristics of the components must be guaranteed [2]. The text presents the research results on the dilation characteristics of test samples made of AlSi10Mg material, additively produced by the laser sintering method, direct metal laser sintering (PBF-LB/M) [23,34,35,36,37].
The conducted research with published results aims to determine and assess the influence of the orientation of 3D printing structures on the thermal expansion of the material and the related issue of deformations of components produced by the declared method in a broad temperature spectrum to which these components may be exposed to the environment. A typical example is aviation or aerospace components, but they can also be, for example, gauges, supporting and setting elements of measuring devices, or parts of devices. Some effect on deformation characteristics is expected. The difference is assessed for three different printing topologies and the starting material conventionally prepared by casting. The PBF-LB/M 3D printing method is based on the sintering of metal powders with initial characteristics that create differences from conventionally prepared material. The influencing factor is a nanostructure with defined characteristics, similar to, e.g., [38]. A similar context for other alloys prepared by conventional and non-conventional technologies where similar behavior can be expected is given, e.g., in [39]. Adding specific chemical elements with declared characteristics can also have an expected effect on the microstructure [40]. With the PBF-LB/M 3D printing method, the metal powder is transformed, and the influence of the microstructure on the macrostructure in the form of layers can be expected, thereby influencing the mechanical and thermomechanical characteristics. Comparison with the starting material, prepared by casting and subsequent machining of test samples from a cast alloy of the same composition, represents a reference for the subsequent modification of the design procedures and technical preparation for producing additively manufactured components. We can also expect the influence of similar aspects when there is a thermal transformation of the material and subsequent changes in mechanical and thermomechanical characteristics [41]. The initial assumption is that the topology of the layered structure has an influence on the deformation characteristics, just as the influence on the mechanical characteristics, especially the fatigue ones, has been proven. The results of measuring the coefficient of thermal expansion for topologies and concerning the conventional material are significant for the construction and technical preparation of the components planned to be produced by the PBF-LB/M 3D printing method.
The composition of the samples was characterized using X-ray diffraction (XRD), the microstructure of individual samples was evaluated using digital optical microscopy after chemical etching to highlight the structure, and the surface mechanical properties were verified using a nanoindentor.
2. Materials and Methods
The dilation characteristics are measured on the test samples produced by the additive PBF-LB/M method from the AlSi10Mg alloy in the appropriate printing topology (Figure 1).
Determining dilatation characteristics is carried out by a series of experimental measurements on rolled products of the structural, shape, and dimensional characteristics defined below using the declared equipment within the specified method. The initial design of the samples takes into account the usual shape for experimental measurement of mechanical characteristics with a modification to reduce measurement uncertainties by the methods used in a wide temperature range, where the following was taken into account:
- -
- The changing characteristic of the attachment of the electromechanical strain gauge, especially at low temperatures, will increase the diameter of the cylinder of the measured part.
- -
- The changing visibility of the marks measured by the video strain gauge is due to a change in the environment, especially at low temperatures.
- -
- The mentioned modification of the dimensions is not excluded even for accredited mechanical tests; however, it must be stated that the bodies are not proportional, which is particularly important for the tensile test, which was not a relevant subject of implementation within the given experiment at the declared temperature range.
- -
- The stages of the implementation of the experiment are the specified steps of the given plan:
- -
- -
- Printing from the specified material by the declared method was discussed with the manufacturer.
- -
- Samples are generally cleaned after delivery, so no printing media traces remain on the surface. At the same time, significant burrs are checked and possibly removed.
- -
- Determination of experimental measuring infrastructures.
- -
- Planning the logistics of material and coolant (N) in the context of the measurement process and the characteristics of the equipment used.
- -
- Defining the measurement method. The measurement is controlled by a temperature profile and the recording of deformation characteristics by electromechanical and optical methods.
- -
- For each sample variant, including the conventional material, 10 pieces are produced, on which the measurement is performed.
- -
- The same measurement is performed 10 times on one identical piece for each variant to verify the constant characteristics of the material in the given temperature range.
- -
- Measured values are automatically captured through the Instron Console and BlueHill universal control measurement and communication software Instron Console ver. 10.1.
- -
- Evaluation of results from captured primary data, exported to csv format.
- -
- Implementation of results in CAE simulation examples.
The 3D printing topology is shown in the detail of the drawing in Figure 1. The orientation of the printing layers is determined by the coordinate system used for all samples and corresponds to the coordinate system of the used 3D printing device. Manufacturing Coordinate System (MCS), usually used also for 3D CNC technologies, and especially the orientation is according to ISO/ASTM 52900 [42].
The starting point is proportional test rods of precisely defined dimensions used for tensile testing. The parameters of the bodies are shown in the production drawing of the component in Figure 2. The initial, manufacturer-declared characteristics of the tested material are shown in Table 1. Samples were produced by the 3D printer Renishaw AM400 (Renishaw, UK), made in Renishaw, Miskin, Wales. Test samples are produced and prepared following ASTM F3318-18 [43]. The production of comparative samples from cast material is according to EN AC-43000 [44].
Declared technological production characteristics for PBF-LB/M print using Renishaw AM400 equipment are shown in Table 2.
The technological characteristics of the production of test samples are shown in Table 3. Technological characteristics are important references for production data. They represent the usual available production equipment parameters using the PBF-LB/M method.
The mentioned samples allow reliable definition of the measured length, clamping in the testing device’s jaws, and sensors’ connections for measuring deformation. The sample shown in Figure 2, printed by the PBF-LB/M method, is not further modified by any post-processing method. The goal is to determine the primary dilation characteristics. The samples were labeled as XY, where X is T (as topology) and Y is print orientation.
Measurement of expansion characteristics is carried out on a combined testing device, Electropuls E 10000 (Instron, Norwood, MA, USA), made in Norwood, US. using a Eurotherm temperature chamber. Low temperatures are achieved through liquid nitrogen. Exact dilation values are measured using an Instron electromechanical extensometer. Control of the temperature course is realized by a test profile defined through the control and evaluation software Bluehill Universal (Bluehill Universal ver. 3, Instron, Norwood, MA, USA). The temperature course takes place with a two-way gradient of max. 5 °C/min. When heating the sample in the temperature chamber environment, it is necessary to consider the heating of the entire system and, with it, the hypothetical possibility of a measurement error. The effect of heating the entire system is compensated by using the rod shape reinforced at the attachment point and placing the strain gauge on the part of the measured length. The mechanical part is symmetrical, fixing the sample and generating a low reference bias. As a control measurement, a non-contact deformation measurement with a video strain gauge is performed, where the measured points correspond to the attachment of the electromechanical strain gauge. The mentioned mechanical system compensates for the effect of system heating and reduces measurement uncertainty. Determining the accuracy and uncertainty of the measurement is carried out through the results of the device calibration. The usual statistical methods and metrological procedures determine uncertainties. Type A uncertainty is determined by the statistical evaluation of the realized measurements for each method separately. The standard uncertainty of type B is determined from the calibration sheets of the equipment used to make the measurements. In the case of dilation measurement, an axial load cell is used to control and ensure load conditions. An electromechanical and optical strain gauge is used to determine the deformation conditions.
The main measured parameter is the change in deformation when the temperature changes. In order to accurately detect the deformation and avoid the error of the measured value due to clearances, a slight preload of 1 kPa is generated on the sample. It guarantees constant conditions for body load compensation. An example of a measurement system is shown in Figure 3.
A test is performed on 10 different samples for each printing topology and then repeated 10 times on the same sample to test deformations during temperature changes.
The mentioned characteristics are unchanged for all tested samples. These are products made using the usual technology. For possible industrial use, products with the given technology will be produced with similar characteristics and according to a similar technology. The thermal expansion coefficient is usually declared in the starting temperature range of 20 °C–100 °C. These are the working temperatures of the usual internal and specific external environments. Several applications, especially in airspace and space [46], require characteristics in a broader temperature range, especially in negative temperatures. A temperature range of −60 °C–60 °C is declared for testing expansion characteristics and determining the thermal expansion coefficient.
The surface mechanical properties of a 3D-printed AlSi10Mg alloy were also examined using a Hysitron TL 750 (Bruker, Fremont, CA, USA) nanoindentor with SPM capability. Using TriboScan SW version 9.3.2.0 with a standard Berkovich probe (θ = 65.35°, probe aspect ratio 1:8), a nanoindentor calibration routine was made prior to the testing to ensure the reliability of the results. The quartz standard supplied by the manufacturer was used during the calibration process. The experimental setup was as follows: A representative area was selected for each sample. In the selected area, an indentation pattern had been defined. This pattern was a 100- indents array in a 10 × 10 point square grid configuration with 20 µm spacing in both X and Y axis directions. The whole pattern size was 180 × 180 µm. The testing method consisted of the trapezoid load function shown in Figure 4.
The maximum load for the indentation was kept constant at 3500 µN for all indents in the array. The load limit was set later during the method automation definition; thus, the maximal load defined directly in the load function shown here is 1000 µN instead. The time scale of the load function used during the test had not been changed. The data collected for each point in the grid pattern was the Z-axis position and load response. From these data, Young modulus and hardness were calculated. Samples were tested in two planes to the axis of each sample topology: A—perpendicular to the print axis and B—parallel to the print axis.
X-ray diffraction (XPD) data for magnetic powder were collected at 40 kV and 40 mA with a Bragg–Brentano θ-θ diffractometer (Bruker D8 Advance, Fremont, CA, USA), Cu Kα radiation (λ = 1.5418 Å). Data were collected in the angular range 20–70° 2θ, counting 0.4 s for each step of 0.0102° 2θ. Samples were tested only in one plane parallel to the axis of each sample topology, B—parallel to the print axis.
Samples were observed using a Keyence VHX-6000 optical microscope (Keyence, Osaka, Japan) at 2500× magnification after chemical surface modification to observe phase. Modification based on Keller’s solution: HNO3:HCl:CrO3 (5:3:2) reinforced form (leads to etching the grain boundary, but at the cost of etching the surface of individual grains—EBSD is not possible) 50 mL:30 mL:20 mL to 100 mL H2O, etching in the range of 5–10 min per batch. The number of repetitions depends on the assessment of the surface condition. Rinse in H2O and dry with ethanol. Samples were tested in two planes to the axis of each sample topology: A—perpendicular to the print axis and B—parallel to the print axis.
3. Results
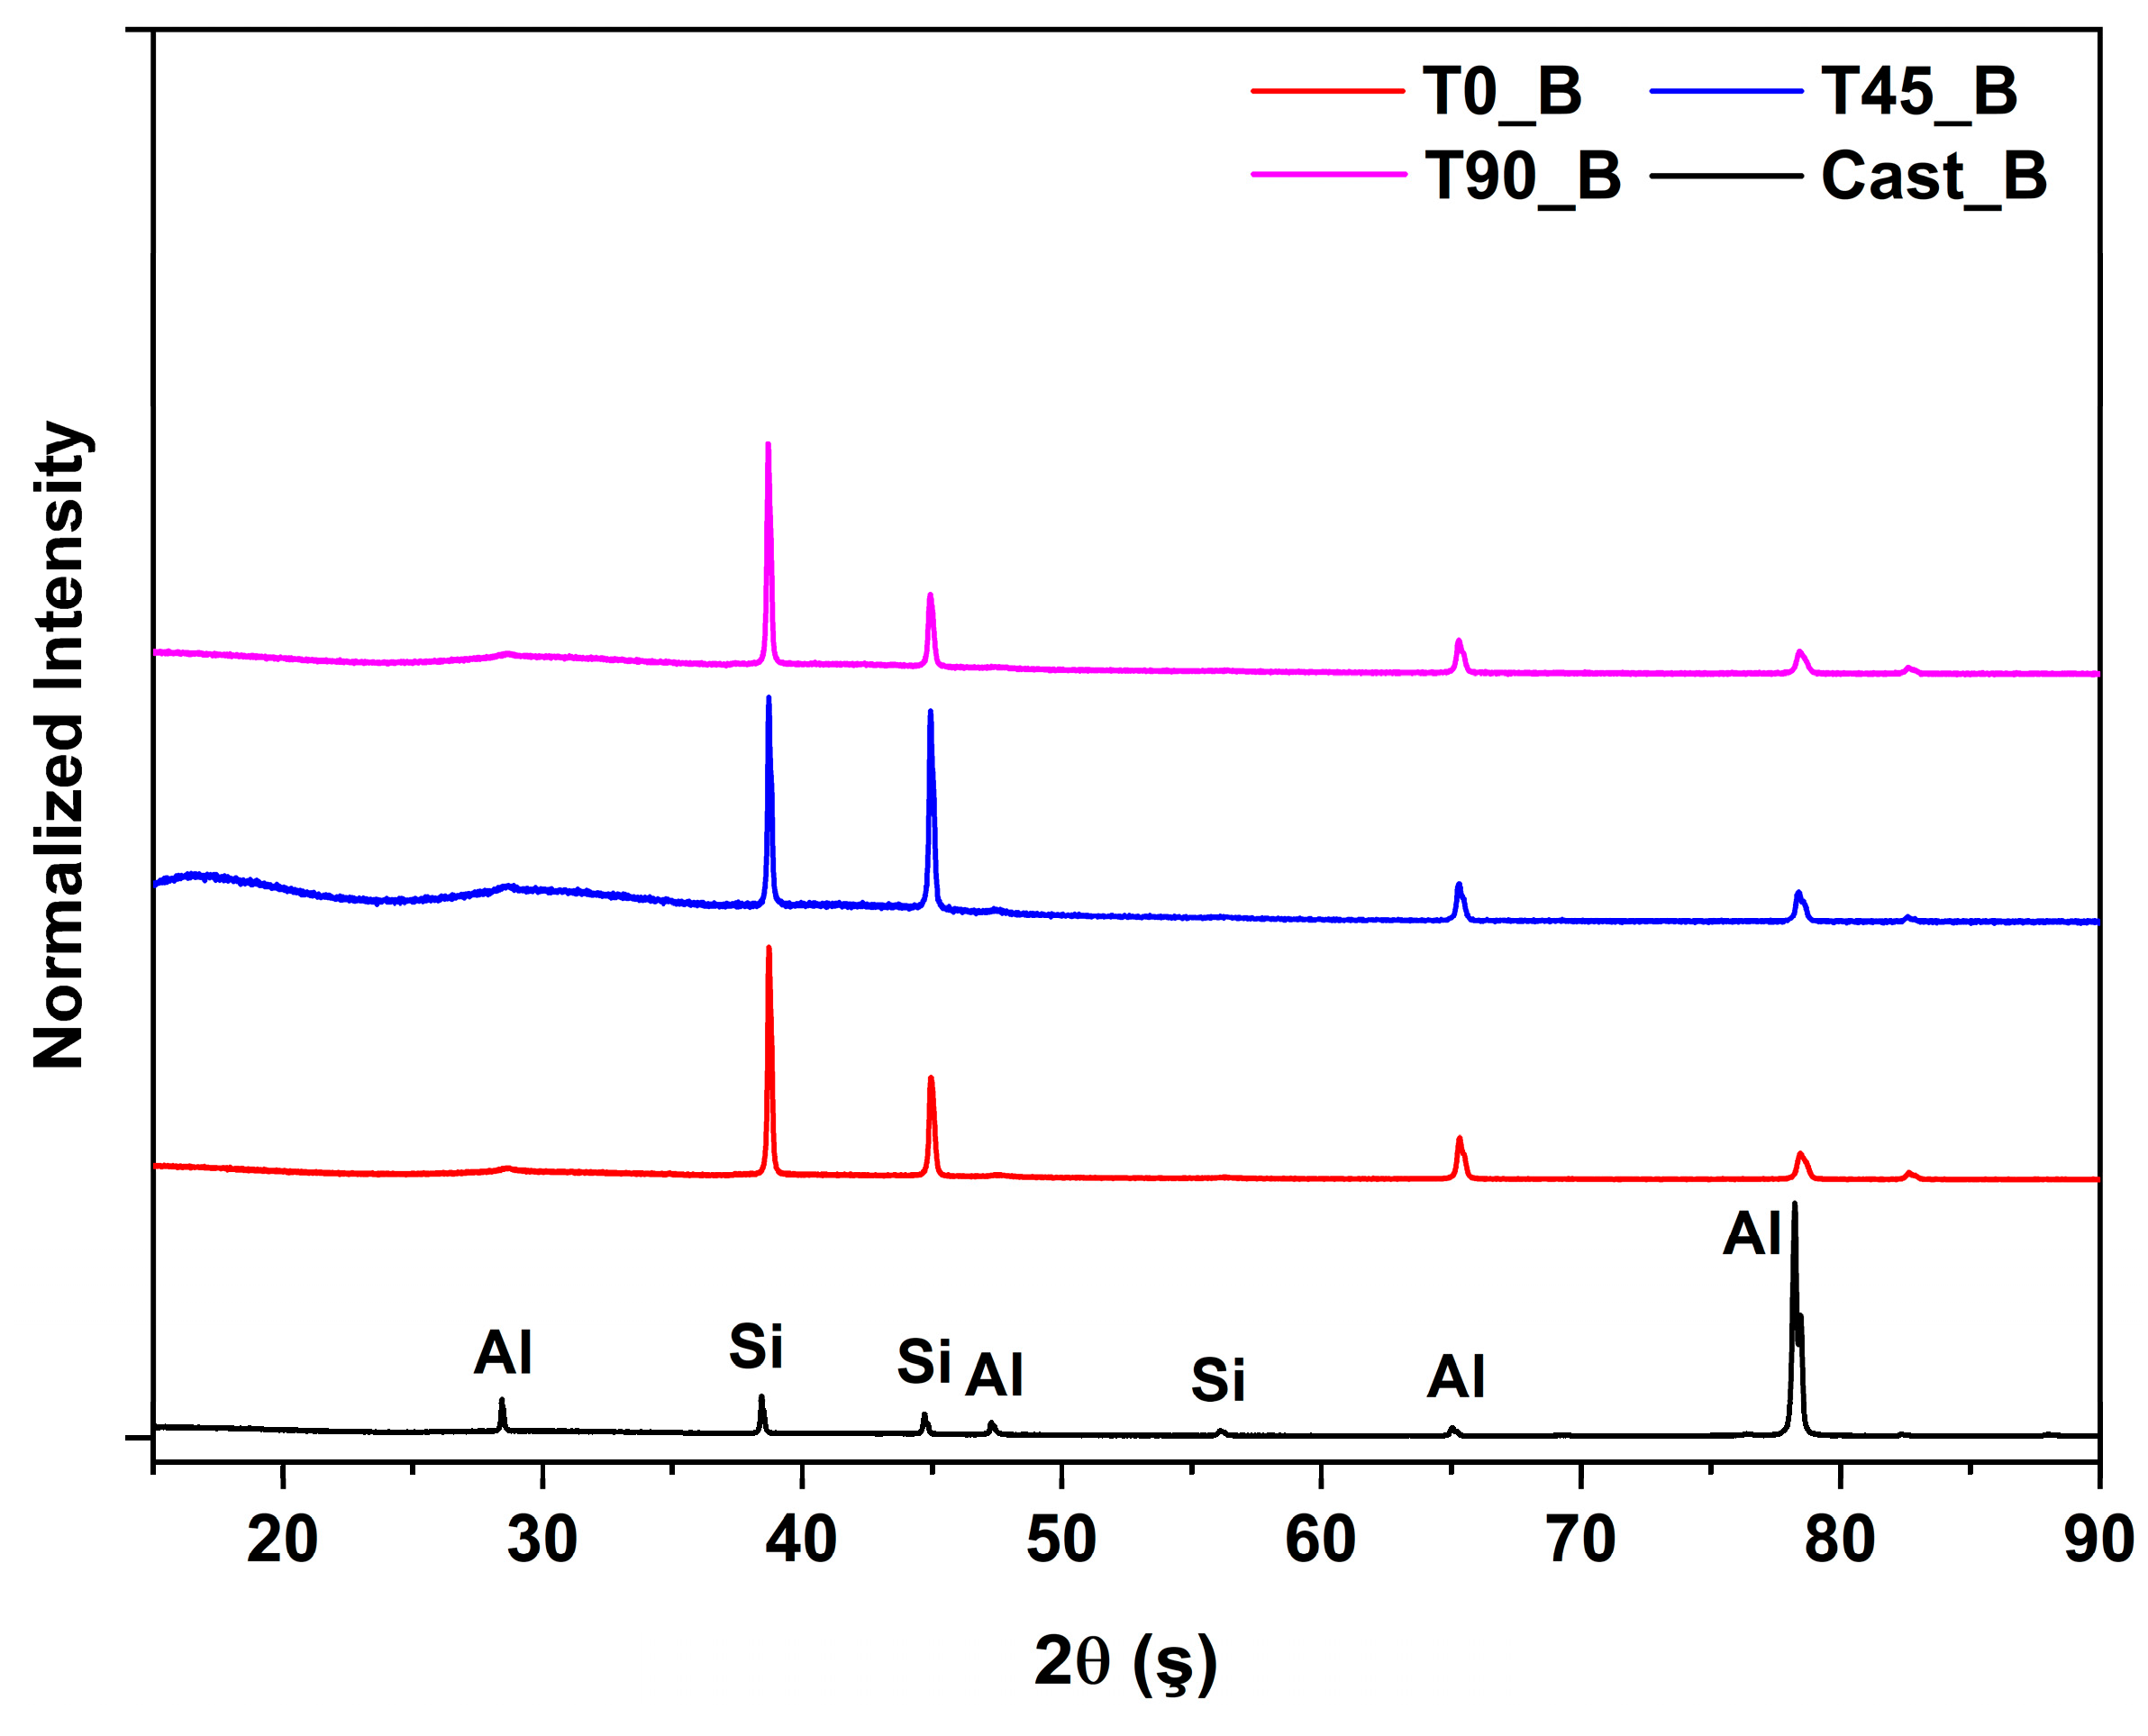
The collected XRD patterns visualized in Figure 5 show the abundance of silicon and aluminum elements. Reference codes of used XRD patterns for qualitative phase identification are 004-0787 and 027-1402 for Al and Si, respectively. The difference between samples produced using conventional procedures (sample Cast_B) and 3D printing (samples T0-T45-T90_B) is clearly visible. In the case of printed products, the Al peak at around 28° was barely visible and surrounded by a wider bump, especially in the case of the T45_B sample printed in orientation 45°, suggesting a partial amorphous character of these samples. The high aluminum peak at ca. 78° was recorded, most likely due to the preferred orientation. Detected variations in XRD patterns suggest that applied manufacturing procedures will impact the physical and mechanical properties of the composites produced. The aim of the X-ray diffraction analysis was to demonstrate the phase composition of individual samples as a function of the orientation of the 3D printing, or as compared to conventional technology for the preparation of AlSi10Mg alloys. It is also important to determine whether the material is 100% crystalline or amorphous. The dilatation characteristics for the T90, Cast, and T0 samples are comparable at negative temperatures, with slightly different results for the T45 sample, which also showed the presence of an amorphous phase. A similar trend can also be seen when testing at positive temperatures.
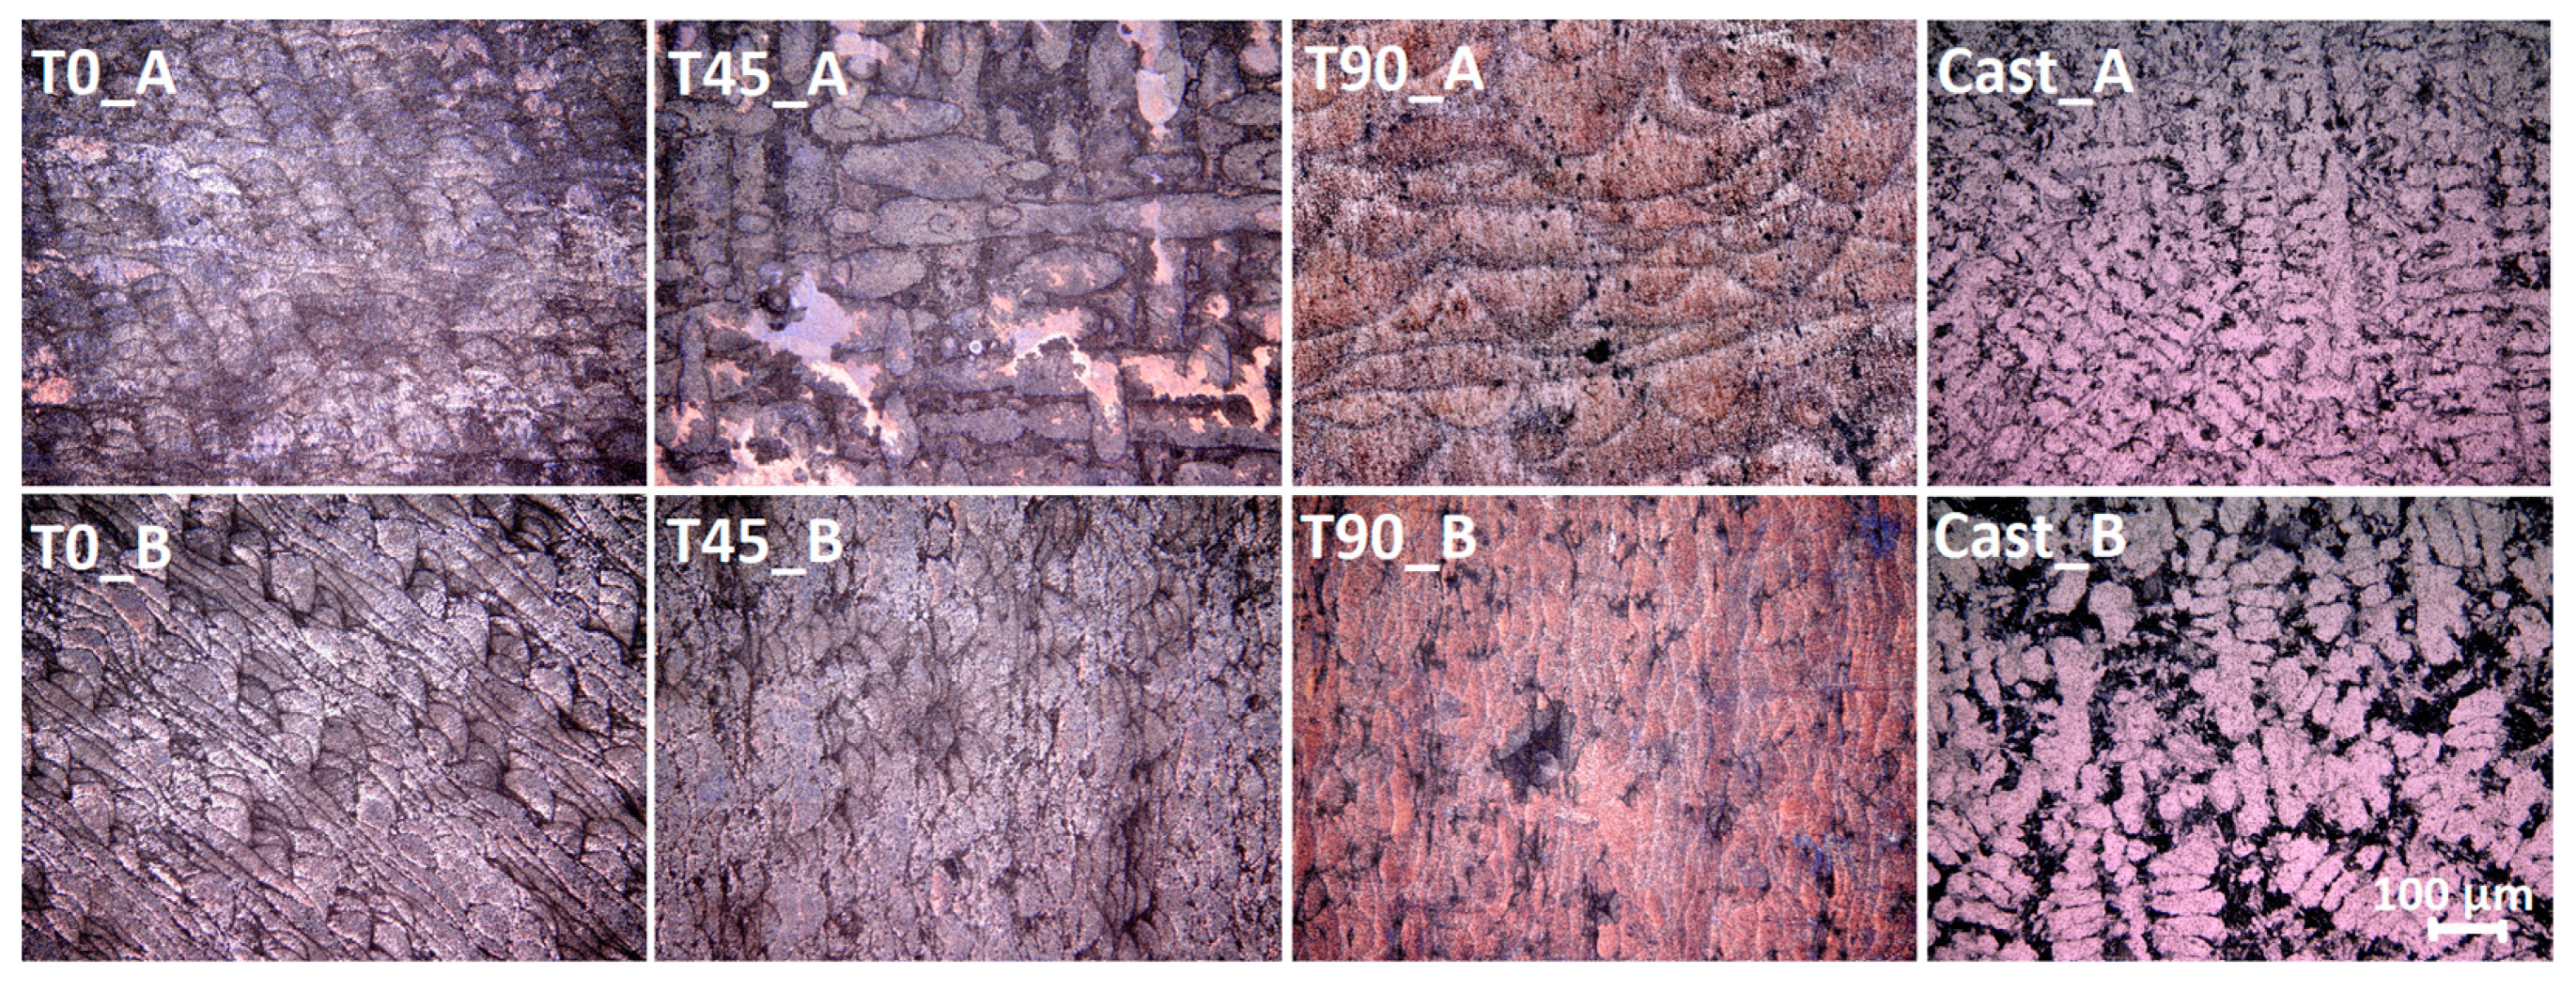
The prepared 3D samples were characterized after highlighting their structures using a digital optical microscope. Figure 6 shows the distribution of grains concerning the different orientations of the 3D print. Sample Cast_A/Cast_B, which correlates with the literature [47], shows a random structure with different crystal orientations in both directions of the sample structure test with the typical dendritic microstructure (the alfa-Al phase with dendritic form is the pink one in Figure 6 Cast_A and Cast_B). The presence of the Si eutectic is evidence. The other samples show a different arrangement of grains concerning the topology. Samples T45_A and T90_A show larger grains than the other samples and the samples’ orientation, which could affect the resulting mechanical properties. In samples T45 and T90, the influence of the print topology on the internal structure is evident, as black dots corresponding to porosity can be seen in the images. The melt pool is also visible in the images of samples T0_A, T0_B, T45_B, T90_A, and T90_B. Sample T45_A shows a similar microstructure to that reported in the literature [48], where the laser scanning made the trace boundaries appear more etched, with smaller crystals of different crystallographic orientations also visible. With regard to the microstructural characteristics, the evaluation data are shown in Table 4. From the results, it can be seen that sample T45 has a larger minimum and maximum diameter compared to the other samples, which appear comparable. The different results are also related to the XRD results, where the presence of an amorphous phase was detected for sample T_45.
The mechanical properties of the surface, which are essential in preventing easy crack propagation due to long-term stress, were characterized by determining hardness and Young’s modulus using nanoindentation. An example of a nanoindent during testing is shown in Figure 7. The test results are then summarized in Table 4. The results vary depending on the indentation topology and the direction of mechanical stress. The hardness values for samples 1, 2, and 4 are comparable. The sample with a 90° (T90) topology shows slightly different results. Sample T0_A achieves the highest value of 2.68 GPa when tested from a different direction, which is 1.74 GPa.
The modulus results correspond with the literature [49], where the values are around 85.6 ± 5.3 GPa. The results of the modules for the individual samples are comparable due to the higher values of the standard deviations. From the point of view of sample homogeneity, the higher the standard deviation, the more the measurement was affected by, e.g., sample stratification, melt pool, or porosity. No significant influence of the nanoindentation results on the dilatation characteristics was observed (Table 5), as they were also comparable for all samples. The results from the nanoindenter would be more conclusive for cyclic loading. Nevertheless, it is important to have verified mechanical surface properties for industrial applications from the point of view of structural part design.
The direction of the temperature course is marked in Figure 8. The marked direction of the temperature gradient is shown through three phases when the direction of the gradient changes. The default temperature is the ambient temperature of 20 °C when there is zero deformation. The direction of the temperature gradient changes within the range of −60 °C to +60 °C. An identical method is used for all measurements, where the temperature gradient course scheme is controlled automatically.
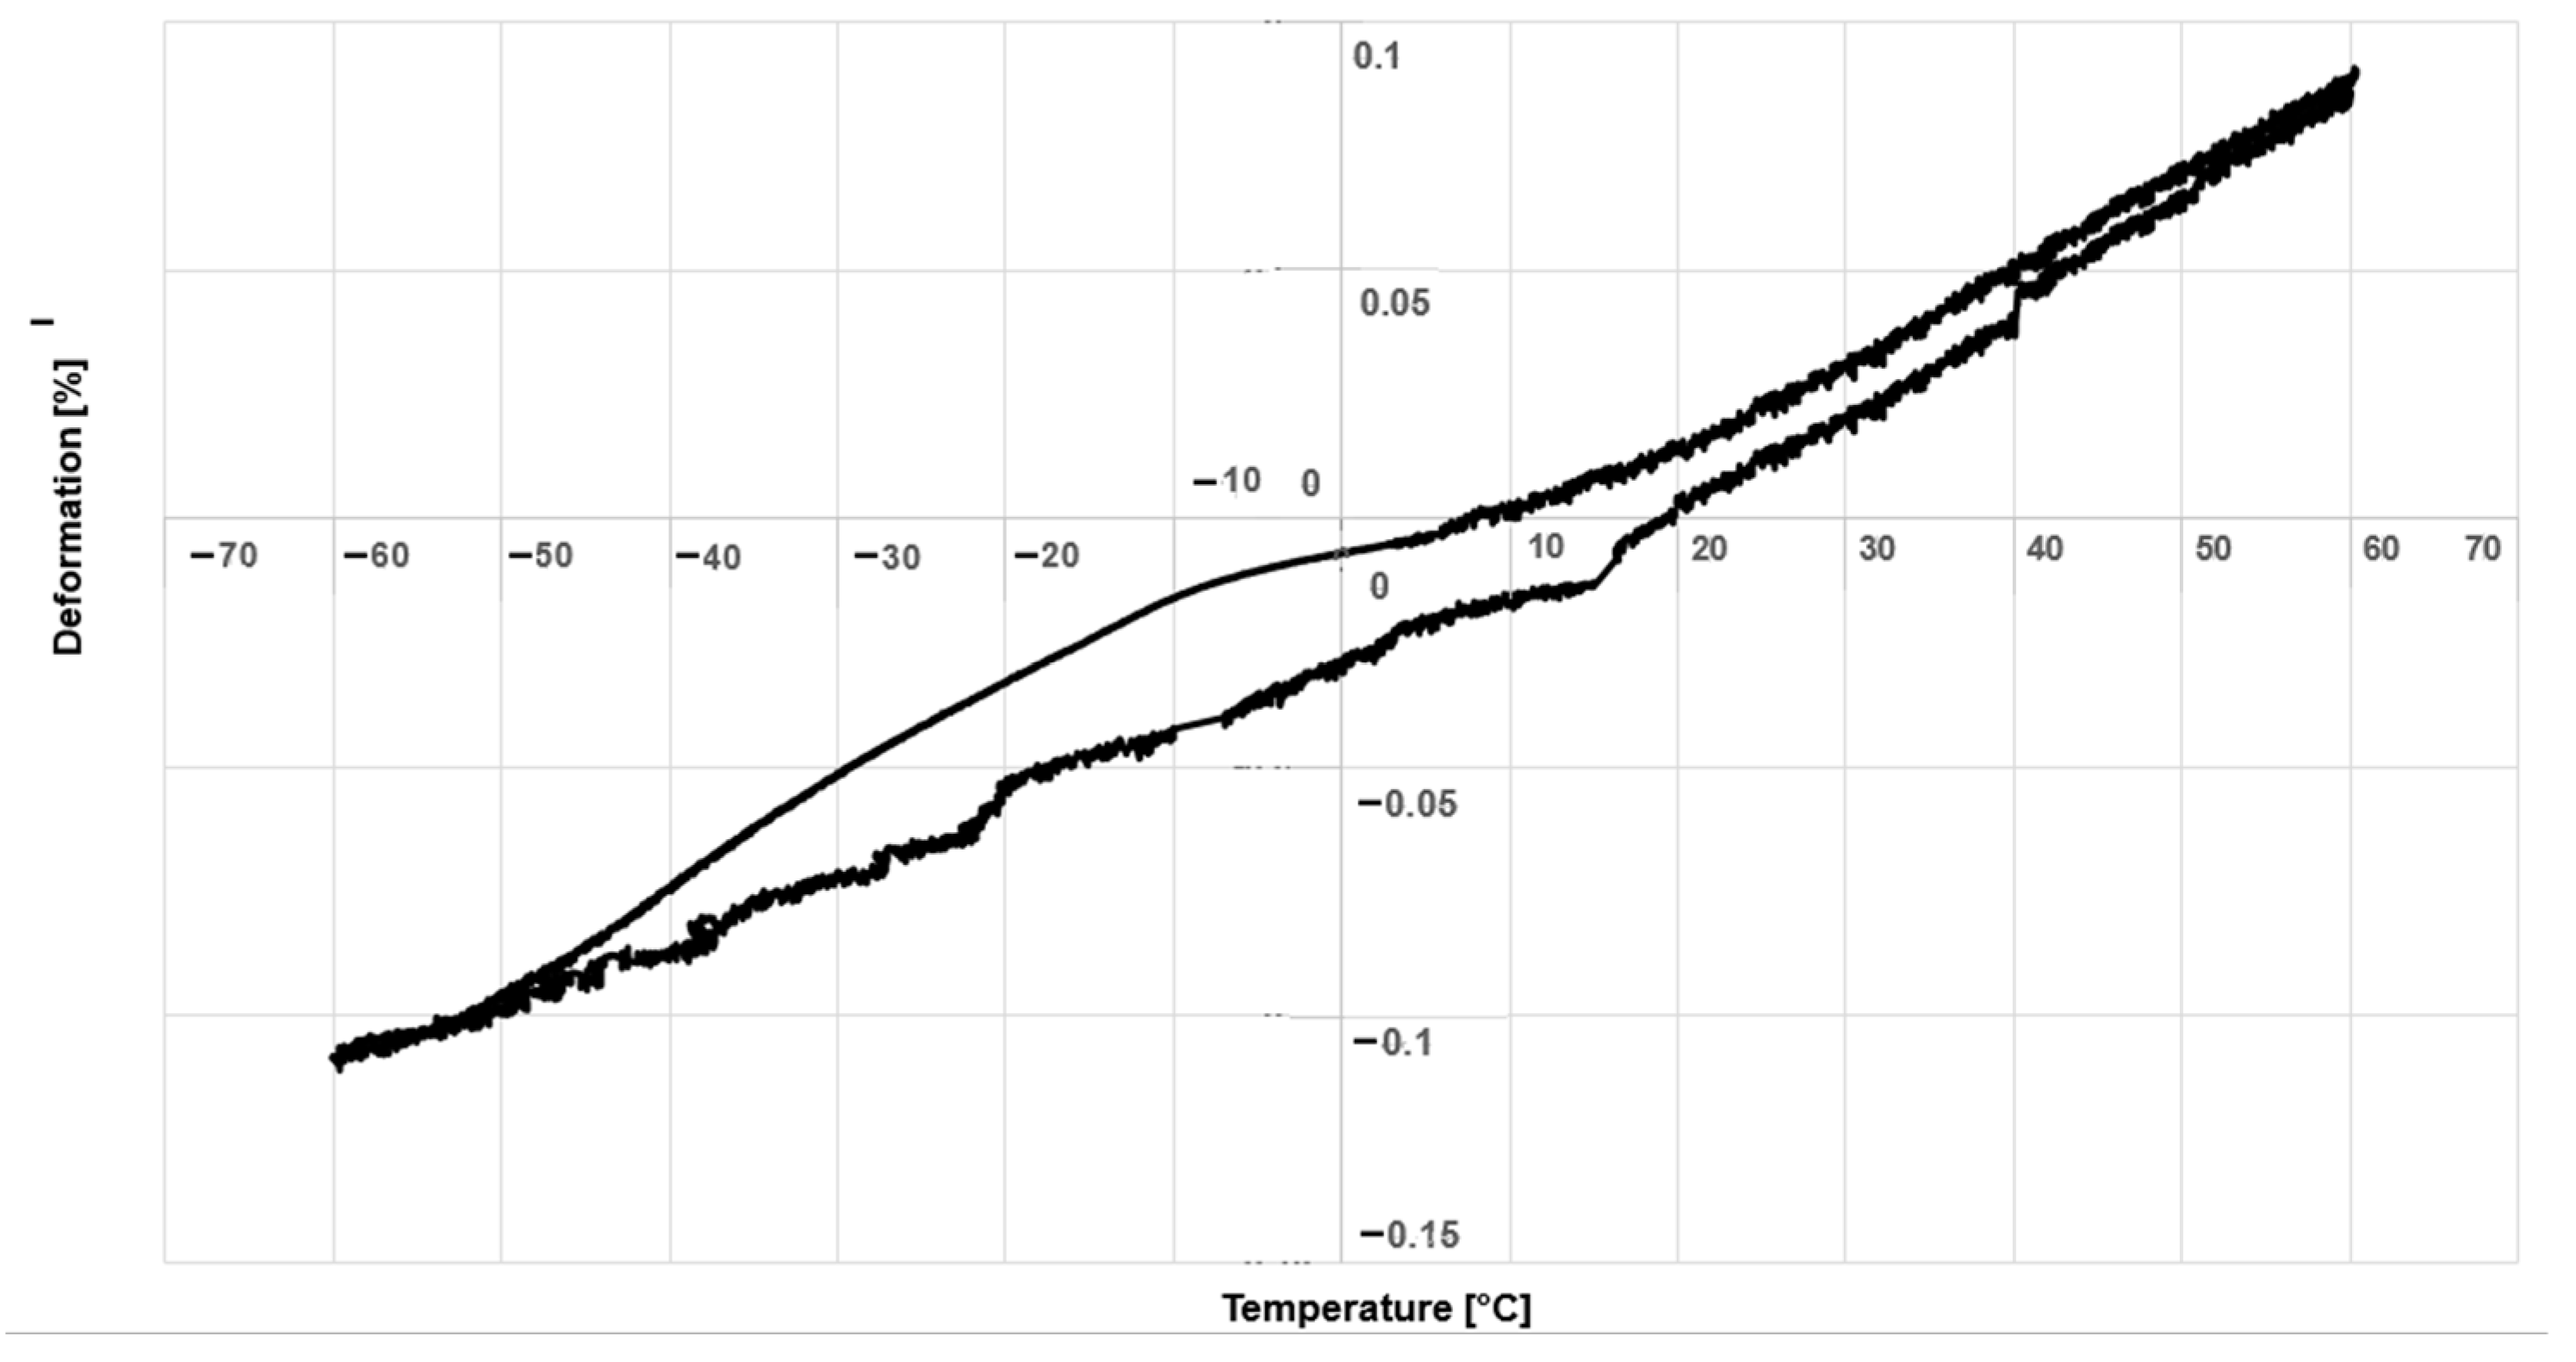
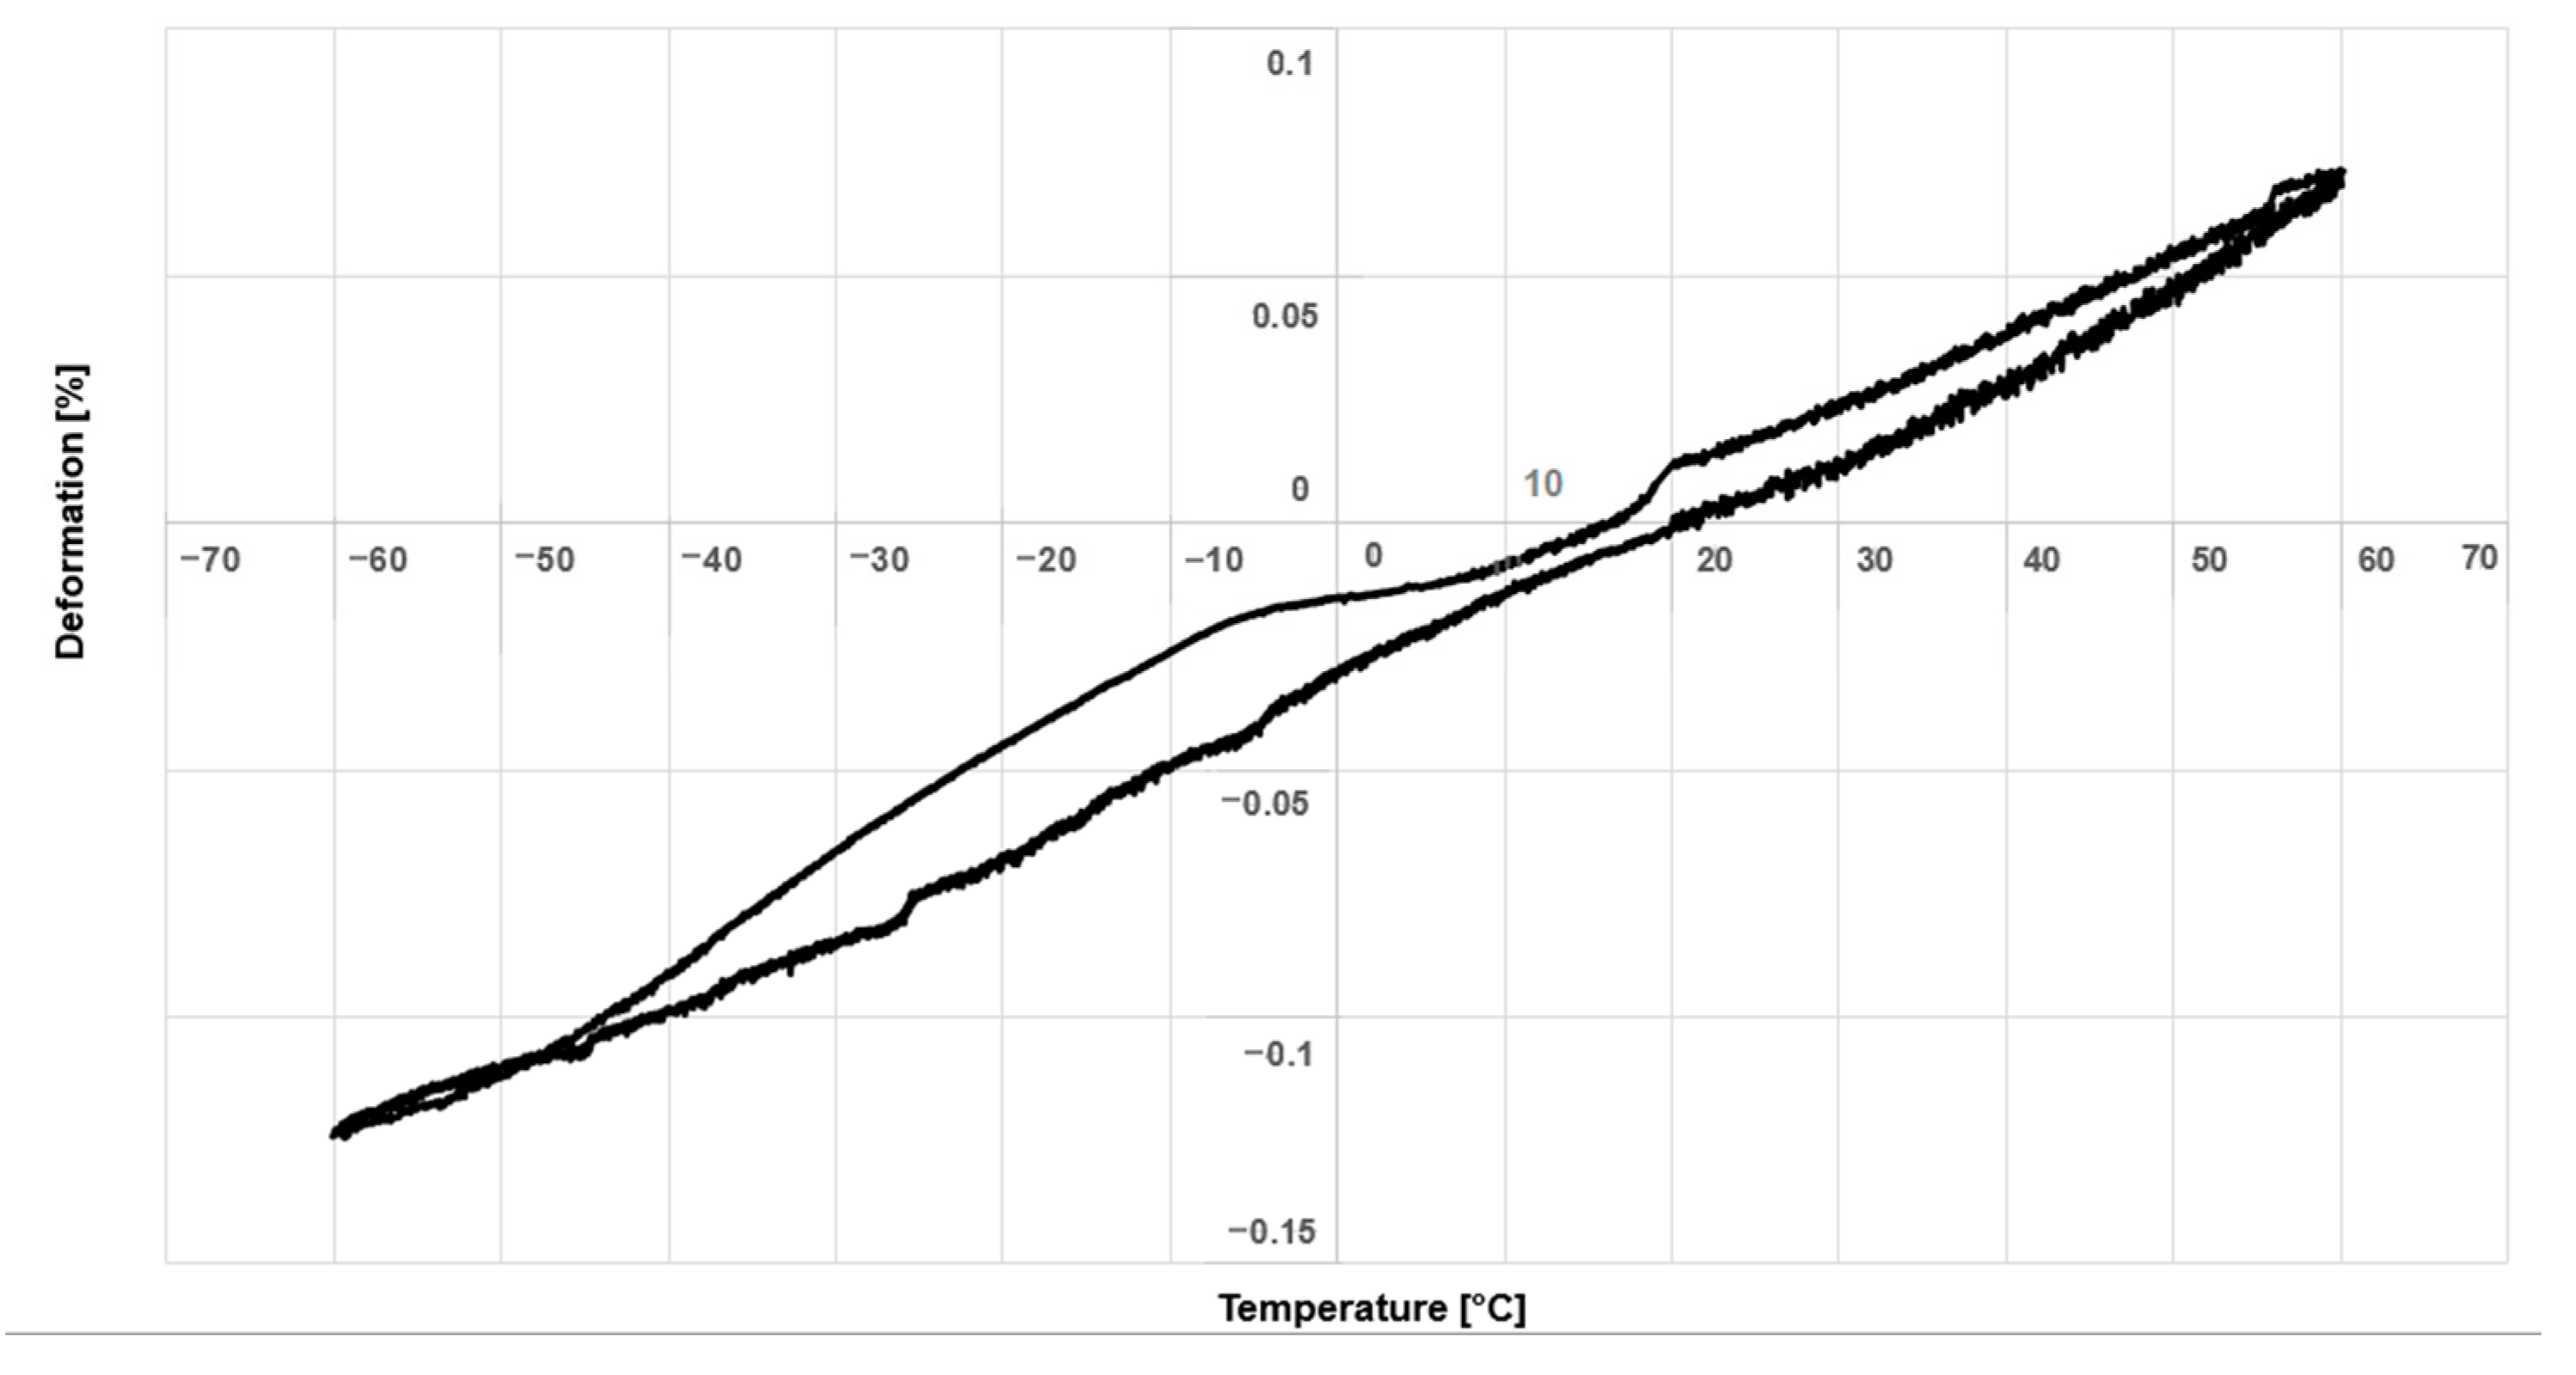
The results obtained by experimental measurement for individual 3D print orientations are shown in Figure 9, Figure 10, Figure 11 and Figure 12. A comparison of all trends in one chart is shown in Figure 13. The tabulated parameters are shown in Table 6 and Table 7. Values and trends are given for individual printing topologies and cast material, used as a comparative reference. The resulting thermal expansion coefficient values do not show significant differences for individual print topologies (Table 7). From the point of view of the functionality of additively manufactured components, there is no apparent significant difference when a change in the component’s behavior would be expected in a wide temperature range.
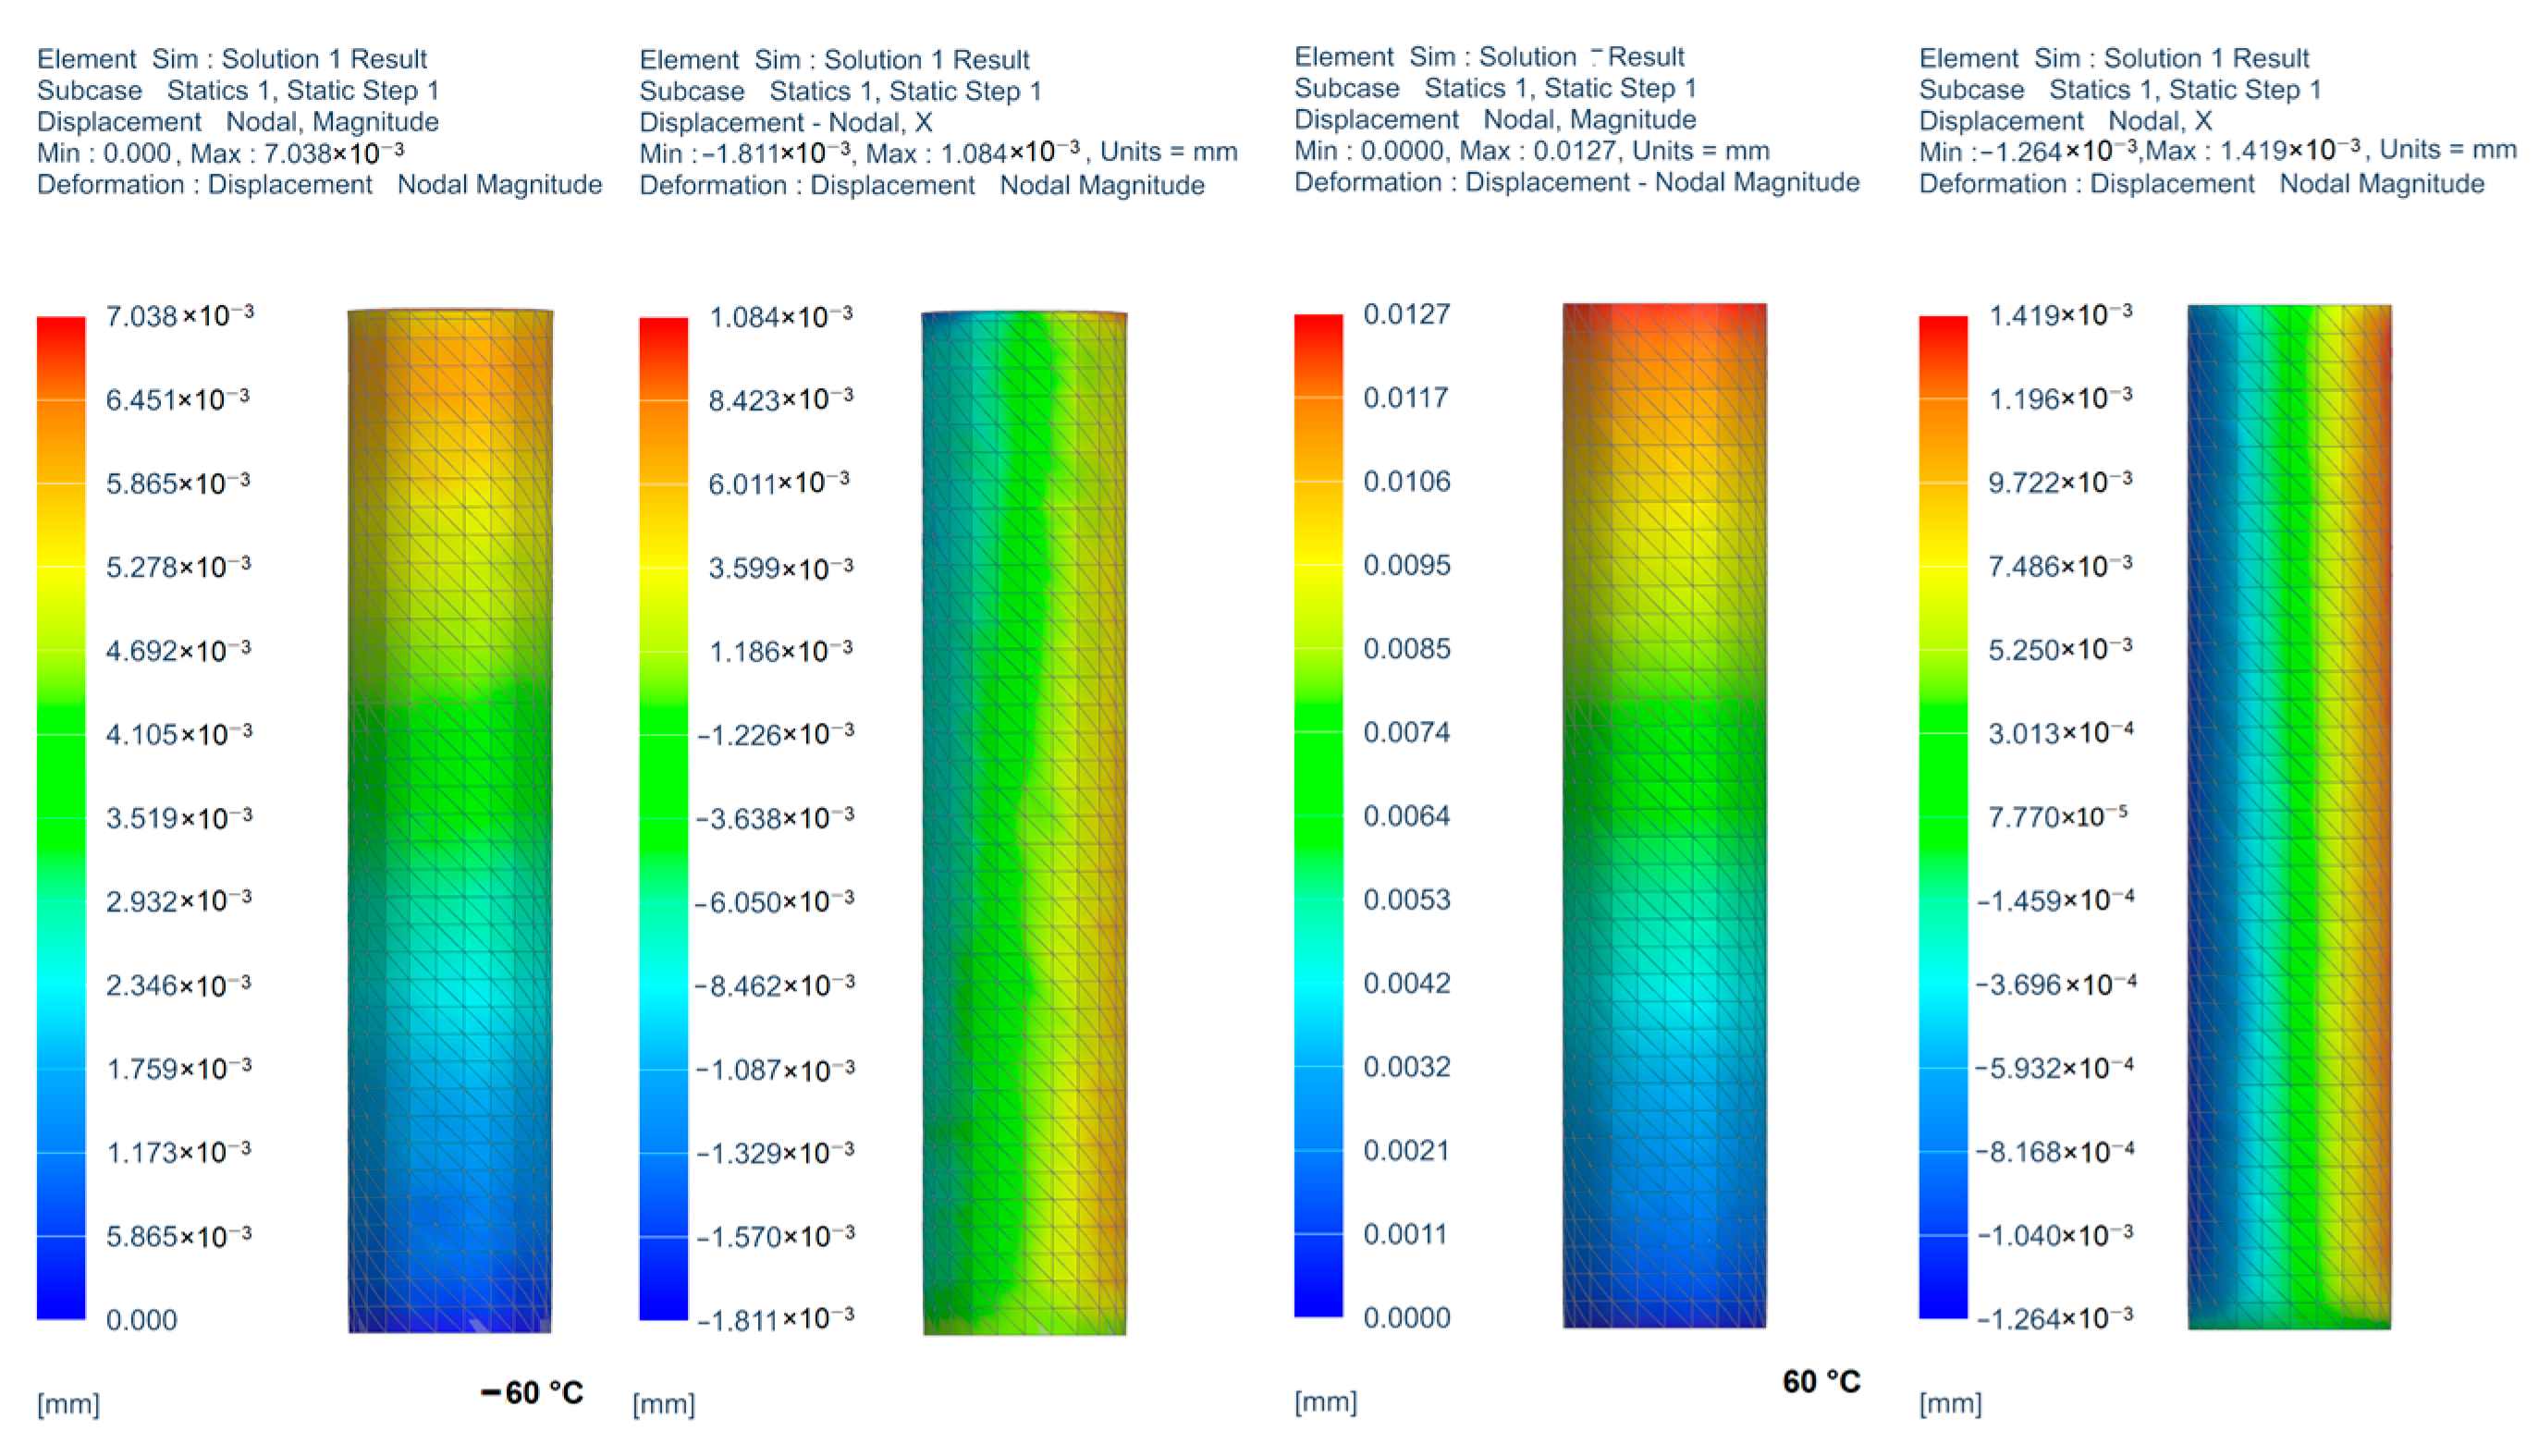
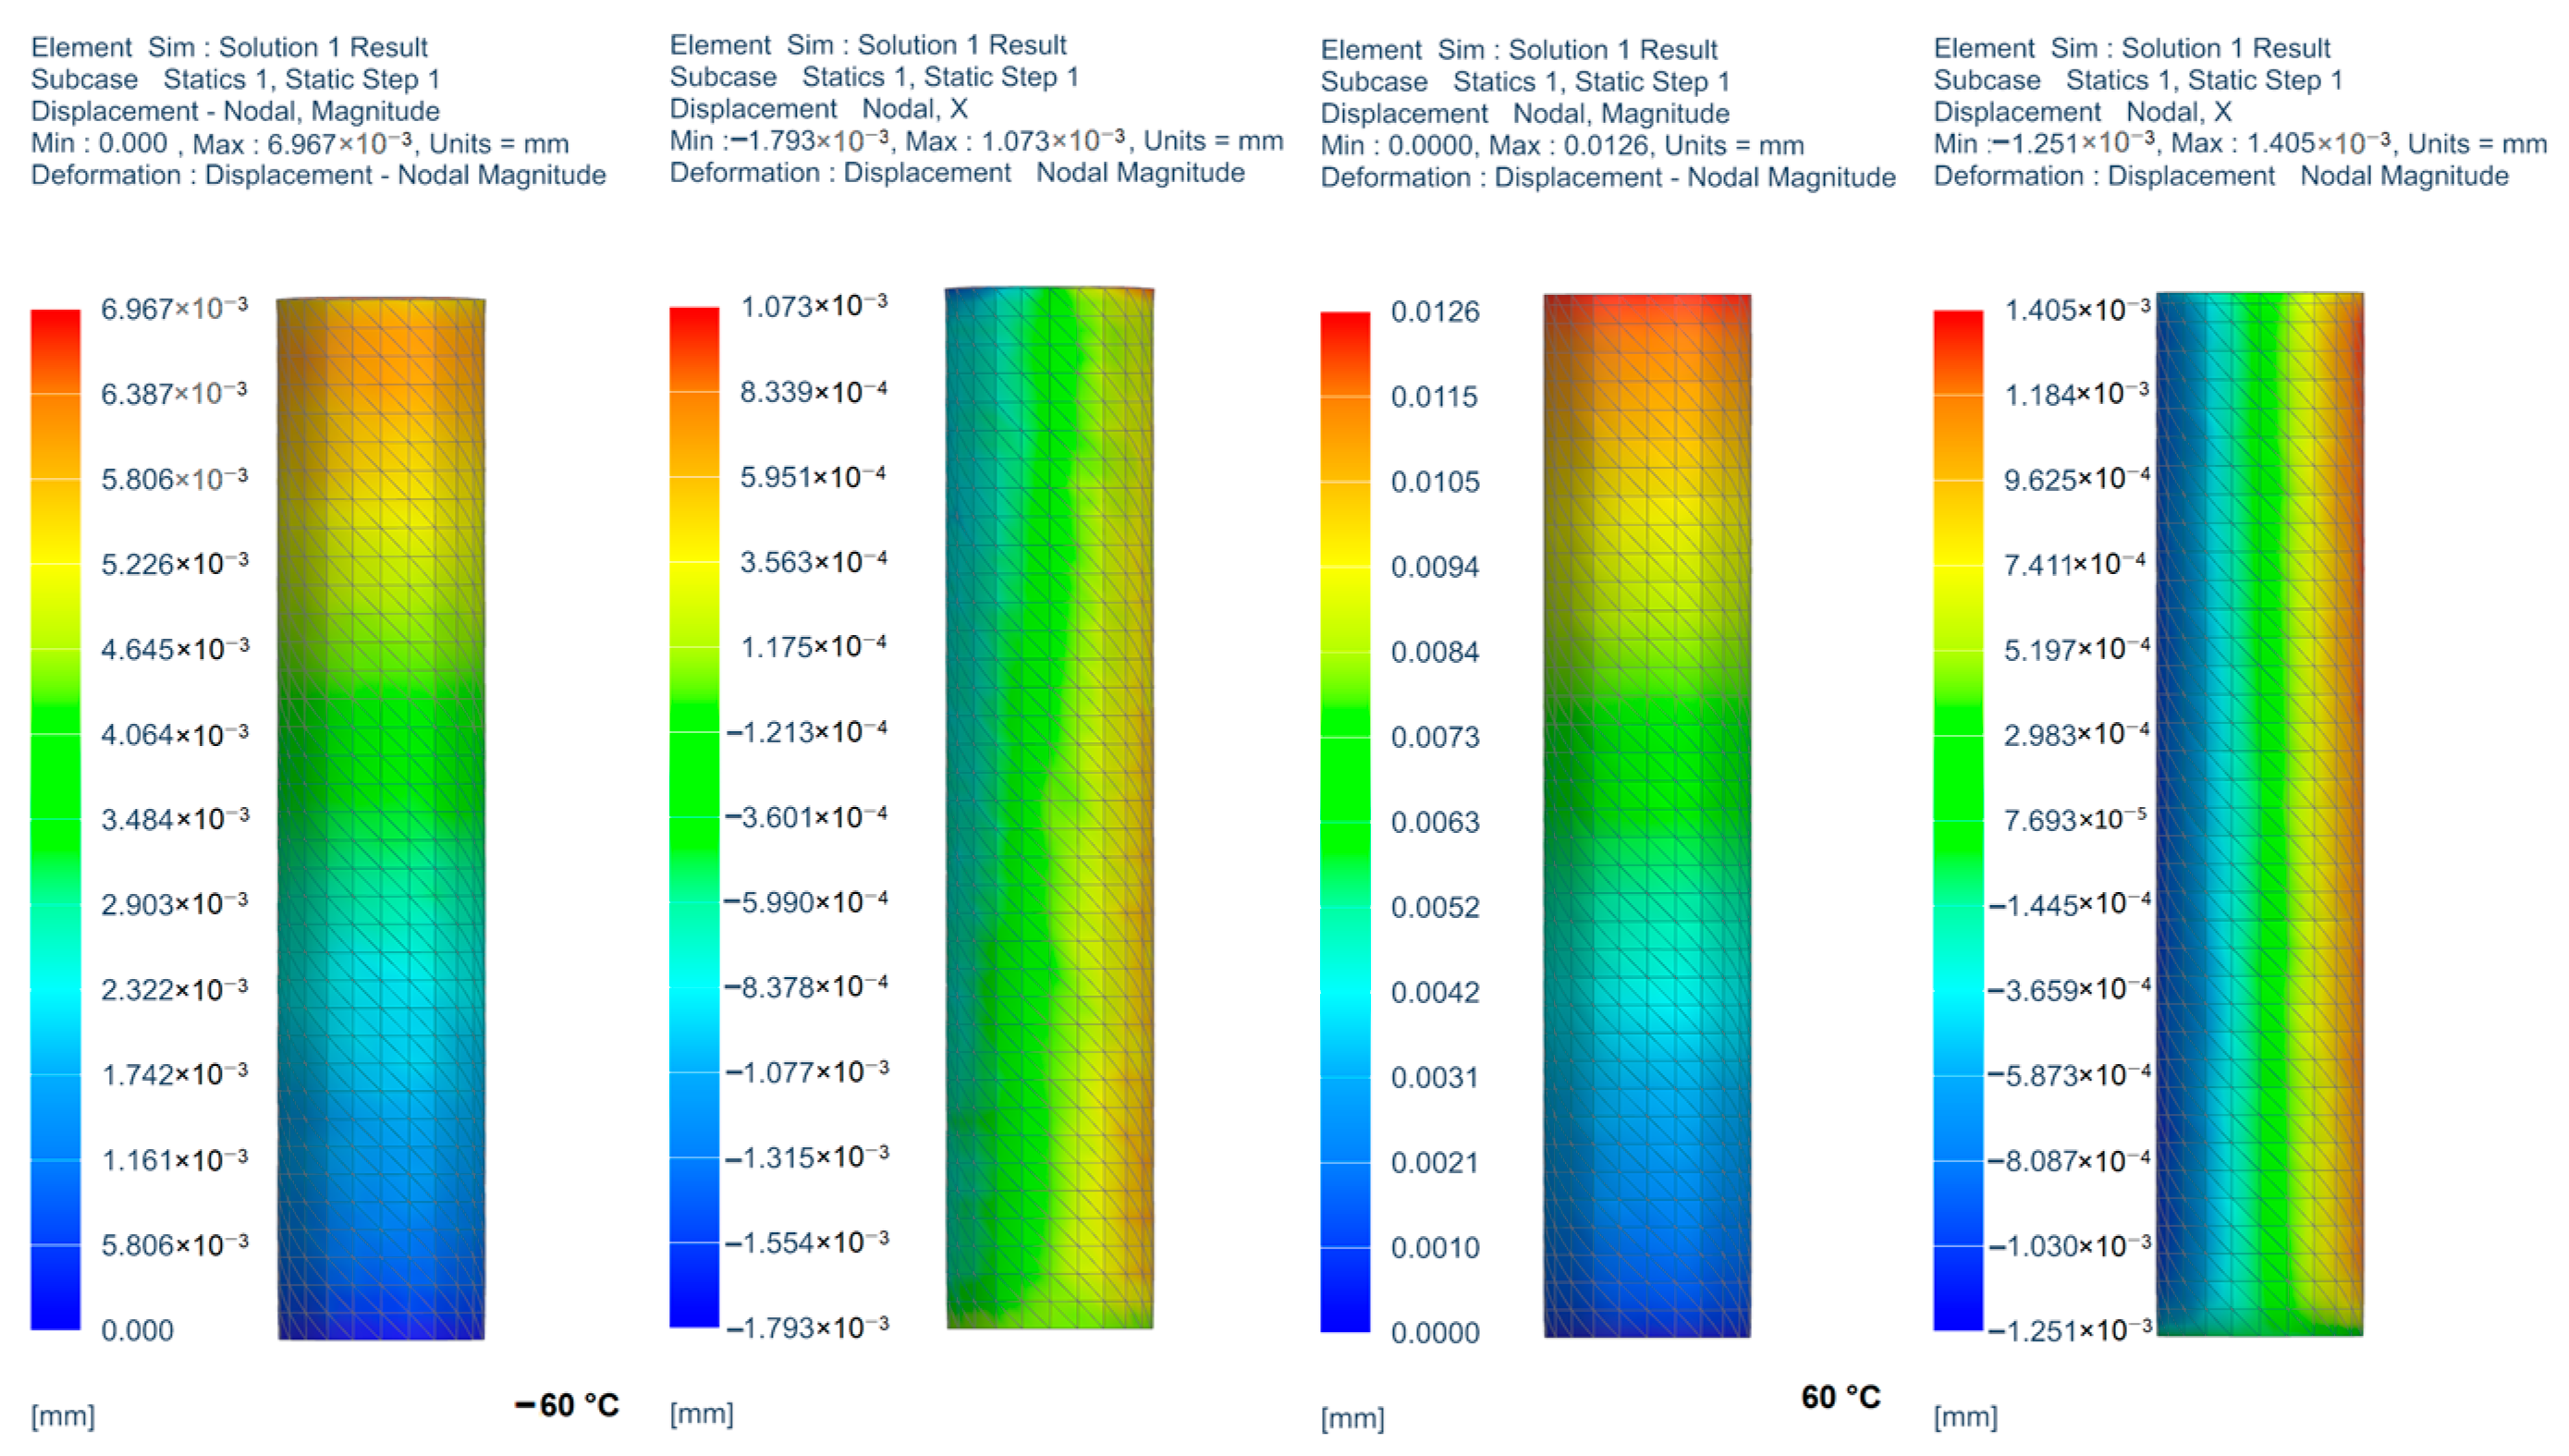
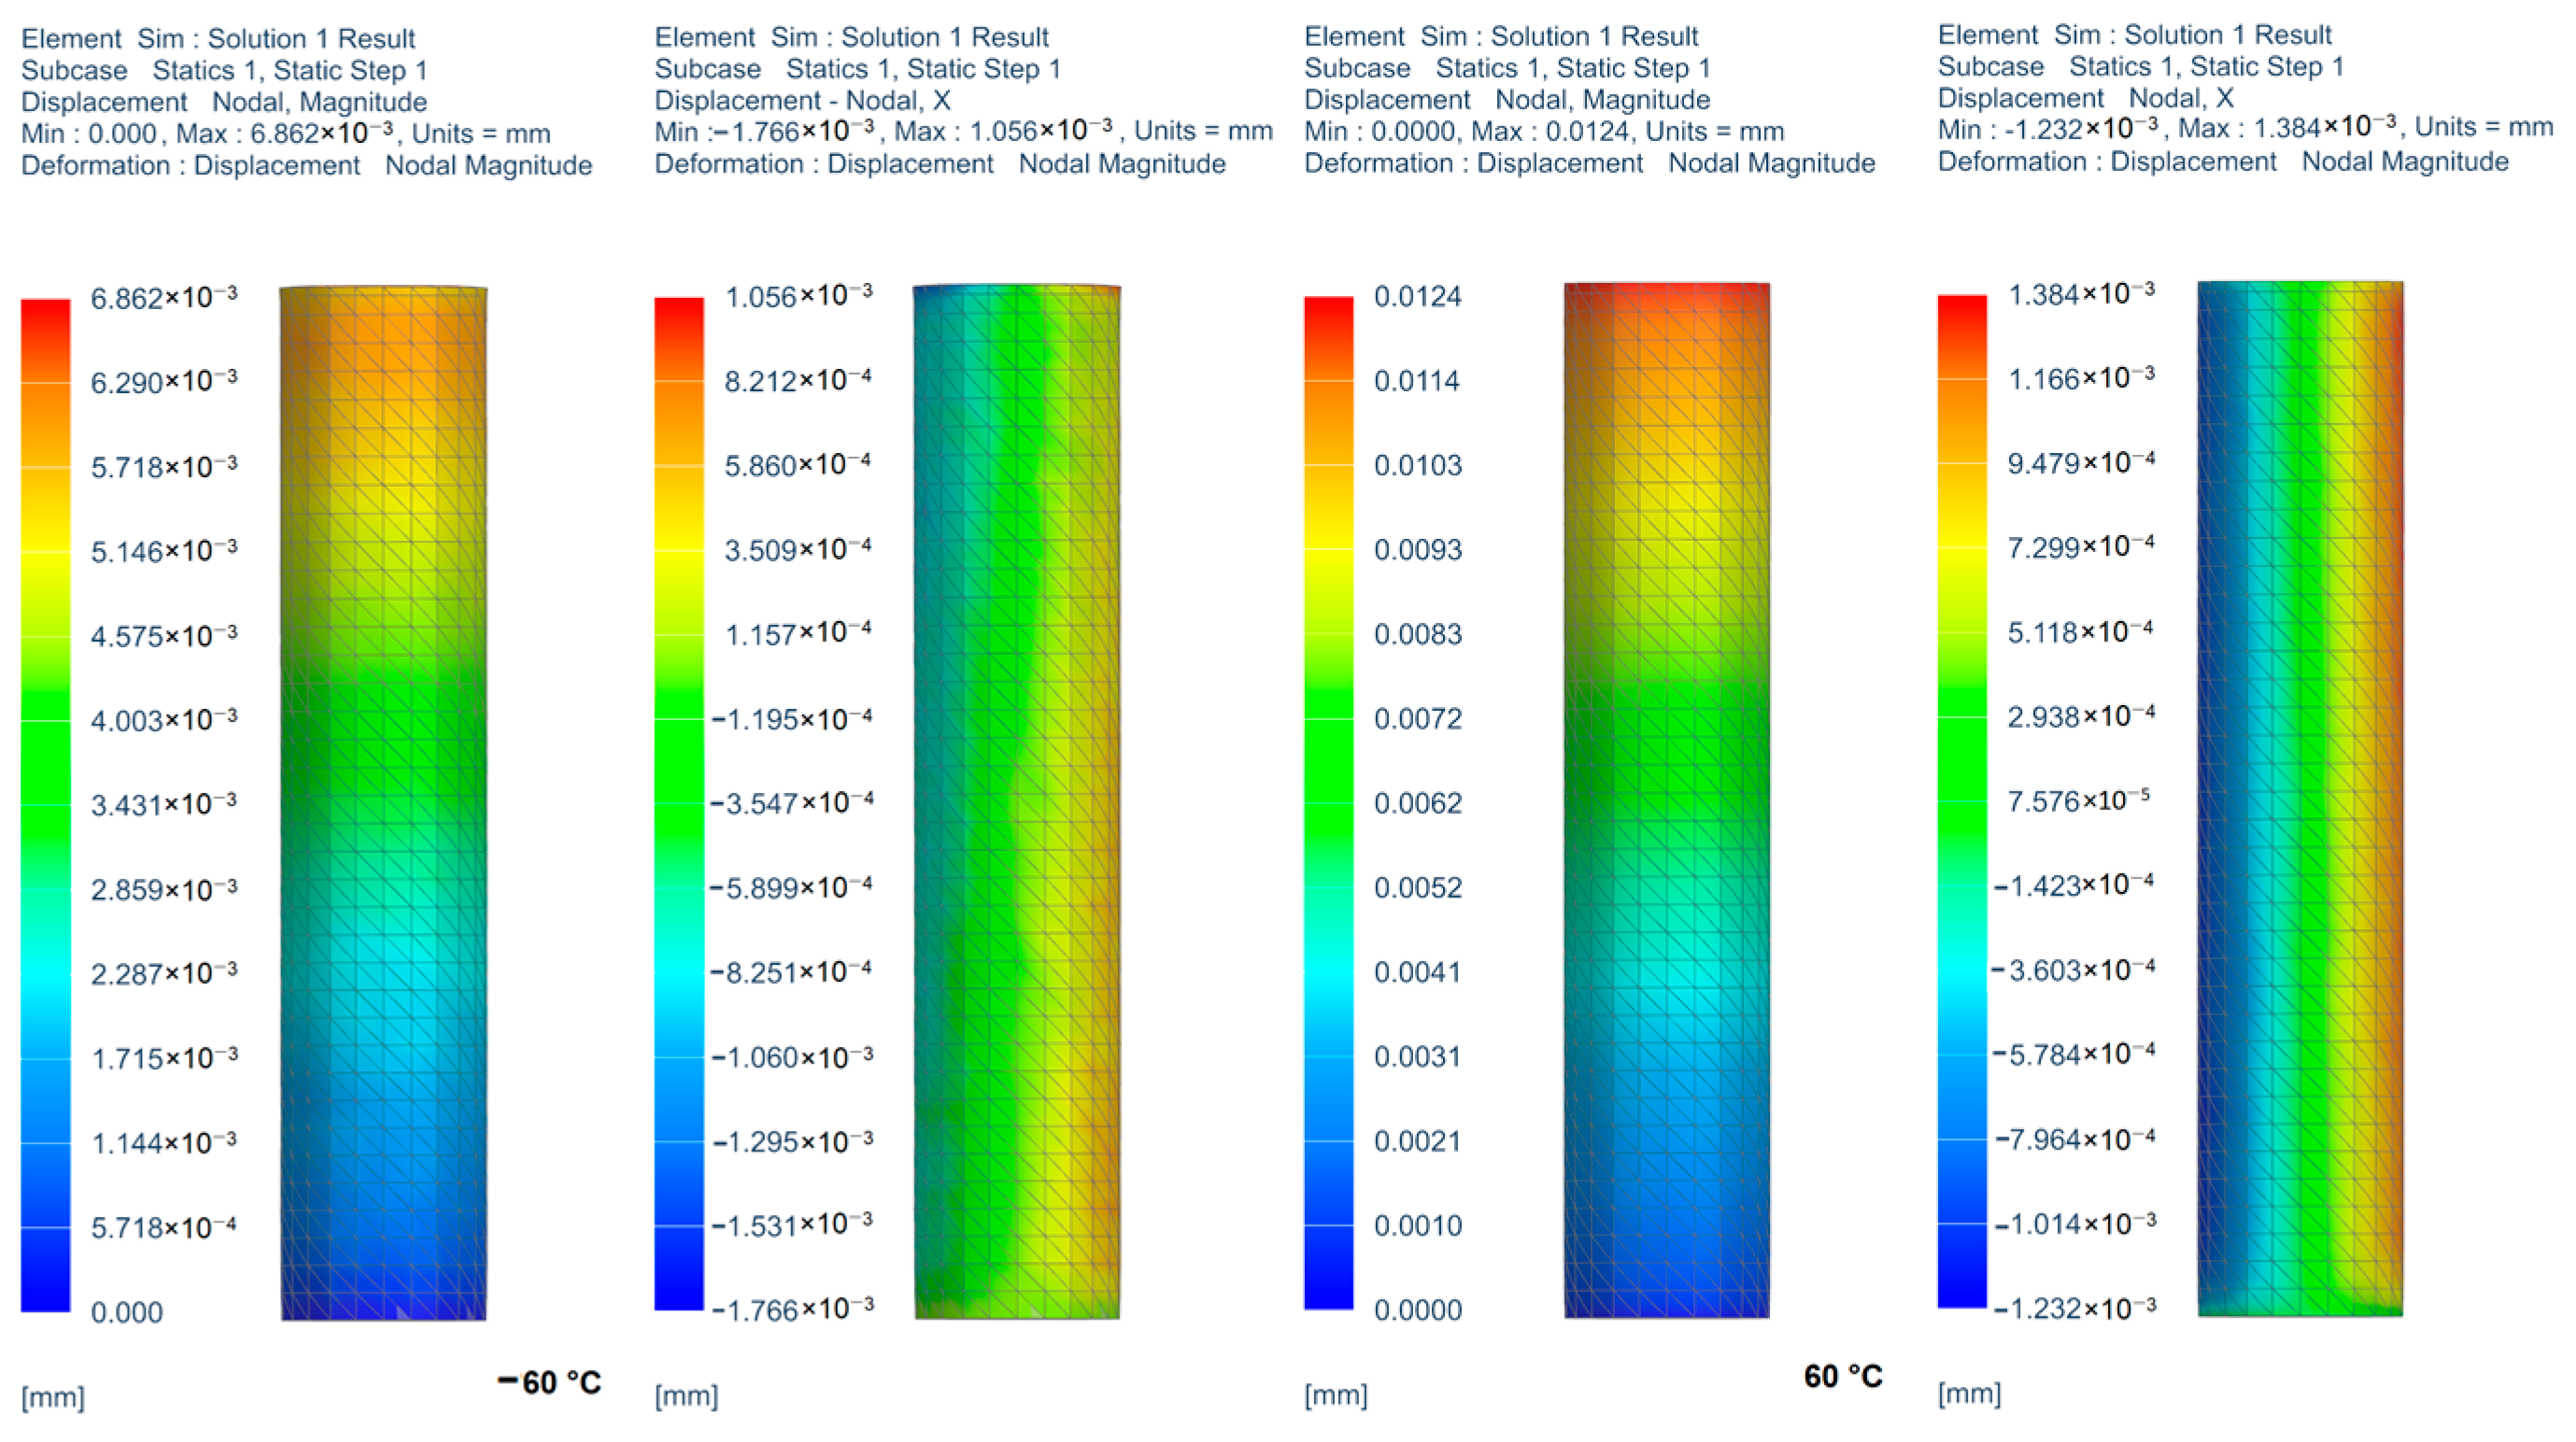
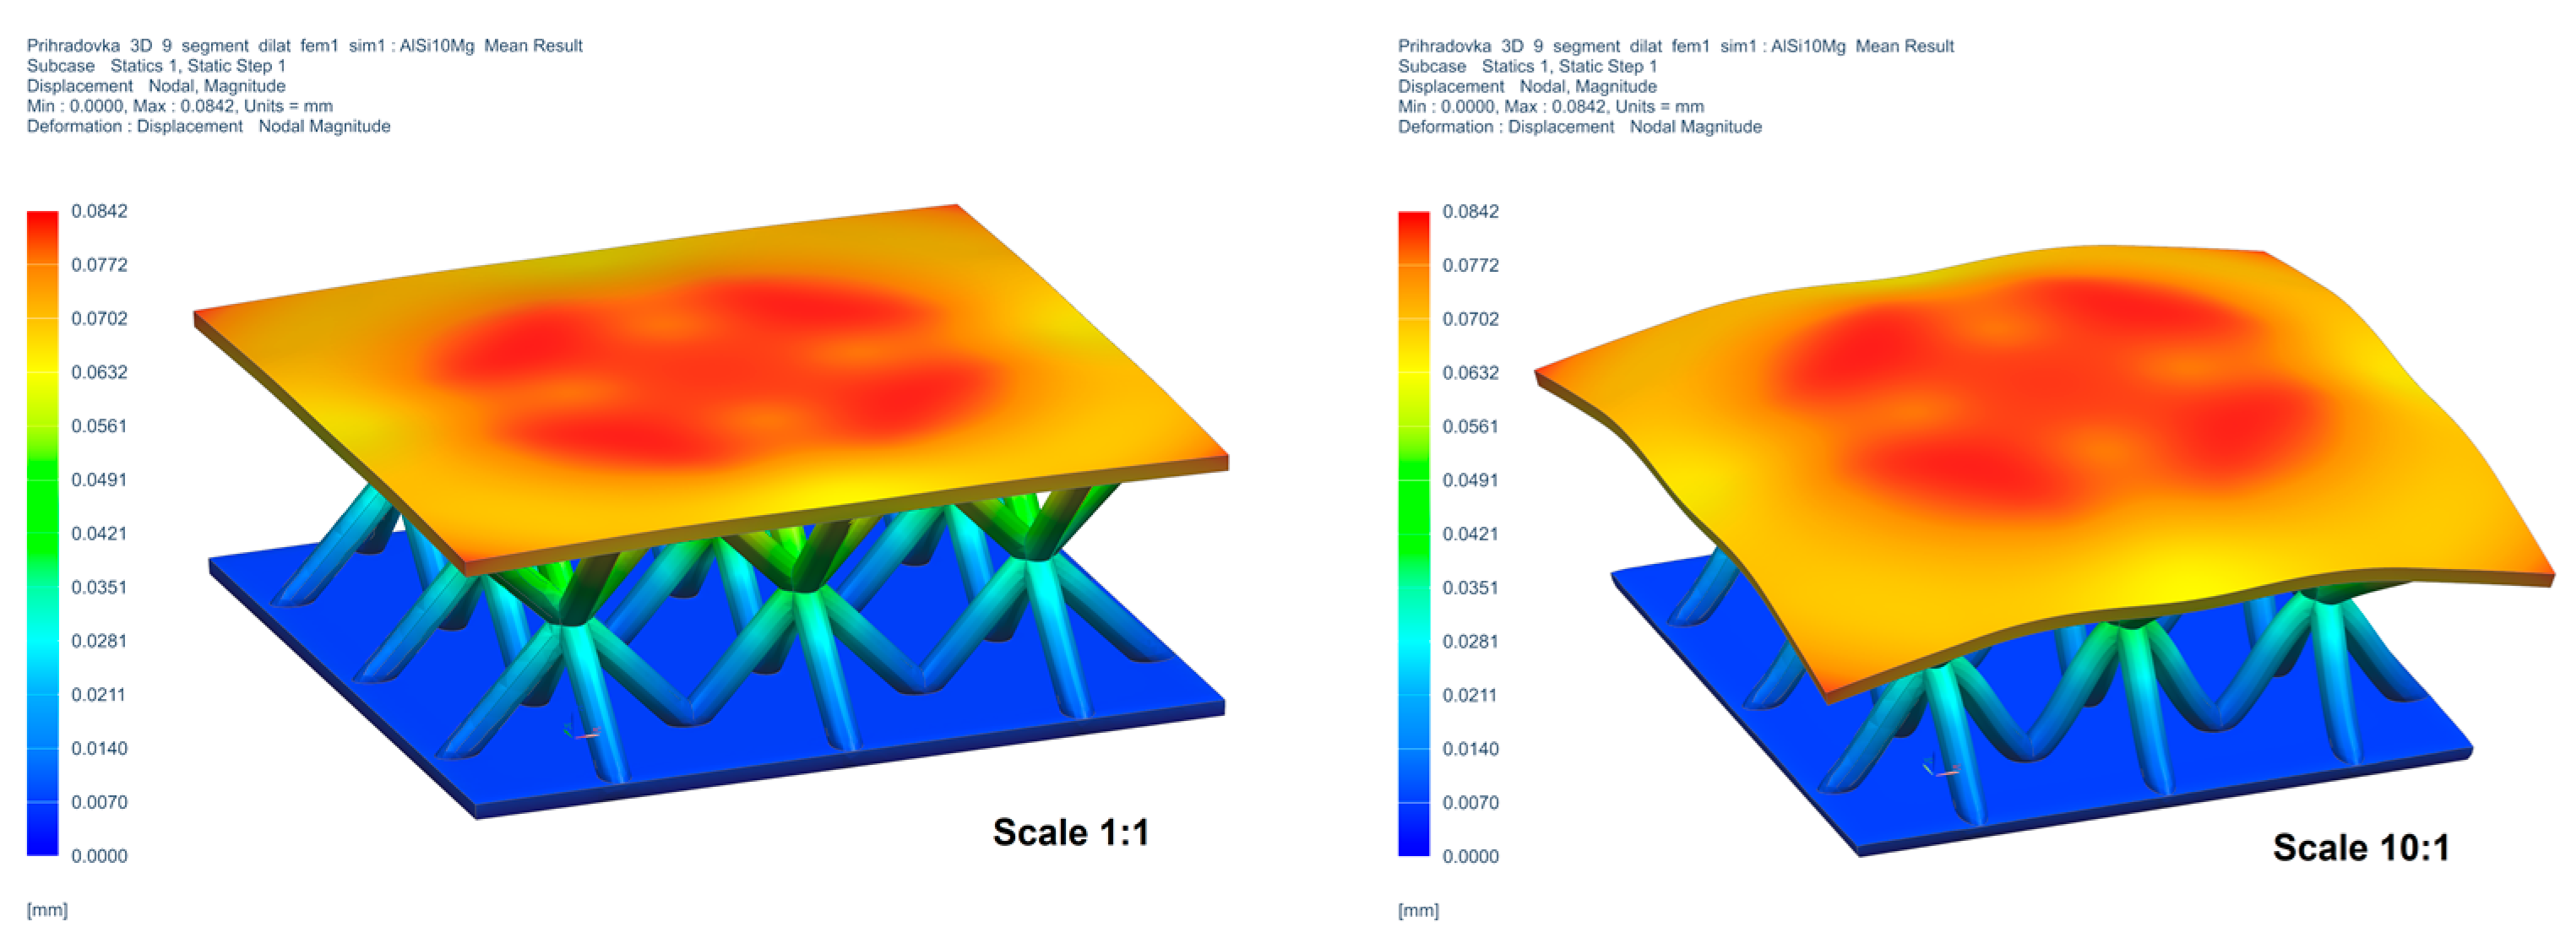
The implementation of the thermal expansion coefficient results for practical use within the simulations of the change in dimensions due to temperature is shown in Figure 14, Figure 15, Figure 16, Figure 17 and Figure 18, on a simple example of a digital model of a virtual prototype of a one-pipe structural element, including linear and radial dimensions—a cylinder. The length and diameter of the cylinder used in the simulation are the same as the measured length and diameter of the test sample. The simulation carried out on a complex three-dimensional body of an additively produced lattice structure is shown in Figure 17 and Figure 18. In all cases, individual thermal expansion coefficients are applied, and the simulation results show the values of maximum deformations, which directly affect the component’s functionality within the relevant structure, working in a broad spectrum of temperature ranges.
The results of the simulations are interpreted for each topology and temperature limit −60 °C–60 °C on the left by the length deformation in the direction of the cylinder axis and on the right in the direction of the perpendicular axis to represent the radial deformation. Simultaneously with the color spectrum, the maximum and minimum values of the calculated simulated results are shown in the results (see Figure 14, Figure 15, Figure 16, Figure 17 and Figure 18). Each image shows a specific 3D printing orientation, or the cast material is always in the left part of the deformation at a temperature of −60 °C; when the image on the right represents axial deformation, the image on the left represents radial deformation. To the right of each figure is the same for deformation at +60 °C. The initial value of the temperature from which the temperature shift is considered is identical to the initial value of the temperature from which the temperature course is started and completed during the experimental measurement.
On visualizations of simulation results, values of deformations according to simulation using the finite element method are shown graphically and with nested text-numeric information. The results are given for the limit values, and, in addition to the maximum values of the deformation of the thermally loaded body in the axial direction, they also visualize the values of the deformations in the radial direction. The absolute deformation in the radial direction is not monitored during the test; however, it is significant for the functional application of the component, which is deformed by thermal load in a wide temperature range.
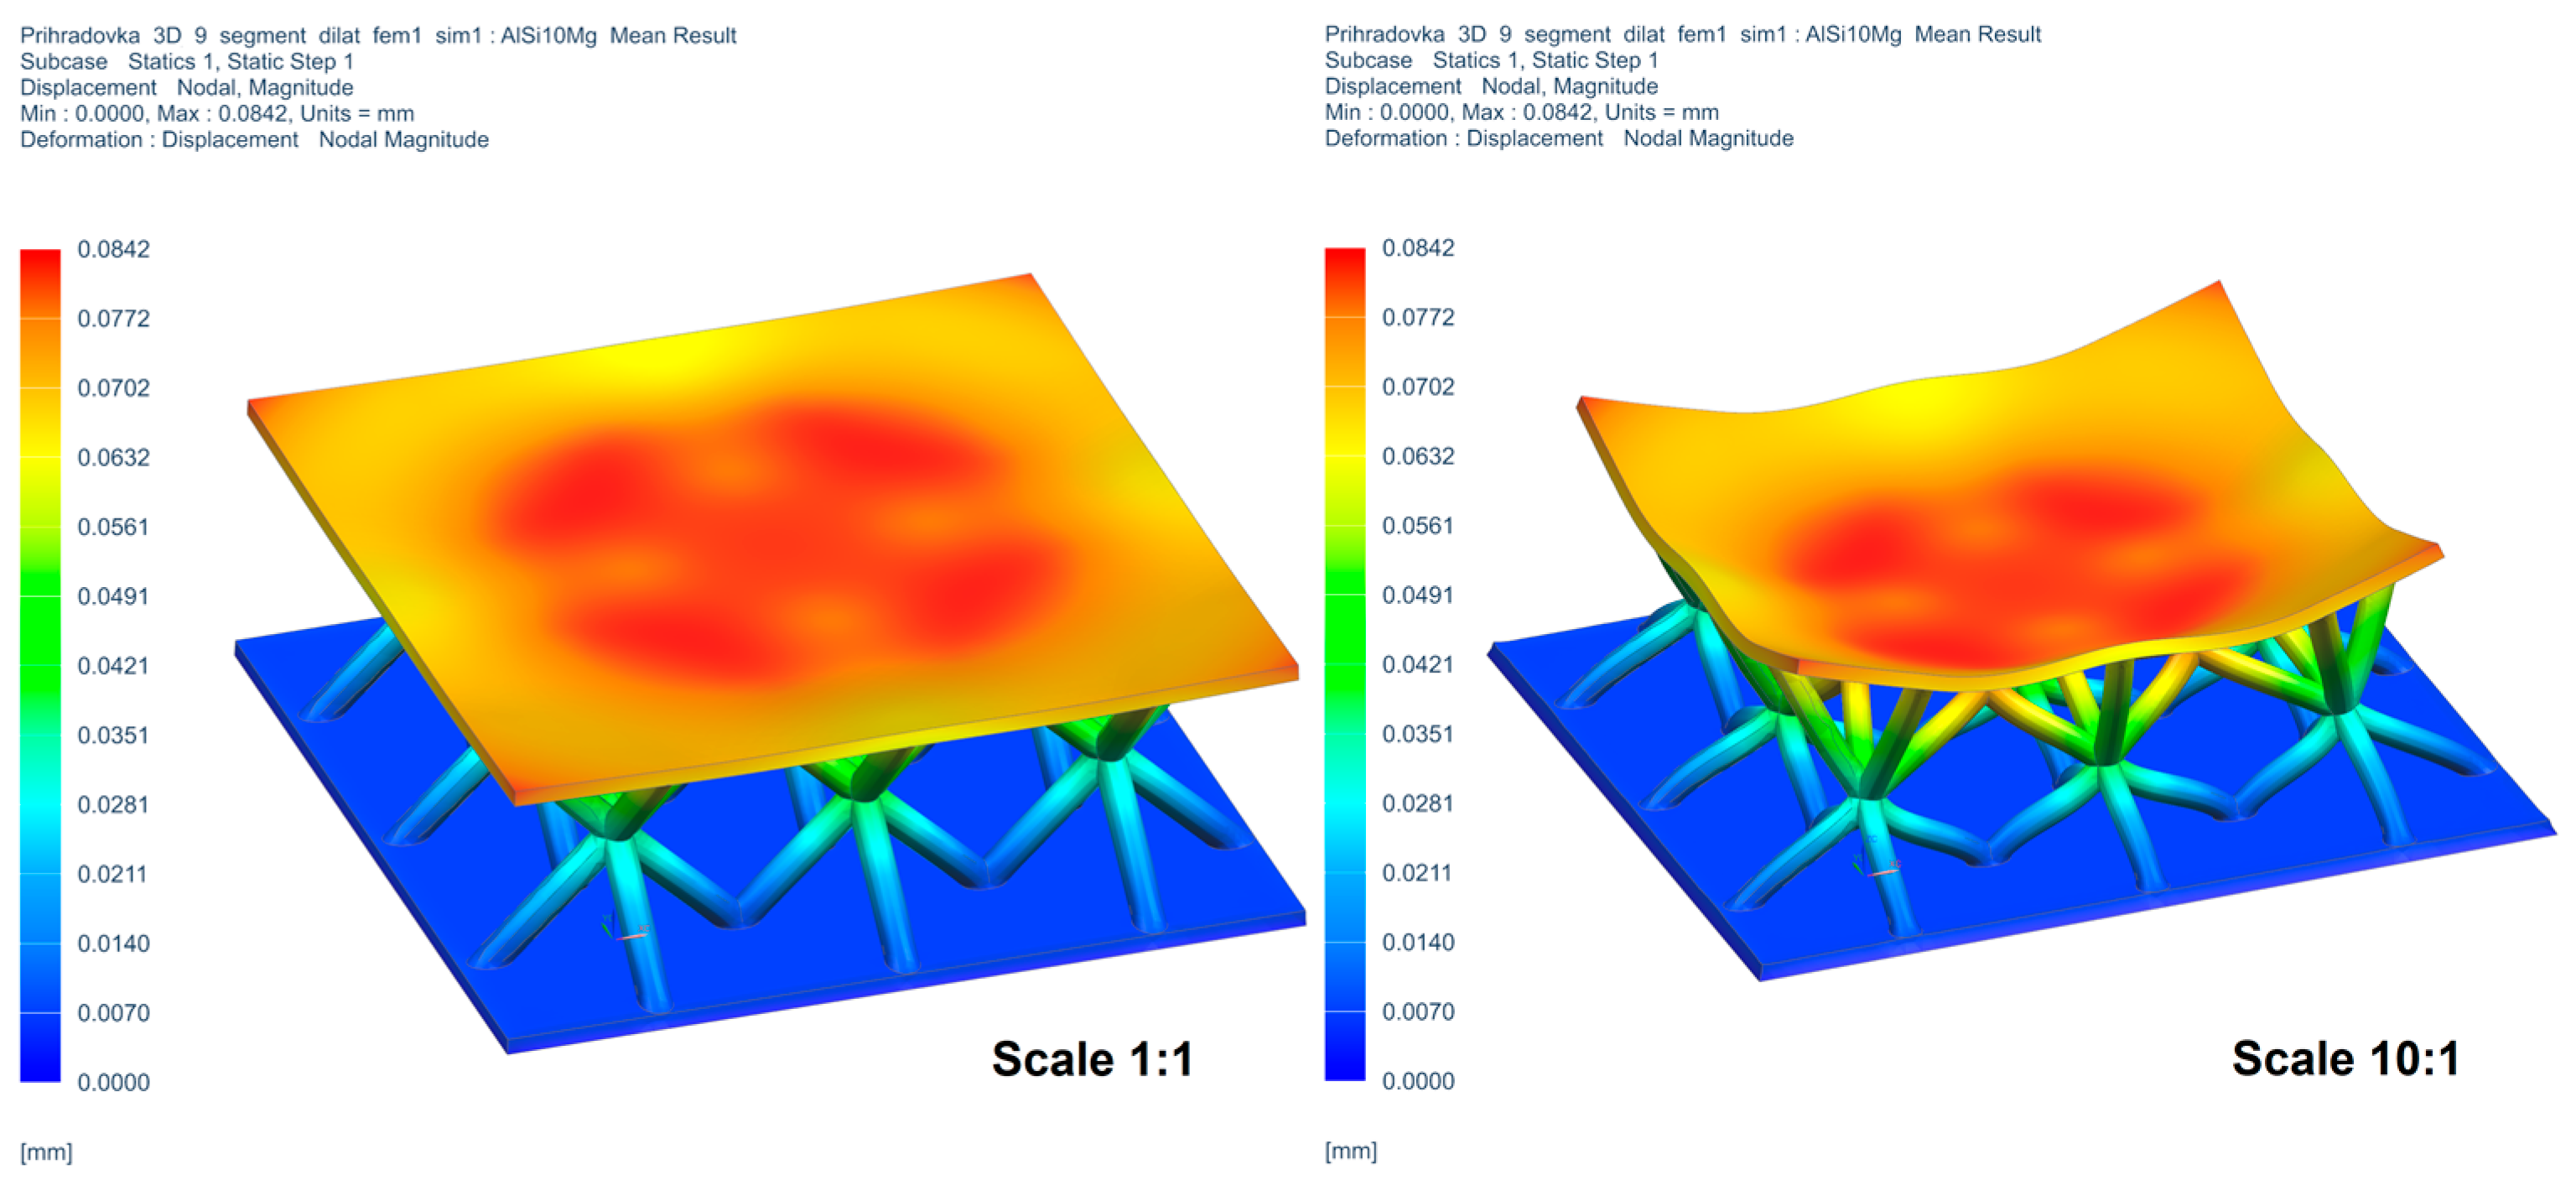
A practical application of a lattice structure made by the PBF-LB/M method, representing sample T0, is shown in Figure 19 for a temperature of −60 °C and Figure 20 for a temperature of +60 °C. The simulation shows the deformation of the body at both extreme temperatures, −60 °C and +60 °C. All topologies are represented by the main directions of significant structural geometry elements. Given the insignificant differences in the thermal expansion coefficient for individual topologies, the mean value is determined by the average of all topologies, according to Table 8. The practical significance is mainly in assessing the influence of thermal expansion when using complexly shaped bodies. Complex shapes in one unit are characteristic of components produced by additive technologies. In the case of a requirement for precise products, when the characteristic of a specific printing topology is significant, achieving the required accuracy or known deformation during the component’s function in a wide temperature range with a suitable orientation in the printing area is possible. The difference factor from the declared values is significant when refinement based on measurement results, implemented in calculation models, reduces the risk of errors in designing components for specific use [50,51].
4. Discussion
The resulting values of the measured thermal expansion coefficient show insignificant differences according to individual topologies. For the design practice of usual components functionally working in a normal temperature environment, both internal and external, the differences are not significant even from a metrological point of view, for example, for determining the uncertainties of control measurement of products with usual accuracy. The meaning can already be apparent when the material is used, for example, for precise products of instruments and measuring devices operating in a wide temperature range. The mentioned categories of products are often specific precisely because of their shape complexity, small dimensions, and high demands on dimensional and shape accuracy. The temperature influence can already be significant at that time, or it can indicate a trend of deformation and thus a chain of inaccuracies, especially in the case of structural assemblies. Table 7 below is a proportional difference interpretation of the measured values of the individual topologies concerning the reference cast material and the declared values of the 3D printed material. Table 9 shows the relative differences between all measured and declared values in matrix form. From the matrix interpretation of the results, the most significant differences in the results of the tested materials concerning the declared values of the 3D printing method are apparent. The given interpretation of the results is essential, especially when considering using values in simulations. For example, at a deformation of 0.124 mm for material with a printing topology of 45° and a temperature of +60 °C, the difference can be 0.006 mm, which, even for a dimension of 25 mm, exceeds the tolerance according to ISO 286-1 [52], accuracy level 4. The mentioned factor must be considered in precise, thermally affected components.
The application of additive technology using the PBF-LB/M method for components made of AlSi10Mg significantly takes into account mechanical characteristics, predominantly tensile and torsional strength, showing a more significant dependence of strengths and respective deformations for individual printing topologies, which are better in the static or quasi-static area than the starting cast material. On the contrary, additively manufactured components show worse characteristics regarding fracture crack propagation in the cyclic region [53]. The use of additive technologies is not advantageous for cyclically loaded components; however, considering production aspects, components manufactured with additive PBF-LB/M technology are suitable for statically loaded parts in terms of bearing stresses and deformations. In aircraft and space technology structures where there are specific wide temperature ranges, the use of AlSi10Mg material for elements carrying significant loads is not suitable. For elements of precision mechanics, mechatronics, and instrumentation where significantly loaded components are not frequent, dimensional changes due to dilation can be considered under certain circumstances. Especially in instrumentation, it can be due to expansion or contraction. Especially in the case of instrumentation, changes in metrological characteristics may occur as a result of expansion or contraction. The tested material is generally considered non-strength in the structures of structural solutions. The strength characteristics are not addressed, as stated, for example, in [23]. However, the statically indeterminate position of a separate unit or part of a structural solution leads to deformation stress due to thermal expansion. Knowing the thermal expansion coefficient is essential for accurately determining internal stress [54].
5. Conclusions
Additive technologies using the PBF-LB/M method create new internal structures for materials. The result is specific behavior within selected technical applications. The wide temperature range, a characteristic especially for aviation and space technologies, places demand not only on the mechanical strength characteristics of the components produced by the given technologies but also on their expansion characteristics. The main variable factor is the printing topology. Additively produced components have low technological requirements to achieve surface shapes of various complexity. Dilation characteristics depending on the printing topology are an essential factor in the design of the design solution and technical preparation for the production of additively manufactured components with high demands on accuracy in a temperature-variable environment. The research results, published in the presented text, describe the relationship between the internal structure of additively manufactured materials and the dilation characteristics depending on the printing topology. AlSi10Mg material is often applied to less mechanically stressed parts. The importance of its use based on established and verified characteristics is a way to increase the efficiency of construction, technical preparation of production, and behavior within the application deployment framework.
Author Contributions
Conceptualization, K.D.; methodology, K.D. and J.D.; validation, L.Z.; formal analysis, K.D., D.M., L.Z. and R.S.; investigation, K.D., J.D. and L.Z.; resources, J.D. and L.Z.; data curation, K.D.; writing—original draft preparation, K.D.; writing—review and editing, J.D. and L.Z.; visualization, K.D., R.S. and D.M.; supervision, K.D.; project administration, K.D. All authors have read and agreed to the published version of the manuscript.
Funding
This research was supported by the College of Polytechnics Jihlava, under Grant No. INT/2023/0007, “Research on dilation characteristics of 3D-DMLS-printed products”, and by the Czech Academy of Sciences, Institute of Theoretical and Applied Mechanics (RVO 68378297).
Data Availability Statement
Data is contained within this article.
Conflicts of Interest
The authors declare no conflict of interest. The funders had no role in the design of the study, in the collection, analysis, or interpretation of data, in the writing of the manuscript, or in the decision to publish the results.
References
- Abdollahi, A.; Ansari, Z.; Akrami, M.; Haririan, I.; Dashti-Khavidaki, S.; Irani, M.; Kamankesh, M.; Ghobadi, E. Additive Manufacturing of an Extended-Release Tablet of Tacrolimus. Materials 2023, 16, 4927. [Google Scholar] [CrossRef]
- Gumbleton, R.; Cuenca, J.A.; Klemencic, G.M.; Jones, N.; Porch, A. Evaluating the coefficient of thermal expansion of additive manufactured AlSi10Mg using microwave techniques. Addit. Manuf. 2019, 30, 100841. [Google Scholar] [CrossRef]
- Patuelli, C.; Cestino, E.; Frulla, G.; Valente, F.; Servetti, G.; Esposito, F.; Barbero, L. FEM Simulation of AlSi10Mg Artifact for Additive Manufacturing Process Calibration with Industrial-Computed Tomography Validation. Materials 2023, 16, 4754. [Google Scholar] [CrossRef] [PubMed]
- Salmi, M. Additive Manufacturing Processes in Medical Applications. Materials 2021, 14, 191. [Google Scholar] [CrossRef] [PubMed]
- Bikas, H.; Stavropoulos, P.; Chryssolouris, G. Additive manufacturing methods and modelling approaches: A critical review. Int. J. Adv. Manuf. Technol. 2016, 83, 389–405. [Google Scholar] [CrossRef]
- Suh, Y.J.; Lim, T.H.; Choi, H.S.; Kim, M.S.; Lee, S.J.; Kim, S.H.; Park, C.H. 3D Printing and NIR Fluorescence Imaging Techniques for the Fabrication of Implants. Materials 2020, 13, 4819. [Google Scholar] [CrossRef]
- Głowacki, M.; Mazurkiewicz, A.; Słomion, M.; Skórczewska, K. Resistance of 3D-Printed Components, Test Specimens and Products to Work under Environmental Conditions—Review. Materials 2022, 15, 6162. [Google Scholar] [CrossRef] [PubMed]
- Diniță, A.; Neacșa, A.; Portoacă, A.I.; Tănase, M.; Ilinca, C.N.; Ramadan, I.N. Additive Manufacturing Post-Processing Treatments, a Review with Emphasis on Mechanical Characteristics. Materials 2023, 16, 4610. [Google Scholar] [CrossRef]
- Simchi, A.; Petzoldt, F.; Pohl, H. On the development of direct metal laser sintering for rapid tooling. J. Mater. Process. Technol. 2003, 141, 319–328. [Google Scholar] [CrossRef]
- Carpenter, K.; Tabei, A. On Residual Stress Development, Prevention, and Compensation in Metal Additive Manufacturing. Materials 2020, 13, 255. [Google Scholar] [CrossRef]
- Revilla, R.I.; Verkens, D.; Rubben, T.; De Graeve, I. Corrosion and Corrosion Protection of Additively Manufactured Aluminium Alloys—A Critical Review. Materials 2020, 13, 4804. [Google Scholar] [CrossRef]
- Liu, D.; Lee, B.; Babkin, A.; Chang, Y. Research Progress of Arc Additive Manufacture Technology. Materials 2021, 14, 1415. [Google Scholar] [CrossRef]
- Deja, M.; Zieliński, D.; Kadir, A.; Humaira, S. Applications of Additively Manufactured Tools in Abrasive Machining—A Literature Review. Materials 2021, 14, 1318. [Google Scholar] [CrossRef] [PubMed]
- Sola, A.; Sai, Y.; Trinchi, A.; Chu, C.; Shen, S.; Chen, S. How Can We Provide Additively Manufactured Parts with a Fingerprint? A Review of Tagging Strategies in Additive Manufacturing. Materials 2021, 15, 85. [Google Scholar] [CrossRef] [PubMed]
- Achillas, C.; Aidonis, D.; Iakovou, E.; Thymianidis, M.; Tzetzis, D. A methodological framework for the inclusion of modern additive manufacturing into the production portfolio of a focused factory. J. Manuf. Syst. 2015, 37, 328–339. [Google Scholar] [CrossRef]
- Contaldi, V.; Del Re, F.; Palumbo, B.; Squillace, A.; Corrado, P.; Di Petta, P. Mechanical characterisation of stainless steel parts produced by direct metal laser sintering with virgin and reused powder. Int. J. Adv. Manuf. Technol. 2019, 105, 3337–3351. [Google Scholar] [CrossRef]
- Grünberger, T.; Domröse, R. Direct Metal Laser Sintering. Laser Tech. J. 2015, 12, 45–48. [Google Scholar] [CrossRef]
- Aly, H.A.; Seleman, M.M.E.-S.; Bakkar, A.; Albaijan, I.; Ahmed, M.M.Z.; Ibrahim, K.M. Effect of Si Content on the Thermal Expansion of Ti15Mo(0–2 Si) Biomaterial Alloys during Different Heating Rates. Materials 2023, 16, 4768. [Google Scholar] [CrossRef]
- Evstifeev, A.; Volosevich, D.; Smirnov, I.; Yakupov, B.; Voropaev, A.; Vitokhin, E.; Klimova-Korsmik, O. Comparative Study of the Relationship between Microstructure and Mechanical Properties of Aluminum Alloy 5056 Fabricated by Additive Manufacturing and Rolling Techniques. Materials 2023, 16, 4327. [Google Scholar] [CrossRef]
- Bartosiak, R.; Kaźmierczyk, F.; Czapski, P. The Influence of Filament Orientation on Tensile Stiffness in 3D Printed Structures—Numerical and Experimental Studies. Materials 2023, 16, 5391. [Google Scholar] [CrossRef]
- Yang, K.K.; Zhu, J.H.; Wang, C.; Jia, D.S.; Song, L.L.; Zhang, W.H. Experimental validation of 3D printed material behaviors and their influence on the structural topology design. Comput. Mech. 2018, 61, 581–598. [Google Scholar] [CrossRef]
- Dvorakova, J.; Dvorak, K. Topological Optimization of a Component Made by the FDM Method. Int. J. Mech. Eng. Robot. Res. 2021, 10, 67–71. [Google Scholar] [CrossRef]
- Dvorak, K.; Dvorakova, J.; Zarybnicka, L.; Horak, Z. Influence of 3D Printing Topology by DMLS Method on Crack Propagation. Materials 2021, 14, 7483. [Google Scholar] [CrossRef]
- Alsalla, H.H.; Smith, C.; Hao, L. The effect of different build orientations on the consolidation, tensile and fracture toughness properties of direct metal laser sintering Ti-6Al-4V. Rapid Prototyp. J. 2018, 24, 276–284. [Google Scholar] [CrossRef]
- Lewandowski, J.J.; Seifi, M. Metal Additive Manufacturing: A Review of Mechanical Properties. Annu. Rev. Mater. Res. 2016, 46, 151–186. [Google Scholar] [CrossRef]
- Razavykia, A.; Brusa, E.; Delprete, C.; Yavari, R. An Overview of Additive Manufacturing Technologies—A Review to Technical Synthesis in Numerical Study of Selective Laser Melting. Materials 2020, 13, 3895. [Google Scholar] [CrossRef] [PubMed]
- Wichniarek, R. Special Issue: Bioactive Materials for Additive Manufacturing. Materials 2023, 16, 6129. [Google Scholar] [CrossRef]
- Sedlacek, F.; Kalina, T.; Stepanek, M. Optimization of Components with Topology Optimization for Direct Additive Manufacturing by DLMS. Materials 2023, 16, 5422. [Google Scholar] [CrossRef] [PubMed]
- Jeong, C.-Y. High Temperature Mechanical Properties of Al–Si–Mg–(Cu) Alloys for Automotive Cylinder Heads. Mater. Trans. 2013, 54, 588–594. [Google Scholar] [CrossRef]
- Fousová, M.; Dvorský, D.; Michalcová, A.; Vojtěch, D. Changes in the microstructure and mechanical properties of additively manufactured AlSi10Mg alloy after exposure to elevated temperatures. Mater. Charact. 2018, 137, 119–126. [Google Scholar] [CrossRef]
- Fan, K.; Liu, X.; He, G.; Chen, H. Elevated temperature low cycle fatigue of a gravity casting Al–Si–Cu alloy used for engine cylinder heads. Mater. Sci. Eng. A 2015, 632, 127–136. [Google Scholar] [CrossRef]
- Yang, P.; Deibler, L.A.; Bradley, D.R.; Stefan, D.K.; Carroll, J.D. Microstructure evolution and thermal properties of an additively manufactured, solution treatable AlSi10Mg part. J. Mater. Res. 2018, 33, 4040–4052. [Google Scholar] [CrossRef]
- Ferguson, J.; Lopez, H.F.; Cho, K.; Kim, C.-S. Temperature Effects on the Tensile Properties of Precipitation-Hardened Al-Mg-Cu-Si Alloys. Metals 2016, 6, 43. [Google Scholar] [CrossRef]
- Maamoun, A.H.; Xue, Y.F.; Elbestawi, M.A.; Veldhuis, S.C. The Effect of Selective Laser Melting Process Parameters on the Microstructure and Mechanical Properties of Al6061 and AlSi10Mg Alloys. Materials 2019, 12, 12. [Google Scholar] [CrossRef] [PubMed]
- Malladi, A.; Karunakaran, K. DMLS–An insight for unproblematic production. Mater. Today Proc. 2021, 37, 1986–1990. [Google Scholar] [CrossRef]
- Muhammad, M.; Nezhadfar, P.; Thompson, S.; Saharan, A.; Phan, N.; Shamsaei, N. A comparative investigation on the microstructure and mechanical properties of additively manufactured aluminum alloys. Int. J. Fatigue 2021, 146, 106165. [Google Scholar] [CrossRef]
- Knoop, D.; Lutz, A.; Mais, B.; von Hehl, A. A Tailored AlSiMg Alloy for Laser Powder Bed Fusion. Metals 2020, 10, 514. [Google Scholar] [CrossRef]
- Zykova, A.; Martyushev, N.; Skeeba, V.; Zadkov, D.; Kuzkin, A. Influence of W Addition on Microstructure and Mechanical Properties of Al-12%Si Alloys. Materials 2019, 12, 981. [Google Scholar] [CrossRef]
- Nowak, M.; Bolzoni, L.; Babu, N.H. The effect of Nb–B inoculation on binary hypereutectic and near-eutectic LM13 Al–Si cast alloys. J. Alloy. Compd. 2015, 641, 22–29. [Google Scholar] [CrossRef]
- Bolzoni, L.; Nowak, M.; Babu, N.H. On the effect of Nb-based compounds on the microstructure of Al–12Si alloy. Mater. Chem. Phys. 2015, 162, 340–345. [Google Scholar] [CrossRef]
- Demirtaş, H.; Karakulak, E.; Babu, N.H. Understanding the effect of Ni content on microstructure and mechanical properties of A384 HPDC alloy. J. Alloy. Compd. 2022, 896, 163111. [Google Scholar] [CrossRef]
- ISO/ASTM 52900:2021; Additive Manufacturing General Principles Fundamentals and Vocabulary. ISO: Geneva, Switzerland, 2021.
- ASTM F3318-18; Standard for Additive Manufacturing–Finished Part Properties–Specification for AlSi10Mg with Powder Bed Fusion–Laser Beam. ASTM International: West Conshohocken, PA, USA, 2018.
- EN 1706:2020+A1:2022; Aluminium and Aluminium Alloys-Castings-Chemical Composition and Mechanical Properties. European Standard: Brussels, Belgium, 2020.
- Renishaw. AlSi10Mg-0403 Powder for Additive Manufacturing. Available online: https://www.renishaw.com/en/data-sheets-additive-manufacturing--17862 (accessed on 21 March 2023).
- Wang, H.; Guo, L.; Li, W.; Zhang, M.; Hong, Y.; Yang, W.; Zhang, Z. Influence of Design Parameters on Mechanical Behavior of Multi-Bolt, Countersunk C/SiC Composite Joint Structure. Materials 2023, 16, 6352. [Google Scholar] [CrossRef] [PubMed]
- Pezzato, L.; Gennari, C.; Franceschi, M.; Brunelli, K. Influence of silicon morphology on direct current plasma electrolytic oxidation process in AlSi10Mg alloy produced with laser powder bed fusion. Sci. Rep. 2022, 12, 14329. [Google Scholar] [CrossRef] [PubMed]
- Snopiński, P.; Woźniak, A.; Łukowiec, D.; Matus, K.; Tański, T.; Rusz, S.; Hilšer, O. Evolution of Microstructure, Texture and Corrosion Properties of Additively Manufactured AlSi10Mg Alloy Subjected to Equal Channel Angular Pressing (ECAP). Symmetry 2022, 14, 674. [Google Scholar] [CrossRef]
- Dedry, O.; Bouffioux, C.; Tran, H.S.; Macías, J.G.S.; Habraken, A.M.; Mertens, A. Identification of AlSi10Mg matrix behavior by nanoindentation. In ESAFORM 2021; PoPuPs: Liège, Belgium, 2021. [Google Scholar] [CrossRef]
- Tantideeravit, S.; Kamaya, M. An application of FEM in the determination of tensile properties for work-hardened carbon steel by means of small punch test. Results Mater. 2020, 8, 100142. [Google Scholar] [CrossRef]
- Rahmati, S.; Vahabli, E. Evaluation of analytical modeling for improvement of surface roughness of FDM test part using measurement results. Int. J. Adv. Manuf. Technol. 2015, 79, 823–829. [Google Scholar] [CrossRef]
- ISO 286-1:2010; Geometrical Product Specifications (GPS) ISO Code System for Tolerances on Linear Sizes Part 1: Basis of Tolerances, Deviations and Fits. ISO: Geneva, Switzerland, 2021.
- Becker, T.H.; Kumar, P.; Ramamurty, U. Fracture and fatigue in additively manufactured metals. Acta Mater. 2021, 219, 117240. [Google Scholar] [CrossRef]
- Tabatabaeian, A.; Ghasemi, A.R.; Shokrieh, M.M.; Marzbanrad, B.; Baraheni, M.; Fotouhi, M. Residual Stress in Engineering Materials: A Review. Adv. Eng. Mater. 2021, 24, 2100786. [Google Scholar] [CrossRef]
Figure 1.
Sketch of print orientations of test samples.

Figure 2.
Sample parameters.

Figure 3.
Measuring system with a temperature chamber.

Figure 4.
Graph of the load function used during the test.

Figure 5.
XRD patterns for type B samples.

Figure 6.
Observation of samples after chemical treatment by a digital optical microscope.

Figure 7.
Examples of indent from nanoindentation measurement.

Figure 8.
Direction of temperature change for all measurements.

Figure 9.
Course of dilation in the measured temperature range, sample T0.

Figure 10.
Course of dilation in the measured temperature range, sample T45.

Figure 11.
Course of dilation in the measured temperature range, sample T90.

Figure 12.
The course of dilation in the measured temperature range, sample cast.

Figure 13.
Comparison of all trends in one chart.

Figure 14.
Computational CAE model of the measured length segment of declared PBF-LB/M material.

Figure 15.
Computational CAE model of the measured length segment of T0.

Figure 16.
Computational CAE model of the measured length segment of T45.

Figure 17.
Computational CAE model of the measured length segment of T90.

Figure 18.
Computational CAE model of the measured length segment of the sample cast.

Figure 19.
An example of applying expansion characteristics to a complex model at a temperature of +60 °C. Deformation scale: 10:1.
Figure 19.
An example of applying expansion characteristics to a complex model at a temperature of +60 °C. Deformation scale: 10:1.

Figure 20.
An example of applying expansion characteristics to a complex model at a temperature of −60 °C. Deformation scale: 10:1.
Figure 20.
An example of applying expansion characteristics to a complex model at a temperature of −60 °C. Deformation scale: 10:1.


Table 1.
Initial general material characteristics, declared by the sample production method [45].
Table 1.
Initial general material characteristics, declared by the sample production method [45].
| Parameters | Values |
|---|---|
| Density | 2.68 g/cm3 |
| Thermal conductivity | 30–190 W/mK |
| Melting range | 570–590 °C |
| Tensile strength (XY) | 442 ± 6 MPa |
| Tensile strength (Z) | 417 ± 27 MPa |
| Thermal expansion coefficient, declared 0–100 °C | 20.10−6 K−1 (°C−1) |
Table 2.
Declared technological production characteristics for PBF-LB/M print using Renishaw AM400 equipment [25].
Table 2.
Declared technological production characteristics for PBF-LB/M print using Renishaw AM400 equipment [25].
| Parameters | Values |
|---|---|
| Production speed | 5–20 cm3/h |
| Scanning speed | max. 2000 mm/s |
| Positioning speed | 7000 mm/s |
| Layer thickness | 20–100 μm |
| Laser power | 400 W |
Table 3.
Technological production characteristics for PBF-LB/M print used for 3D print of specimens, data from [25].
Table 3.
Technological production characteristics for PBF-LB/M print used for 3D print of specimens, data from [25].
| Parameters | Values |
|---|---|
| Production speed | 10 cm3/h |
| Layer thickness | 60 μm |
| Laser power | 400 W |
Table 4.
Results from microstructure observation.
| Sample | Min Diameter (μm) | Max Diameter (μm) | Perimeter (μm) |
|---|---|---|---|
| T0_A | 43 ± 107 | 96 ± 200 | 856 ± 156 |
| T45_A | 102 ± 283 | 172 ± 472 | 1583 ± 967 |
| T90_A | 42 ± 137 | 90 ± 224 | 797 ± 234 |
| Cast_A | 43 ± 146 | 77 ± 243 | 747 ± 480 |
Table 5.
Results from nanoindentation measurement.
| Sample | Young Modul (GPa) | Hardness (GPa) |
|---|---|---|
| T0_A | 103.87 ± 16.97 | 2.68 ± 0.48 |
| T45_A | 85.60 ± 10.54 | 2.03 ± 0.41 |
| T90_A | 75.71 ± 6.10 | 1.80 ± 0.19 |
| Cast_A | 88.63 ± 17.11 | 2.21 ± 0.21 |
| T0_B | 70.12 ± 6.85 | 1.74 ± 0.35 |
| T45_B | 80.07 ± 4.86 | 1.79 ± 0.16 |
| T90_B | 77.48 ± 5.89 | 1.99 ± 0.23 |
| Cast_B | 81.22 ± 12.31 | 1.79 ± 1.17 |
Table 6.
Results of dilation characteristics.
| Samples | Type | Negative Deformation −60 °C (%) | Maximal Deformation +60 °C (%) |
|---|---|---|---|
| T0 | 0° | −0.120 ± 0.02 | 0.078 ± 0.01 |
| T45 | 45° | −0.109 ± 0.01 | 0.086 ± 0.01 |
| T90 | 90° | −0.124 ± 0.02 | 0.075 ± 0.01 |
| Cast | A sample from a cast blank | −0.123 ± 0.01 | 0.070 ± 0.01 |
Table 7.
Results of the thermal expansion coefficient for all types of samples.
| Samples | Type | Thermal Expansion Coefficient −60/+60 (K−1) |
|---|---|---|
| T0 | 0° | 0.000198 |
| T45 | 45° | 0.000199 |
| T90 | 90° | 0.000195 |
| The mean value of all topologies | 0°–90°–45° | 0.000197 |
| Cast | Cast blank | 0.000193 |
Table 8.
Relative deviation of the measured values of individual topologies from the cast and declared thermal expansion coefficient.
Table 8.
Relative deviation of the measured values of individual topologies from the cast and declared thermal expansion coefficient.
| Samples | Cast | Declared |
|---|---|---|
| T0 | 2.59% | 3.41% |
| T45 | 1.04% | 4.88% |
| T90 | 3.11% | 2.93% |
Table 9.
The relative deviation of the measured values of individual topologies from each other is represented by a matrix.
Table 9.
The relative deviation of the measured values of individual topologies from each other is represented by a matrix.
| Samples | T0 | T45 | T90 | Cast | Declared |
|---|---|---|---|---|---|
| T0 | 0.00% | 1.54% | 0.50% | 2.59% | 3.41% |
| T45 | 1.54% | 0.00% | 2.05% | 1.04% | 5.13% |
| T90 | 0.50% | 2.05% | 0.00% | 3.02% | 2.93% |
| Cast | 2.59% | 1.04% | 3.02% | 0.00% | 6.22% |
| Declared | 3.41% | 5.13% | 2.93% | 6.22% | 0.00% |
Disclaimer/Publisher’s Note: The statements, opinions and data contained in all publications are solely those of the individual author(s) and contributor(s) and not of MDPI and/or the editor(s). MDPI and/or the editor(s) disclaim responsibility for any injury to people or property resulting from any ideas, methods, instructions or products referred to in the content. |
© 2023 by the authors. Licensee MDPI, Basel, Switzerland. This article is an open access article distributed under the terms and conditions of the Creative Commons Attribution (CC BY) license (https://creativecommons.org/licenses/by/4.0/).
Share and Cite
MDPI and ACS Style
Dvorak, K.; Dvorakova, J.; Majtas, D.; Sevcik, R.; Zarybnicka, L. Dilation Characteristics of 3D PBF-LB/M AlSi10Mg Alloy. Metals 2023, 13, 1961. https://doi.org/10.3390/met13121961
AMA Style
Dvorak K, Dvorakova J, Majtas D, Sevcik R, Zarybnicka L. Dilation Characteristics of 3D PBF-LB/M AlSi10Mg Alloy. Metals. 2023; 13(12):1961. https://doi.org/10.3390/met13121961
Chicago/Turabian StyleDvorak, Karel, Jana Dvorakova, Dusan Majtas, Radek Sevcik, and Lucie Zarybnicka. 2023. "Dilation Characteristics of 3D PBF-LB/M AlSi10Mg Alloy" Metals 13, no. 12: 1961. https://doi.org/10.3390/met13121961
Note that from the first issue of 2016, this journal uses article numbers instead of page numbers. See further details here.