
Microstructure and Mechanical Properties of Laser Additive Manufactured H13 Tool Steel

 , , ,
, , ,  ,
,
Abstract
:1. Introduction
2. Materials and Methods
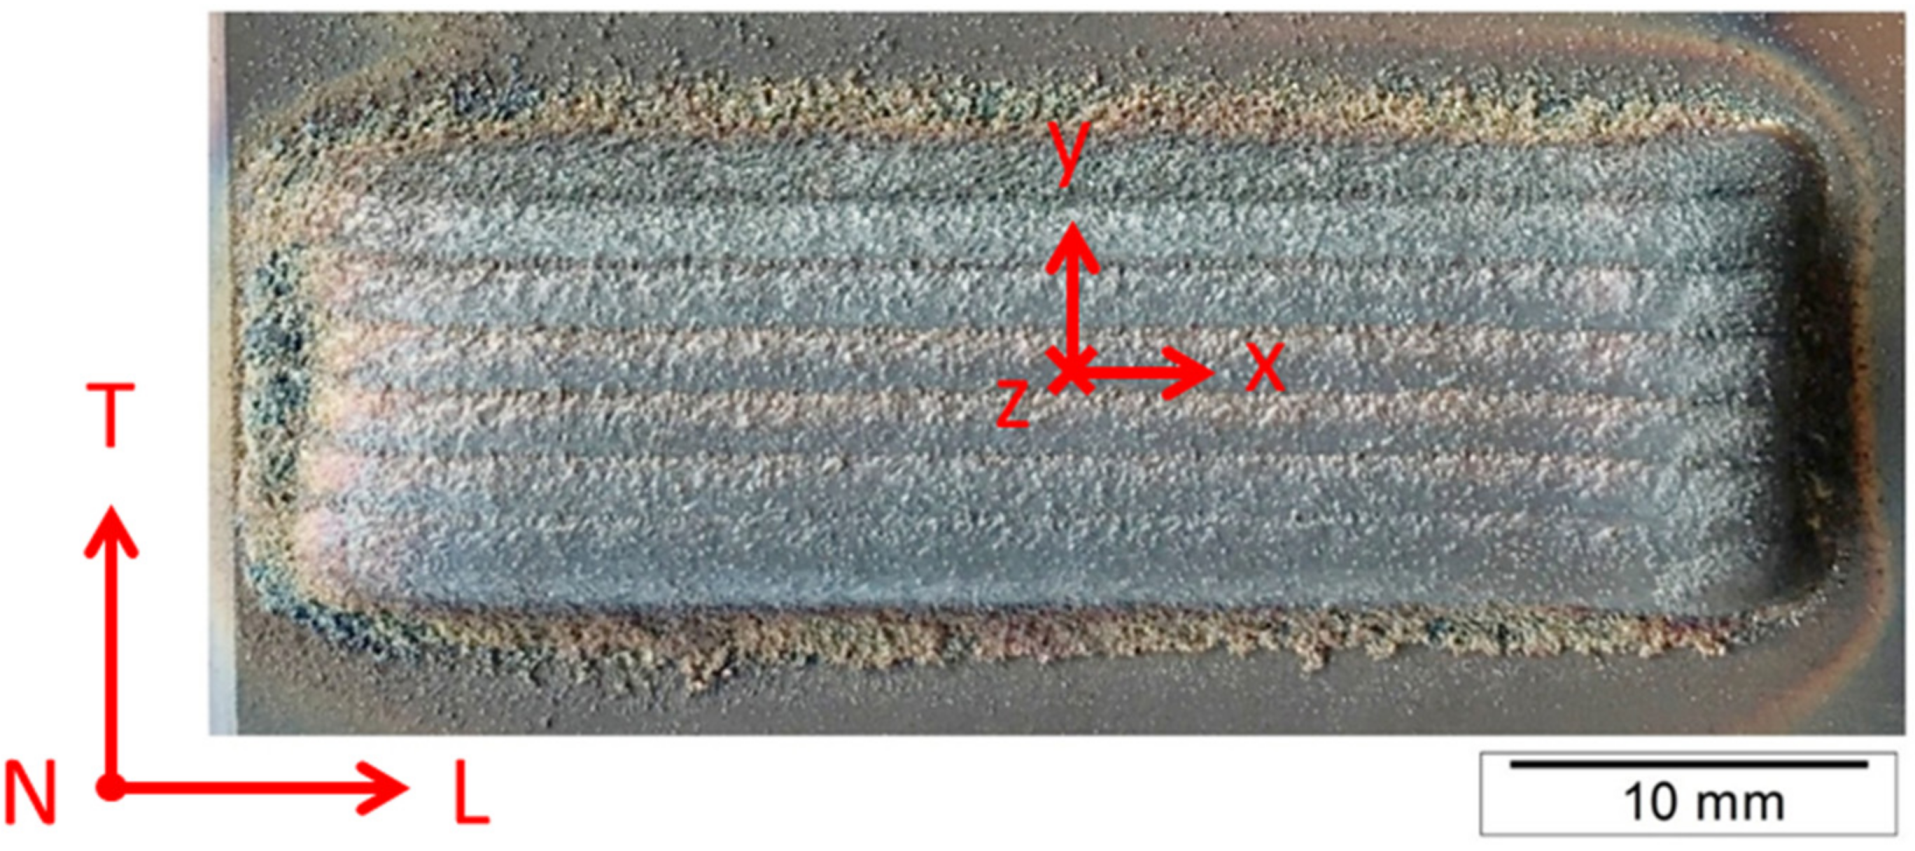
2.1. Metallography
2.2. Hardness Tests
2.3. Microstructure
2.4. Residual Stresses Analyses
2.5. Tensile Testing
2.6. Wear Resistance Testing
3. Results and Discussion
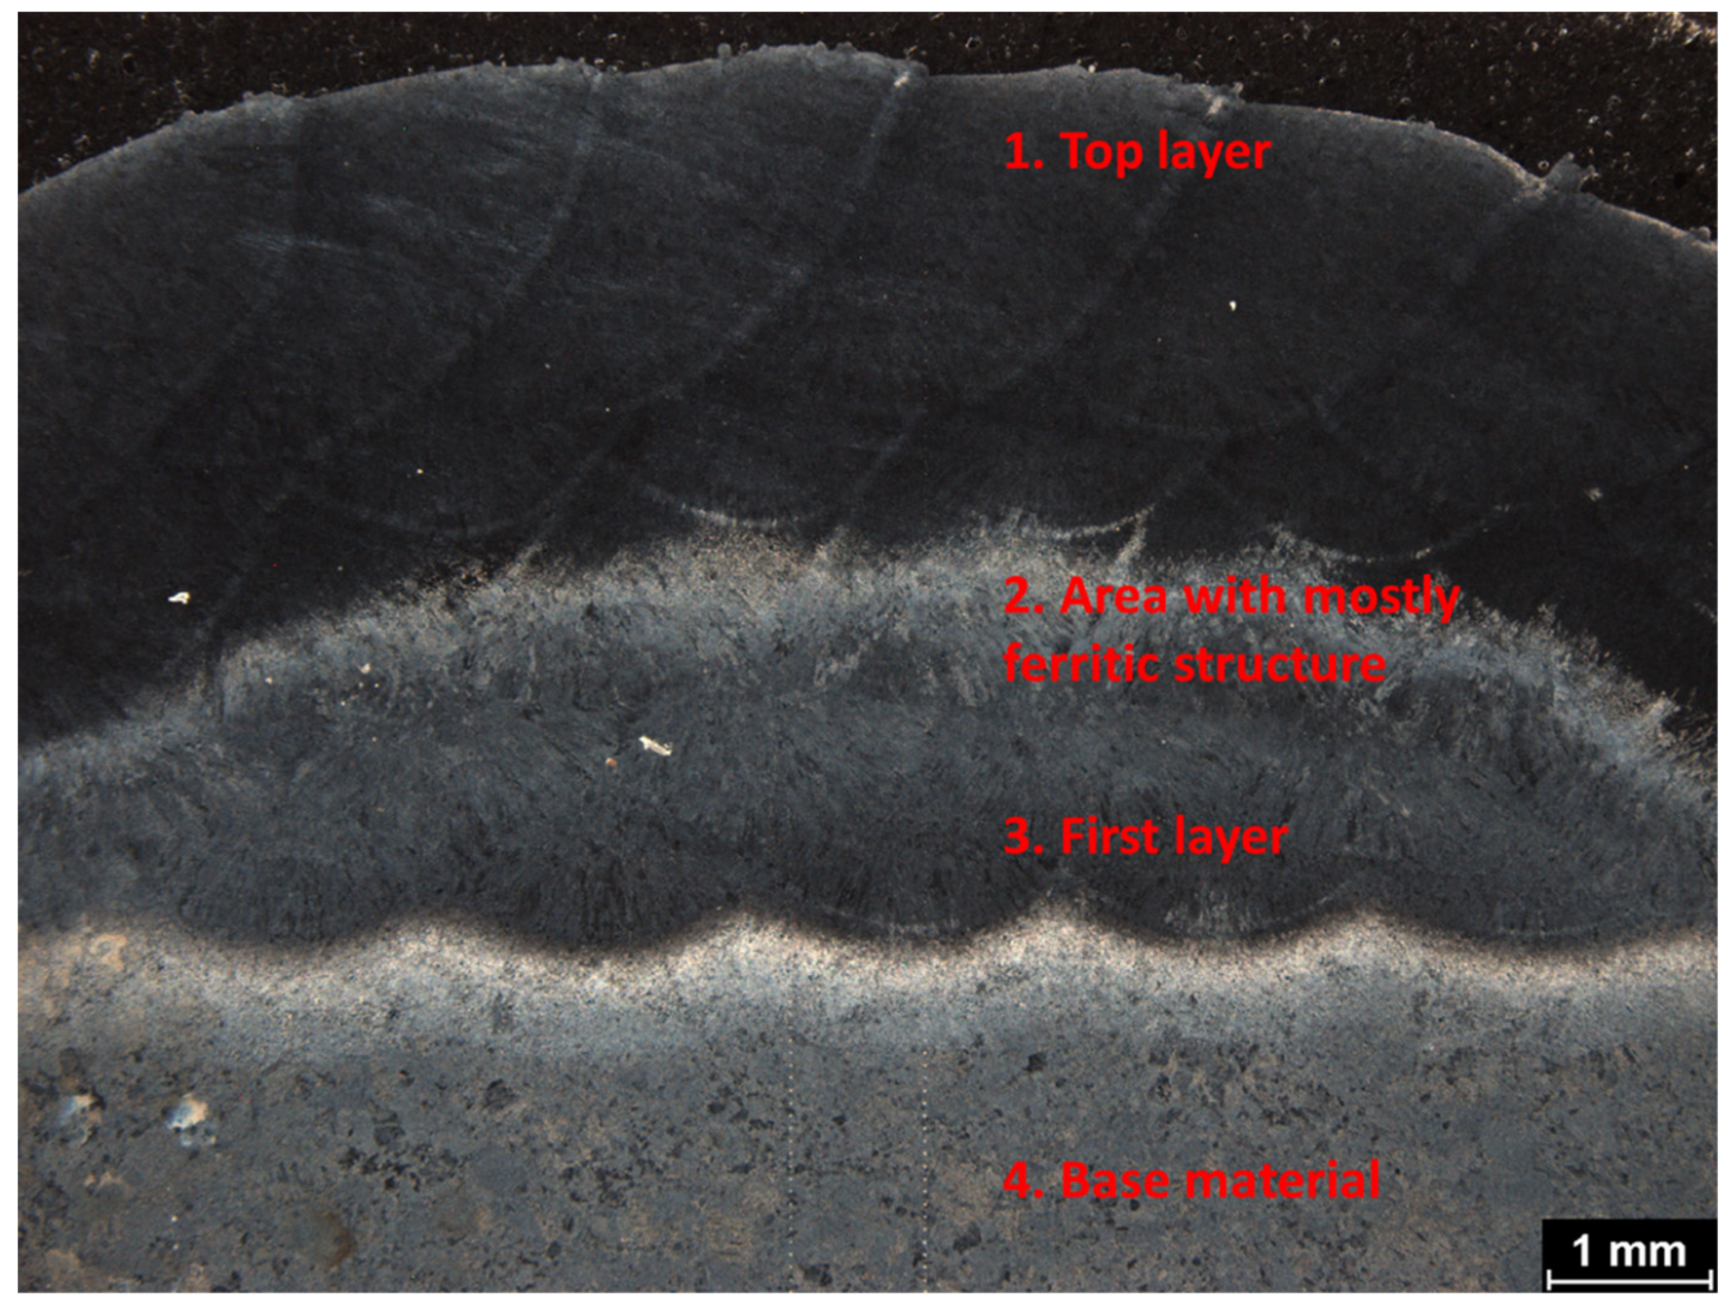
3.1. Metallography
3.2. Hardness
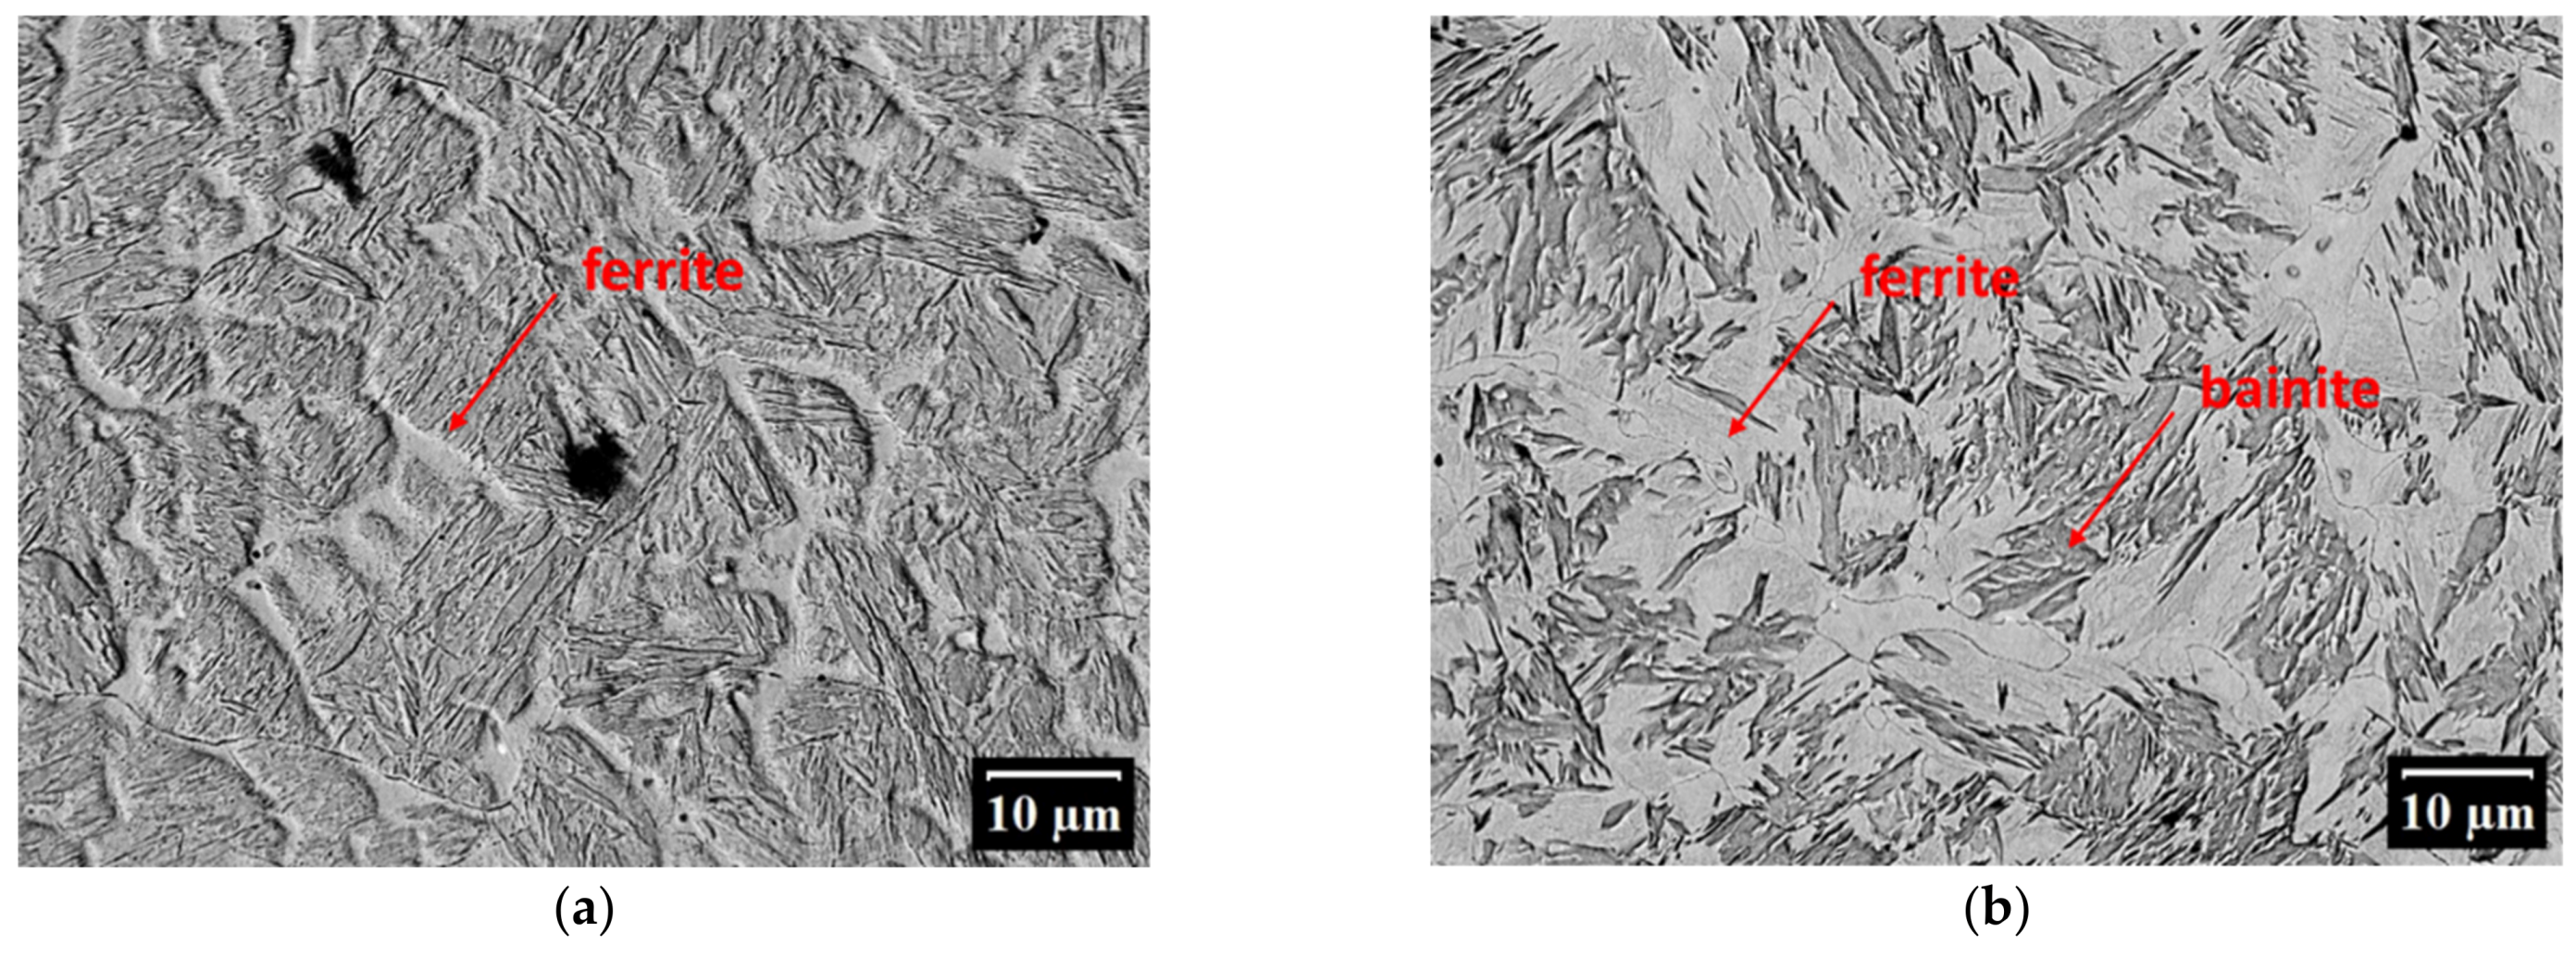
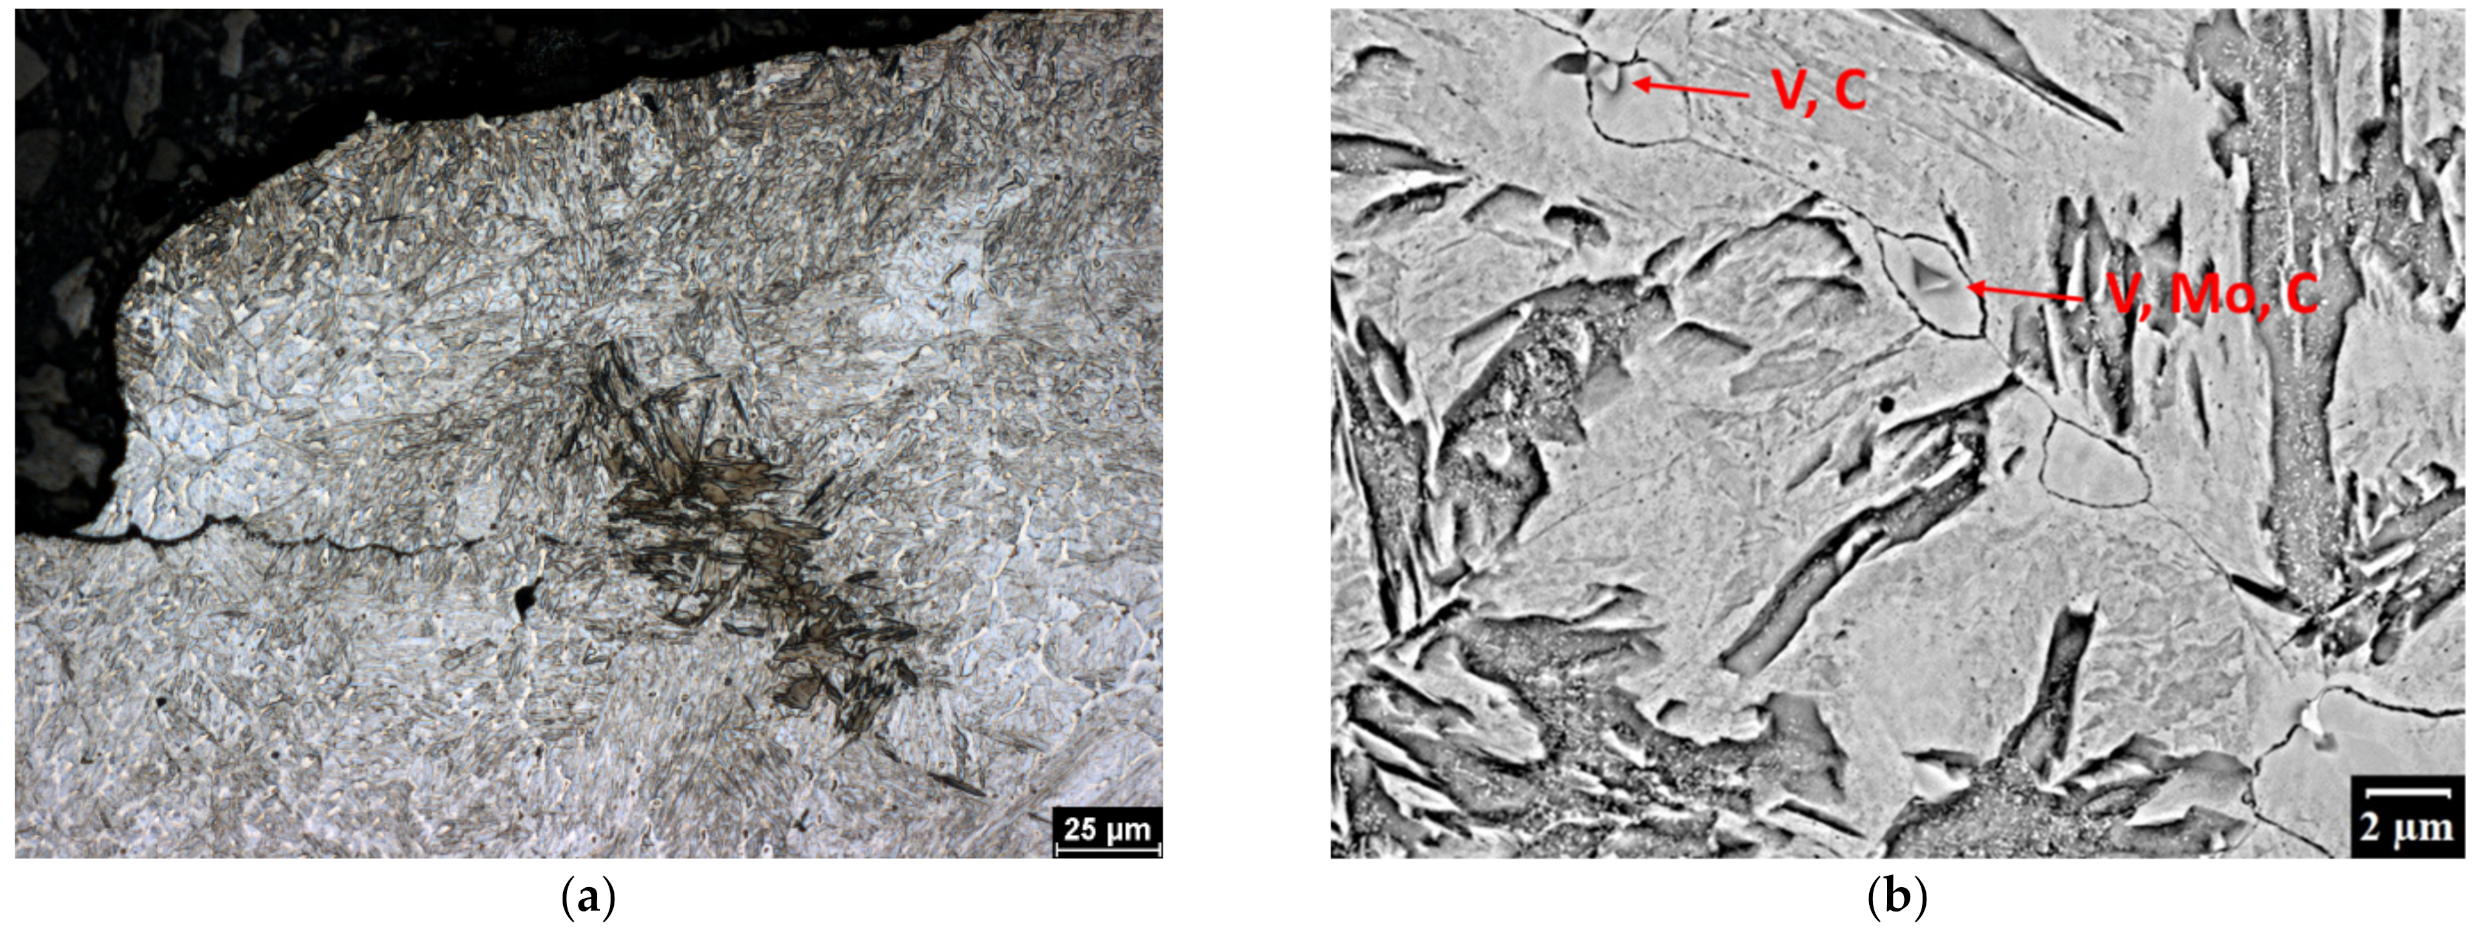
3.3. Microstructure
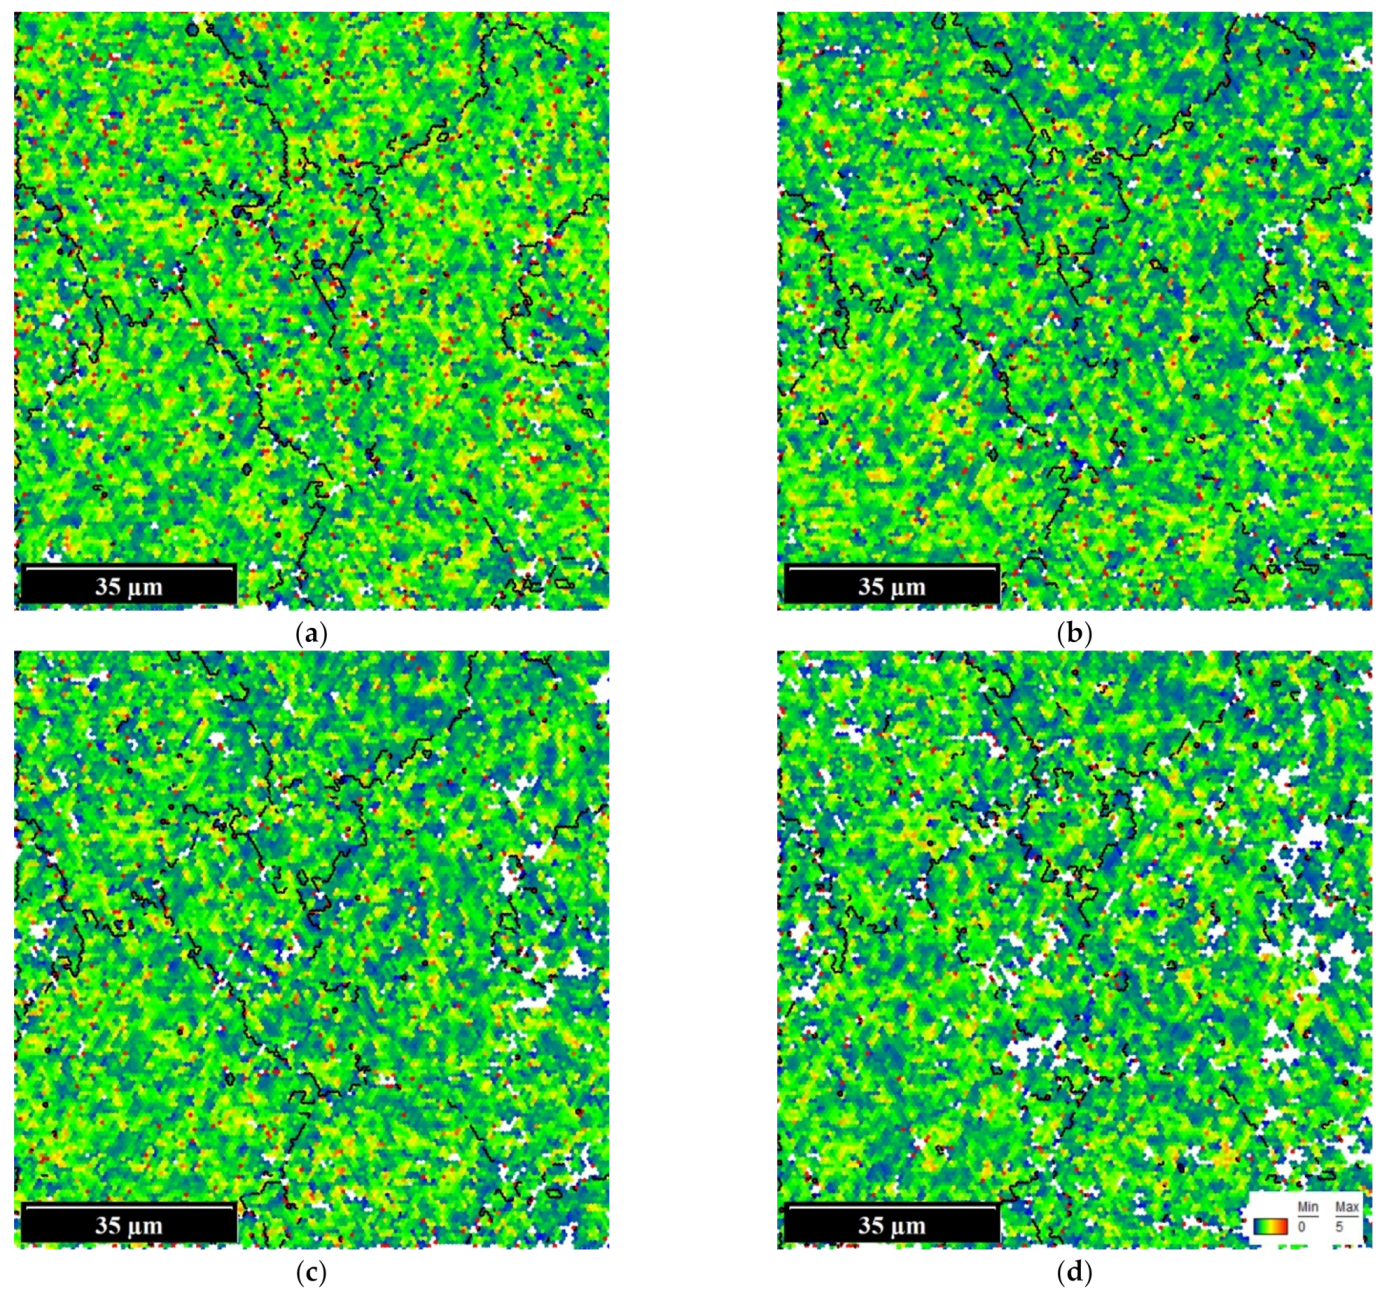
3.3.1. Electron Diffraction
3.3.2. X-ray Diffraction
3.4. Residual Stresses
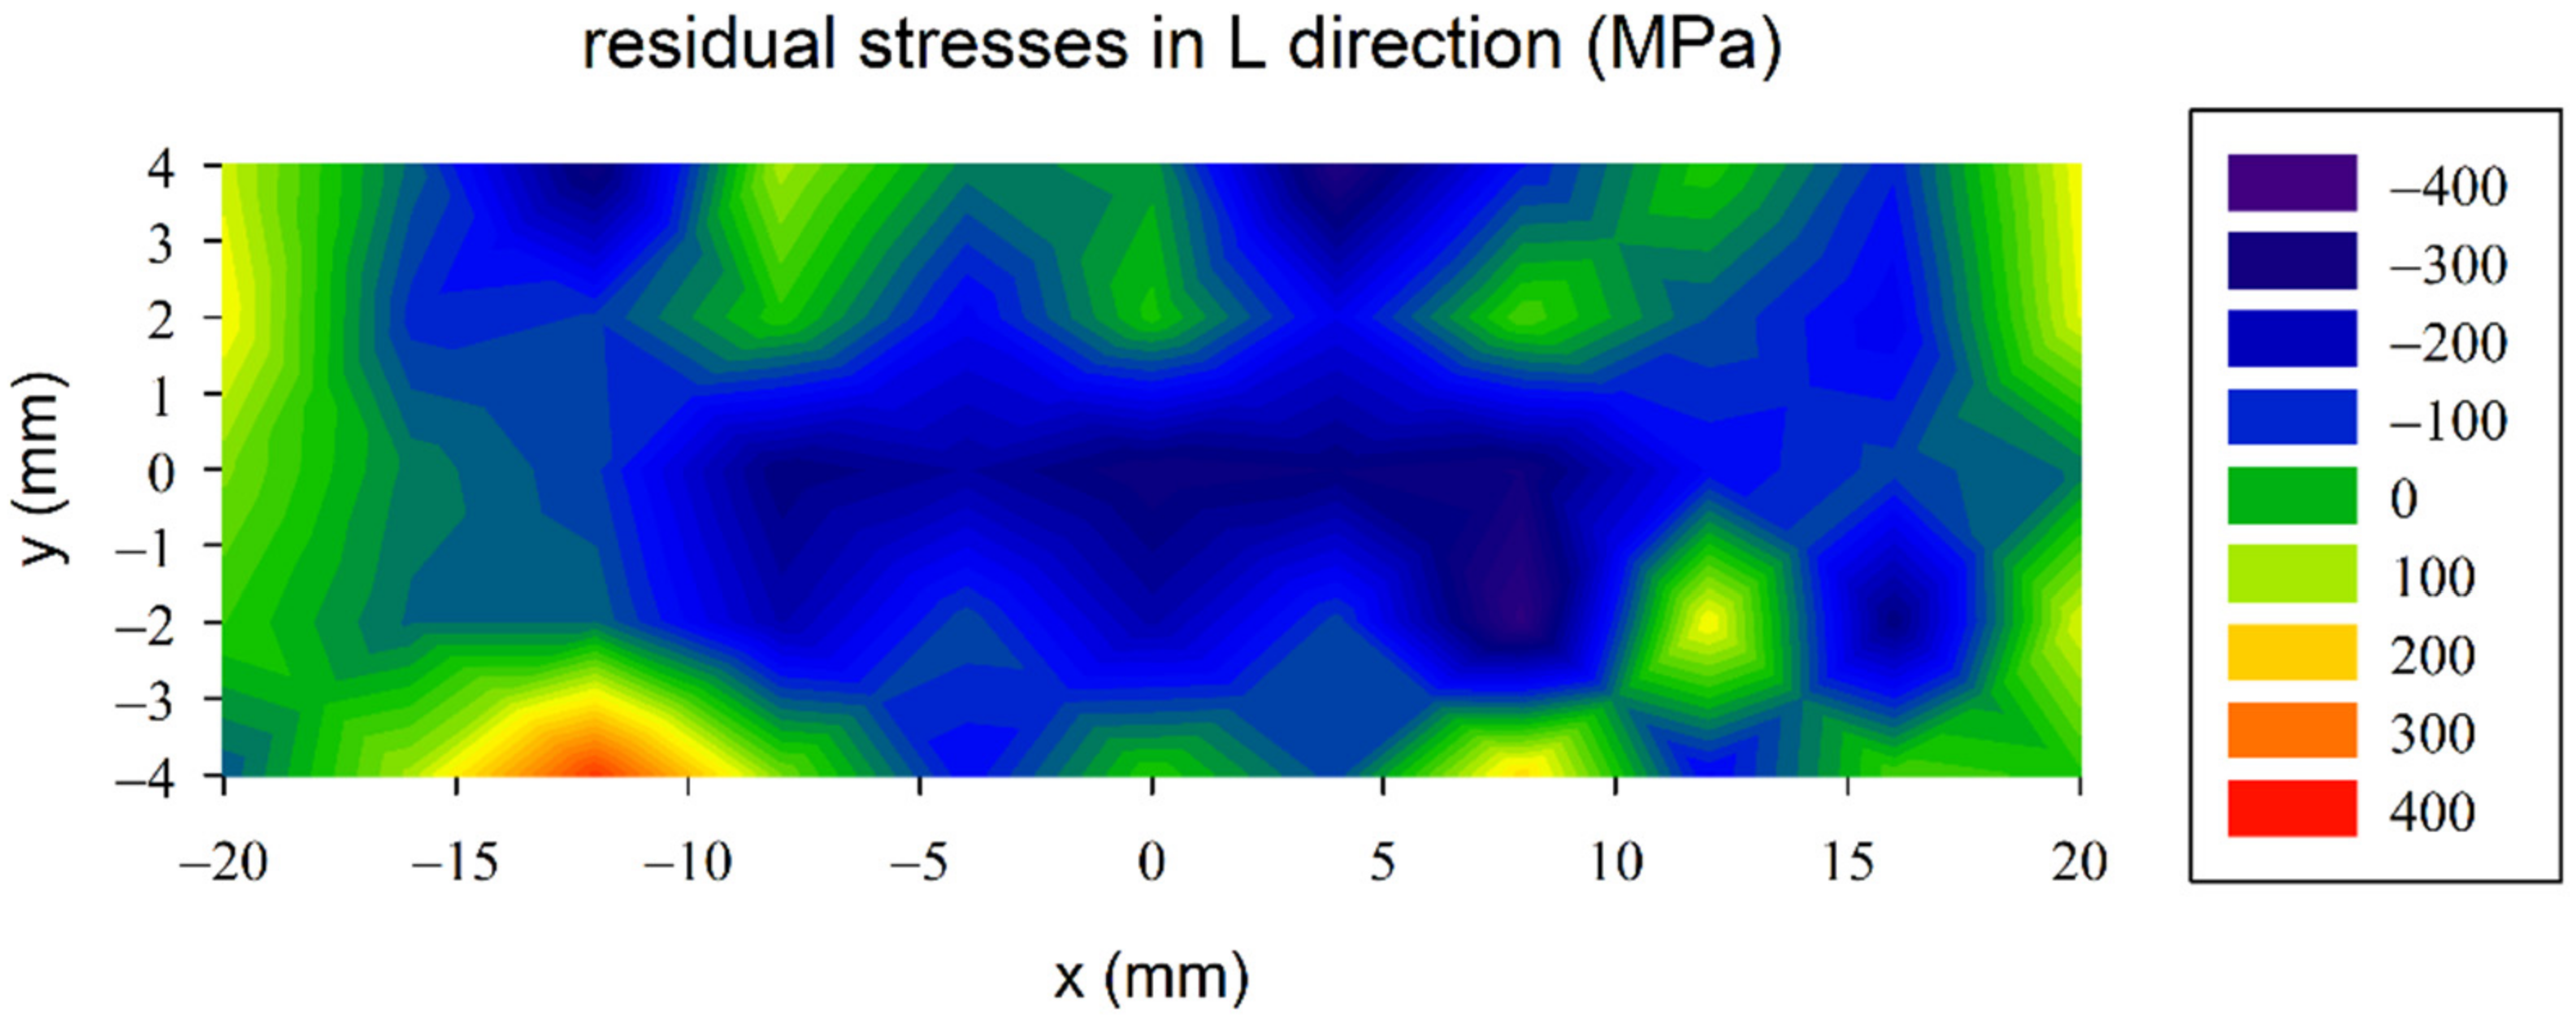
3.4.1. Surface Macroscopic Residual Stresses Obtained Using X-ray Diffraction
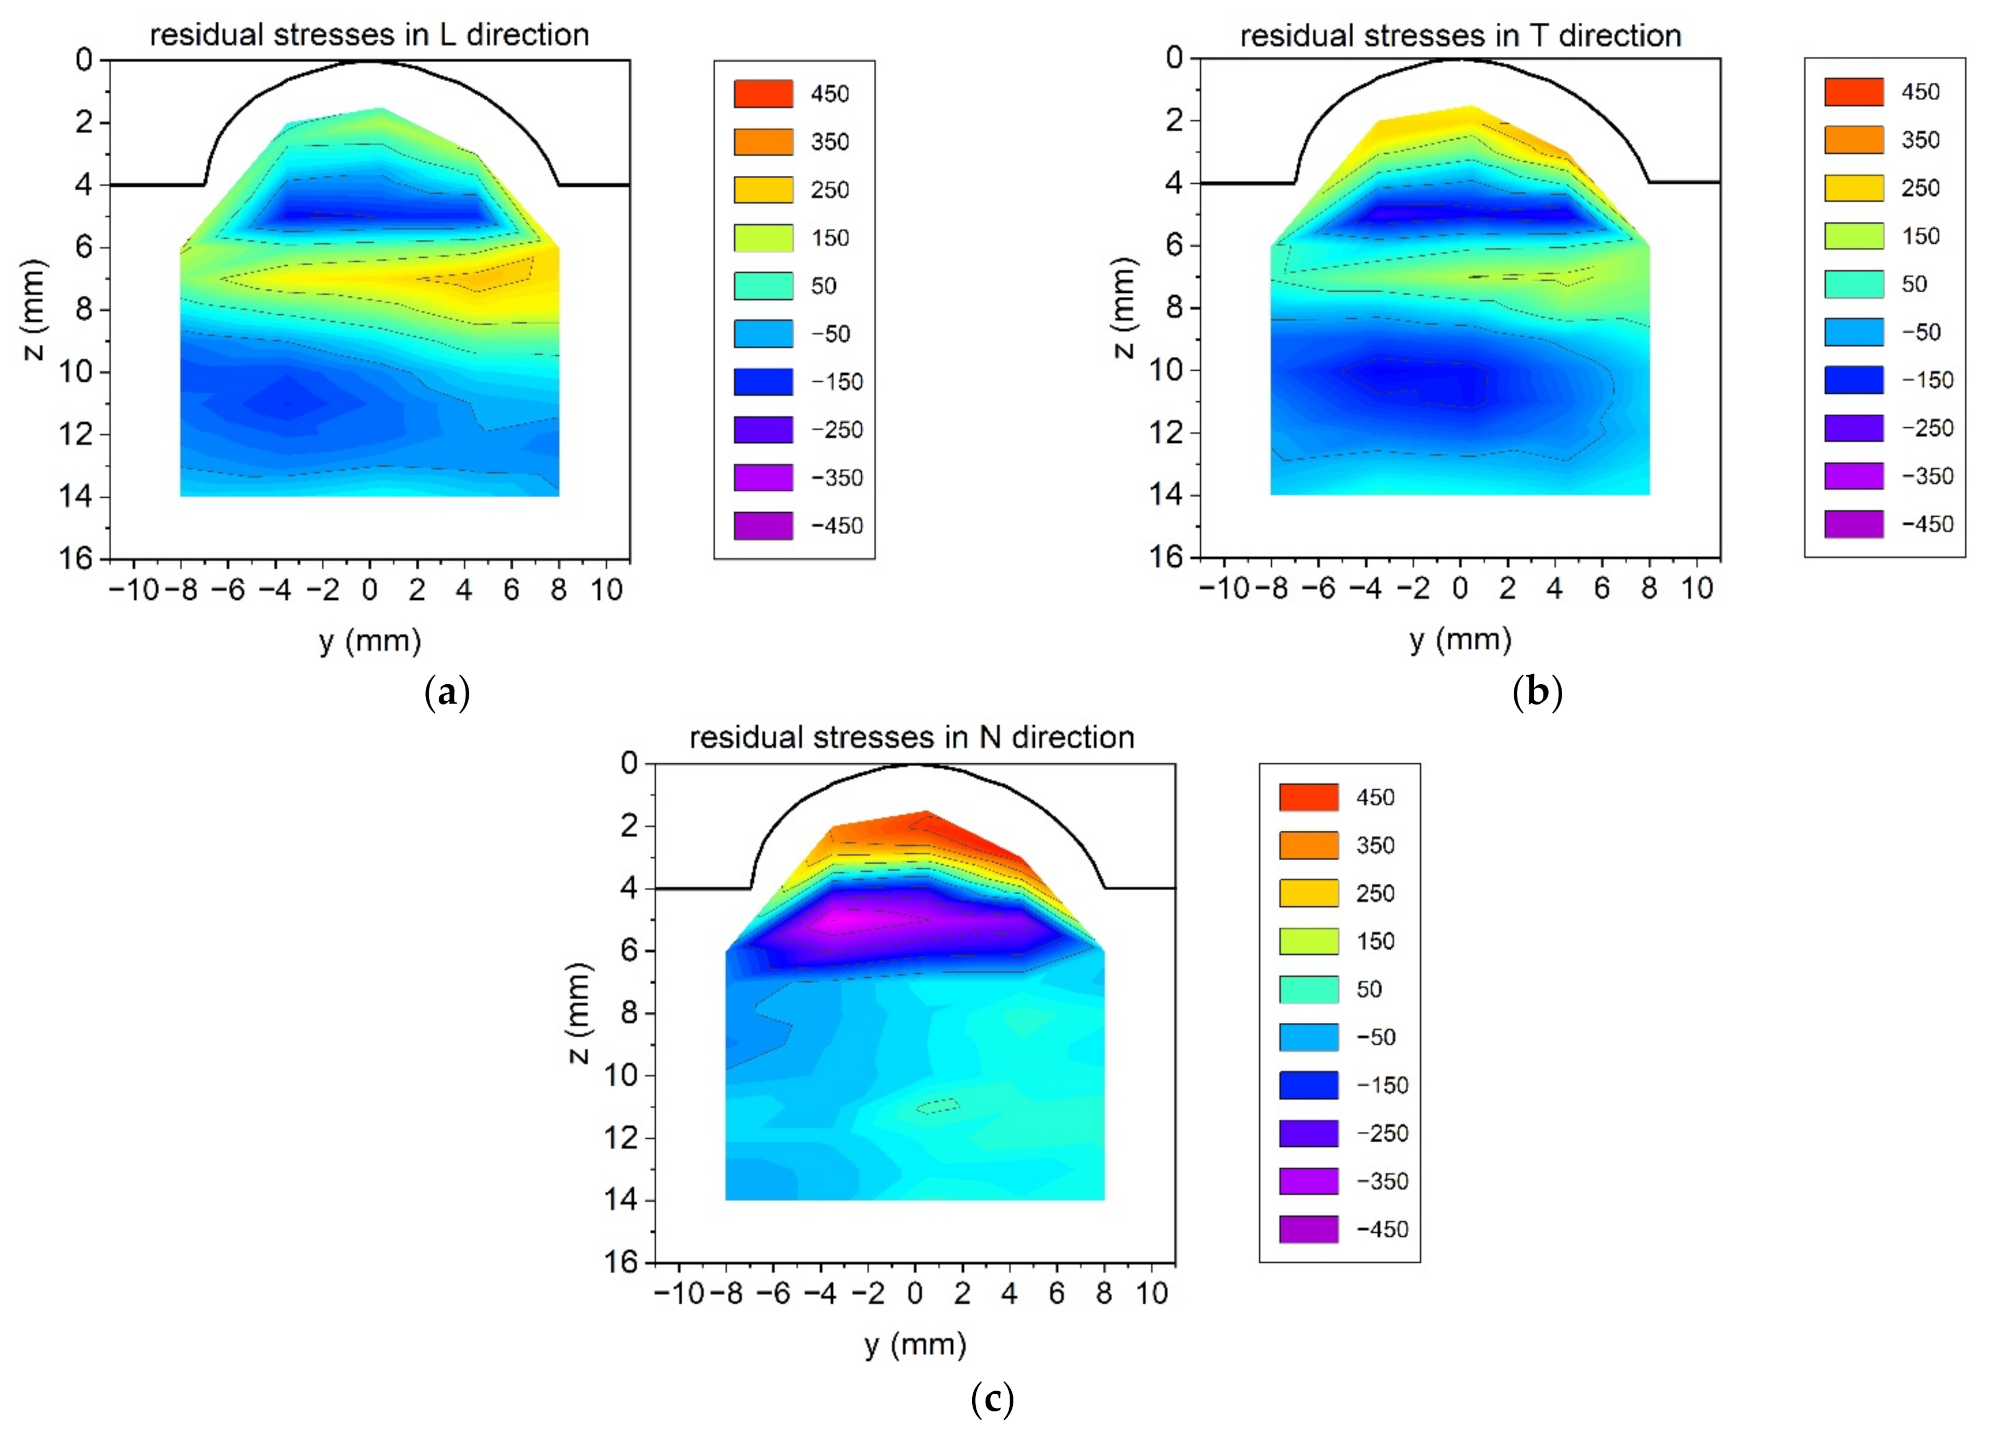
3.4.2. Bulk Macroscopic Residual Stresses Obtained Using Neutron Diffraction
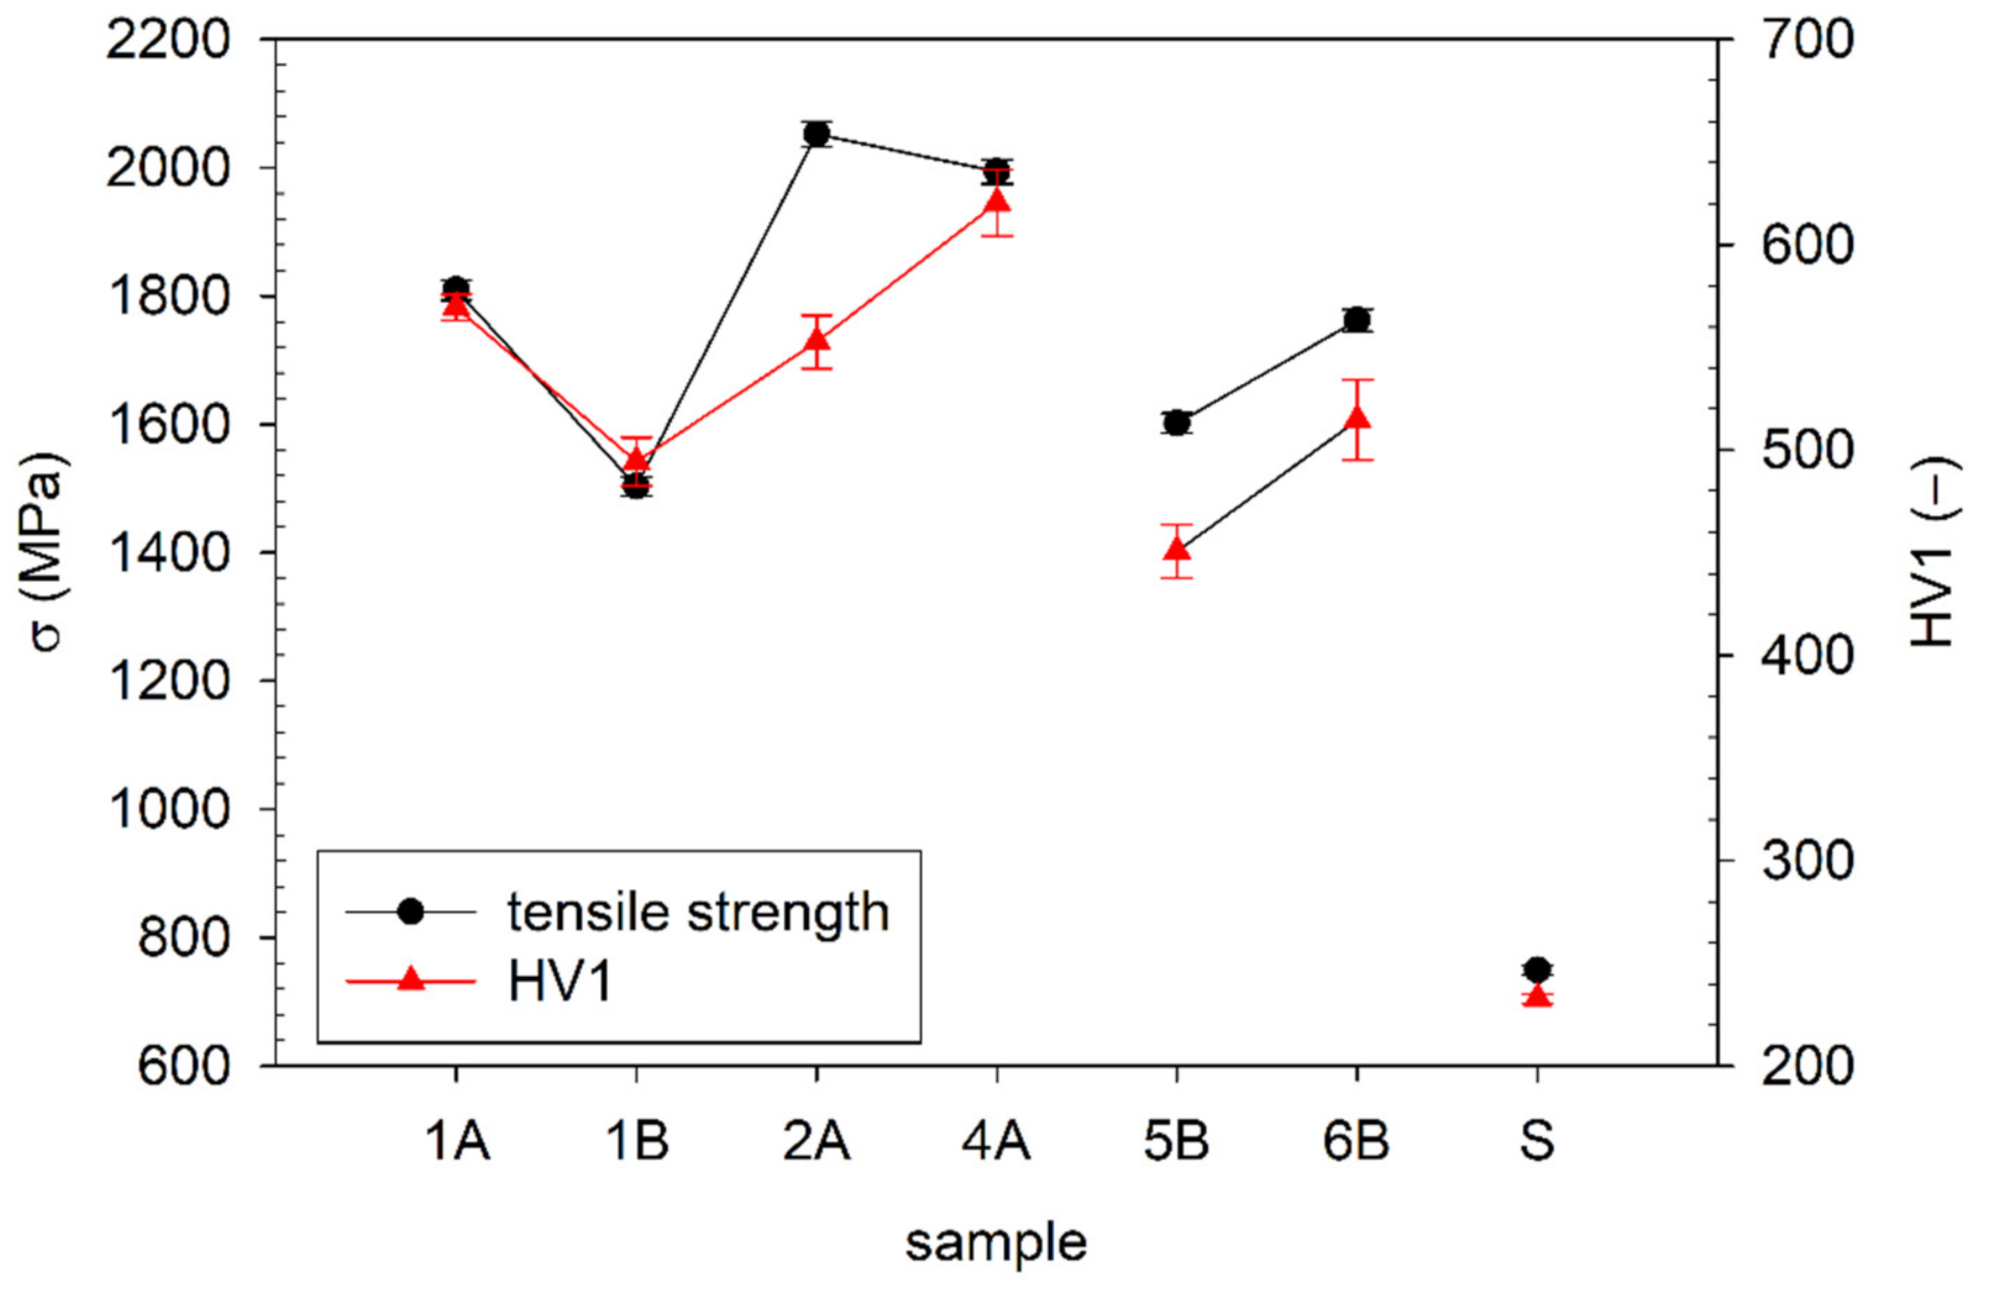
3.5. Tensile Testing
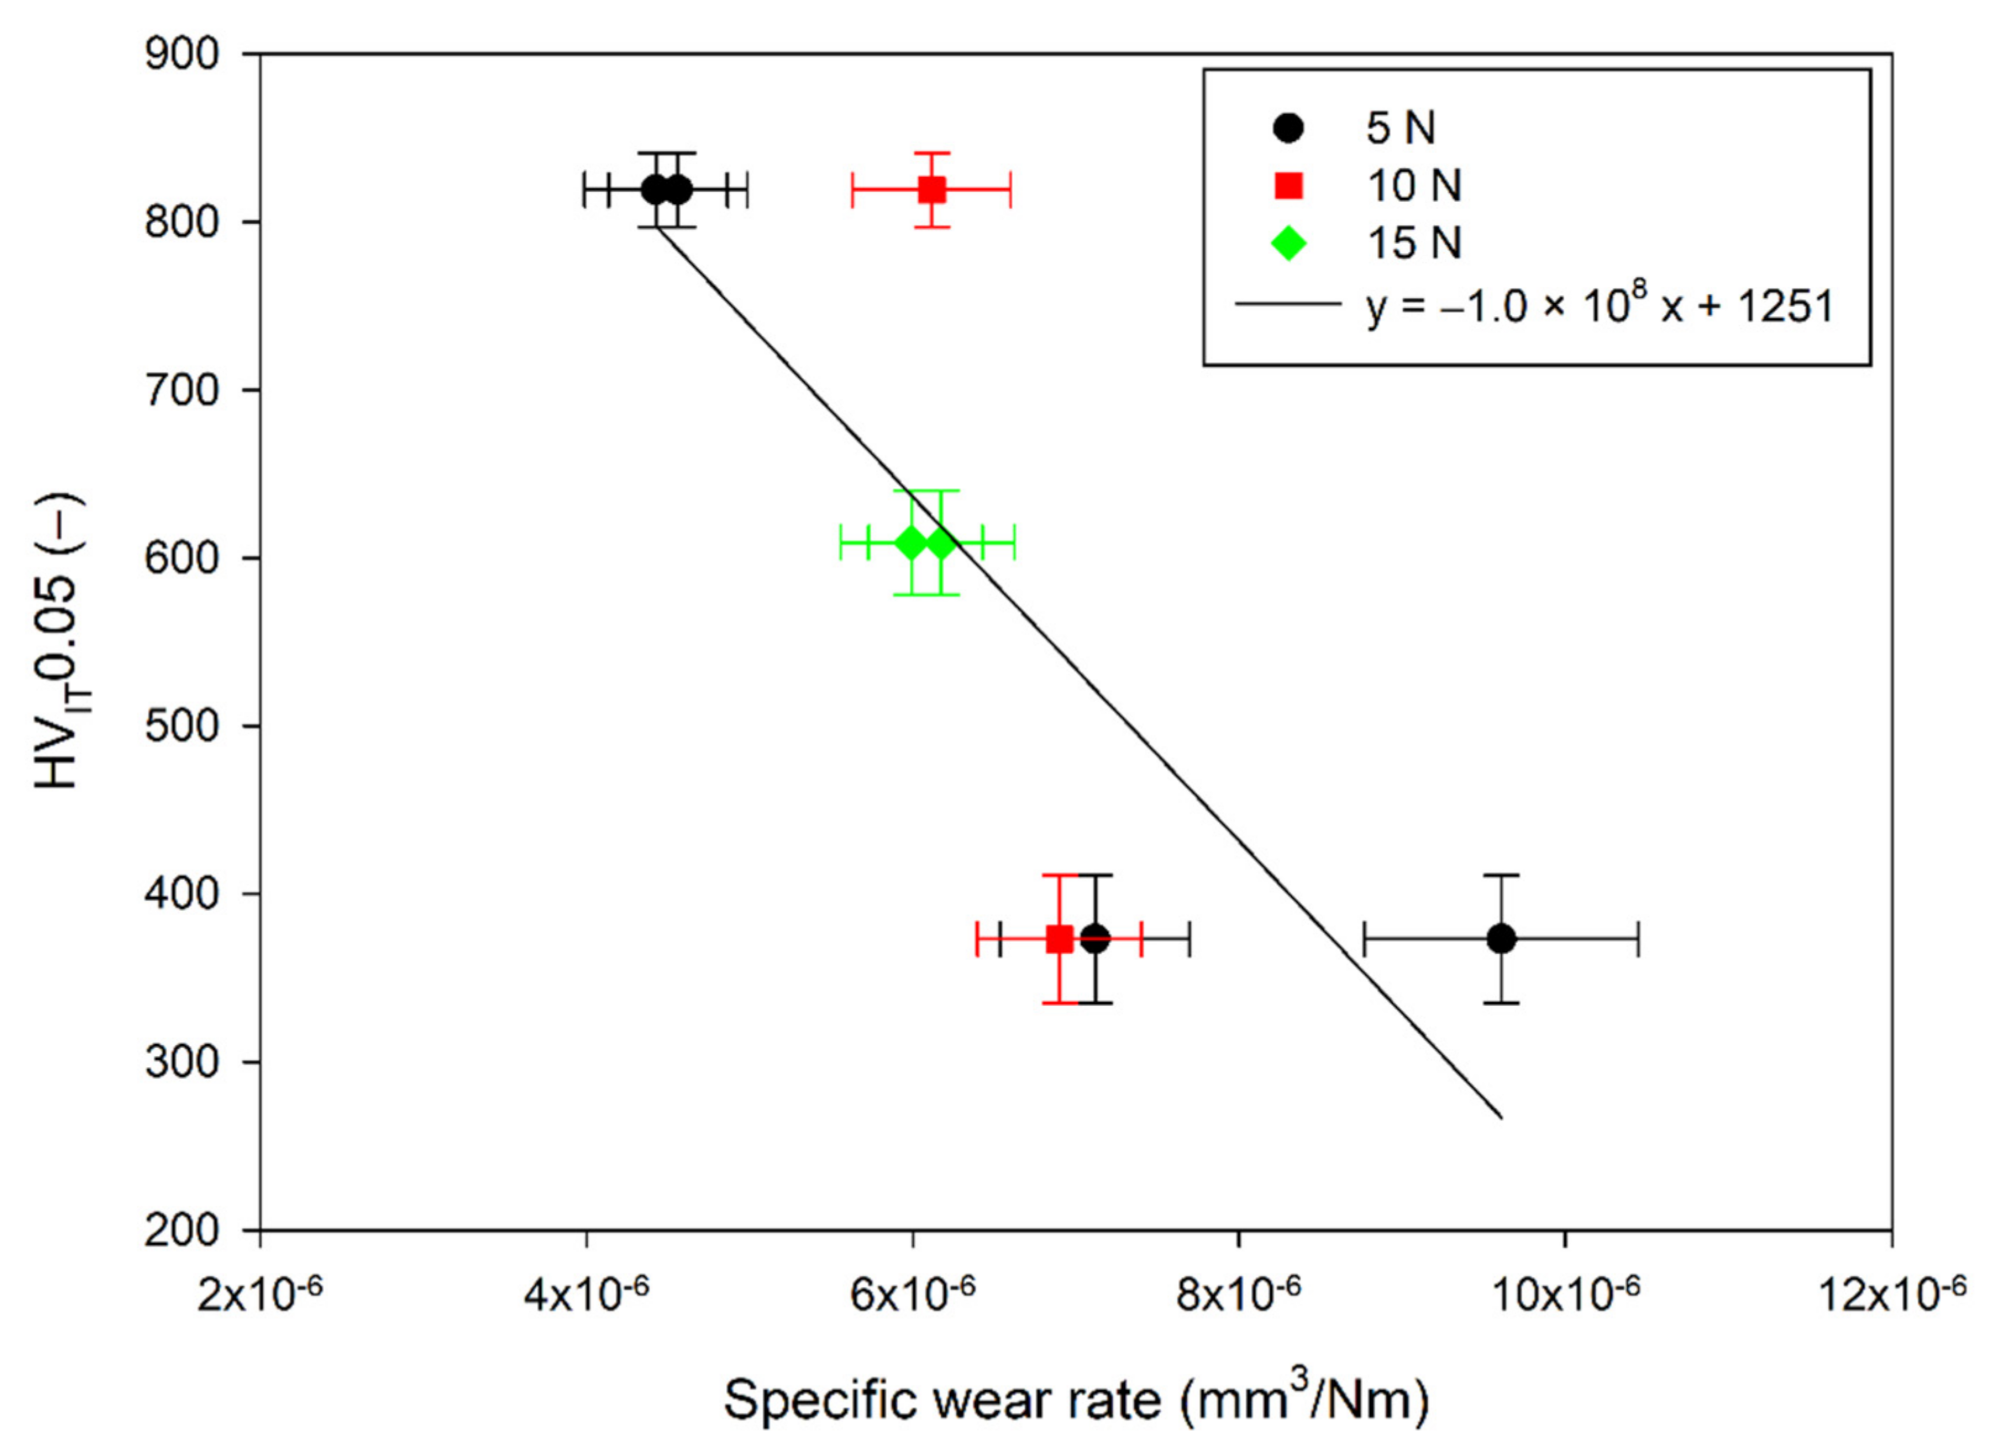
3.6. Wear Resistance
3.7. Surface Finishing
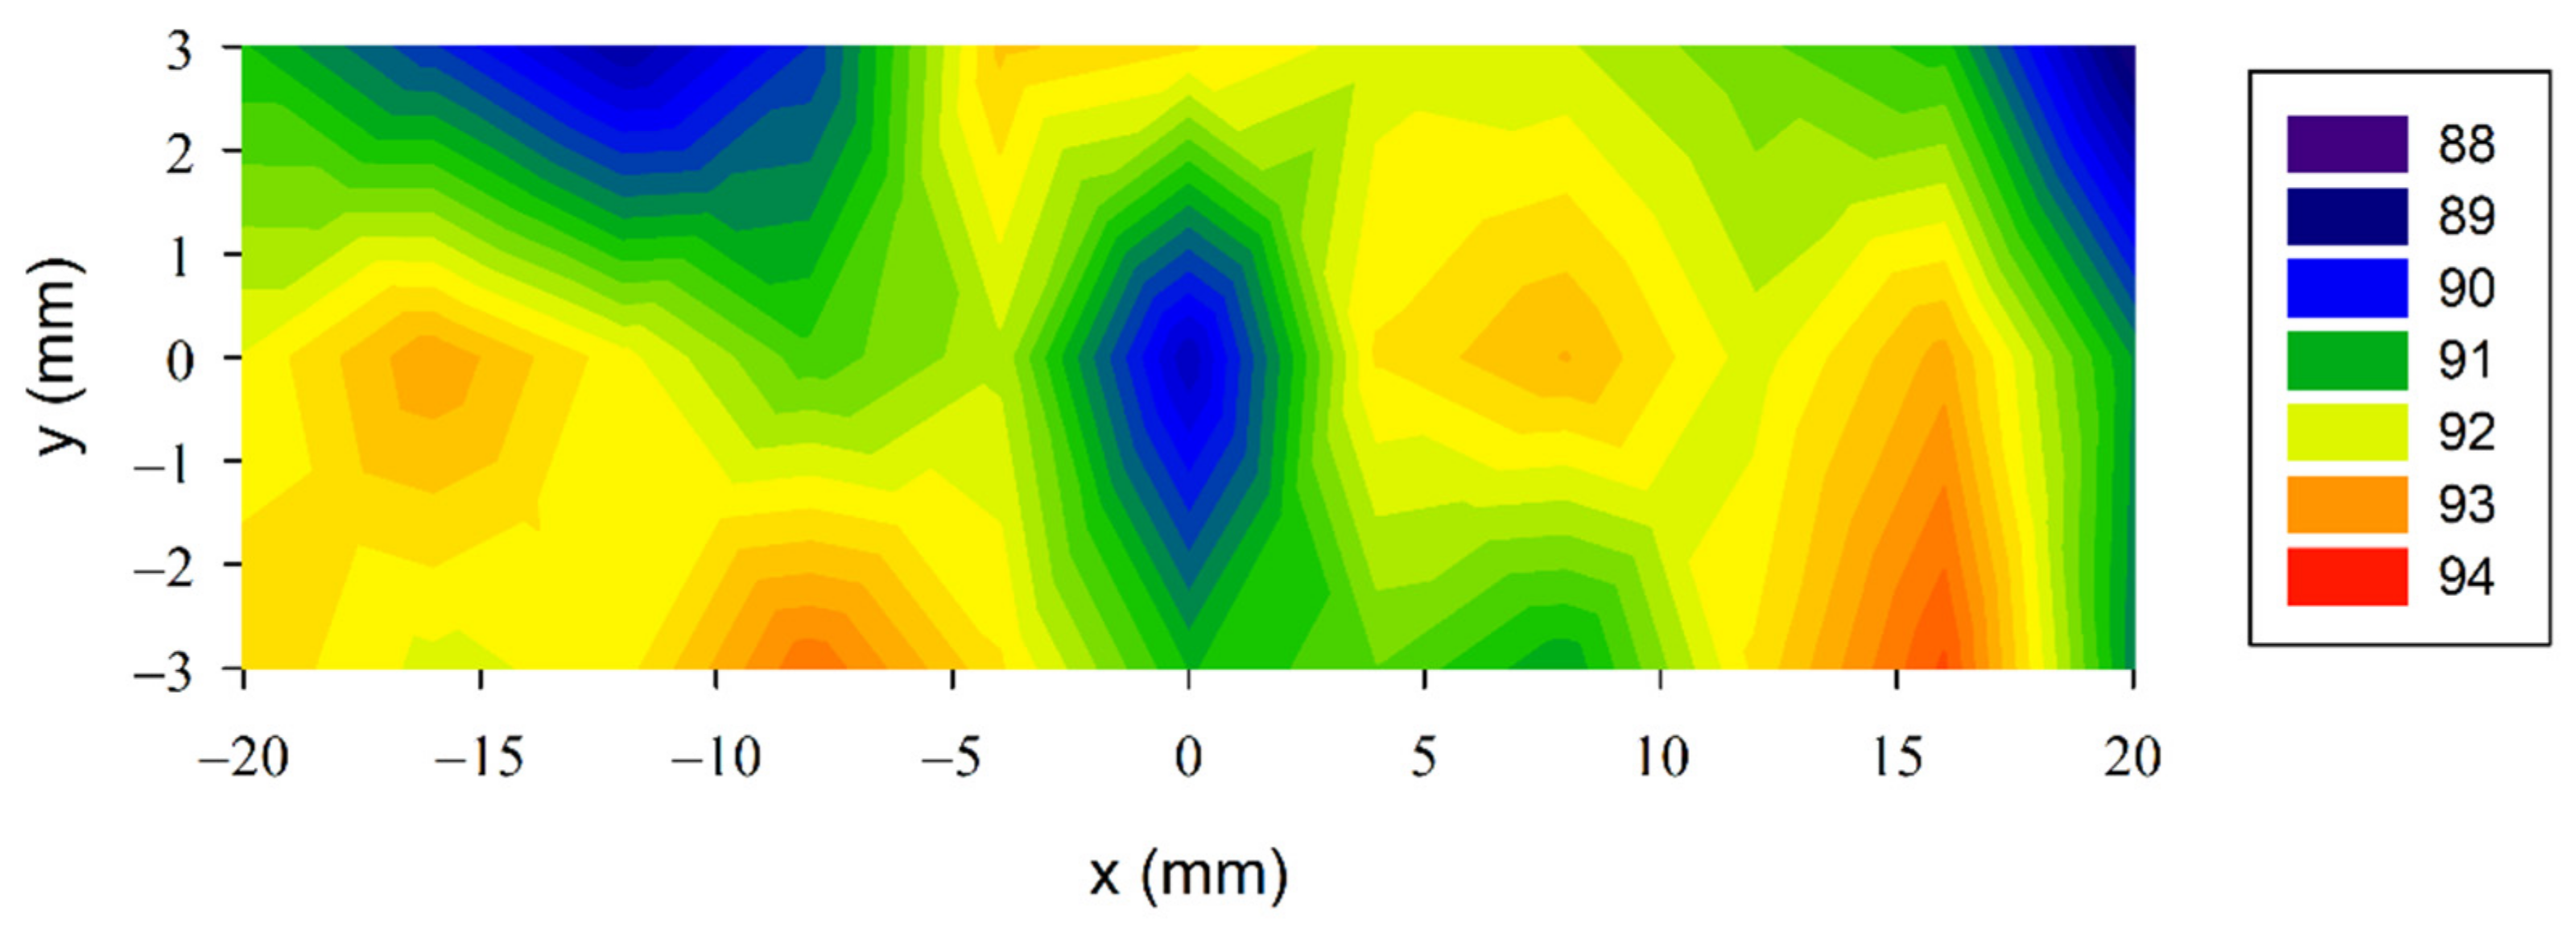
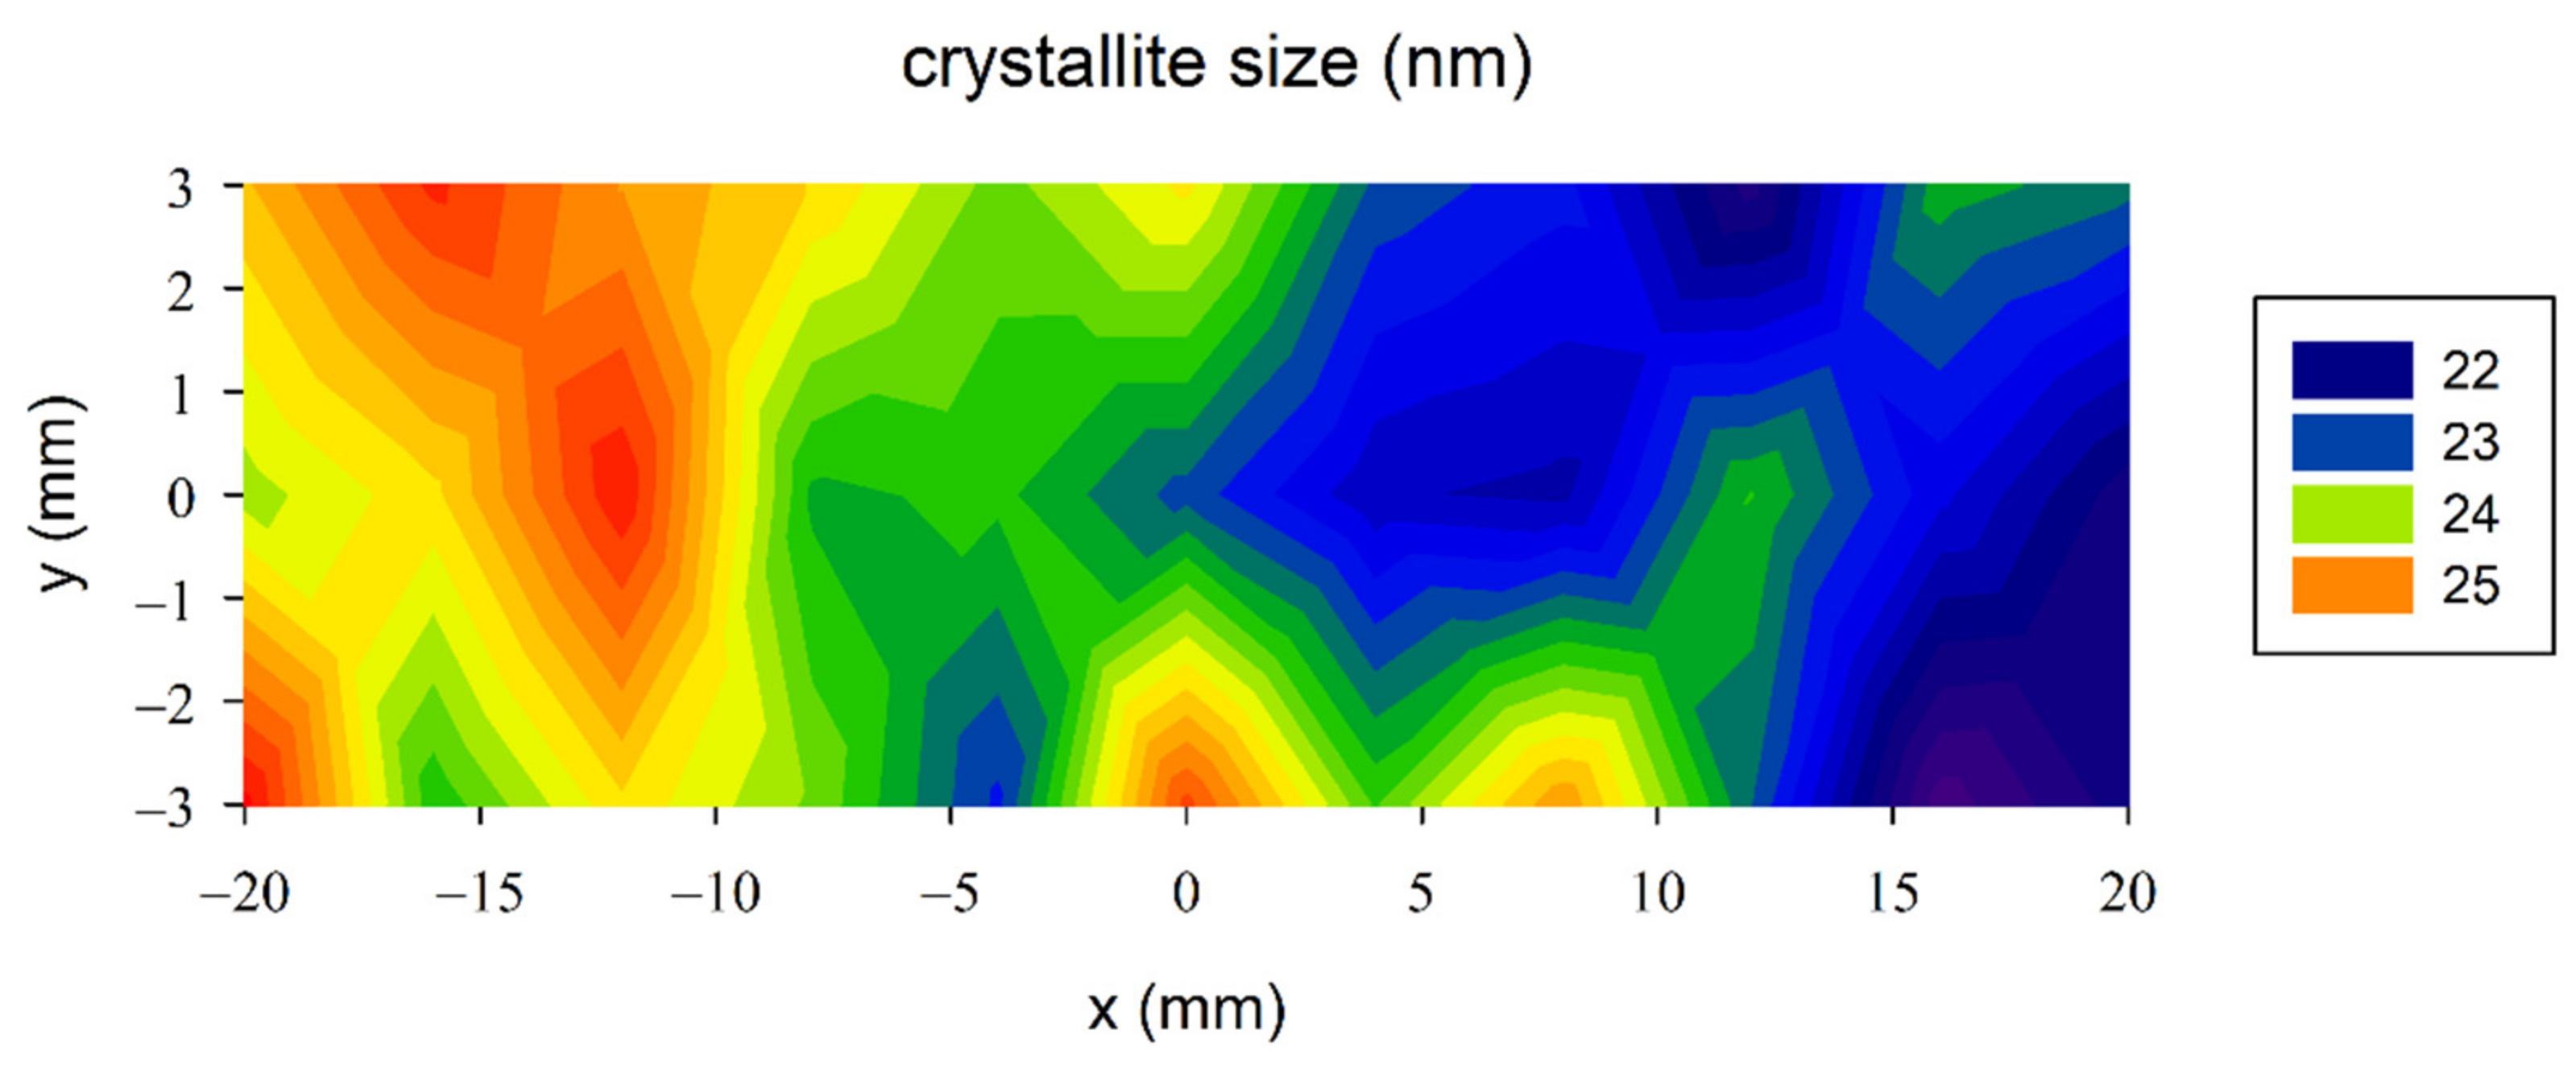
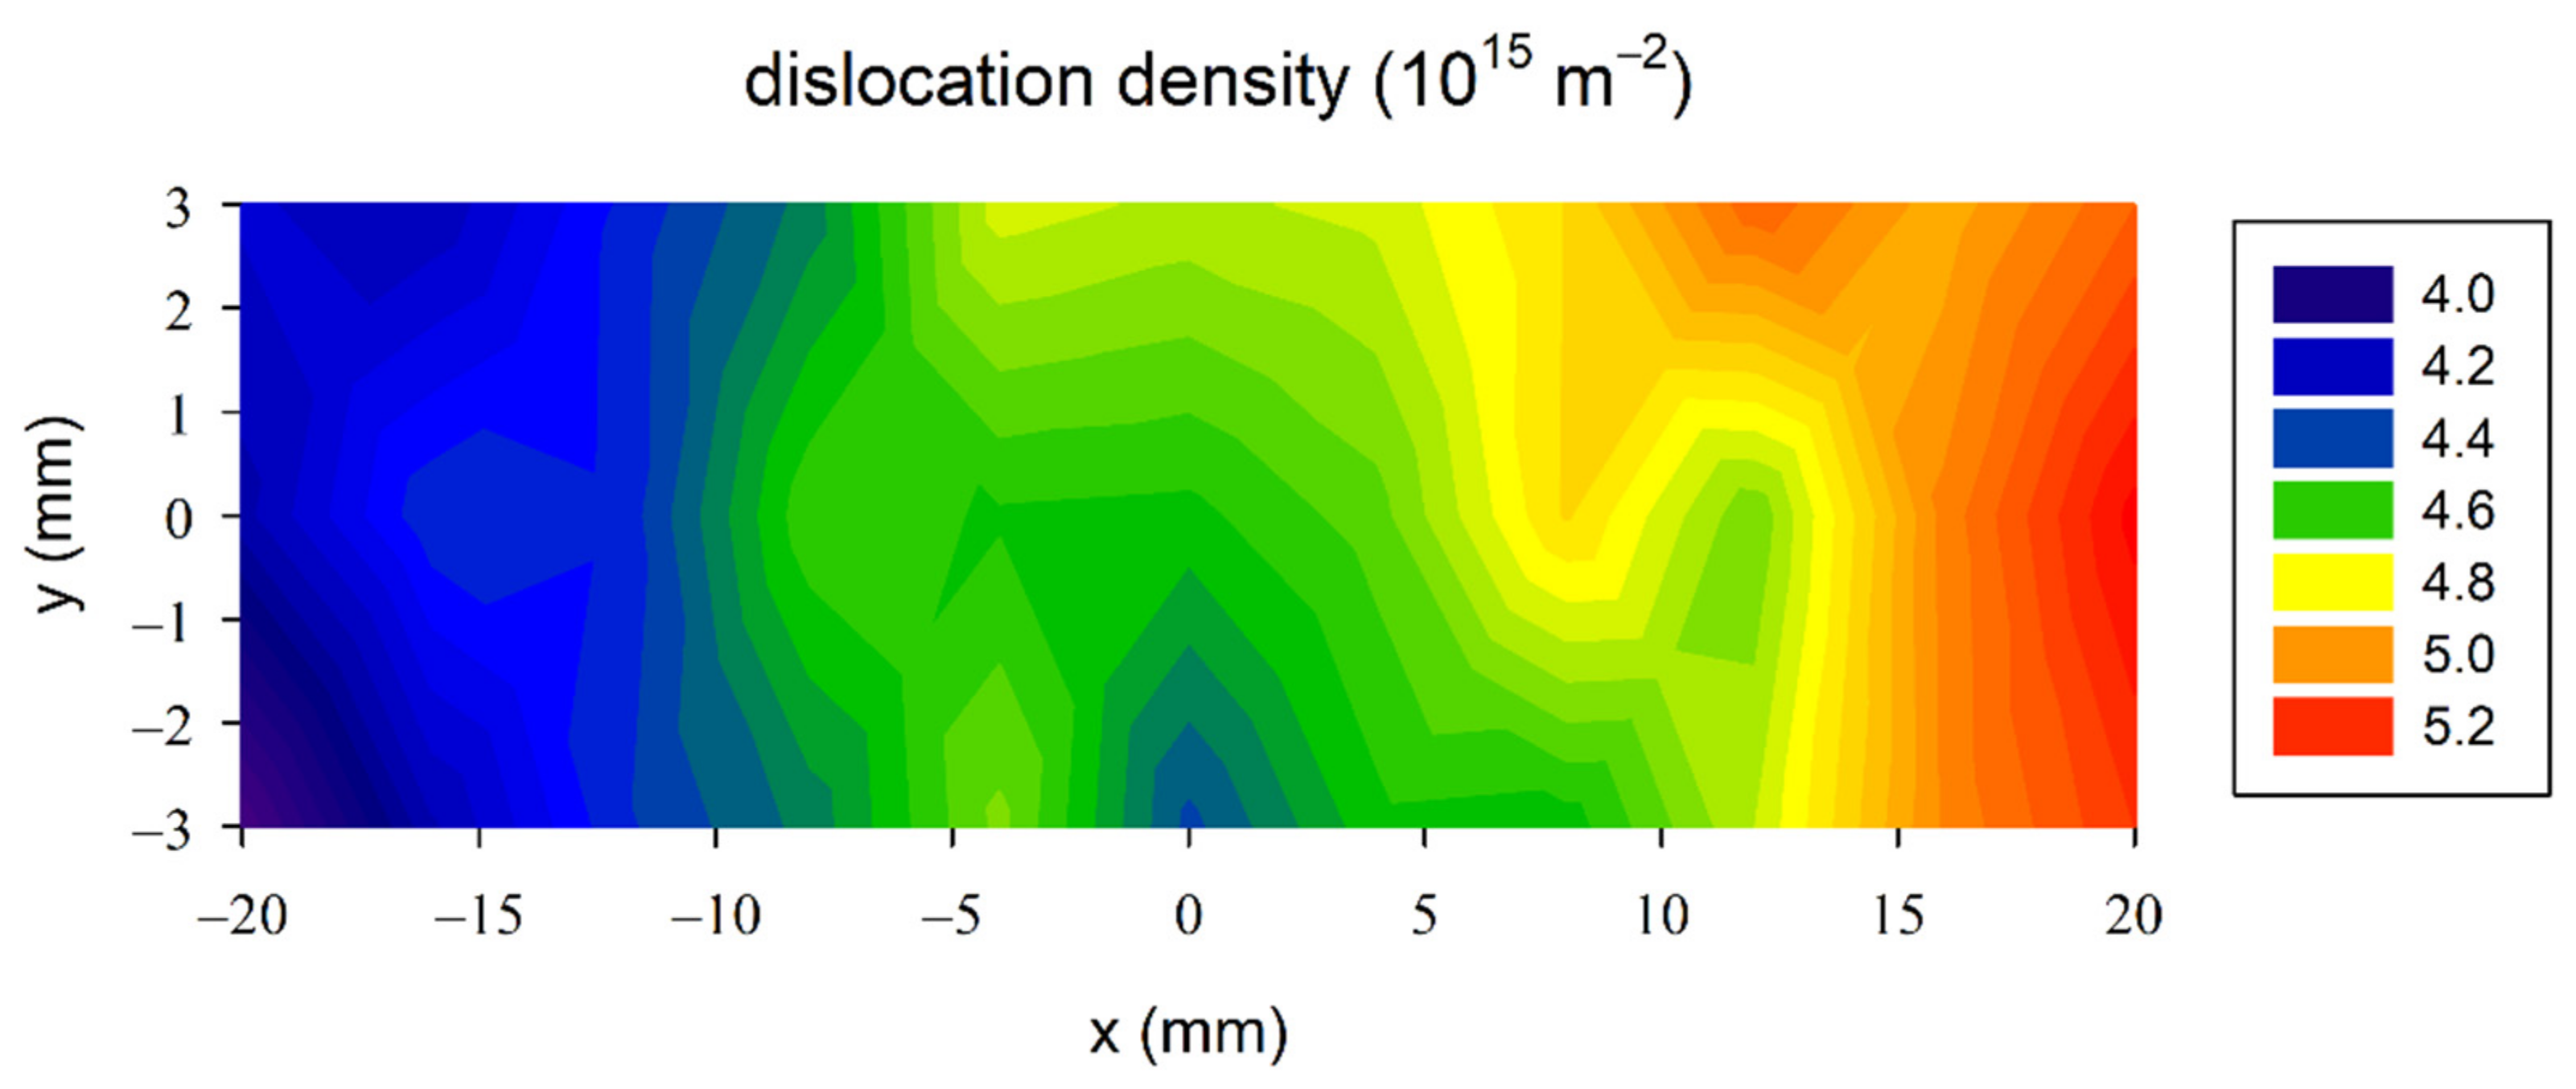
3.7.1. Microstructure Parameters
3.7.2. Surface Macroscopic Residual Stresses
3.7.3. Hardness
4. Conclusions
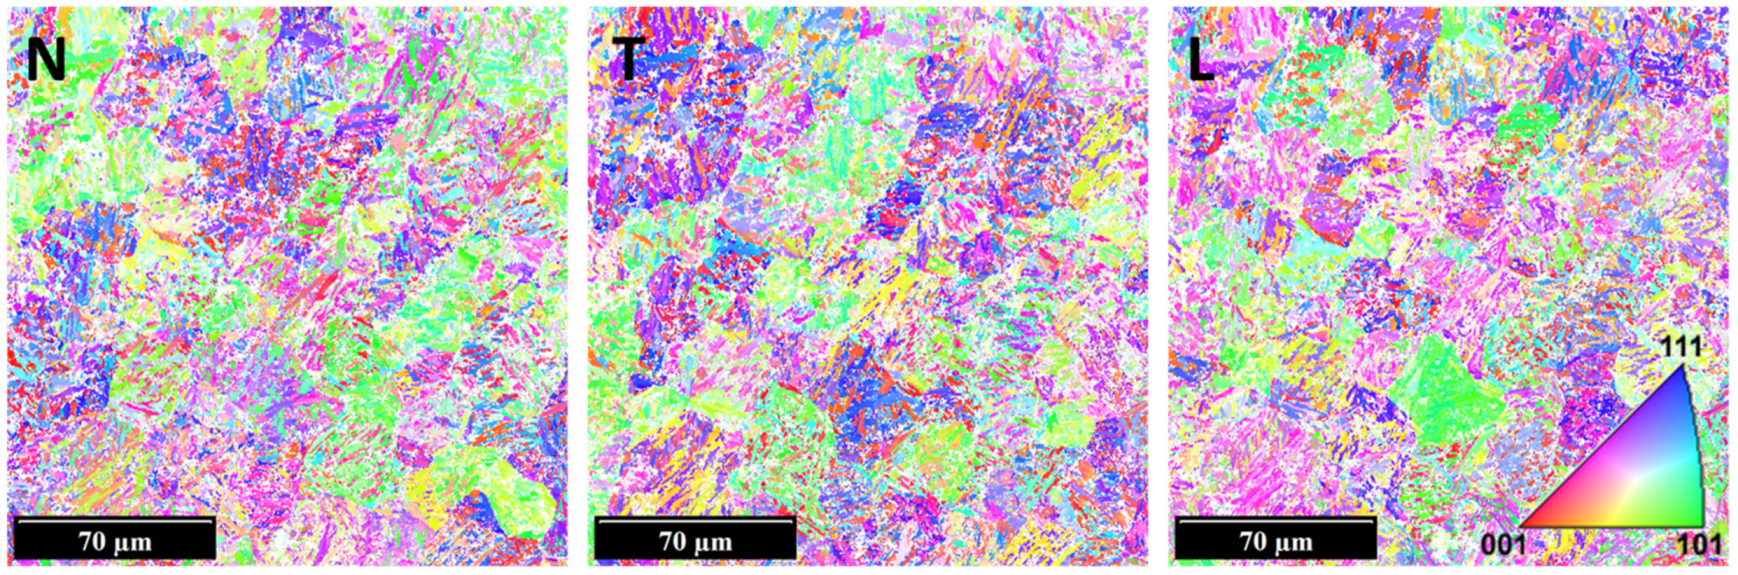
- It was found that the cladded layers showed differences in microstructure across the thickness that may lead to undesirable properties;
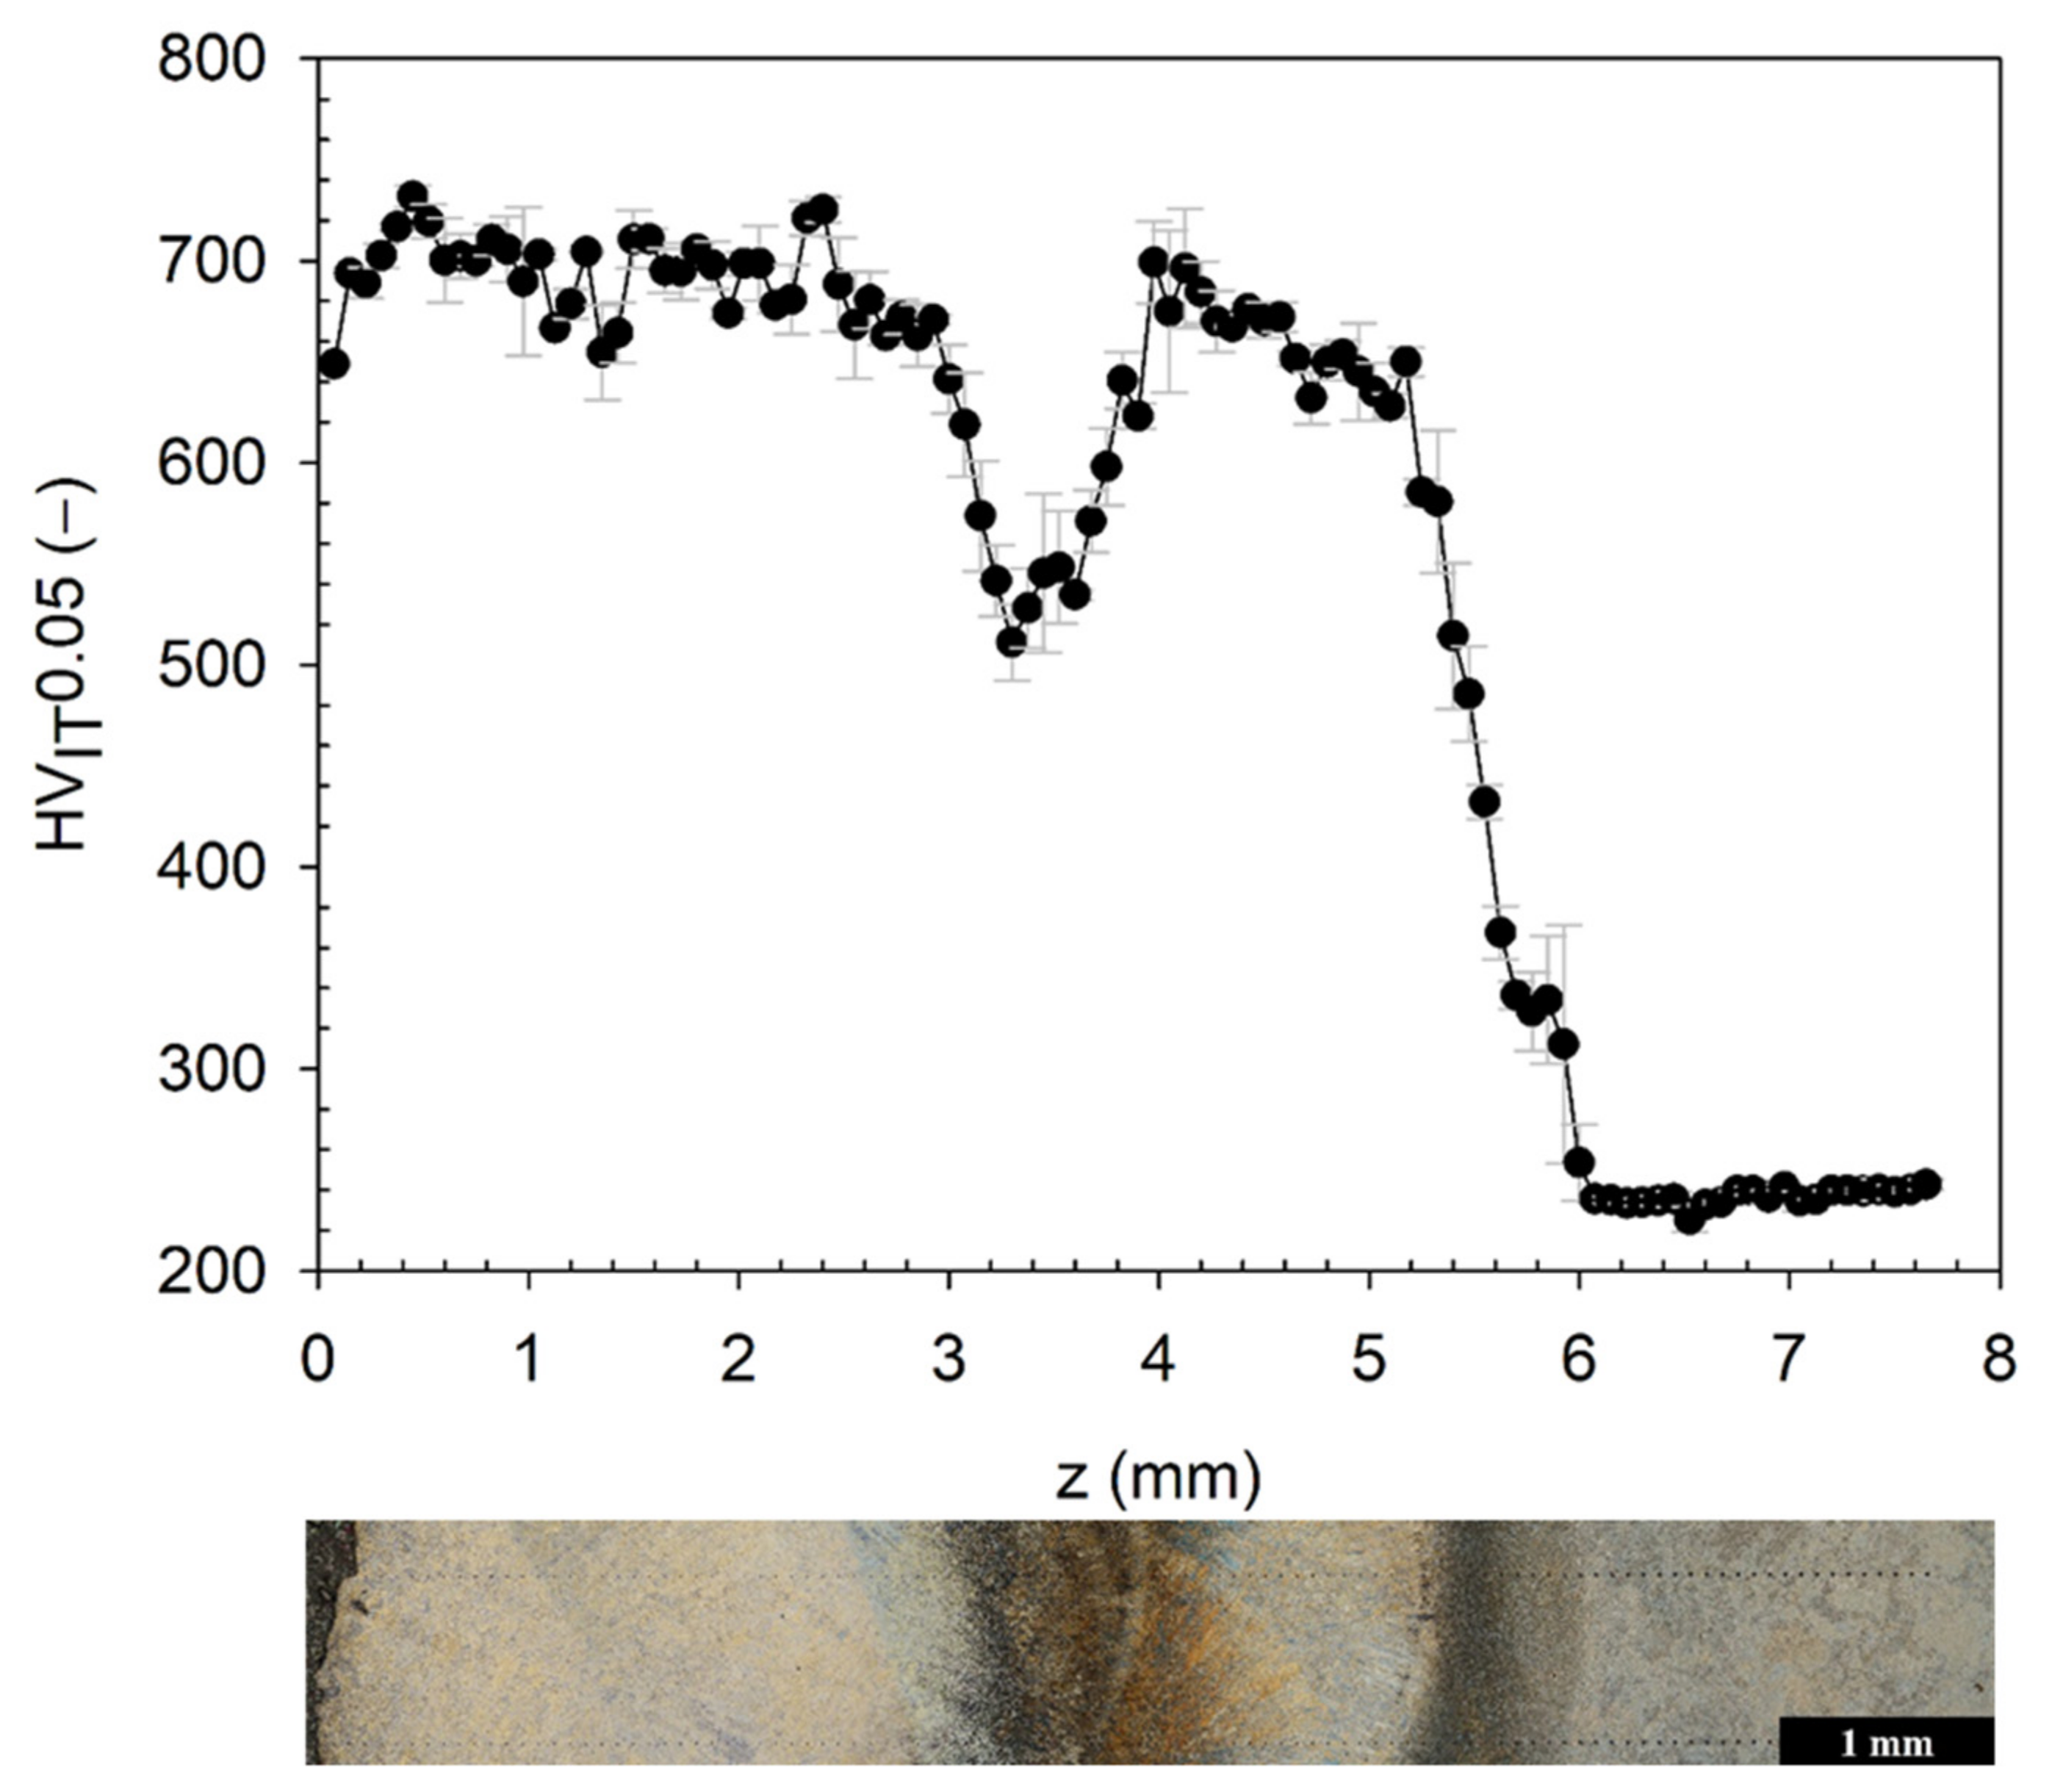
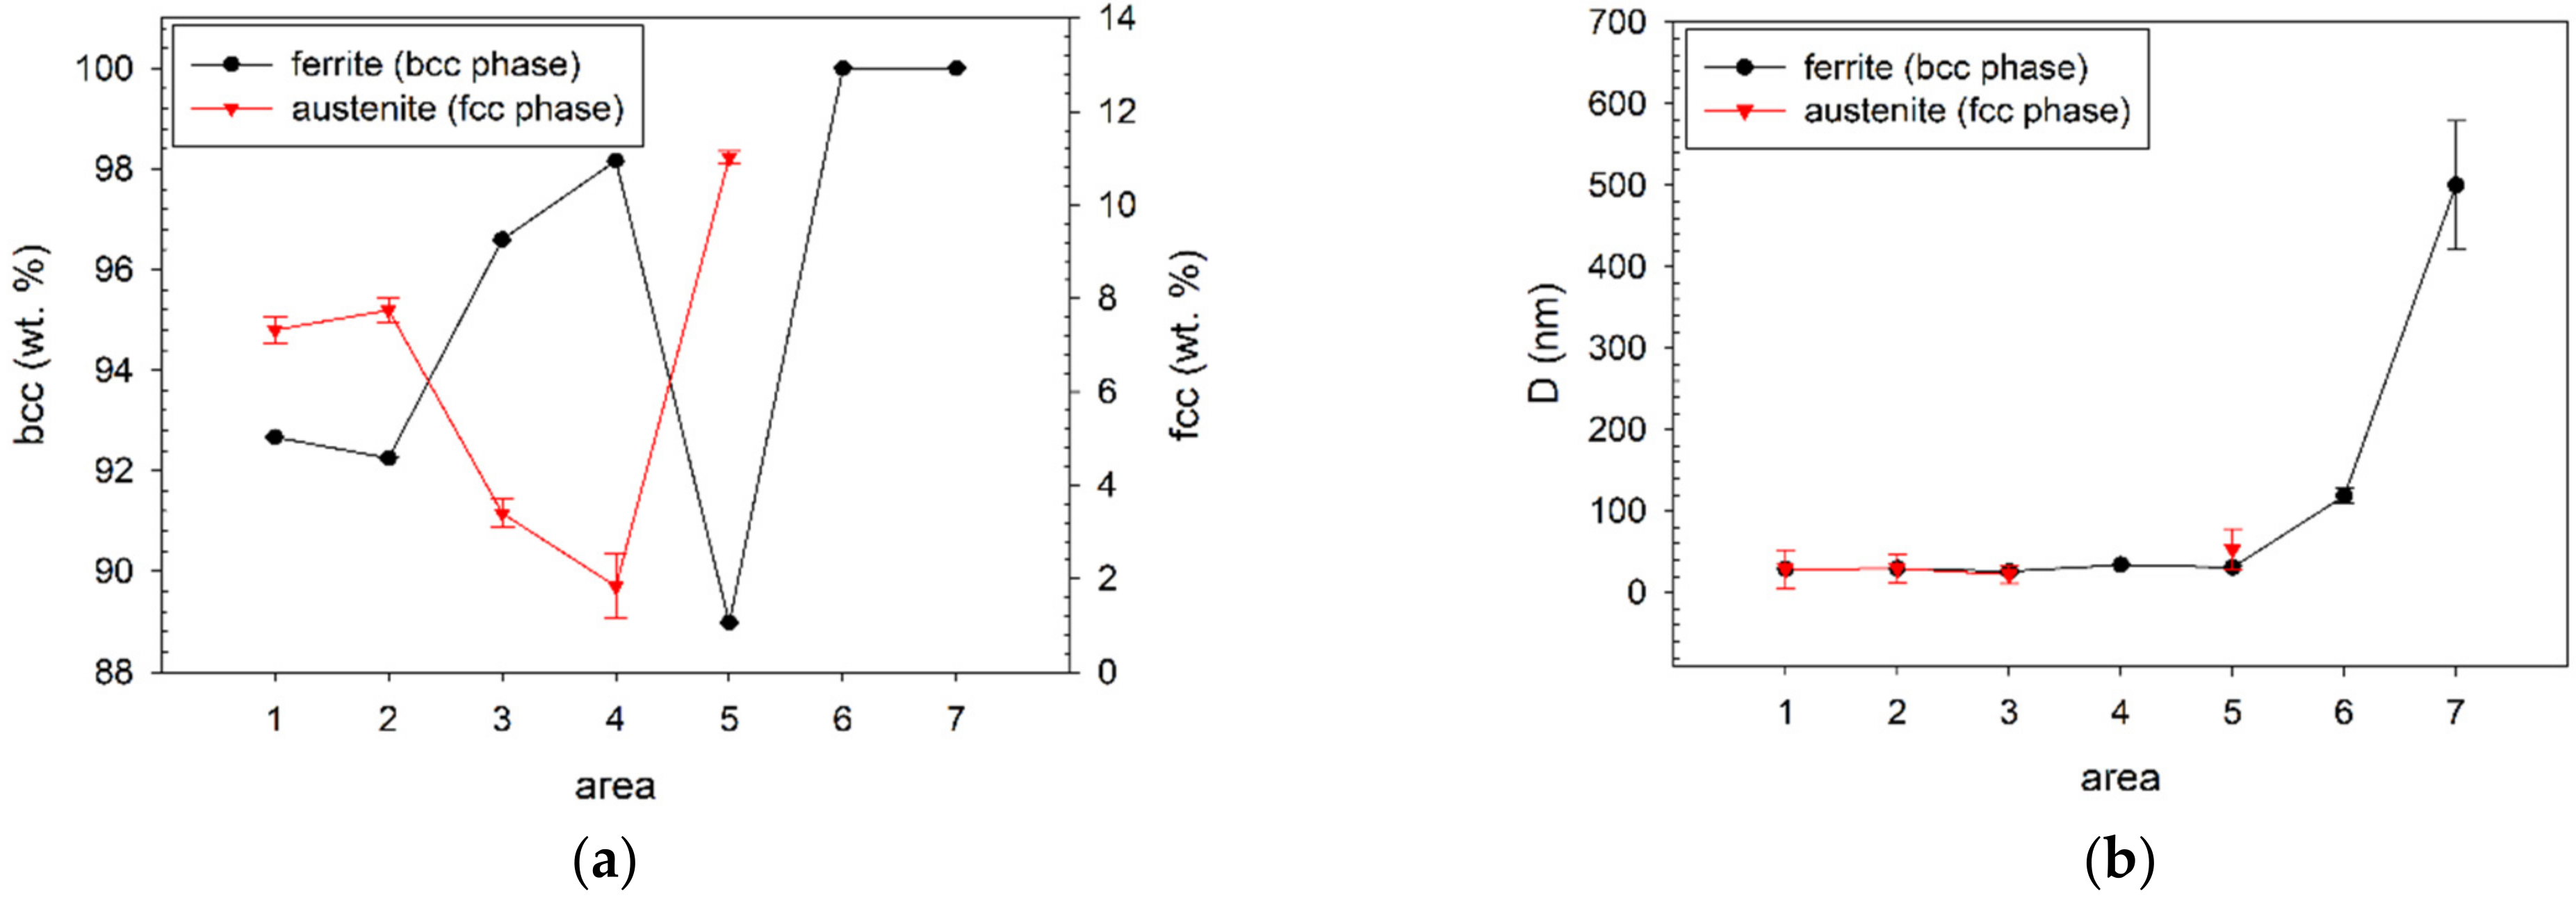
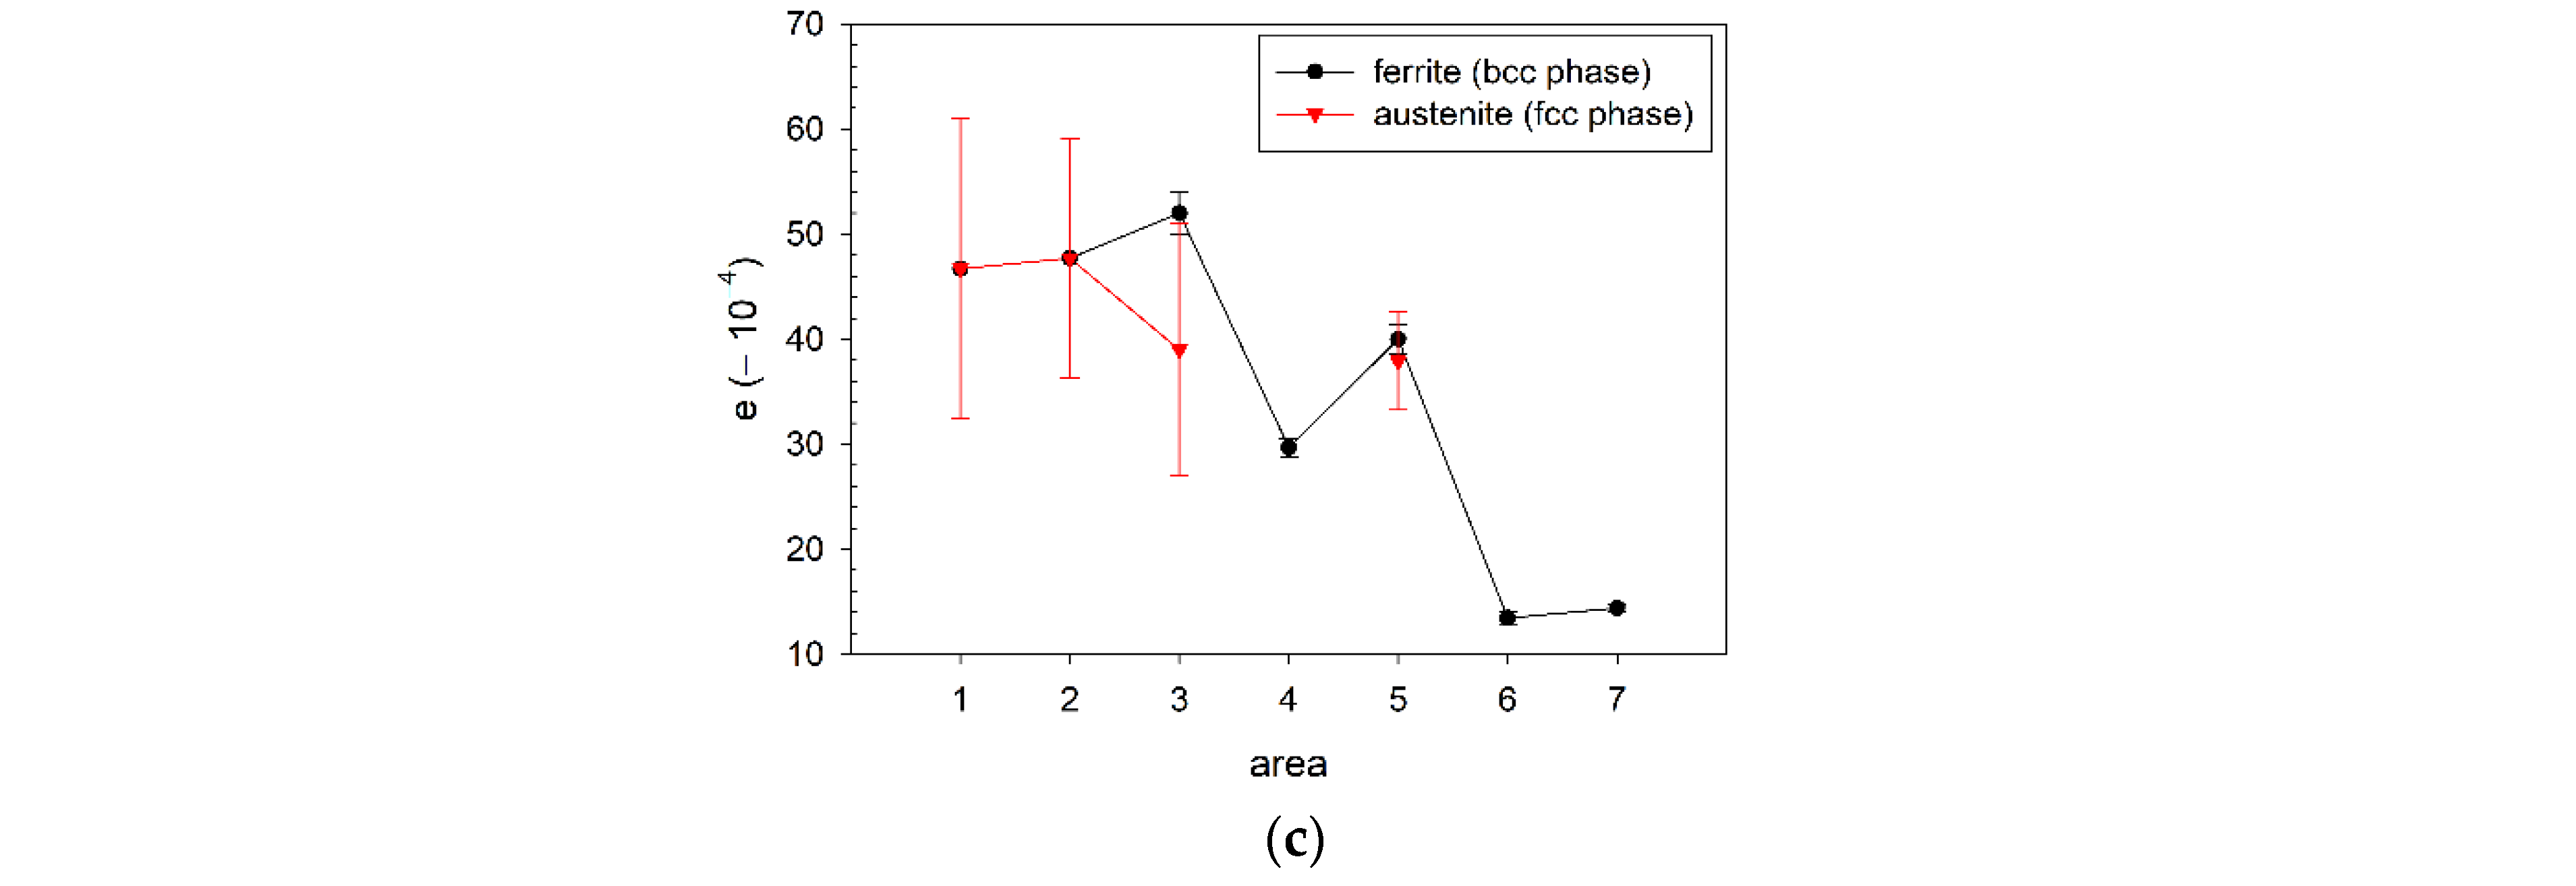
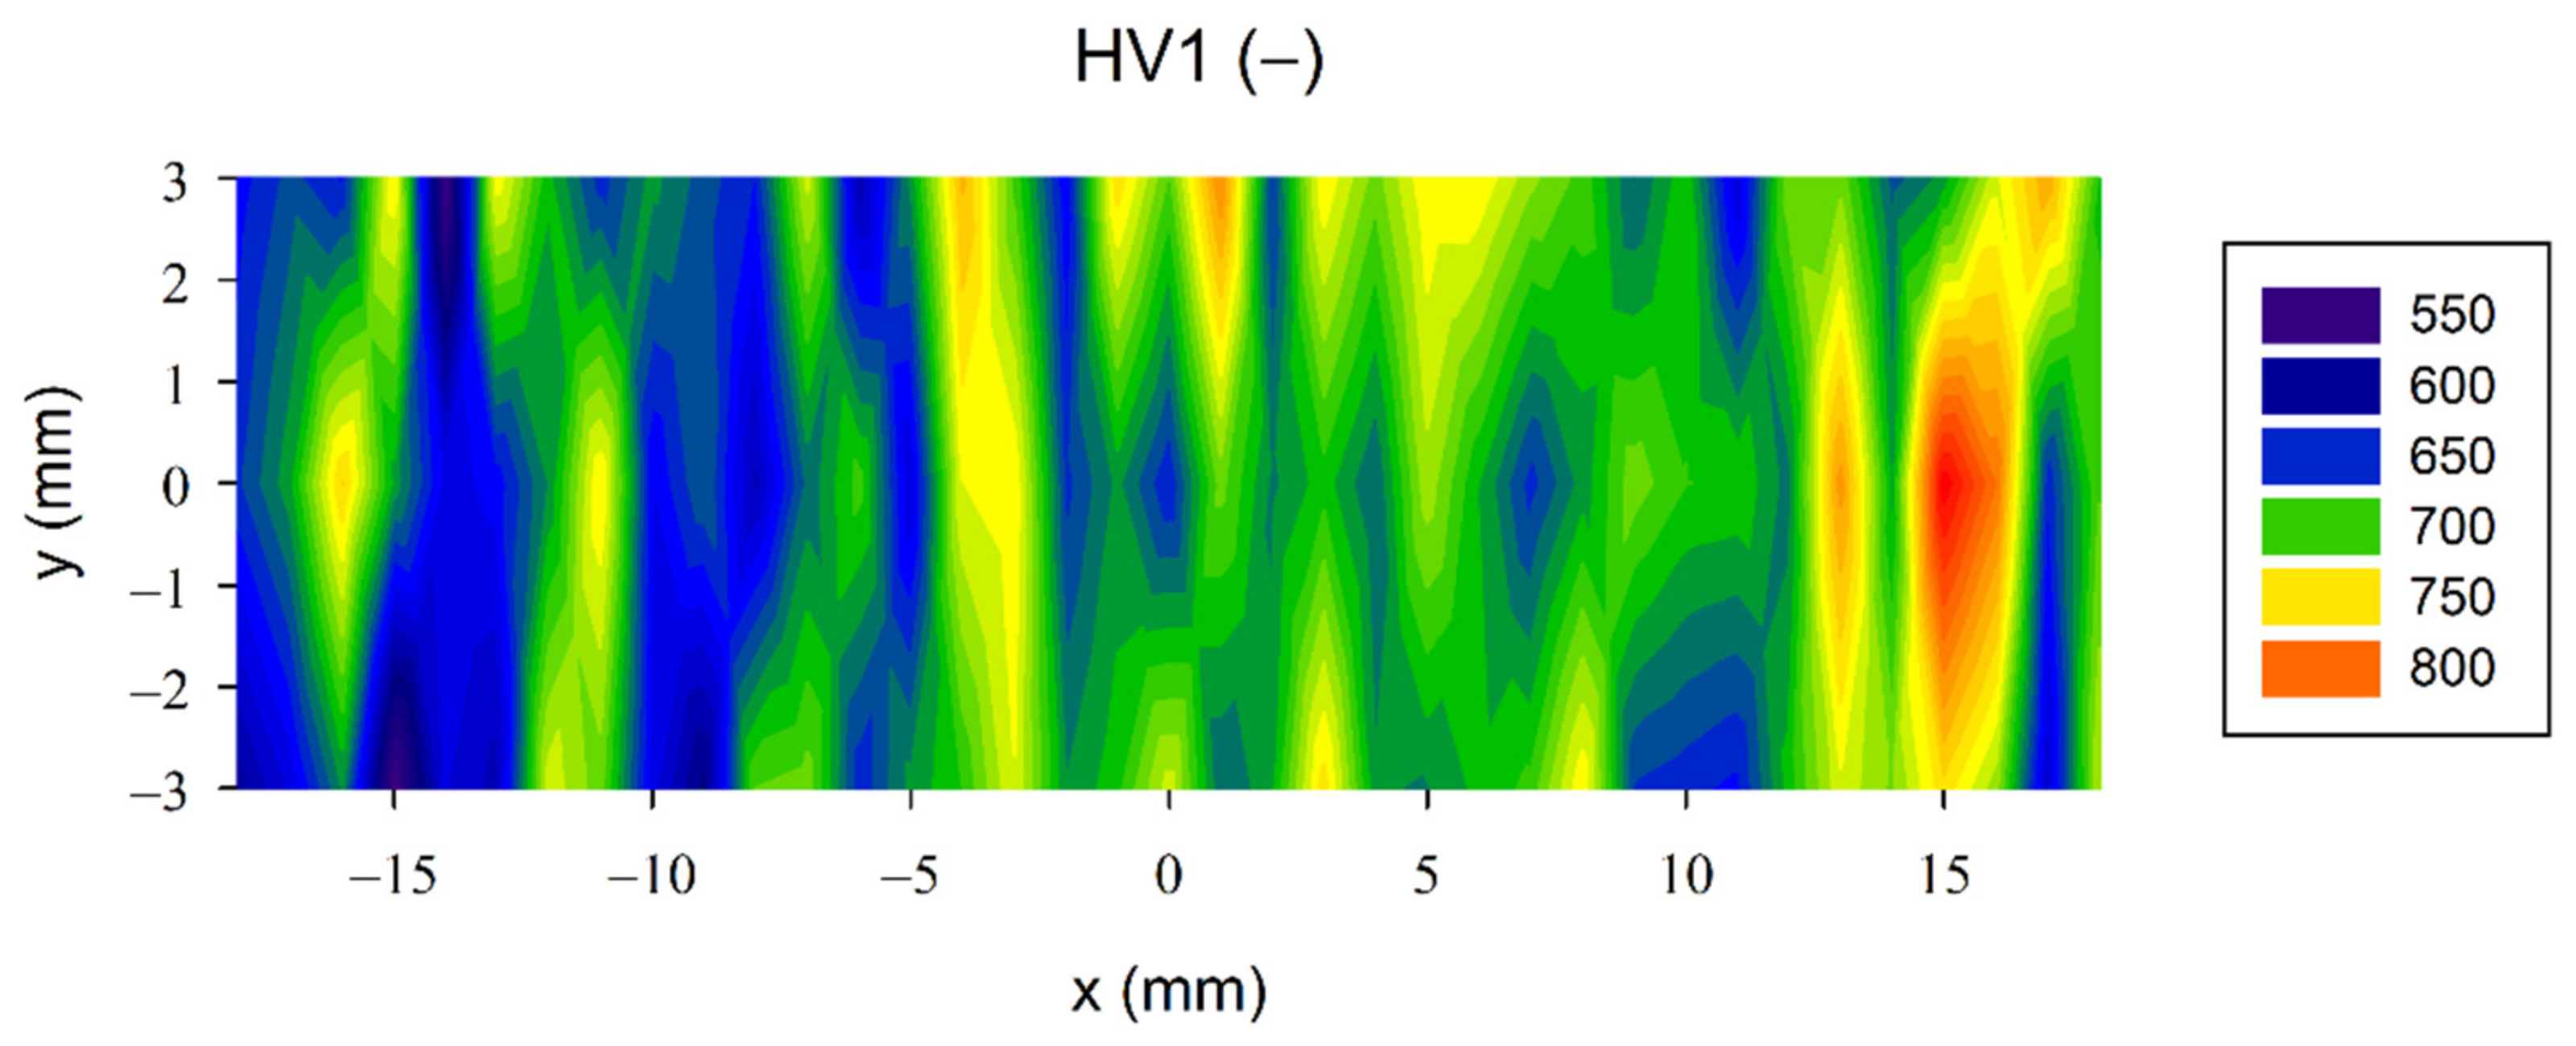
- Martensitic structure predominated, but a mostly ferritic structure was observed in the second cladded layer. It was confirmed that this area had a significantly lower hardness by about 200 HV. The decrease in hardness corresponded to annealing to a temperature of approximately 600 °C;
- The majority of alloying elements in the clad were not in the form of carbides. Carbides were confirmed only in the area with a mostly ferritic structure;
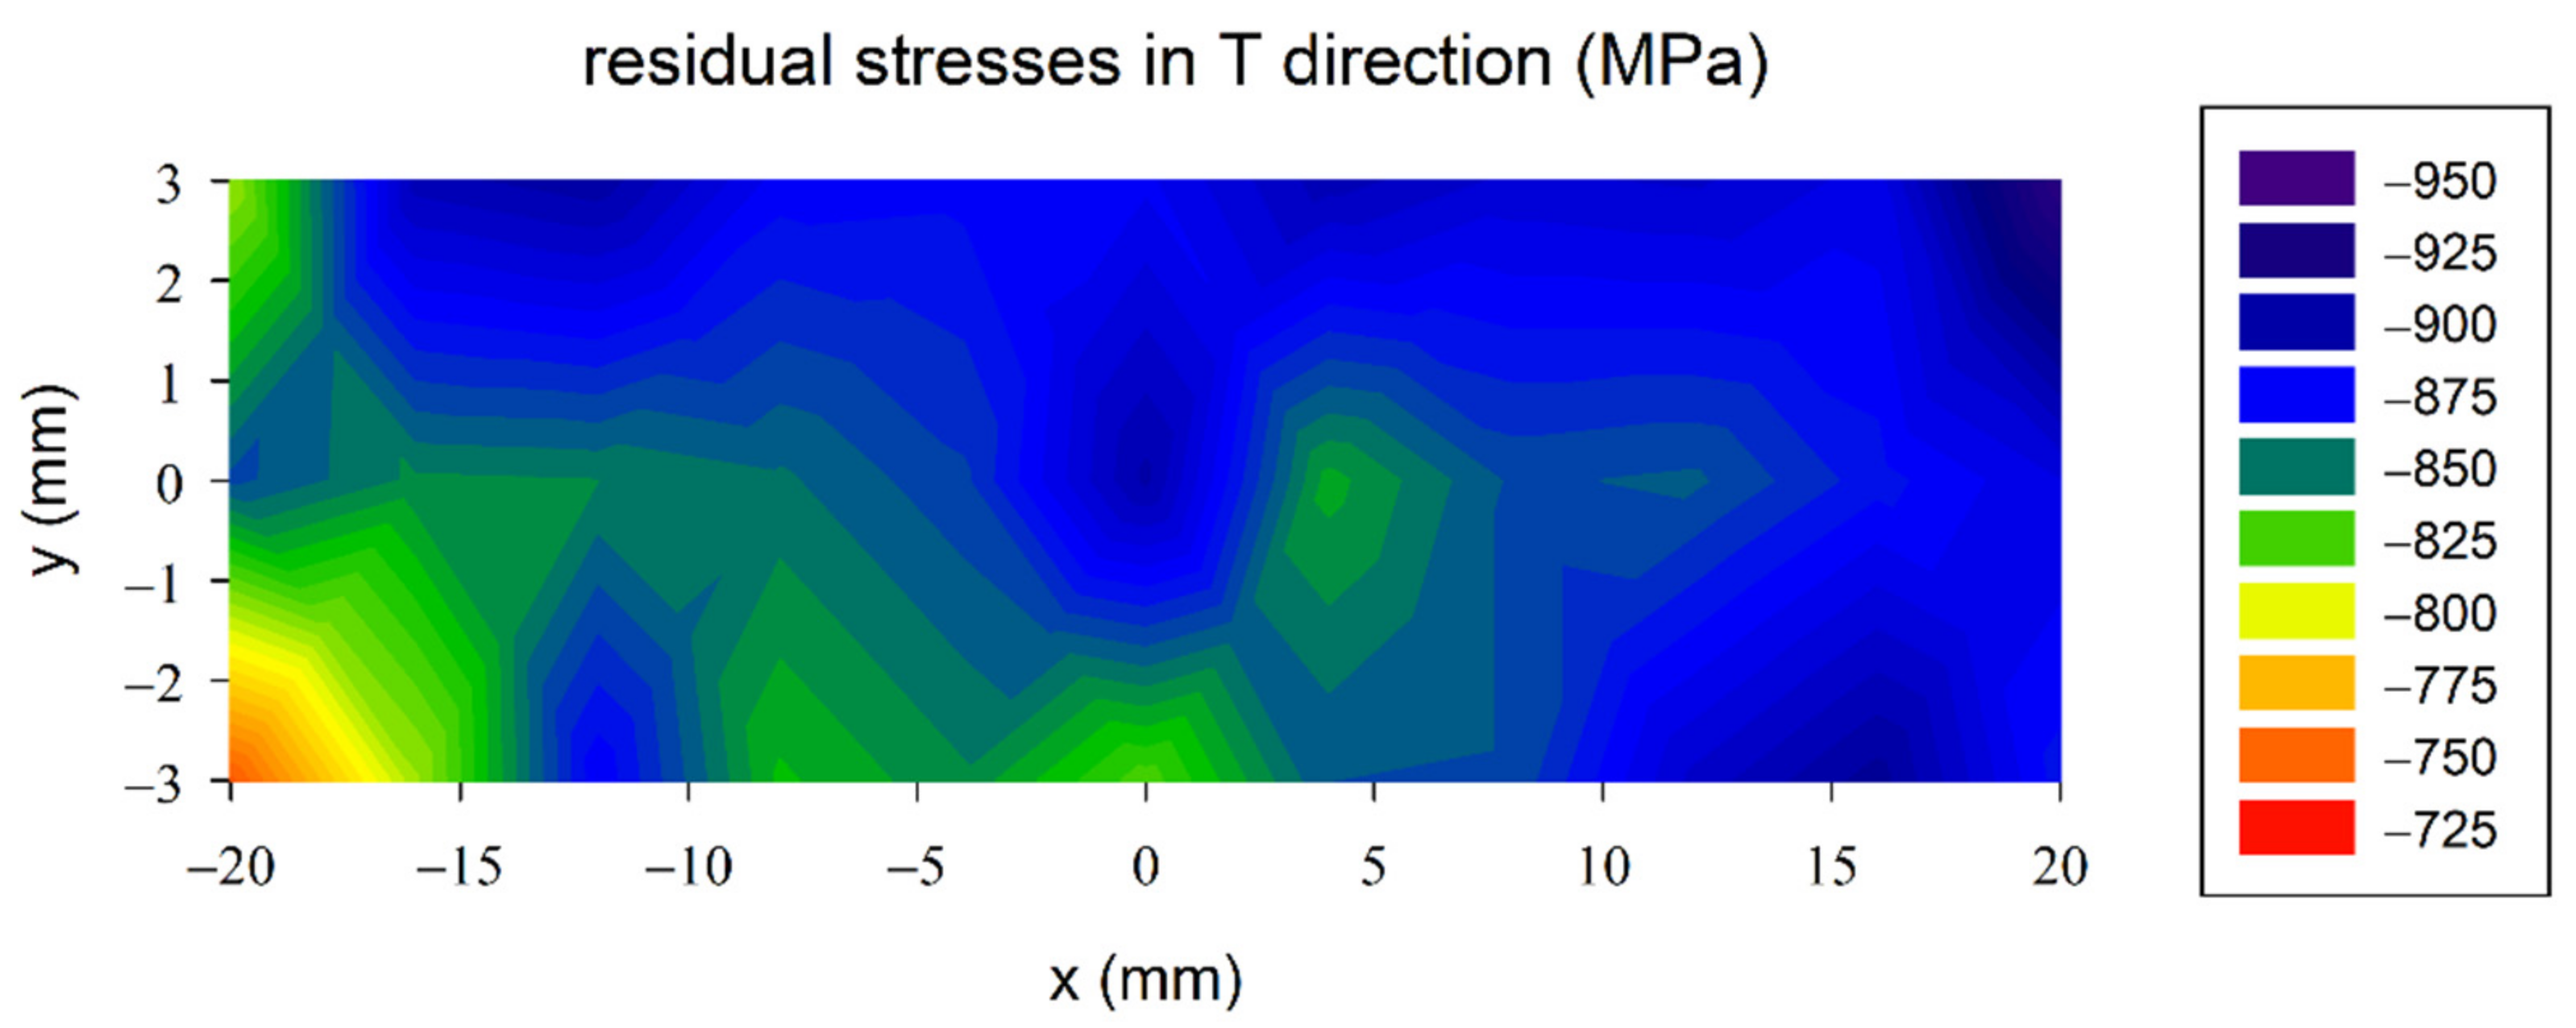
- A crack was observed on the surface of the clad, its propagation could be supported by tensile surface residual stresses in the T direction. The bulk compressive residual stresses in the T direction were characterised only at the interface between the clad and the base material;
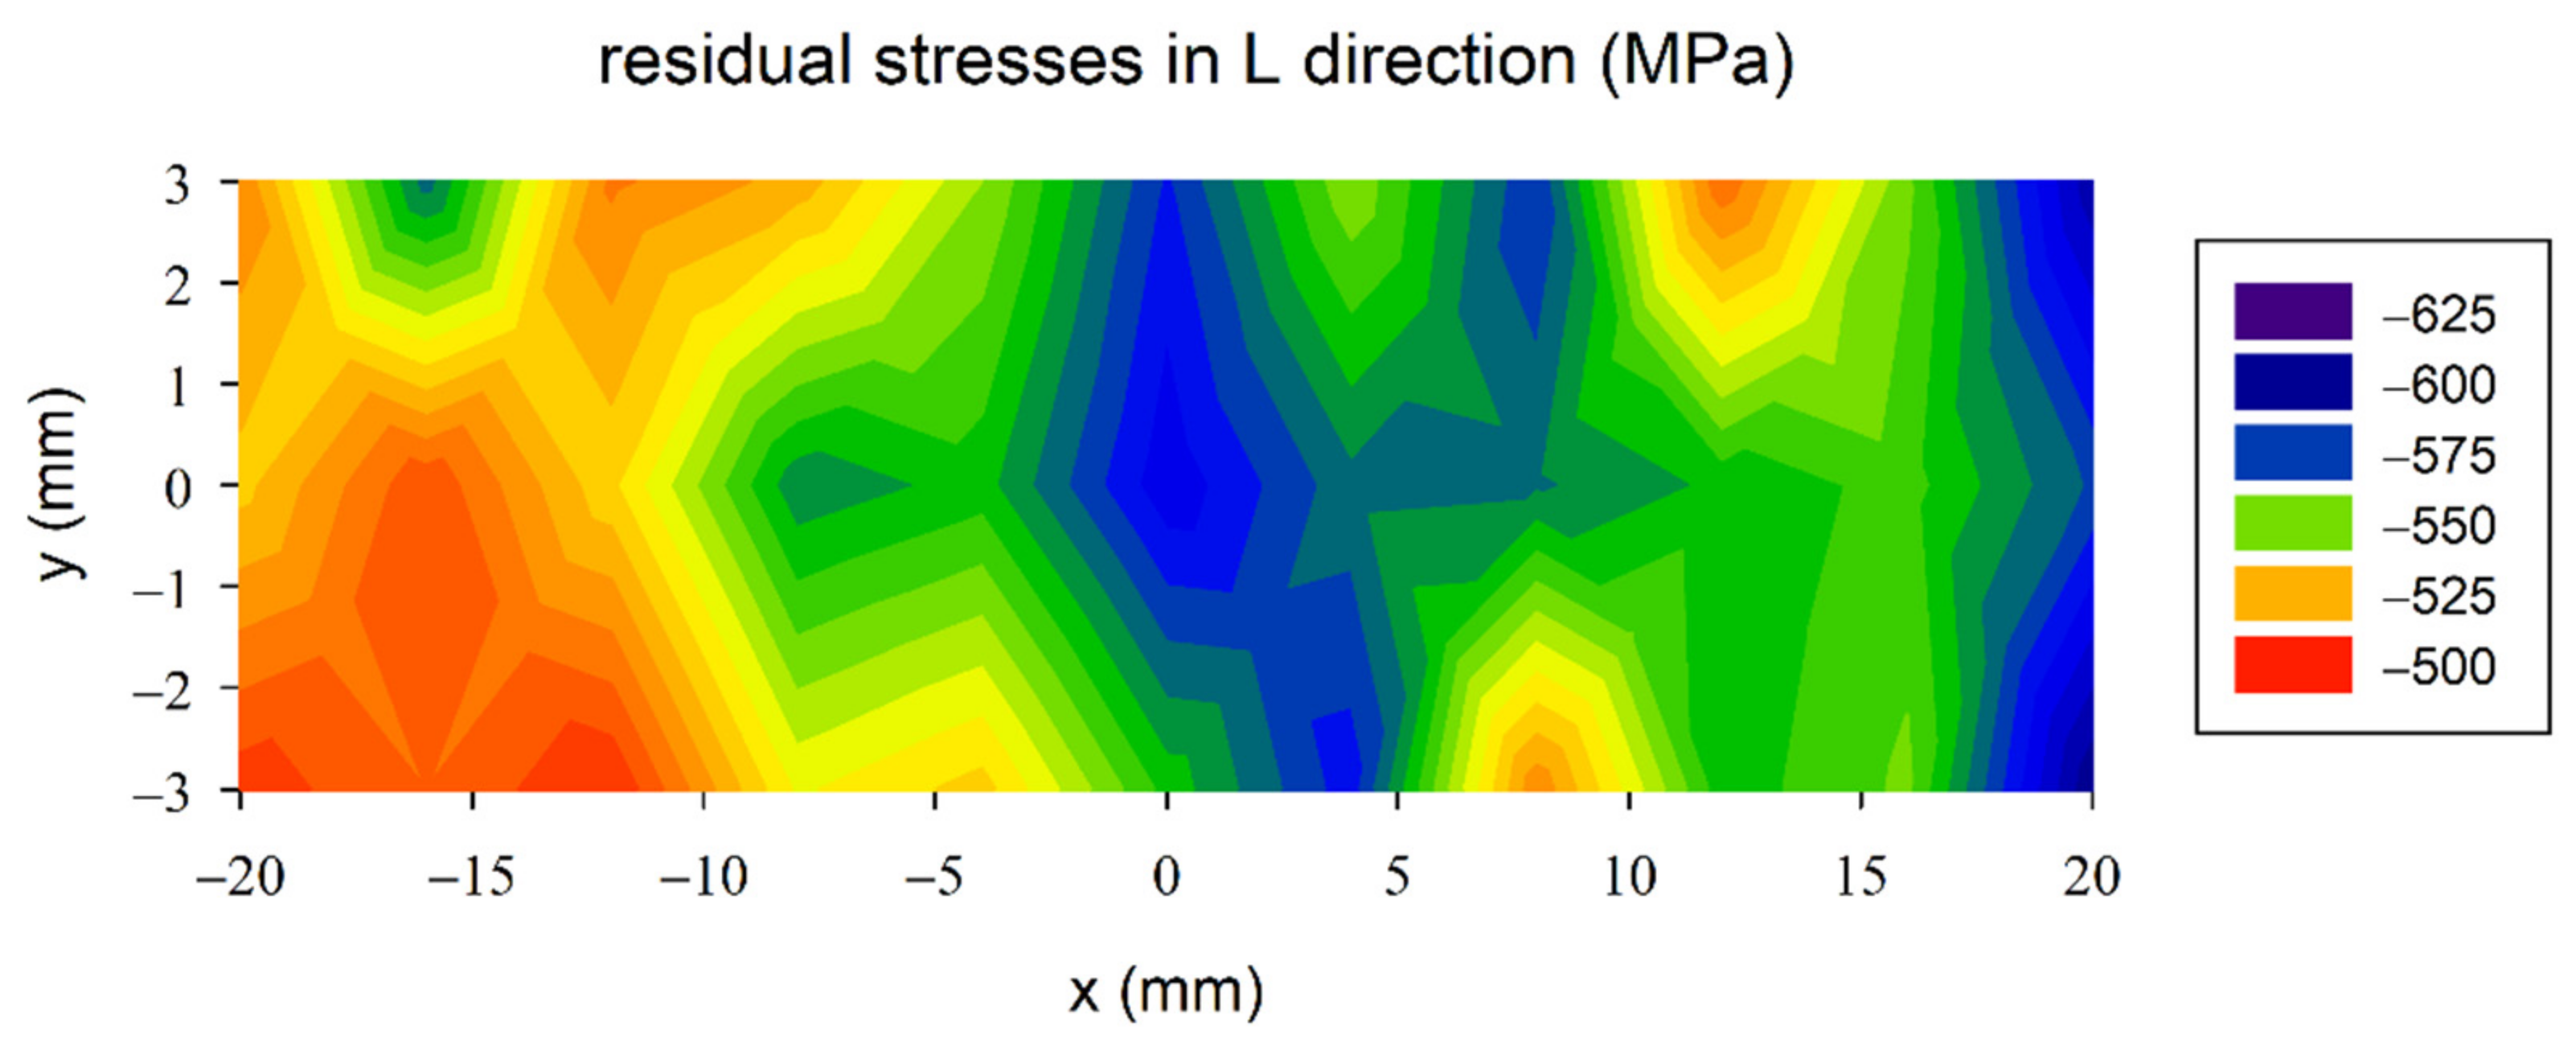
- Surface residual stresses reached mainly compressive values in the L direction; only at the edges, there were areas with tensile stresses. However, unfavourable bulk tensile stresses were determined using neutron diffraction in the clad in the L direction;
- The resulting wear resistance of the cladded volume was significantly affected by the hardness of the functional surface. In turn, it was shown that the hardness was significantly affected by the cladding process and also by the temperature reached during the cladding of the subsequent layers;
- The outer surface layer, which showed tensile surface residual stresses and cracks, was removed by grinding. Furthermore, surface compressive residual stresses were described in both directions on the ground surface, which is convenient from the point of view of component service life.
Author Contributions
Funding
Institutional Review Board Statement
Informed Consent Statement
Data Availability Statement
Conflicts of Interest
References
- Steen, W.M. Laser Material Processing, 3rd ed.; Springer: London, UK, 2003; pp. 349–369. [Google Scholar]
- Ocelík, V.; De Hosson, J.T.M. Thick metallic coatings by coaxial and side laser cladding: Processing and properties. In Advances in Laser Materials Processing Technology; Schaaf, P., Ed.; Woodhead Publishing Ltd.: Oxford, UK; CRC Press: West Palm Beach, FL, USA, 2010; pp. 426–458. [Google Scholar]
- Telasang, G.; Majumdar, J.D.; Wasekar, N.; Padmanabham, G.; Manna, I. Microstructure and mechanical properties of laser clad and post-cladding tempered AISI H13 tool steel. Metall. Mater. Trans. A 2015, 46, 2309–2321. [Google Scholar] [CrossRef]
- Shinde, M.S.; Ashtankar, K.M. Additive manufacturing–assisted conformal cooling channels in mold manufacturing processes. Adv. Mech. Eng. 2017, 9, 1–14. [Google Scholar] [CrossRef]
- Vedani, M.; Previtali, B.; Vimercati, G.M.; Sanvito, A.; Somaschini, G. Problems in laser repair-welding a surface-treated tool steel. Surf. Coat. Technol. 2007, 201, 4518–4525. [Google Scholar] [CrossRef]
- Zhu, L.; Wang, S.; Pan, H.; Yuan, C.; Chen, X. Research on remanufacturing strategy for 45 steel gear using H13 steel powder based on laser cladding technology. J. Manuf. Process. 2020, 49, 344–354. [Google Scholar] [CrossRef]
- Zhao, X.; Lv, Y.; Dong, S.; Yan, S.; He, P.; Liu, X.; Liu, Y.; Lin, T.; Xu, B. The effect of thermal cycling on direct laser-deposited gradient H13 tool steel: Microstructure evolution, nanoprecipitation behaviour, and mechanical properties. Mater. Today Commun. 2020, 25, 101390. [Google Scholar] [CrossRef]
- Roberts, G.A.; Kennedy, R.; Krauss, G. Tool Steels, 5th ed.; ASM International: Materials Park, OH, USA, 1998; pp. 67–107. [Google Scholar]
- Schwartz, R.A.; Field, D.P.; Adams, B.L.; Kumar, M.; Schwartz, A.J. Present state of electron backscatter diffraction and prospective developments. In Electron Backscatter Diffraction in Materials Science; Springer: Boston, MA, USA, 2009; pp. 1–20. [Google Scholar]
- Candel, J.J.; Amigó, V.; Ramos, J.A.; Busquets, D. Problems in laser repair cladding a surface AISI D2 heat-treated tool steel. Weld. Int. 2013, 27, 10–17. [Google Scholar] [CrossRef]
- Ferreira, D.F.; Vieira, J.S.; Rodrigues, S.P.; Miranda, G.; Oliveira, F.J.; Oliveira, J.M. Dry sliding wear and mechanical behaviour of selective laser melting processed 18Ni300 and H13 steels for moulds. Wear 2022, 488, 204179. [Google Scholar] [CrossRef]
- Köhler, H.; Partes, K.; Kornmeier, J.R.; Vollertsen, F. Residual stresses in steel specimens induced by laser cladding and their effect on fatigue strength. Phys. Procedia 2012, 39, 354–361. [Google Scholar] [CrossRef] [Green Version]
- Bhadeshia, H.K.D.H. Effect of materials and processing: Material factors. In Handbook of Residual Stress and Deformation of Steel; Totten, G., Howes, M., Inoue, T., Eds.; ASM International: Materials Park, OH, USA, 2002; pp. 3–10. [Google Scholar]
- Cottam, R.; Wang, J.; Luzin, V. Characterization of microstructure and residual stress in a 3D H13 tool steel component produced by additive manufacturing. J. Mater. Sci. Res. 2014, 29, 1978–1986. [Google Scholar] [CrossRef]
- Bailey, N.S.; Katinas, C.; Shin, Y.C. Laser direct deposition of AISI H13 tool steel powder with numerical modeling of solid phase transformation, hardness, and residual stresses. J. Mater. Process. Technol. 2017, 247, 223–233. [Google Scholar] [CrossRef]
- Chen, J.; Wang, S.; Xue, L. On the development of microstructures and residual stresses during laser cladding and post-heat treatments. J. Mater. Sci. 2012, 47, 779–792. [Google Scholar] [CrossRef]
- Nenadl, O.; Kuipers, W.; Koelewijn, N.; Ocelík, V.; De Hosson, J.T.M. A versatile model for the prediction of complex geometry in 3D direct laser deposition. Surf. Coat. Technol. 2016, 307, 292–300. [Google Scholar] [CrossRef]
- Trojan, K.; Ocelík, V.; Ganev, N.; Němeček, S.; Čapek, J. Effects of advanced laser processing on the microstructure and residual stresses of H13 tool steel. In Proceedings of the 55th International Scientific Conference on Experimental Stress Analysis 2017, Nový Smokovec, Slovakia, 30 May–1 June 2017; pp. 464–471. [Google Scholar]
- ISO 14577. Metallic Materials—Instrumented Indentation Test for Hardness and Material Parameters; ISO: Geneva, Switzerland, 2002. [Google Scholar]
- Oliver, W.C.; Pharr, G.M. Measurement of hardness and elastic modulus by instrumented indentation: Advances in understanding and refinements to methodology. J. Mater. Res. 2004, 19, 3–20. [Google Scholar] [CrossRef]
- Leoni, M. Whole powder pattern modelling: Microstructure determination from powder diffraction data. In International Tables for Crystallography, Volume H, Powder Diffraction; Gilmore, C.J., Kaduk, J.A., Schenk, H., Eds.; Wiley: Hoboken, NJ, USA, 2019; pp. 288–303. [Google Scholar]
- Orientation Imaging Microscopy (OIM); Software Version 7.3.0; User Manual; TSL, TexSEM Laboratories: Draper, UT, USA, 2015.
- Matěj, Z.; Kužel, R. MStruct—Software/Library for MicroStructure Analysis by Powder Diffraction. Available online: http://www.xray.cz/mstruct/ (accessed on 10 October 2021).
- Williamson, G.K.; Smallman, R.E., III. Dislocation densities in some annealed and cold-worked metals from measurements on the X-ray debye-scherrer spectrum. Philos. Mag. 1956, 1, 34–46. [Google Scholar] [CrossRef]
- Von Dreele, R.B. Powder diffration peak profiles. In International Tables for Crystallography, Volume H, Powder Diffraction; Gilmore, C.J., Kaduk, J.A., Schenk, H., Eds.; Wiley: Hoboken, NJ, USA, 2019; pp. 263–269. [Google Scholar]
- Murray, C.E.; Noyan, I.C. Applied and residual stress determination using X-ray diffraction. In Practical Residual Stress Measurement Methods; Schajer, G.S., Ed.; John Wiley & Sons: Chichester, UK, 2013; pp. 139–161. [Google Scholar]
- Mikula, P.; Vrana, M. High-resolution neutron diffraction for phase and residual stress investigations. In Fracture of Nano and Engineering Materials and Structures; Gdoutos, E.E., Ed.; Springer: Dordrecht, The Netherlands, 2006. [Google Scholar] [CrossRef]
- Randau, C.; Garbe, U.; Brokmeier, H.G. StressTextureCalculator: A software tool to extract texture, strain and microstructure information from area-detector measurements. J. Appl. Crystallogr. 2011, 44, 641–646. [Google Scholar] [CrossRef]
- Holden, T.M. Neutron diffraction. In Practical Residual Stress Measurement Methods; Schajer, G.S., Ed.; John Wiley & Sons: Chichester, UK, 2013; pp. 195–223. [Google Scholar]
- Wern, H.; Johannes, R.; Walz, H. Dependence of the X-ray elastic constants on the diffraction plane. Phys. Status Solidi 1998, 206, 545–557. [Google Scholar] [CrossRef]
- Chen, C.; Yan, K.; Qin, L.; Zhang, M.; Wang, X.; Zou, T.; Hu, Z. Effect of heat treatment on microstructure and mechanical properties of laser additively manufactured AISI H13 tool steel. J. Mater. Eng. Perform. 2017, 26, 5577–5589. [Google Scholar] [CrossRef]
- Mikami, Y.; Oda, K.; Kamaya, M.; Mochizuki, M. Effect of reference point selection on microscopic stress measurement using EBSD. Mater. Sci. Eng. 2015, 647, 256–264. [Google Scholar] [CrossRef]
- Dao, M.; Lu, L.; Asaro, R.J.; De Hosson, J.T.M.; Ma, E. Toward a quantitative understanding of mechanical behavior of nanocrystalline metals. Acta Mater. 2007, 55, 4041–4065. [Google Scholar] [CrossRef] [Green Version]
- Rowe, W.B. Thermal damage. In Principles of Modern Grinding Technology, 2nd ed.; Rowe, W.B., Ed.; William Andrew Publishing: Oxford, UK, 2013; pp. 113–122. [Google Scholar]
- Fan, Z. The grain size dependence of ductile fracture toughness of polycrystalline metals and alloys. Mater. Sci. Eng. A 1995, 191, 73–83. [Google Scholar] [CrossRef]


| Element | Fe | Cr | Mo | Si | V | Mn | C |
|---|---|---|---|---|---|---|---|
| Weight fraction (wt. %) | balanced | 4.75–5.50 | 1.10–1.75 | 0.80–1.25 | 0.80–1.20 | 0.20–0.60 | 0.32–0.45 |
Publisher’s Note: MDPI stays neutral with regard to jurisdictional claims in published maps and institutional affiliations. |
© 2022 by the authors. Licensee MDPI, Basel, Switzerland. This article is an open access article distributed under the terms and conditions of the Creative Commons Attribution (CC BY) license (https://creativecommons.org/licenses/by/4.0/).
Share and Cite
Trojan, K.; Ocelík, V.; Čapek, J.; Čech, J.; Canelo-Yubero, D.; Ganev, N.; Kolařík, K.; De Hosson, J.T.M. Microstructure and Mechanical Properties of Laser Additive Manufactured H13 Tool Steel. Metals 2022, 12, 243. https://doi.org/10.3390/met12020243
Trojan K, Ocelík V, Čapek J, Čech J, Canelo-Yubero D, Ganev N, Kolařík K, De Hosson JTM. Microstructure and Mechanical Properties of Laser Additive Manufactured H13 Tool Steel. Metals. 2022; 12(2):243. https://doi.org/10.3390/met12020243
Chicago/Turabian StyleTrojan, Karel, Václav Ocelík, Jiří Čapek, Jaroslav Čech, David Canelo-Yubero, Nikolaj Ganev, Kamil Kolařík, and Jeff T. M. De Hosson. 2022. "Microstructure and Mechanical Properties of Laser Additive Manufactured H13 Tool Steel" Metals 12, no. 2: 243. https://doi.org/10.3390/met12020243