
The Effect of Heavy-Duty Vehicle Crossings on the State of Stress of Buried Pipelines


1
Institute of Theoretical and Applied Mechanics of the Czech Academy of Sciences, v. v. i. Prosecká 809/76, 190 00 Prague, Czech Republic
2
SVÚM a. s., Tovární 2053, 250 88 Čelákovice, Czech Republic
3
CEPS a. s., Belnická 628, 252 42 Jesenice, Czech Republic
*
Author to whom correspondence should be addressed.
Metals 2022, 12(1), 153; https://doi.org/10.3390/met12010153
Submission received: 9 December 2021
/
Revised: 6 January 2022
/
Accepted: 11 January 2022
/
Published: 14 January 2022
(This article belongs to the Special Issue Mechanical, Crack and Fatigue Properties of Tool Steel, Pipe Steel, and Laser Welded Steel)
Abstract
:The aim of this article is to quantify the loads exerted by heavy-duty vehicles when crossing over buried pipeline. This problem arises in connection to the question pertaining to the use of protective sleeves (casings) applied to gas pipelines in regions with increased demands on pipeline operation safety. An experiment was conducted on a test pipe section made from L360NE pipeline steel equipped with strain gauges along the pipe perimeter, measuring strains in the axial and circumferential directions. Strain measurements were taken after back-filling the pipe trench, then during vehicle crossings over the empty pipe, and again after pressurizing the test pipe with air. Strain-based hoop stresses at the surface of the empty test pipe were found to exceed 30 MPa after back-filling the trench and increased to more than 40 MPa during the vehicle crossings. Similarly, axial stresses reached extremes of around 17 MPa in compression and 12 MPa in tension. Applying internal air pressure to the test pipe resulted in a reduced net effect on both the hoop and axial stresses.
1. Introduction
A very important aspect of ensuring the safe operation of gas pipelines is diagnostics pertaining to defects in the pipe wall and the subsequent determination of failure pressure [1]. For a long time, discussions have been ongoing in the gas production community about increasing the safety of pipelines by installing protective sleeves (casings) on high-pressure gas pipelines. Protective sleeves are one of the safety elements that can reduce the risk of serious damage to gas pipelines [2]. Because protective sleeves can protect gas pipelines from the heavy loads caused by vehicles and trains, they have become a subject of attention for pipeline safety authorities [3] and have found their place in international standards, e.g., [4]. Special protective sleeves can also be used in permafrost conditions [5]. Protecting the long-term integrity of gas pipelines through the use of protective sleeves at highway and railroad crossings not only minimizes the risk of pipeline ruptures but also reduces the risk of damage to roadways and nearby structures [6]. It is therefore not surprising that most research indicates the benefits of using protective sleeves. However, some researchers emphasize the negative effect they may have on the corrosion of a pipeline, e.g., [7,8,9]. This can be particularly important when cathodic corrosion protection is applied to a pipeline. In this case, protective sleeves may act as a shield preventing the flow of the cathodic protection current to the pipeline. On the other hand, it should be pointed out that where a pipeline is not cathodically protected, suitable end seals may be used to keep the pipeline inside the sleeve dry; this will ensure freedom from corrosion. At present, there is a tendency in the Czech Republic to limit the use of protective sleeves as much as possible and to reserve them solely for unavoidable cases.
In order to obtain some experimental data regarding stresses in a pipe wall due to crossing over a buried pipe with a heavy vehicle, and thus to provide a certain basis for decision making about the use of protective sleeves, the strain gauge technique was used to measure strains on the outside surface of a test pipe during vehicle crossings. A test pipe section, 6 m in length, was prepared from a longitudinally welded pipe made from L360NE linepipe steel, 508 mm in outside diameter and 6.3 mm in wall thickness. The ends of the test pipe were closed by torispherical heads. Basic mechanical properties, as given in the certificate of inspection, are presented in Table 1.
T-type strain gauges were glued to the pipe wall at two cross sections (one-third and one-half of the total length) and corresponding to the 3, 6, 9, and 12 o’clock positions along the pipe circumference. A schematic of the strain gauge positions is shown in Figure 1.
Only sections A and B were actively used on the buried test pipe. Section B was chosen for continuous strain measurement during all experiments with a strain sampling frequency f = 0.2 Hz. Strain measurement at section A was only actuated during specific parts of the experiments, and strain measurements on section C were done in a previous laboratory experiment which aimed at determining the effect of welded heads on the state of stress in the near-weld area. The test pipe was placed into a trench in such a way that the backfill cover fulfilled the requirements of the Czech Gas Standard TPG 702 04 [10] for pipe segments passing through critical areas. A section of the trench with the buried test pipe is shown in Figure 2. Some details of the experimental procedure and measured strains are presented in [11,12].
A view of the test pipe in the sand sub-base prior to backfill is shown in Figure 3.
2. Results of Strain Gauge Measurements
On the whole, three crossings with a MAN truck were made. Because of the limited space surrounding the buried pipe, only two axles of the truck were used. The load of the front axle was G1 = 6540 kg and that of the rear axle was G2 = 7560 kg. The wheel spacing was 1.99 m and the bogie wheelbase was 1.81 m. Each crossing was realized in two steps. Step I: the truck moved perpendicularly to the pipe axis at a speed of ~3 km/h and stopped when the front axle reached the pipe. Following Figure 1, the position of the truck was such that the left-hand wheels of the truck moved above section B. Step II: the truck moved forward by about 1.2 m and stopped. At this point, the front axle was 1.2 m ahead of the pipe axis, and the rear axle was about 0.61 m behind the pipe axis. After a few seconds the truck was moved back to its starting position.
During the first crossing, the test pipe was left empty. During the second crossing the pipe was pressurized with air to 5.5 MPa. The third crossing was realized the next morning when the ambient temperature had decreased and the air pressure in the pipe had dropped to 5.2 MPa. The results of the strain measurements are presented in Table 2 (first crossing), Table 3 (second crossing), and Table 4 (third crossing). Because the strain gauges were set to zero when the pipe was buried, the strains in Table 1 for no load correspond to the situation after backfilling.
The hoop (circumferential) and axial strains from Table 2, Table 3 and Table 4 were used to determine hoop stresses σφ and axial stresses σx according to Equations (1) and (2), respectively.
The results obtained are presented in Figure 4, Figure 5, Figure 6, Figure 7, Figure 8 and Figure 9.
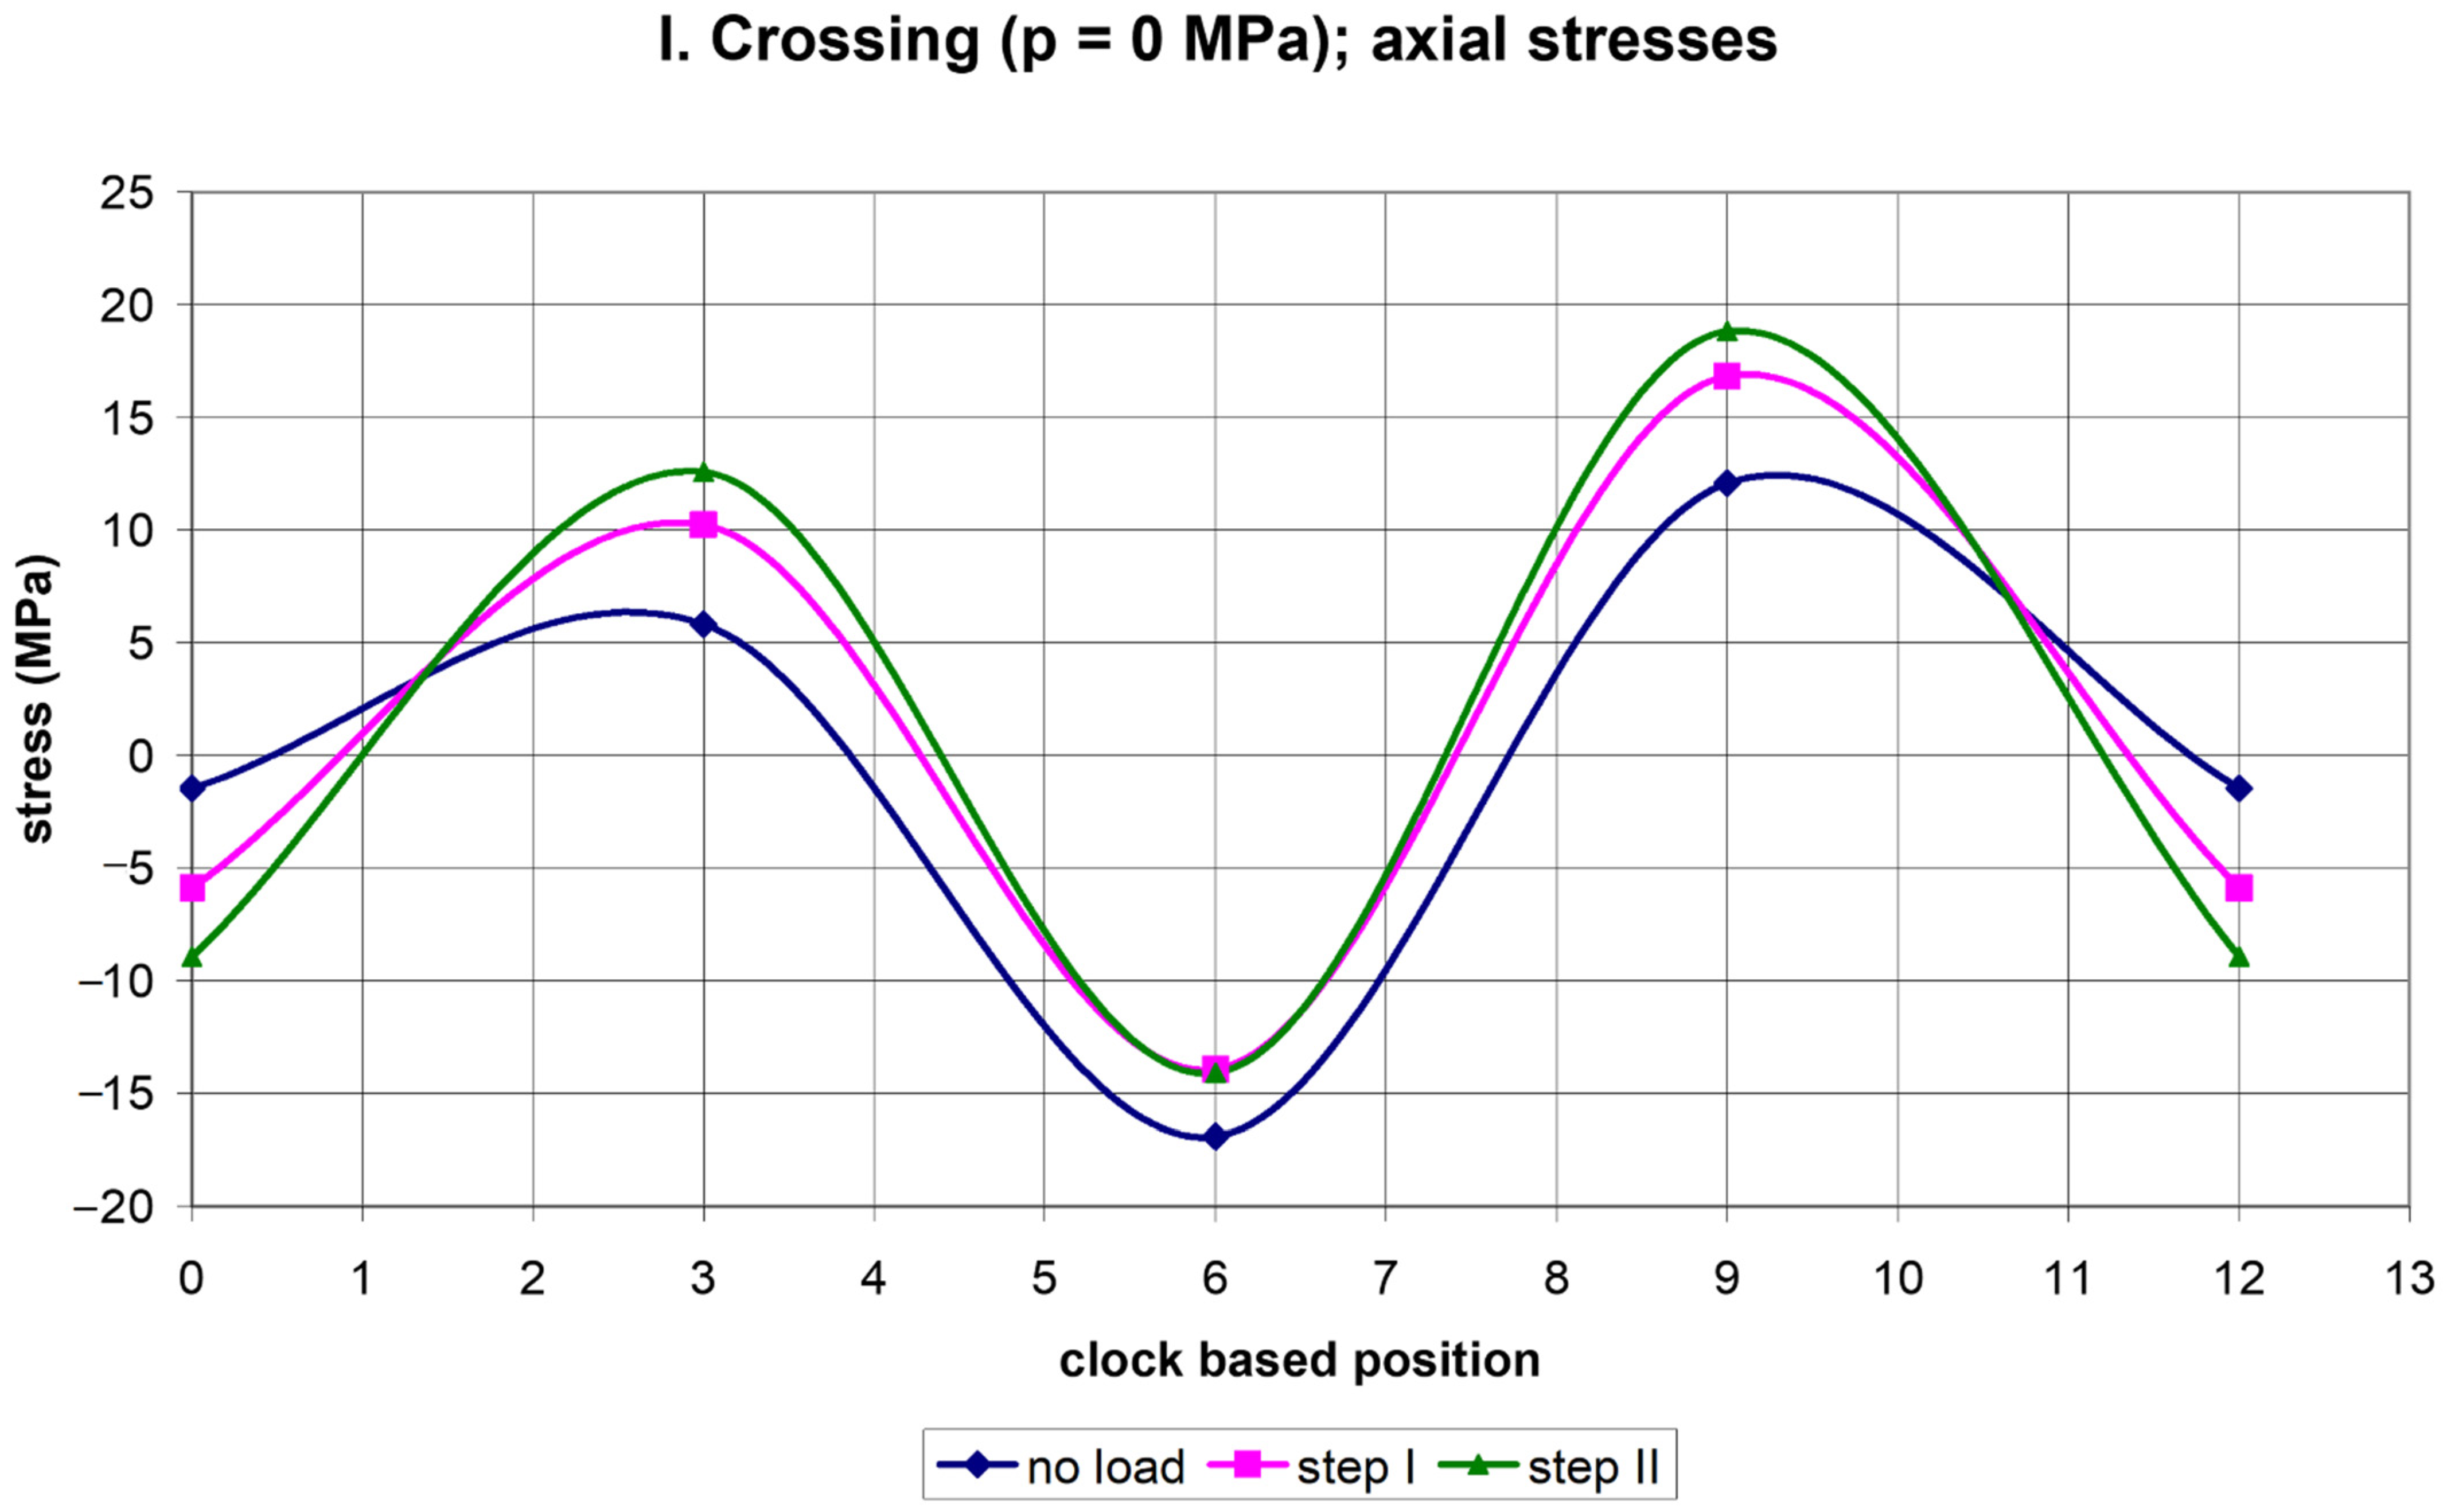
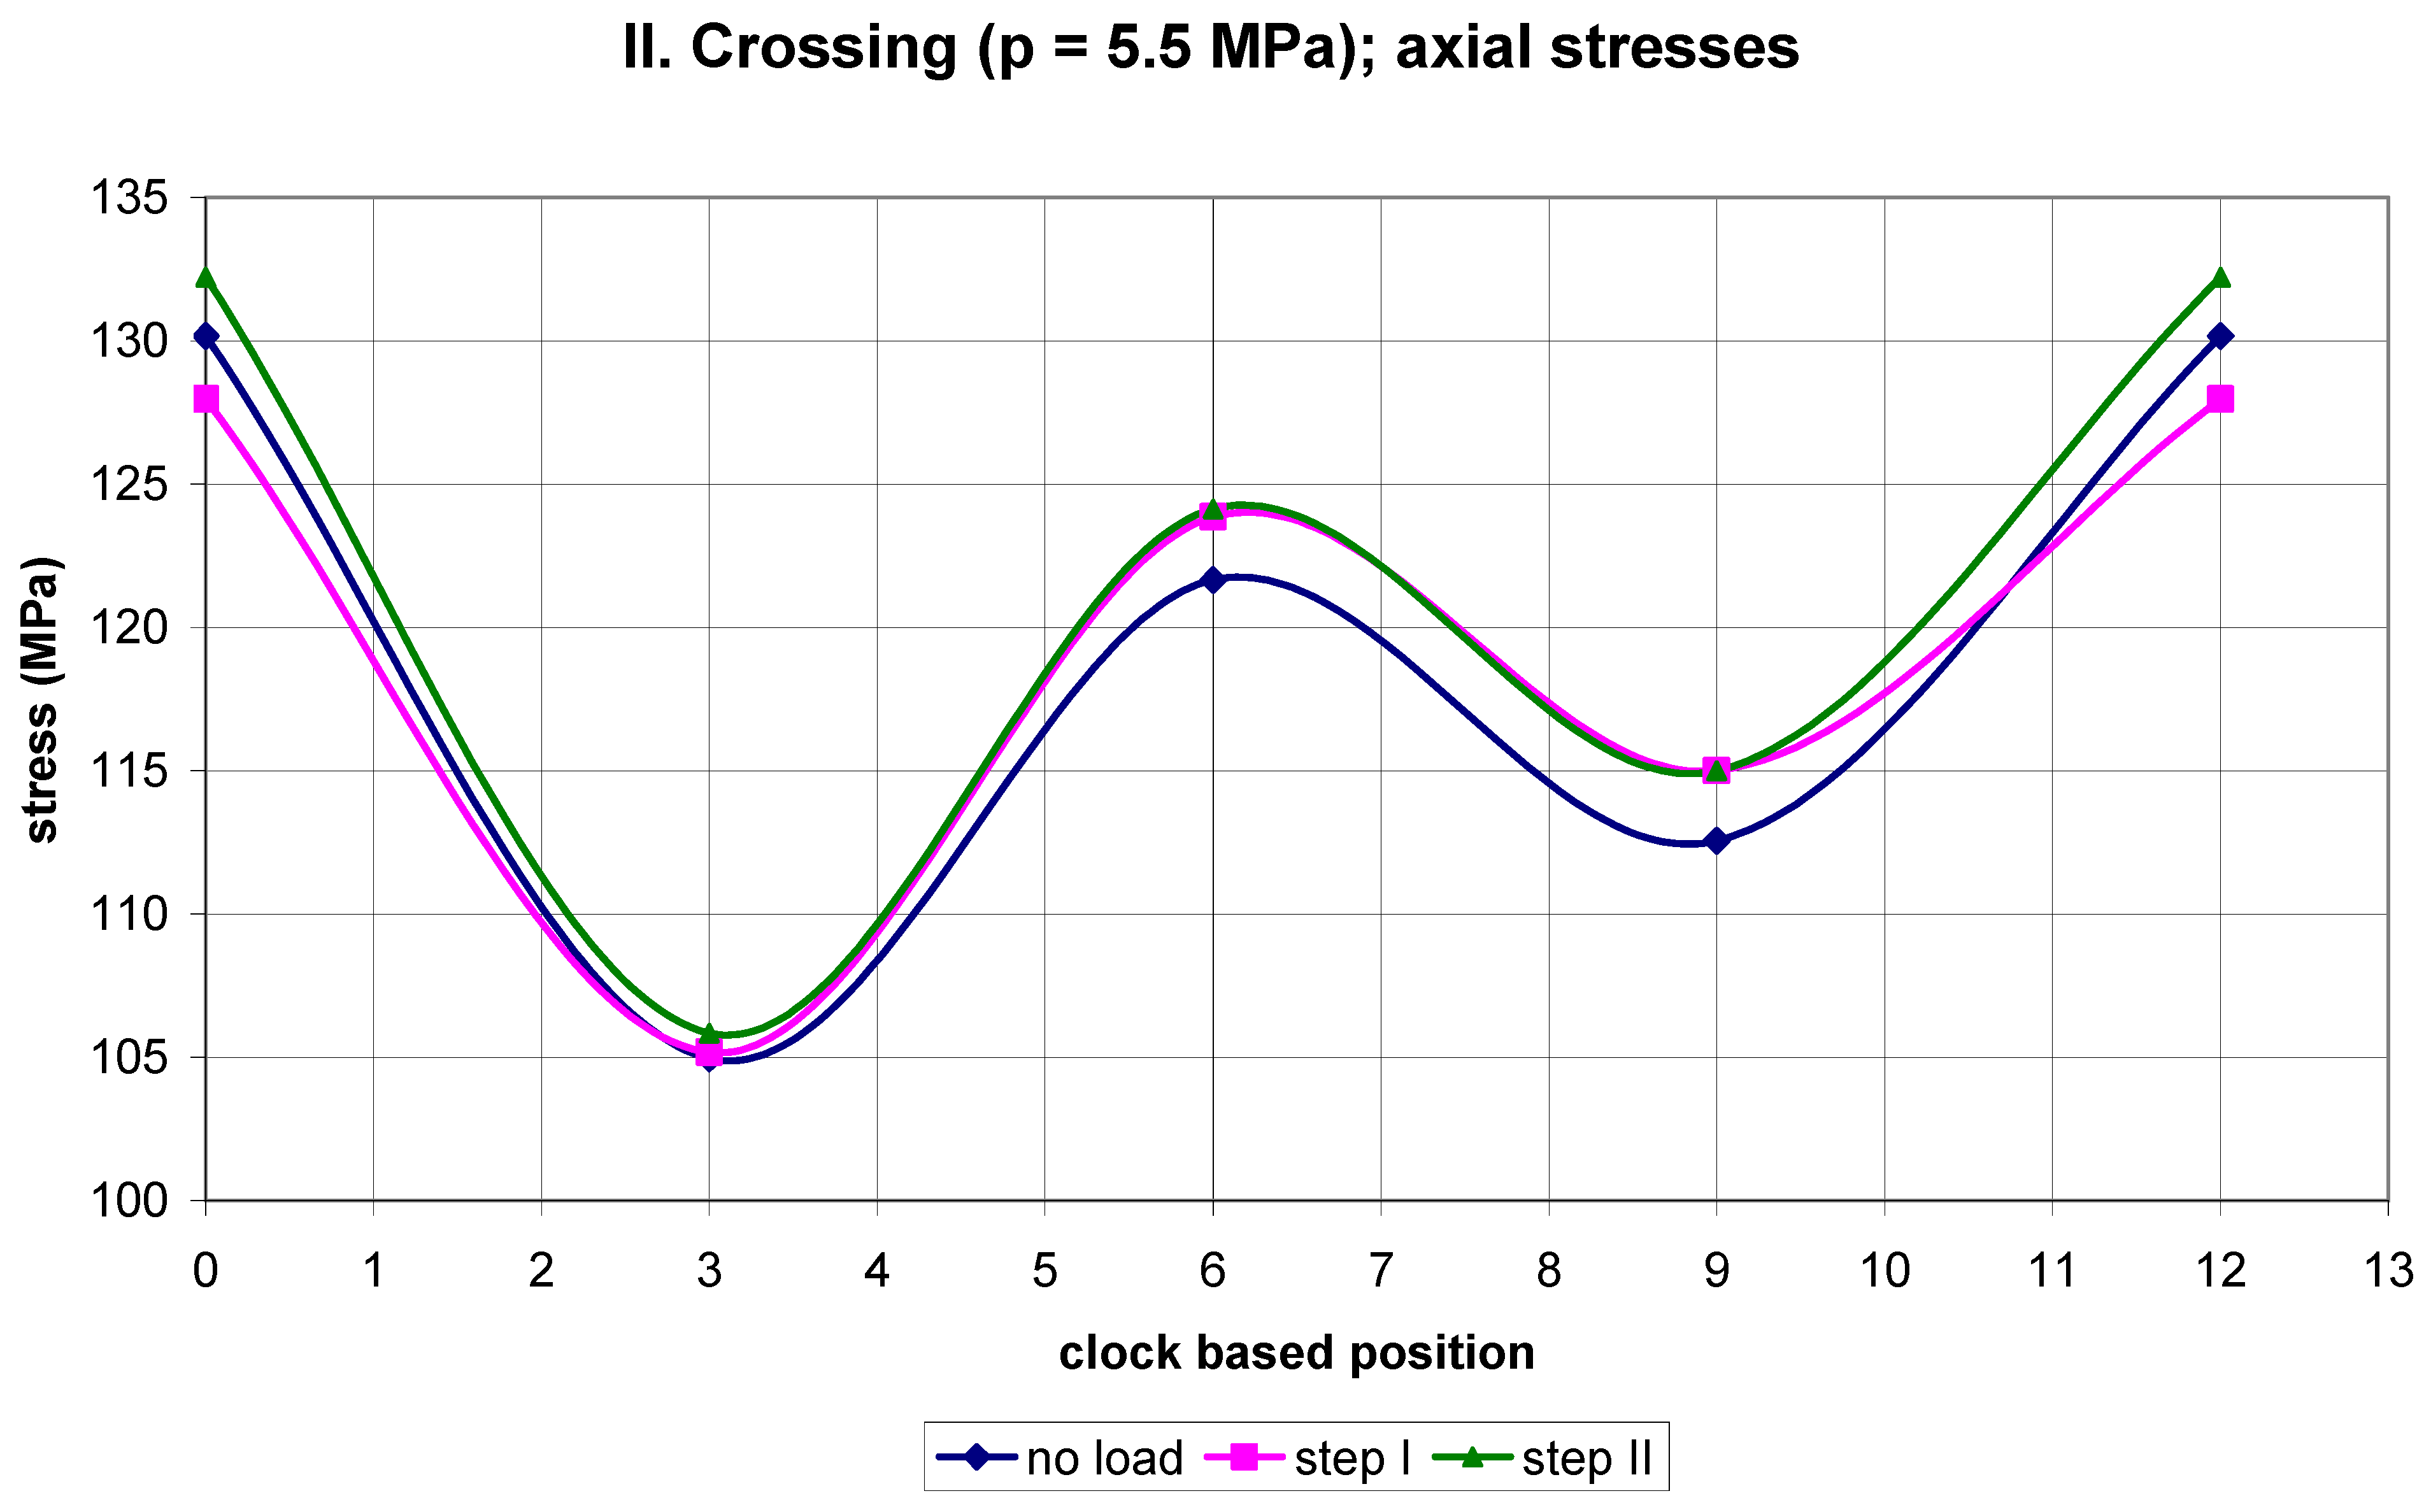
It is seen in Figure 4 that, besides loading steps I and II, there are also non-zero hoop stresses for the no-load situation. These stresses are caused by the backfill mass. All three loading states corresponding to step I, step II, and the no-load situation exhibit the same character of hoop stress variation along the circumference. There are compressive stresses at the 6 and 12 o’clock positions and tensile stresses at the 3 and 9 o’clock positions. As expected, the highest hoop-stress magnitudes were experienced when loading was realized in step II. It should be pointed out that the net effect of the truck load on the state of stress can be determined by subtracting the stress due to the backfill from the actual stress caused by steps I and II.
When we do this, we obtain the diagrams illustrated in Figure 10, Figure 11, Figure 12, Figure 13, Figure 14 and Figure 15. They show variations of the net stresses along the pipe circumference caused by the truck crossings. In the following text these stresses will be called differential stresses.
A certain regularity in the variation of differential stresses along the pipe circumference can be observed in Figure 10 and Figure 11. This regards an empty pipe (I. crossing). In step II, the hoop stress reaches a maximum tensile stress of ~8 MPa at the 3 and 9 o’clock positions and a maximum compressive stress of ~7 MPa at the 12 o’clock position. Additionally, in step II the axial stress reaches a maximum tensile stress of ~7 MPa at the 3 and 9 o’clock positions and a maximum compressive stress of ~7.5 MPa at the 12 o’clock position. The application of 5.5 MPa of pressure (II. crossing) impairs this regularity and reduces the maximum tensile stress in the hoop direction to ~3 MPa at the 12 o’clock position in step II, and the maximum compressive stress in the hoop direction to ~1 MPa at the 6 o’clock position in step I. The axial differential stress exhibits maxima in tension and compression at the level of ~2 MPa. An overnight break with a reduced ambient temperature and a subsequent decrease in pressure to 5.2 MPa (III. crossing) restored, to some extent, the regularity in the differential hoop stress variation along the pipe circumference. However, the differential axial stress exhibited only limited regularity for step I and practically no regularity for step II. In step I the maximum tensile hoop stress was ~3 MPa, and the maximum compressive hoop stress was ~4.5 MPa. Additionally, in step I the maximum tensile axial stress was ~3.5 MPa, and the maximum compressive axial stress was ~5.5 MPa. The magnitudes of all these stresses are summarized in Table 5.
Finally, it can be stated that the effect of driving a truck over a buried pipe, with two axles having mass loads of G1 = 6540 kg and G2 = 7560 kg, is negligible with regards to the state of stress of the pipe, provided that the backfill cover is 1.5 m or greater. This is particularly valid for pressurized pipes, as in the case of high-pressure gas pipelines. It is understood that a real gas pipeline, with its length being multiple times greater than that of the test pipe, will experience somewhat different boundary conditions. However, it can be assumed that the actual magnitudes of the surface stresses will not differ much from the results presented here. It is also clear that the effect of driving a heavy vehicle over a buried pipe will be greater the larger the mass of the vehicle and the smaller the backfill cover.
3. Engineering Estimation of the State of Stress of a Buried Pipe
3.1. Backfilling of a Soil
In order to compare the surface stresses as determined on the basis of the measured strains with the stresses calculated by the soil-mechanics approach, we shall calculate the vertical load due to the weight of the soil constituents above the buried test pipe, and consequently we shall determine the respective stresses. Recalling Figure 2, the pressure of the soil cover on the test pipe, pz, can be determined by Equation (3):
where g is gravitational constant, ρi is mass density of the i-th soil constituent and hi is height of the i-th layer of the soil cover. Proceeding from the surface of the soil cover towards the test pipe, we shall consider magnitudes of the mass density and the height of the soil constituents shown in Table 6.
After substituting these values into Equation (3), and considering g = 9.81 m/s2, we arrive at pz = 27,154 kg/m/s2 = 0.02715 MPa. This pressure is only valid at the 12 o’clock position though. At the 6 o’clock position, the pressure will be higher by a magnitude of pG = 765 Pa, which corresponds to the weight of the test pipe. Therefore, the total pressure at the 6 o’clock position will be p’z = pz + pG = 0.027915 MPa.
Under the pressure of backfill soil, a buried pipe tends to ovalize. Owing to ovalization, a bending stress is formed through the wall thickness: compressive stress at the outside surface and tensile stress at the inside surface at the 6 and 12 o’clock positions. The stress at the 3 and 9 o’clock positions is distributed conversely, i.e., tensile stress at the outside surface and compressive stress at the inside surface. As shown in [13], the bending stress at the 6 and 12 o’clock positions depends on the relative flattening of the pipe (Δy/D), given by Equation (4):
where:
- Δy = vertical deflection of pipe, (mm)
- D = pipe outside diameter, (mm)
- dl = deflection lag factor (~1.0–1.5),
- db = bedding constant (~0.1),
- pz = pressure on pipe due to soil load, (MPa)
- (EI)eq = equivalent pipe wall stiffness as composed of the stiffness of the bare pipe (EI), lining (ELIL) and coating (ECIC) per mm of pipe length, (Nmm)
- I = t3/12, [mm3]
- t = wall thickness of pipe, (mm)
- r = mean pipe radius, (mm)
- E′ = modulus of soil reaction, (MPa)
Values of E′ vary from close to zero for dumped, loose, fine-grained soil to 20 MPa for highly compacted, course-grained soil. For the pipe considered, the bedding constant db obtains the value 0.102, and the deflection factor dl obtains the value 1.0. The modulus of soil reaction is taken as E′ = 9.4 MPa. After substituting these values into Equation (4) we arrive at Δy/D = 0.00328. As a matter of interest, it can be determined that the vertical deflection of the pipe is Δy = 0.00328 × 508 = 1.67 mm. At the 6 o’clock position, the ratio Δy/D will be greater than that at the 12 o’clock position, namely by the ratio p’z/pz = 0.027915/0.02715, thus resulting at Δy/D = 0.00337. The bending stress σb through the wall thickness due to ovalization of the pipe is given by Equation (5),
where E is modulus of elasticity of pipe, (MPa).
The magnitude of the bending stress σb as calculated by Equation (5) is ±33.5 MPa at the 12 o’clock position and ±34.4 MPa at the 6 o’clock position.
3.2. Crossing the Buried Pipe with the Vehicle
The problem refers to determination of the pressure acting on the buried pipe due to a concentrated surface load G, as shown in Figure 16.
Denotation of the symbols in Figure 16:
- pV pressure transmitted to the pipe, (MPa)
- G concentrated load at the surface above pipe. (N)
- h depth of soil cover above the pipe, (mm)
- d offset distance from the pipe to the line of application of the surface load, (mm)
As shown in literature (e.g., [14,15]) the magnitude of pressure transmitted to the pipe is given by the Boussinesq Equation (6)
This equation was used to calculate pressures transmitted to the test pipe when it was crossed by the MAN truck. It corresponds to the situation of the first crossing (p = 0 MPa).
Let us now consider the loading at Step I and Step II. It has already been mentioned that in the crossings of the test pipe by the truck, the left-hand wheels of the truck moved above section B (Figure 1) where the strain gauges were placed. The right-hand wheels moved 1.99 m off section B. Their effect on the pressure transmitted to the pipe at section B was neglected. As follows from Equation (6), this results in about 10% reduction in the pressure acting on the pipe at section B. The positions of the left-hand wheels relative to the pipe are schematically illustrated in Figure 17.
The mass load acting on a single wheel of the front axle is denoted here by the symbol Q1, and its magnitude is G1/2 = 6540/2 = 3270 kg = 32,079 N. Similarly, the mass load acting on a single wheel of the rear axle is denoted here by the symbol Q2, and its magnitude is G2/2 = 7560/2 = 3780 kg = 37,082 N.
3.2.1. Step I
The front axle is above the pipe with its left-hand wheel above the location of the strain gauges (section B). The rear axle is 1.81 m from the front axle. The horizontal distance of the left-hand wheel of the front axle from the pipe axis is d = 0 m, whilst that of the left-hand wheel of the rear axle is d = 1.81 m. The pressures at a point which result from more than one surface load are obtained by superposition. Therefore, after summing up the effects of the left-hand wheels of both axles, we arrive, according to Equation (6), at
3.2.2. Step II
According to Figure 17, the distance of the front axle from the pipe axis is d = 1.2 m, and that of the rear axle is d = 0.61 m. The pressure transmitted to the pipe is
Pressures transmitted to the pipe (pV) have the same effect locally as those of the backfill cover, so that at the 6 and 12 o’clock positions there is compression at the outside surface of the pipe and tension at the inside surface of the pipe.
In order to determine the through-wall bending stress σb in the buried pipe in step I and step II loading, the respective pressure pV transmitted to the pipe is substituted into Equation (4) to obtain the pipe ovality Δy/D, which is then substituted into Equation (5). Considering the following magnitudes: db = 0.102, dl = 1.0, EI = 4.293 × 10⁶ Nmm, r = 251 mm, and E′ = 9.4 MPa, we can arrive at
- for step I loadingfor step II loading
3.3. Summary
The main results of the experimental determination of stresses in the wall of the test pipe (based on strain measurements) and their comparison with the results of calculations are presented in Table 7. Only the stresses in the circumferential direction σφ are concerned.
As can be seen from Table 7, the circumferential surface stresses due to the soil load, as determined by the strain gauge measurements, are somewhat less than those calculated by soil mechanics. For step I loading, the experimental hoop stress was only one third of the calculated through-wall bending stress, whilst for step II loading, the experimental hoop stress almost reached the calculated value. It should be noted that these results were obtained for an empty test pipe. The differences in hoop stresses in this situation, as determined both by the strain gauge measurements and by soil mechanics, are not significant considering that all the stresses are very low (less than 10 MPa). When the test pipe was pressurized to 5.5 MPa and 5.2 MPa, the experimental hoop stresses were practically the same as those calculated by the standard equation for hoop stress. Finally, it should be mentioned that all these results are referred to quasi-static loads. In practice, however, gas pipelines can experience dynamic loads, e.g., when passing under heavy loaded roadways with an uneven surface containing bumps. The dynamic loads caused by hitting a bump by a heavy truck can considerably exceed the static loads. This is why protective sleeves are so important for protecting gas pipelines from heavy damage in critical areas.
4. Conclusions and Observations
The strain gauge measurement on the buried test pipe proved that deformation of the test pipe occurs as early as during backfilling. These are primarily circumferential strains caused by changing the circular cross section of the pipe to an oval one in consequence of the backfill mass load. It is a through-wall bending stress which leads to compressive strains at the outside surface at the 6 and 12 o’clock positions and to tensile strains at the inside surface. For a cover depth of 1.5 m, the respective bending stress reaches a level of about 34 MPa. During the backfilling, longitudinal compressive stresses also arise. At the 6 o’clock position they reach about 17 MPa. When driving over the buried pipe with a vehicle, a bending stress due to the concentrated load at the contact of the wheel with the earth surface is added to that of the backfill. This stress depends on the level of the concentrated load; for the conditions of the experiments performed, it did not exceed 10 MPa.
The results of the strain measurements and their evaluation proved the stability of the test pipe at backfilling and while being driven over by a heavy-duty vehicle. It was also shown that the effects of the backfill and the crossings on the state of stress of the pipe were negligible. This knowledge is important especially from the viewpoint of heavy trucks crossing buried gas pipelines. Since the presented results were obtained on a single test pipe under specific conditions, gaining a higher degree of confidence would require verifying the conclusions in other conditions as well, namely from the viewpoint of the character of the pipe bedding, as well as pipe dimensions, and the grade of the pipe materials. However, it can be tentatively stated that the effects of both the soil mass load and the concentrated load at the ground surface above the pipe, even if of a high magnitude, do not present an extreme threat to the state of stress of a pipeline.
Author Contributions
Conceptualization, Ľ.G.; methodology, Ľ.G. and M.Š.; validation, P.C.; formal analysis, Ľ.G. and J.K.; investigation, Ľ.G. and M.Š.; funding acquisition, M.Š.; writing—original draft preparation, Ľ.G.; writing—review and editing, Ľ.G. and M.Š.; visualization, J.K. and P.C. All authors have read and agreed to the published version of the manuscript.
Funding
This research was funded by the Technological Agency of the Czech Republic, grant number TE 02000162.
Institutional Review Board Statement
Not applicable.
Informed Consent Statement
Not applicable.
Data Availability Statement
All data generated or analyzed during this study are included in this published article.
Acknowledgments
The authors gratefully appreciate the help of CEPS Company in realization of the tests.
Conflicts of Interest
The authors declare no conflict of interest.
References
- Vilkys, T.; Rudzinskas, V.; Prentkovskis, O.; Tretjakovas, J.; Višniakov, N.; Maruschak, P. Evaluation of Failure Pressure for Gas Pipelines with Combined Defects. Metals 2018, 8, 346. [Google Scholar] [CrossRef] [Green Version]
- Rusin, A.; Stolecka-Antzak, K.; Rogoziński, K.; Rusin, K. Analysis of the Effects of Failure of a Gas Pipeline Caused by a Me- chanical Damage. Energies 2021, 14, 7686. [Google Scholar] [CrossRef]
- Koenig, R.A., Jr.; Taylor, J.P. Protection of Pipelines through Highway Roadbeds; National Cooperative Highway Research Program, Report 309; Transportation Research Board: Washington, DC, USA, 1988. [Google Scholar]
- British and European Standard BS EN 1594:2013. Gas Infrastructure. Pipelines for Maximum Operating Pressure over 16 Bar. Functional Requirements; British Standards Institution (BSI): London, UK, 2013. [Google Scholar]
- Ksenofontov, P.V.; Popov, S.N.; Fedorov, Y.Y. Development of Protective Gas Pipes Sleeves for Operation in Permafrost Soils. IOP Conf. Ser. Mater. Sci. Eng. 2021, 1079, 032044. [Google Scholar] [CrossRef]
- McDonough, R. Highway Traffic and the Effect on Pipelines. Pipeline Gas J. 2021, 248, 48–49. [Google Scholar]
- Bahadori, A. Cathodic Corrosion Protection Systems—A Guide for Oil and Gas Industries; GPP, Elsevier, Inc.: New York, NY, USA, 2014; pp. 48–58. [Google Scholar]
- Mrázek, J. Anti-Corrosive Protection of Pipelines in Protective Sleeves. Plyn (Gas) 1998, 2, 34–35. (In Czech) [Google Scholar]
- Mrázek, J. Measurements in Protective Sleeves by Means of Smell Sensors. Plyn (Gas) 2002, 4, 85–87. (In Czech) [Google Scholar]
- Czech Standard TPG 702 04. Gas Mains and Service Pipelines for Maximum Operating Pressure up to 100 Bar Included; Czech Gas Association: Prague, Czech Republic, 2018. (In Czech) [Google Scholar]
- Šperl, M. Overall Evaluation of Key Experiments; Report TE02000162DV263; ITAM ASCR: Prague, Czech Republic, 2019. (In Czech) [Google Scholar]
- Gajdoš, Ľ.; Šperl, M.; Hračov, S. Deformations in Buried Pipe. Plyn (Gas) 2017, 1, 15–22. (In Czech) [Google Scholar]
- Guidelines for the Design of Buried Steel Pipe. American Lifelines Alliance: ASCE. July 2001, pp. 1–76. Available online: www.americanlifelinesalliance.org (accessed on 9 December 2021).
- Murthy, V.N.S. Principles and Practices of Soil Mechanics; Marcel Decker, Inc.: New York, NY, USA, 2002; pp. 173–205. [Google Scholar]
- Craig, R.F. Craig’s Soil Mechanics; Spon Press: New York, NY, USA, 2004; pp. 144–160. [Google Scholar]
Figure 1.
Positioning of the strain gauges on the test pipe.

Figure 2.
A schematic of the excavated trench and the buried test pipe.

Figure 3.
The test pipe in the sand sub-base prior to backfilling.

Figure 4.
The course of hoop stresses along the circumference of the empty pipe.

Figure 5.
The course of axial stresses along the circumference of the empty pipe.

Figure 6.
The course of hoop stresses along the circumference of the pipe pressurized to 5.5 MPa.

Figure 7.
The course of axial stresses along the circumference of the pipe pressurized to 5.5 MPa.

Figure 8.
The course of hoop stresses along the circumference of the pipe pressurized to 5.2 MPa.

Figure 9.
The course of axial stresses along the circumference of the pipe pressurized to 5.2 MPa.

Figure 10.
Net hoop stresses due to I. crossing.

Figure 11.
Net axial stresses due to I. crossing.

Figure 12.
Net hoop stresses due to II. Crossing.

Figure 13.
Net axial stresses due to II. Crossing.

Figure 14.
Net hoop stresses due to III. Crossing.

Figure 15.
Net axial stresses due to III. Crossing.

Figure 16.
Loading of a pipe by a concentrated surface load.

Figure 17.
Illustration of positions of the left-hand wheels at step I and step II loading. (Dimensions are in meters).
Figure 17.
Illustration of positions of the left-hand wheels at step I and step II loading. (Dimensions are in meters).


Table 1.
Mechanical properties of the pipe steel used.
| Rt0.5 (MPa) | Rm (MPa) | KV (J) |
|---|---|---|
| 400 | 578 | 72 |
A note: the impact energy KV was obtained on Charpy specimens 5 mm thick at the temperature 0 °C.
Table 2.
Strains at the first crossing (p = 0 MPa).
| Position (h) | 12 | 3 | 6 | 9 | ||||
|---|---|---|---|---|---|---|---|---|
| Strain (10−6) | Hoop | Axial | Hoop | Axial | Hoop | Axial | Hoop | Axial |
| no load | −165 | 43 | 159 | −22 | −159 | −27 | 141 | 11 |
| step I | −173.4 | 26 | 174.6 | −7.2 | −170.2 | −10.5 | 154.1 | 28.1 |
| step II | −189.2 | 17.2 | 187.6 | −0.7 | −178.8 | −8.7 | 168.5 | 32.6 |
Table 3.
Strains at the second crossing (p = 5.5 MPa).
| Position (h) | 12 | 3 | 6 | 9 | ||||
|---|---|---|---|---|---|---|---|---|
| Strain (10−6) | Hoop | Axial | Hoop | Axial | Hoop | Axial | Hoop | Axial |
| no load | 890 | 308 | 829 | 215 | 1028 | 229 | 964 | 208 |
| step I | 896 | 296.5 | 832 | 215 | 1020.5 | 241 | 965 | 218.5 |
| step II | 902 | 313.5 | 832 | 218 | 1029.5 | 239.5 | 958.5 | 220.5 |
Table 4.
Strains at the third crossing (p = 5.2 MPa).
| Position (h) | 12 | 3 | 6 | 9 | ||||
|---|---|---|---|---|---|---|---|---|
| Strain (10−6) | Hoop | Axial | Hoop | axial | HOOP | Axial | Hoop | Axial |
| no load | 843 | 278 | 688 | 183 | 988 | 186 | 876 | 181 |
| step I | 828 | 259 | 700.5 | 188.5 | 979.5 | 202 | 885.5 | 194.5 |
| step II | 837 | 266 | 696 | 184 | 981 | 201 | 883 | 191 |
Table 5.
Net stresses caused by loads due to truck crossings.
| Loading | Range of Differential Stresses | |
|---|---|---|
| Hoop Stress (MPa) | Axial Stress (MPa) | |
| crossing I (p = 0 MPa) | (−7; 8) | (−7.5; 7) |
| crossing II (p = 5.5 MPa) | (−1; 3) | (−2; 2) |
| crossing III (p = 5.2 MPa) | (−4.5; 3) | (−5.5; 3.5) |
Table 6.
The mass density and the height of soil constituents.
| Layer | Mass Density (kg/m3) | Height (m) |
|---|---|---|
| backfill soil | 1730 | 0.6 |
| agregate | 1900 | 0.5 |
| compacted earth | 2000 | 0.2 |
| sand | 1900 | 0.2 |
Table 7.
Comparison of calculated and measured hoop stresses at the 12 o’clock position.
| Loading | Hoop Stresses σφ (MPa) Determined by | |
|---|---|---|
| Soil Mechanics | Strain Gauge Measurement | |
| backfill | −33.5 | −34.4 |
| step I | −9.4 | −3.1 |
| step II | −9.1 | −7.2 |
| p = 5.5 MPa | 221.7 * | 222.4 |
| p = 5.2 MPa | 209.7 * | 209.7 |
* calculated as pD/(2t).
Publisher’s Note: MDPI stays neutral with regard to jurisdictional claims in published maps and institutional affiliations. |
© 2022 by the authors. Licensee MDPI, Basel, Switzerland. This article is an open access article distributed under the terms and conditions of the Creative Commons Attribution (CC BY) license (https://creativecommons.org/licenses/by/4.0/).
Share and Cite
MDPI and ACS Style
Gajdoš, Ľ.; Šperl, M.; Kec, J.; Crha, P. The Effect of Heavy-Duty Vehicle Crossings on the State of Stress of Buried Pipelines. Metals 2022, 12, 153. https://doi.org/10.3390/met12010153
AMA Style
Gajdoš Ľ, Šperl M, Kec J, Crha P. The Effect of Heavy-Duty Vehicle Crossings on the State of Stress of Buried Pipelines. Metals. 2022; 12(1):153. https://doi.org/10.3390/met12010153
Chicago/Turabian StyleGajdoš, Ľubomír, Martin Šperl, Jan Kec, and Petr Crha. 2022. "The Effect of Heavy-Duty Vehicle Crossings on the State of Stress of Buried Pipelines" Metals 12, no. 1: 153. https://doi.org/10.3390/met12010153
Note that from the first issue of 2016, this journal uses article numbers instead of page numbers. See further details here.