Experimental and Numerical Study of Mechanical Behavior of Welded Steel Plate Joints


1
College of Civil Science and Engineering, Yangzhou University, Yangzhou 225127, China
2
Institute of Theoretical and Applied Mechanics of the Czech Academy of Sciences, 19000 Prague, Czech Republic
3
Department of Civil and Environmental Engineering, Syracuse University, Syracuse, NY 13244, USA
*
Author to whom correspondence should be addressed.
Metals 2020, 10(10), 1293; https://doi.org/10.3390/met10101293
Submission received: 9 September 2020
/
Revised: 24 September 2020
/
Accepted: 25 September 2020
/
Published: 27 September 2020
Abstract
:This paper describes a study of welded steel plate joints using experimental and numerical methods. The objectives of this study are to observe the mechanical behavior of welded plate joints under monotonic and cyclic loads, identify their damage degradation processes, and provide useful test data for future damage analysis of beam-column connections in steel frame structures. Six specimens were designed, of which three were tested under monotonic loads, and the other three were tested under cyclic loads. The test setup consisted of three plates arranged in a cruciform and connected by two groove welds. The monotonic and cyclic loads were applied to the free end of the two outstanding plates, inducing a pulling force on the welded joint. Because the only element studied in the present work is the weld, the sizes of the three plates were kept constant. The responses of these welded plate joints are discussed in terms of their experimentally and numerically obtained mechanical parameters, hysteretic behavior, strain variations, stiffness degradation, damage process, and failure modes. The results show that the energy damage model outperforms the displacement damage model in terms of indicating the degree of damage. Furthermore, if designed according to code, all these welded plate joints perform satisfactorily.
1. Introduction
Weld quality directly affects the quality of welded beam-to-column connections, which are important elements of a steel frame structure, as evidenced by the brittle failure of a number of welded beam-to-column connections during the 1994 Northridge and the 1995 Kobe earthquakes. Over the years, numerous researchers have performed studies on the behavior of welded joints. For instance, Saher et al. [1] and Ma et al. [2] performed tests on beam-column moment connections under cyclic loads, and Bae [3] conducted fatigue strength tests of plate-welded joints. Cho et al. [4] investigated the residual stress and post-weld heat treatment of multi-pass welds, and Radhi et al. [5] used the finite element method to study the effect of weld toe radius and plate thickness on the fatigue life of butt-welded joints. Chen et al. [6] studied the fatigue strength of U-rib and diaphragm welded joints, and Wang et al. [7] conducted a fatigue damage analysis of steel truss bridge joints considering the effect of residual stresses. Coelho et al. [8] and Konda et al. [9] tested and evaluated the behavior of welded plates for T-stub connections and orthotropic deck plates, respectively. Takahashi et al. [10] studied the fatigue behavior of box-welded joints under biaxial loading conditions, and Shvets et al. [11] assessed the fatigue damage of welded joint zones made from low carbon steel. Other researchers who studied the fatigue behavior of welded joints include Guo et al. [12], Kim et al. [13], and Zhang et al. [14]. Lie et al. [15] conducted a finite element analysis of welded tubular Y-joints, and Yang et al. [16] analyzed the stress-intensity factor of three-dimensional fatigue cracks of butt-welded U-rib joints. Lan et al. [17] conducted an experimental study and developed a ductile fracture model of a single-groove welded joint under a monotonically applied load. Ravi and Khandelwal [18] studied the damage of steel and weld material under ultralow cycle fatigue. Tsutsumi et al. [19] studied the effect of tangential plasticity on structural response under non-proportional cyclic loading. Ucaket et al. [20] precisely predicted the cyclic response of structural steel members of the yielding platform.
Much of the aforementioned research focused on the strength and fatigue behavior of a joint under monotonic or cyclic loads without considering the influence of weld damage on the joint behavior. Therefore, the main focus of the present study is to investigate the effect of weld damage on the performance of welded steel plate joints by analyzing the load–displacement and stress–strain curves of these joints tested under monotonic and cyclic loads. Using the skeleton and damage modulus curves, the degradation process of weld damage is studied, and a damage model is validated.
Two sets of three welded plate joint specimens were designed and fabricated. Each specimen consisted of three plates welded together in the form of a cruciform. The two outstanding plates that formed the wings of the cruciform were groove welded at right angles to a third plate that formed the stem of the cruciform. The welds were designed in accordance with Chinese specifications [21] for welds, and an E5051 electrode was used for all welds. The first set of three specimens was tested under monotonic loading to determine the mechanical properties, such as the load-displacement curve, elastic modulus, yield strength, tensile strength, and ductility, of the welded joints. The second set of three specimens was tested under cyclic loading to study the hysteretic characteristics, load-carrying capacity, weld degradation process, and damage of the joints.
In the following sections, detailed descriptions of the welded steel plate joint specimens, test setup, experimental results, finite element model, and numerical simulations will be provided.
2. Experimental Program
2.1. Specimen Design and Preparation
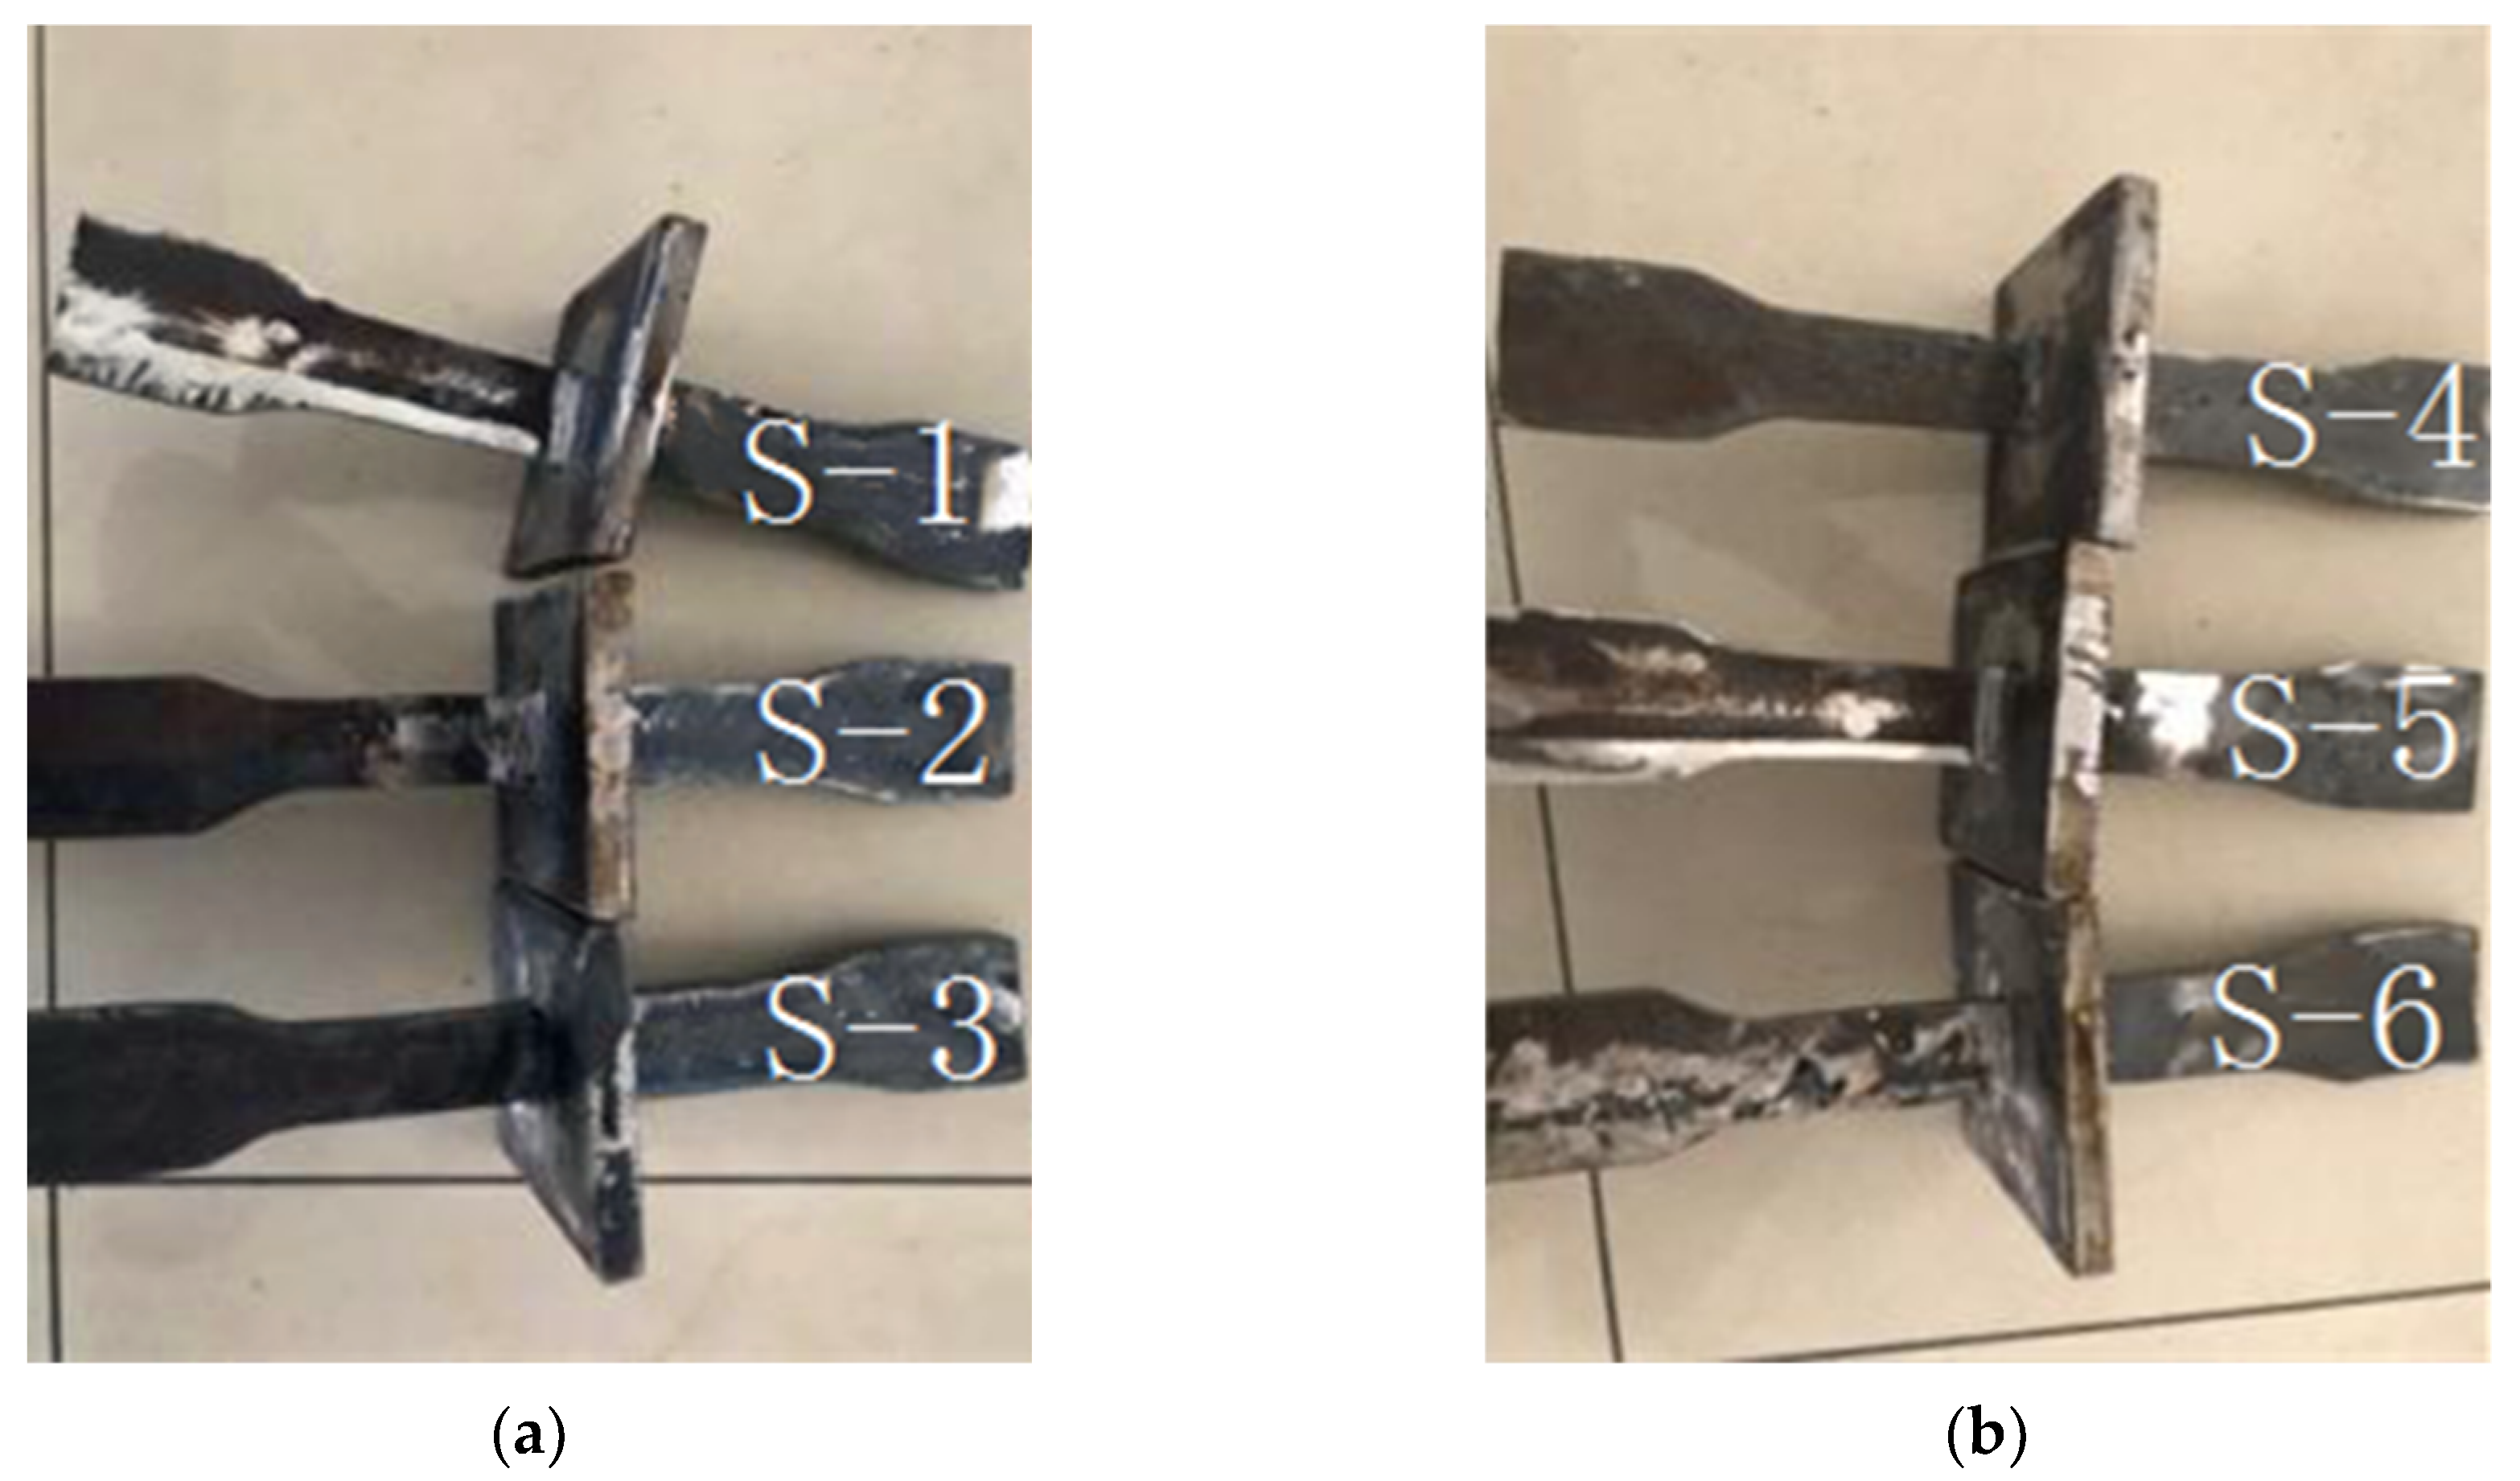
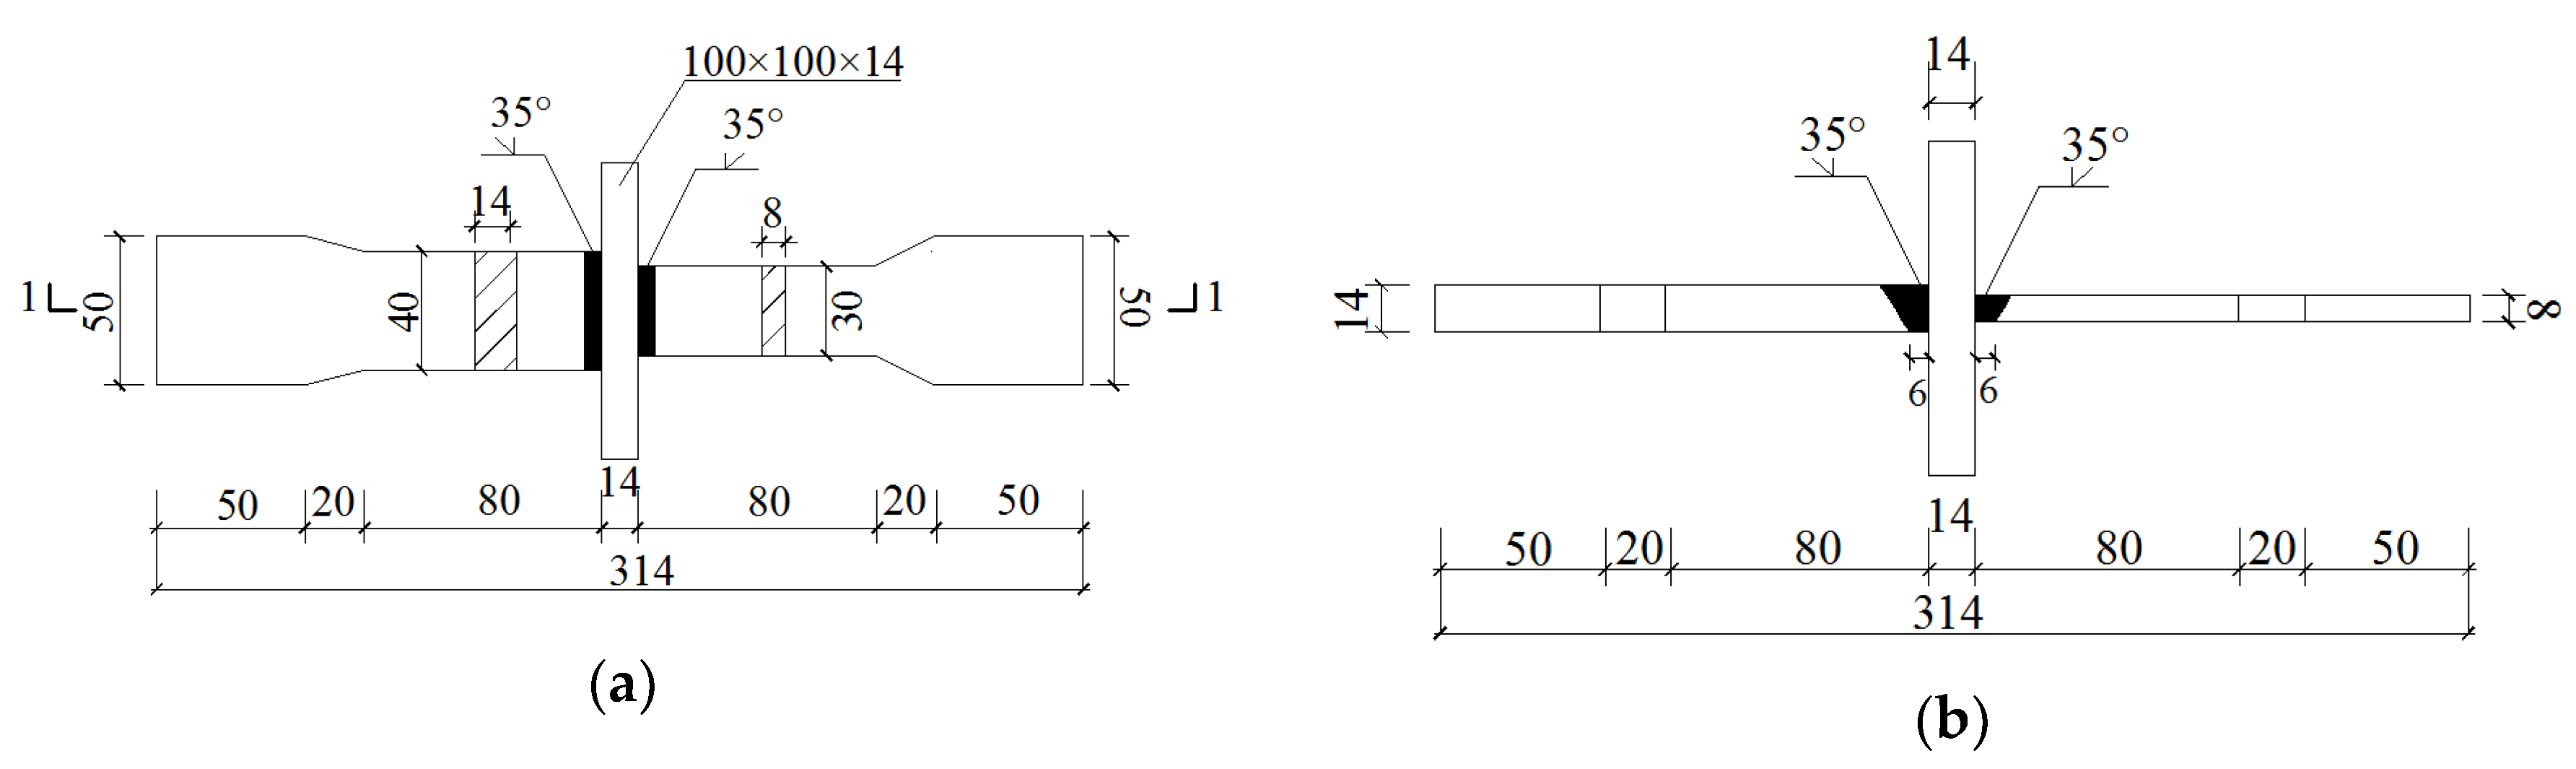
Using the “component method” described in Eurocode 3 [22] and employed in the research of reinforced concrete beam-column joints [23], the present research uses the six welded plate joint specimens shown in Figure 1 to investigate weld damage and establish an energy-based damage model for welds. In order to ensure the weld cracking, the weld length of the flange and intermediate plate on both sides was calculated accurately. At the same time, a precise measurement was used to reduce the manufacturing error. In addition, due to the limited processing conditions, the plate connection could only be made by manual welding, which may lead to uneven material properties of the weld. As shown in Figure 1, each test specimen was fabricated by groove welding one end of two wing plates perpendicular to the face of the center plate using an E5015 electrode in accordance with the Chinese code [21]. The configuration and dimensions of the specimens and the groove welds are shown in Figure 2. At the location of the weld, the thickness and width of one of the wing plates (shown on the left in Figure 2) were 14 mm and 40 mm, respectively, while the thickness and width of another wing plate were 8 mm and 30 mm, respectively. The widths of both wing plates taper were 50 mm at the free end. The center plate had a constant thickness of 14 mm. In the component method, the wing plates were used to simulate beam flanges, and the center plate was used to simulate a column flange or column web. For all the specimens, the thicker wing plate and the center plate were cut from the flanges of an HW 250 × 250 × 9 × 14 section, and the thinner wing plate was cut from the flanges of an HN 248 × 124 × 5 × 8 section. The reason for using a thicker and wider plate on one side was to ensure that weld damage would occur in the weld of the thinner and smaller plate. The steel used for all the specimens was Q345 steel with a nominal yield strength of 345 MPa. However, based on 15 coupon tests carried out at the Material Mechanics Laboratory of Yangzhou University, the actual average yield strength, tensile strength, and elastic modulus were found to be 359 MPa, 589 MPa, and 203 GPa, respectively. The average elongation at failure was 11.6%.
The six specimens were divided into two sets. The first set of three specimens (labeled S-1, S-2, and S-3) was used to investigate the behavior of the welded plate joints under monotonic loads. The second set of specimens (labeled S-4, S-5, and S-6) was used to investigate the joint behavior under cyclic loads. The test results under these monotonic and cyclic loads will be discussed in a later section.
2.2. Test Setup and Loading History
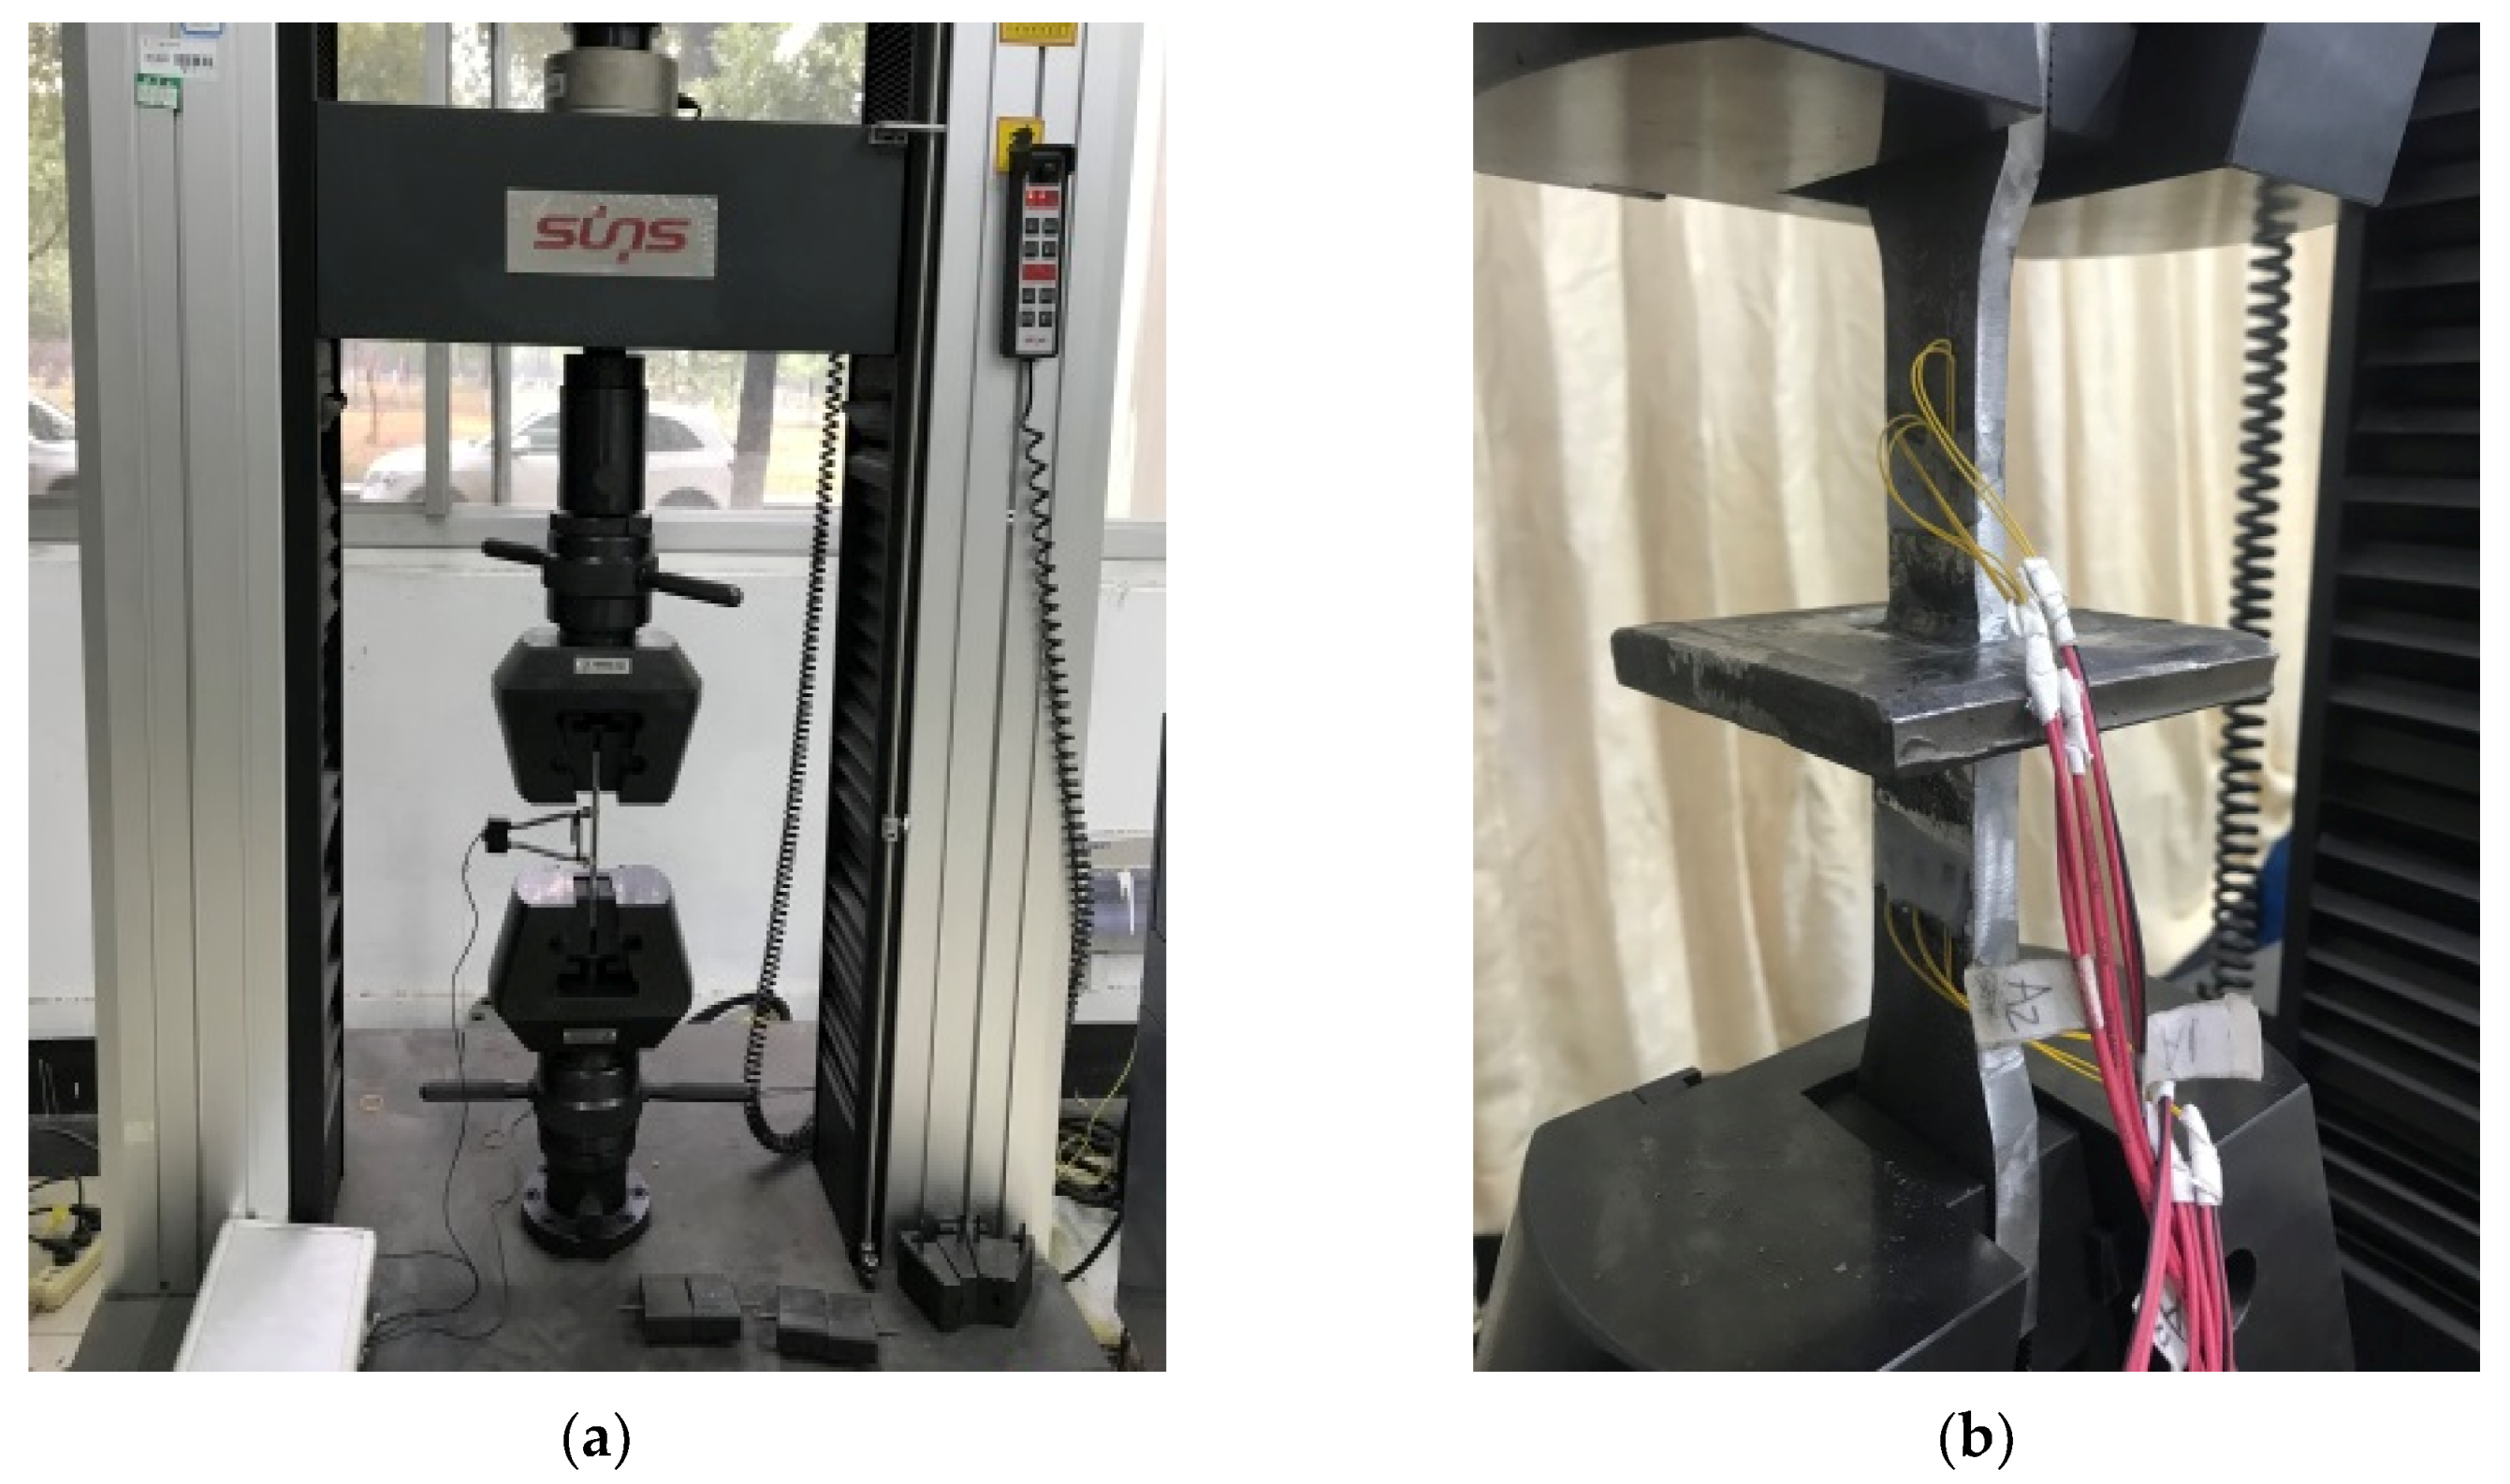
The test setup for a typical specimen is shown in Figure 3. All the specimens were tested using a 300 kN capacity WDW-300 microcomputer-controlled electronic universal testing machine. The monotonic load testing of the first set of specimens was carried out using the displacement control mode. The displacement rate was set at 3 mm/s until the force–displacement relationship became nonlinear, at which time the rate was reduced to 2 mm/s. This displacement rate was maintained until the force dropped below 500 N, the ratio of two consecutive applied forces was less than 25%, or the measured force was less than 35% of its maximum value. If any of these conditions were reached, the test would be terminated.
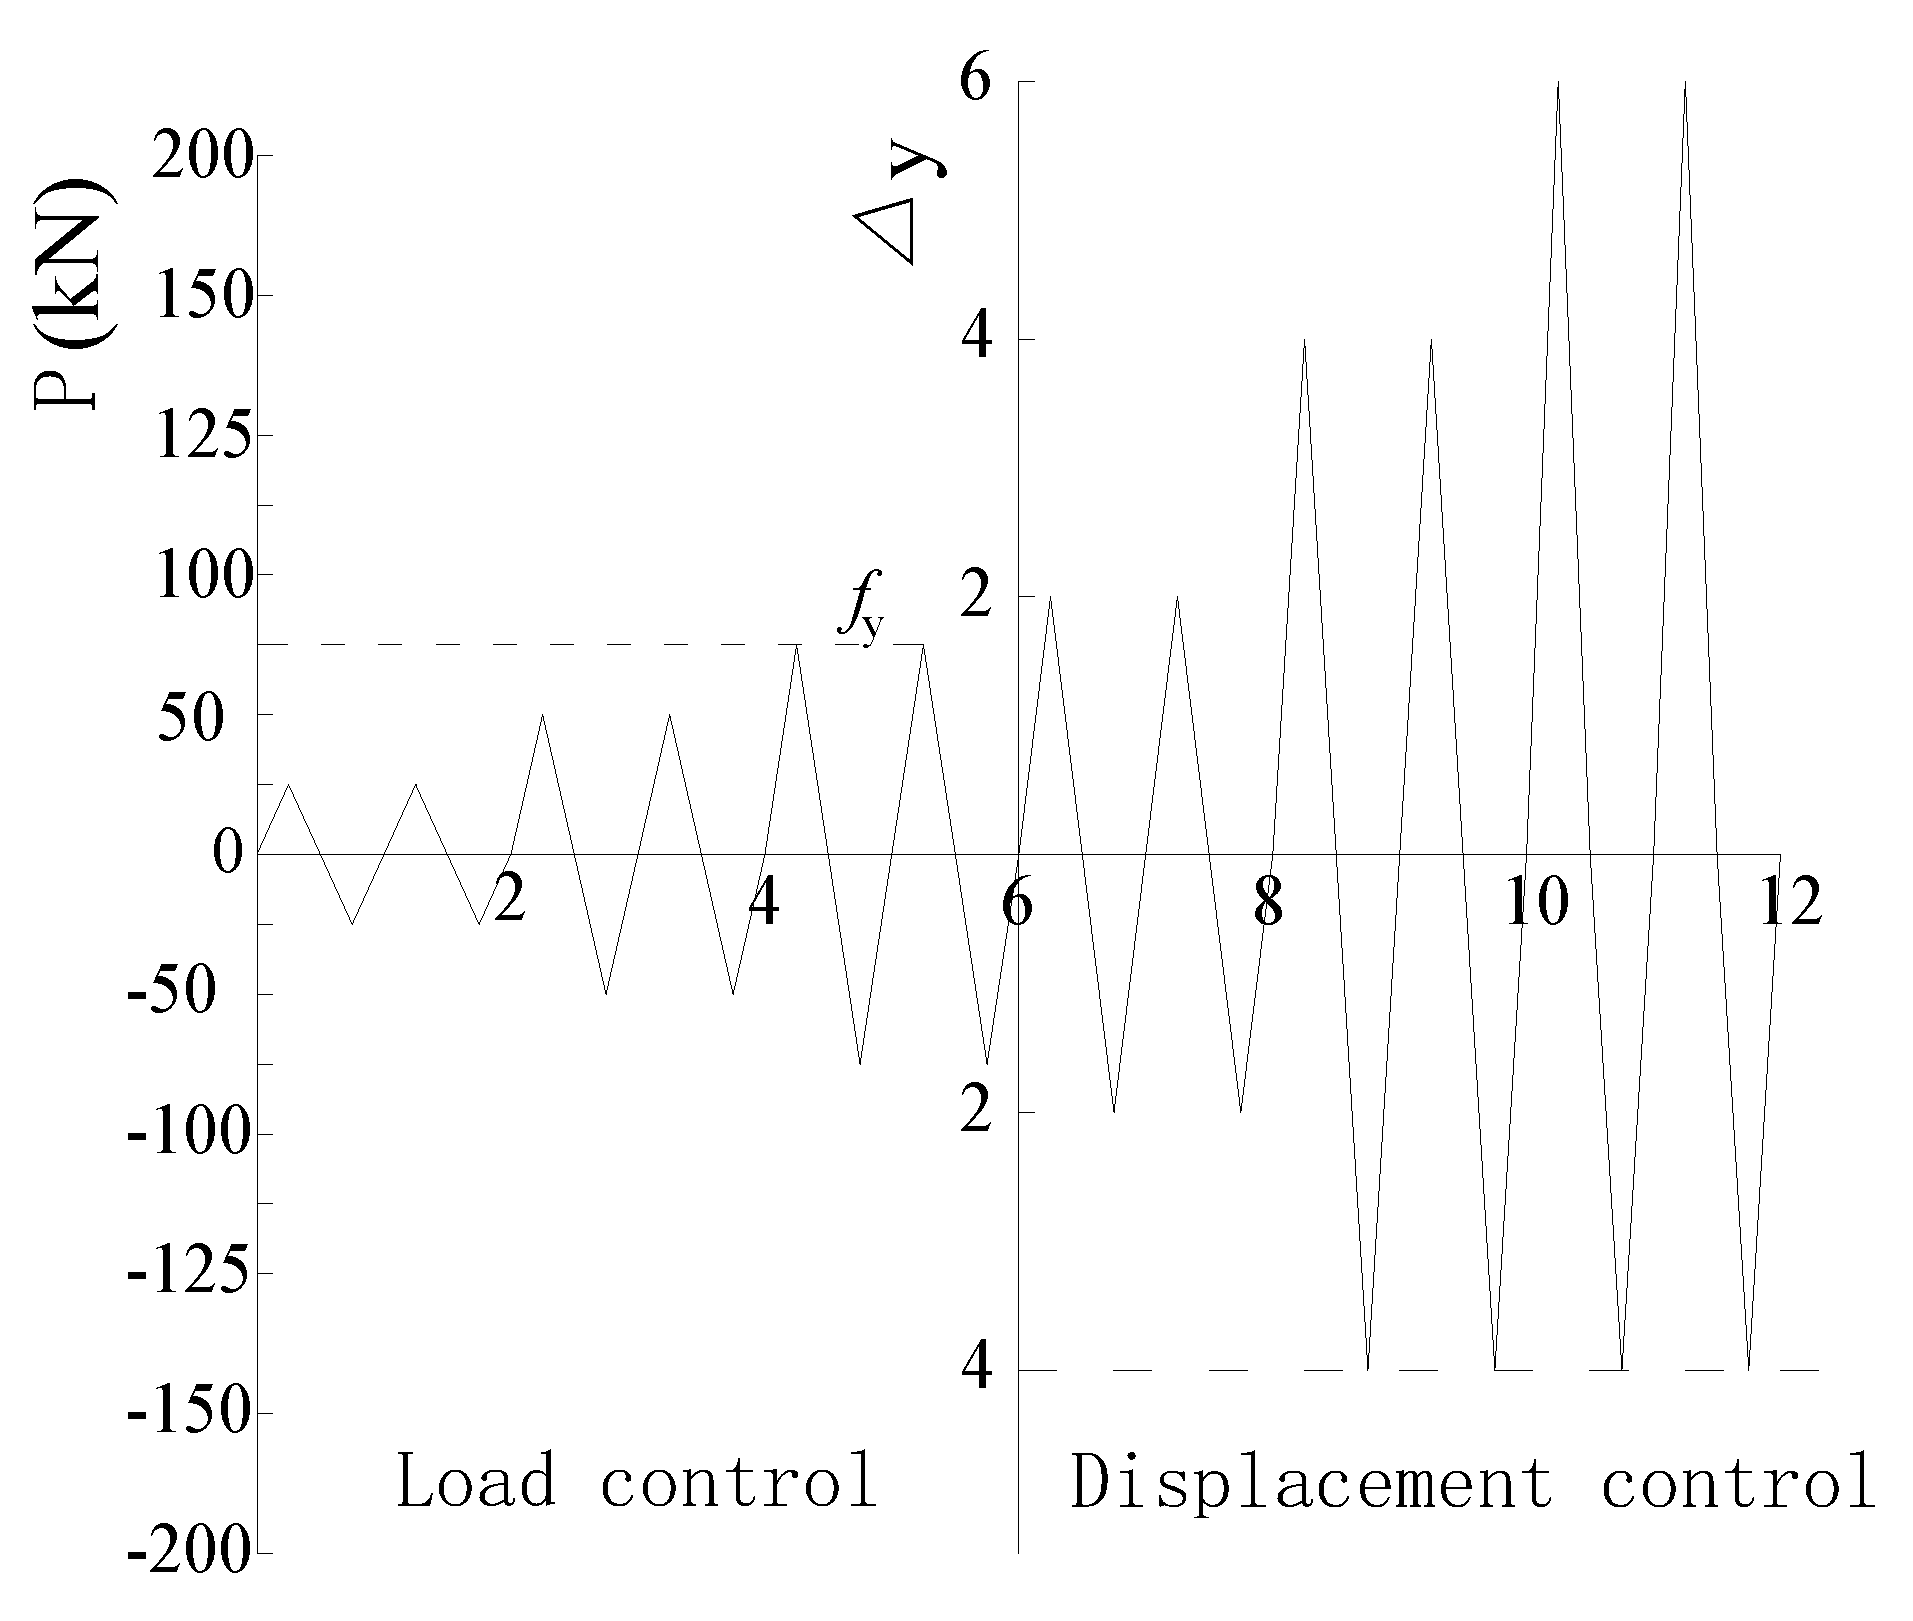
The cyclic load testing of the second set of specimens was carried out using a two-stage process. The test started with the load control mode, with two load cycles of 25 kN applied to the specimen. The magnitude of the applied load cycles was increased to 75 kN in 25-kN load increments, after which the load was increased in 15-kN increments until yielding occurred. At this time, the applied load was switched to displacement-control mode. In the displacement-control loading stage, the displacement of the first load cycle was 2Δy, and then increased by 2Δy for each cycle, and the cycle with the same amplitude was repeated twice. In order to prevent overall instability failure caused by excessive pressure, the maximum displacement in the pressure direction was set as 4Δy. The displacement rate used was 3 mm/s, which changed to 2 mm/s when the force–displacement relationship became nonlinear. The tension–compression load cycles used for the cyclic load test are shown in Figure 4.
2.3. Instrumentation
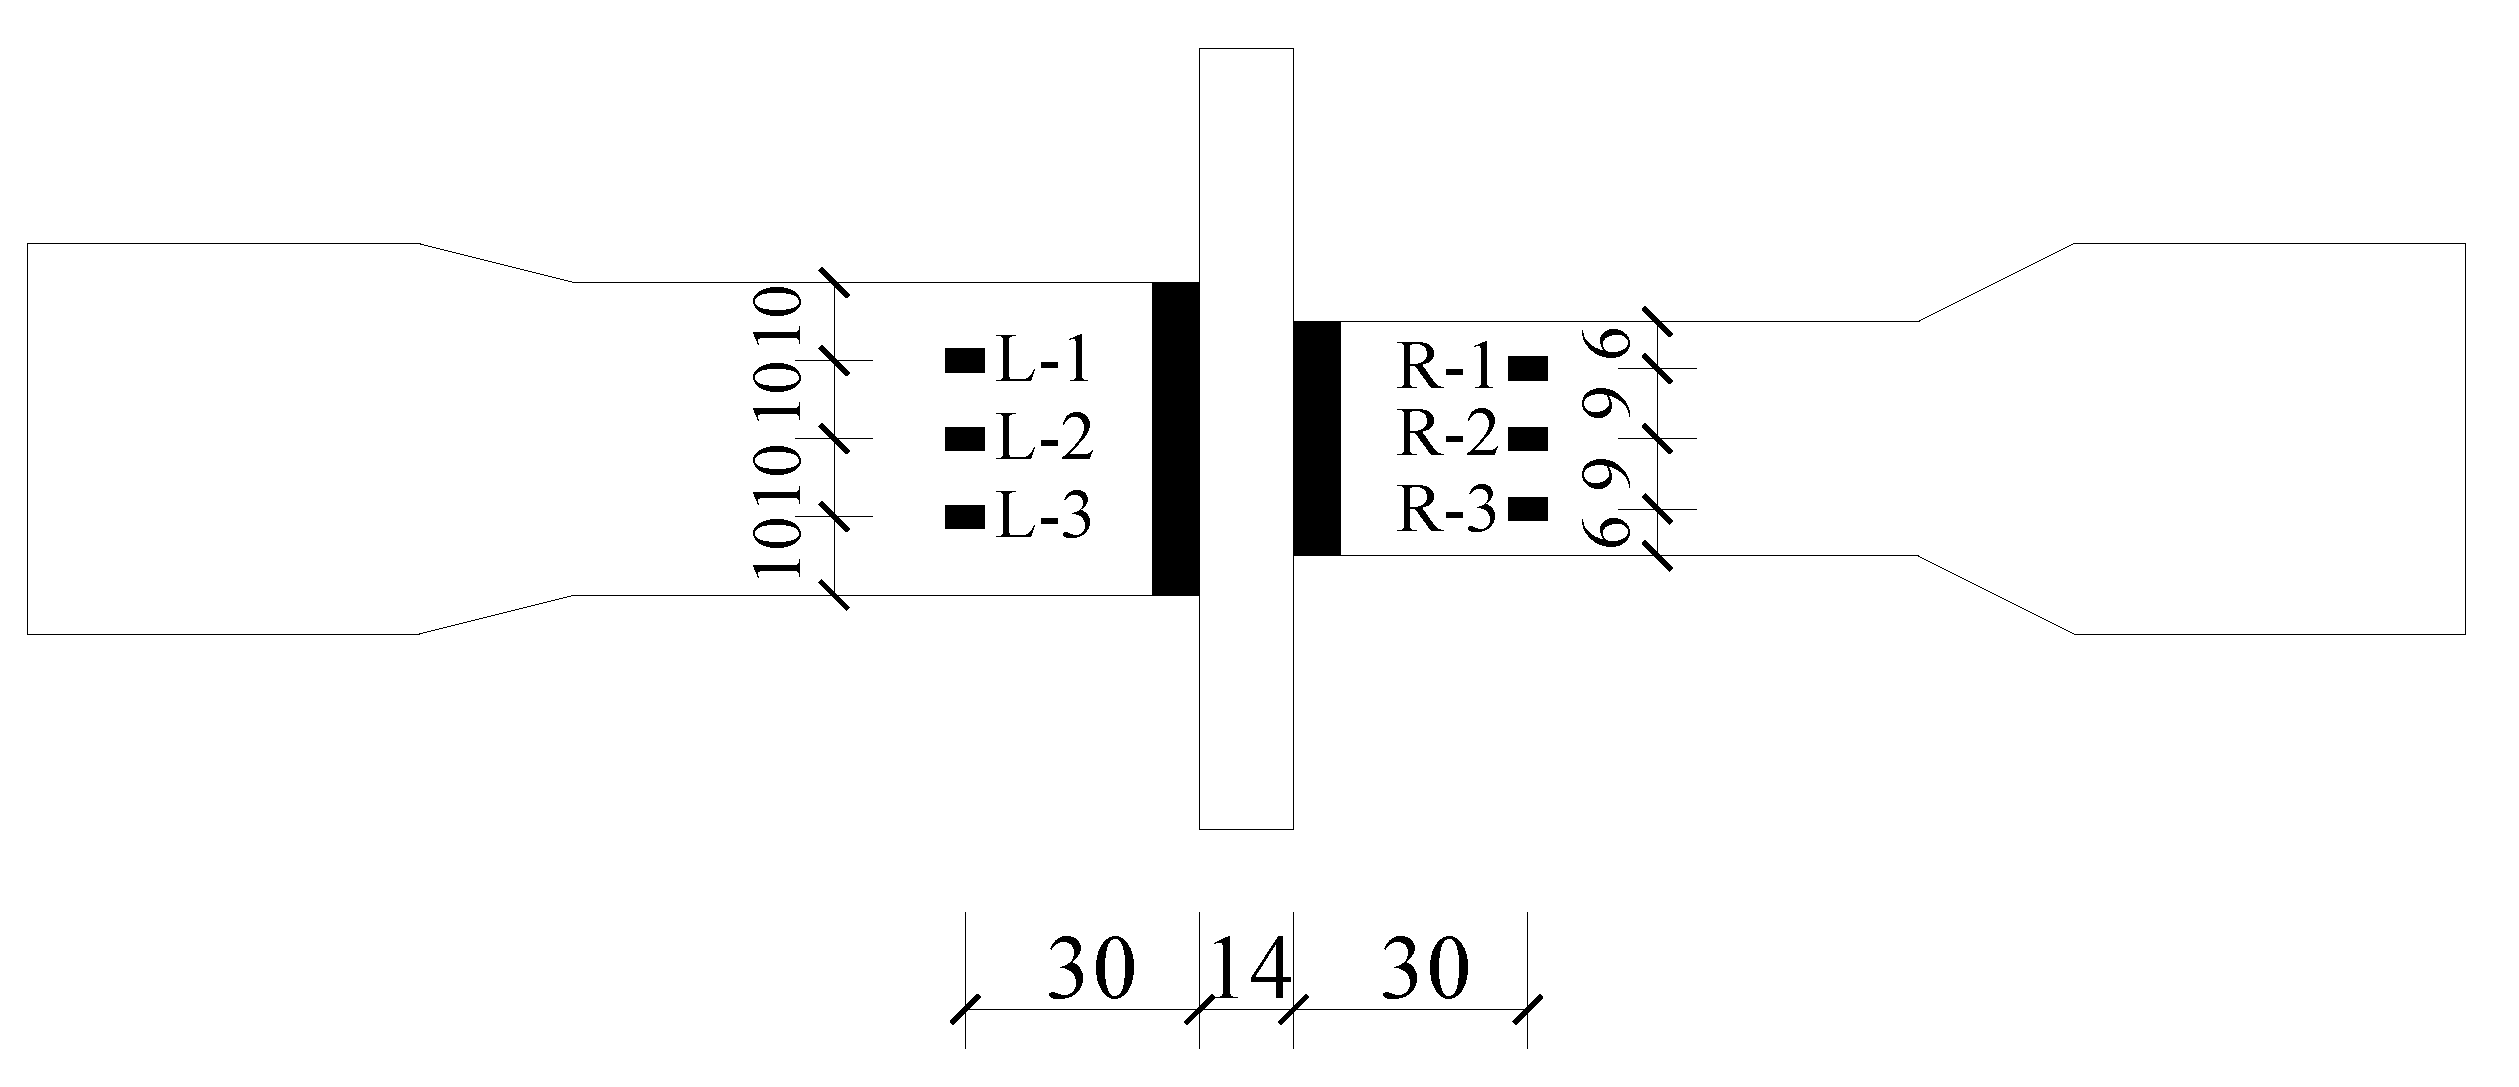
Figure 5 shows the locations where strain gauges were placed on each specimen. The same arrangement of strain gauges was used for all specimens, regardless of whether the applied load was monotonic or cyclic. The strain gauges labeled R-1, R-2, and R-3 were placed 9 mm apart on the surface of the smaller wing plate, while the strain gauges labeled L-1, L-2, and L-3 were placed 10 mm apart on the surface of the larger wing plates. In addition to measuring the strains (from which the stresses can be calculated) at the indicated locations, the loads applied to and the displacements experienced by the test specimens were automatically recorded by the universal testing machine.
3. Experimental Results
3.1. Performance of Welded Plate Joints
Table 1 shows the yield and tensile strengths and the axial deformation of the welds for the six test specimens, where the cross-sectional area of the smaller wing plate is considered for evaluating the stress. The results showed that except for the yield strength of Specimen S-6, the yield and tensile strengths under cyclic load conditions are lower than those under monotonic load conditions. The monotonic load results all exceed the minimum specified yield and tensile strengths of 330 MPa and 490 MPa, respectively, for the E5015 electrode. The axial deformation of the weld is calculated by subtracting the elongation of the wing and center plates determined using basic mechanics from the total specimen deformation measured automatically by the WDW-300 microcomputer-controlled electronic universal testing machine.
3.2. Test Results under Monotonic and Cyclic Loads
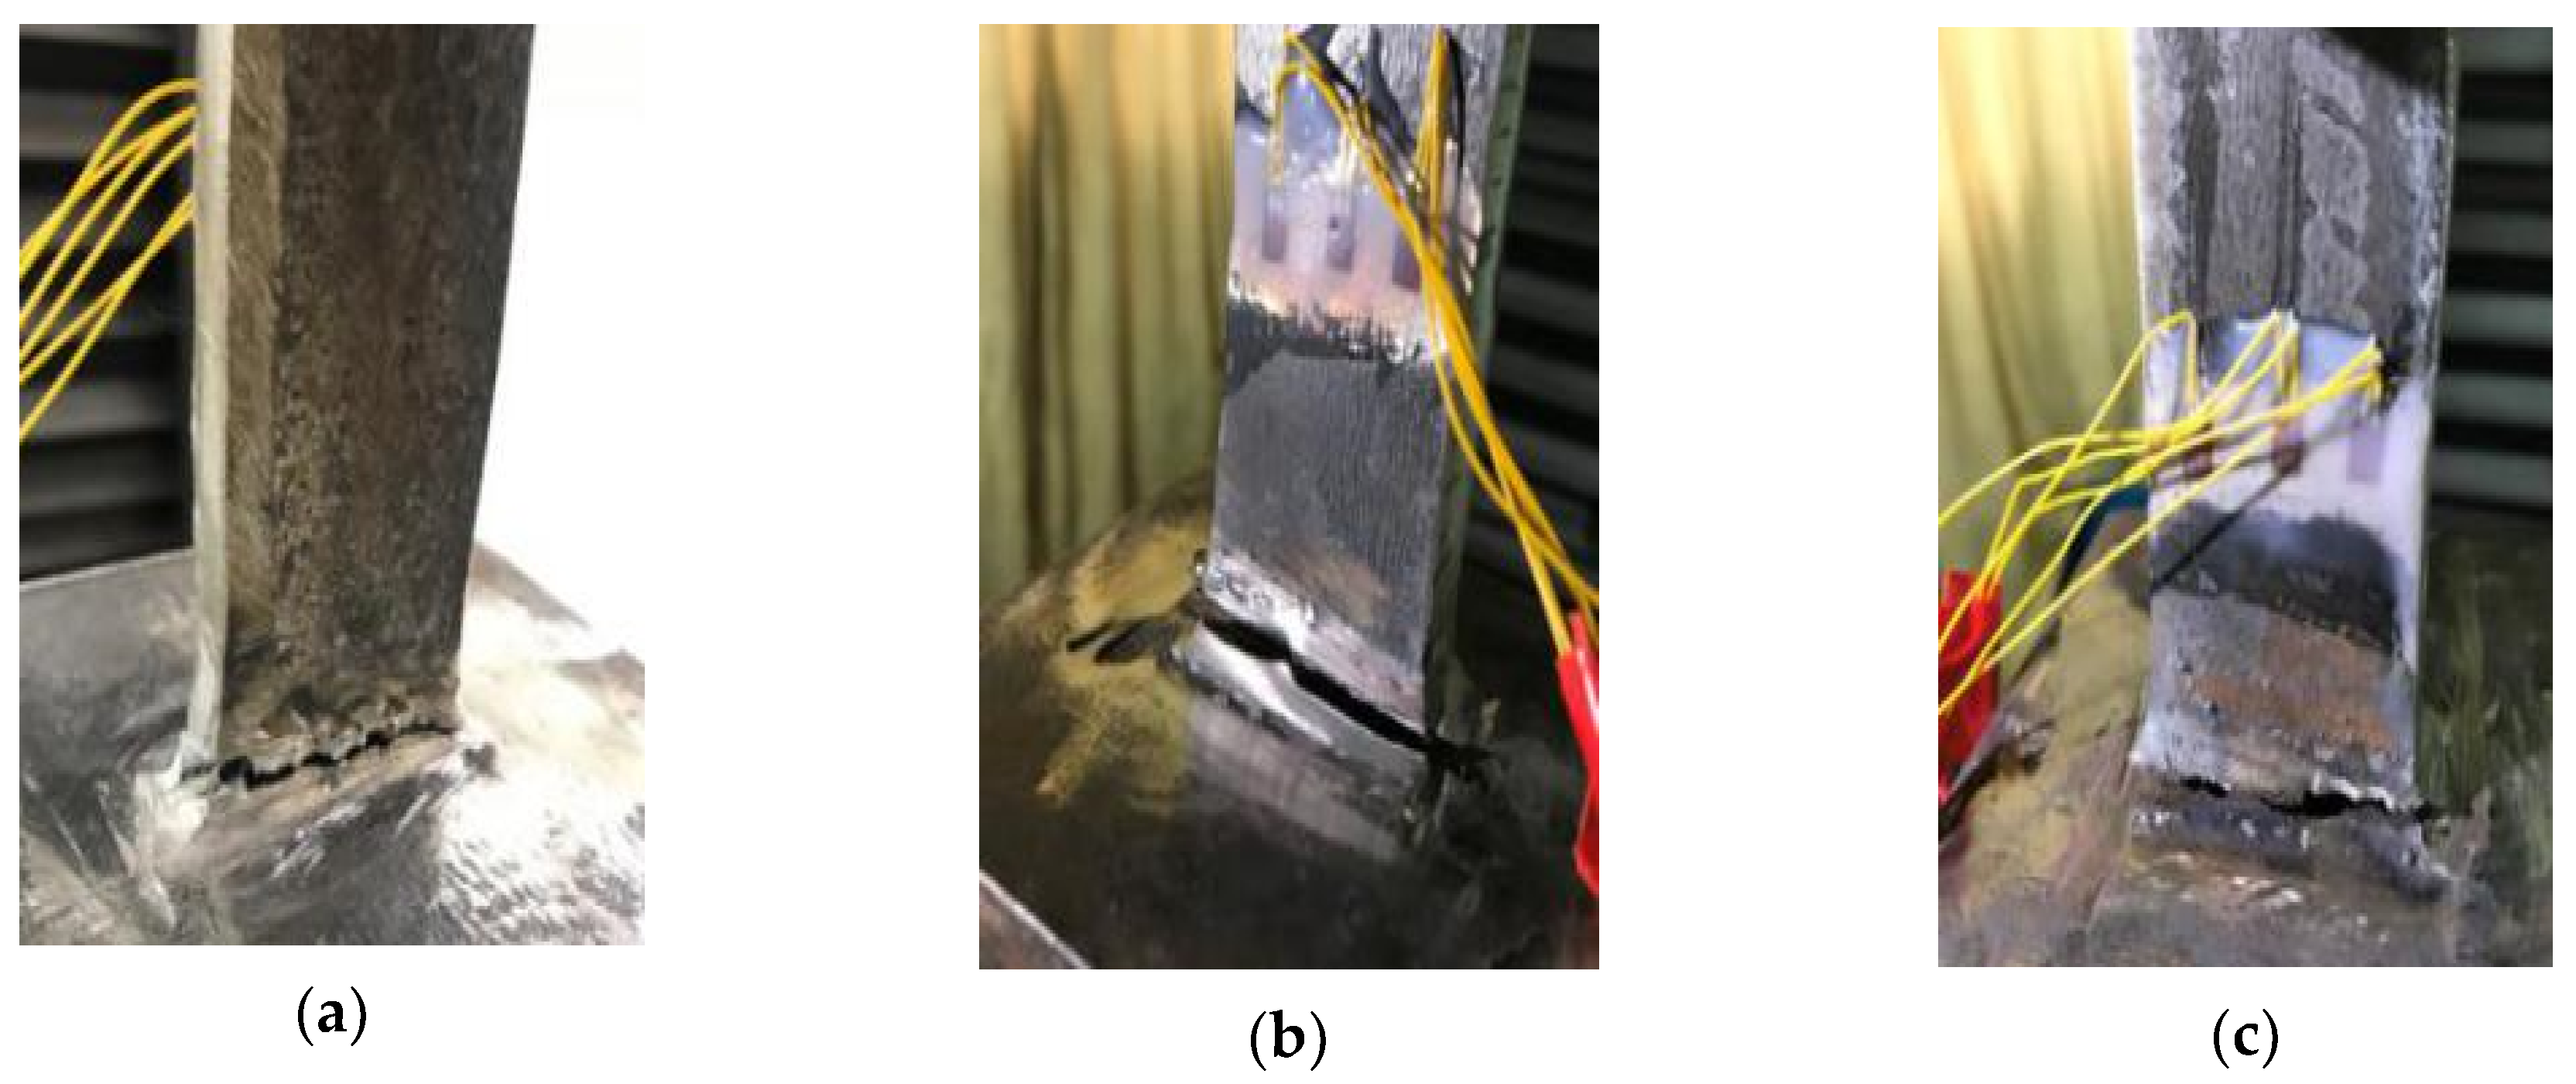
The results of the monotonic tensile load test show that all three specimens fractured at the weld. For Specimen S-1, cracks appeared when the displacement reached 2.9 mm. The cracks grew rapidly and resulted in a joint fracture, as shown in Figure 6a, when the displacement reached 3.4 mm. For Specimen S-2, fracturing occurred rather suddenly in the weld, as shown in Figure 6b, when the displacement reached 1.7 mm. The fracture behavior of Specimen S-3 is similar to that of Specimen S-1. When the displacement reached 3.9 mm, a weld fracture formed, as shown in Figure 6c.
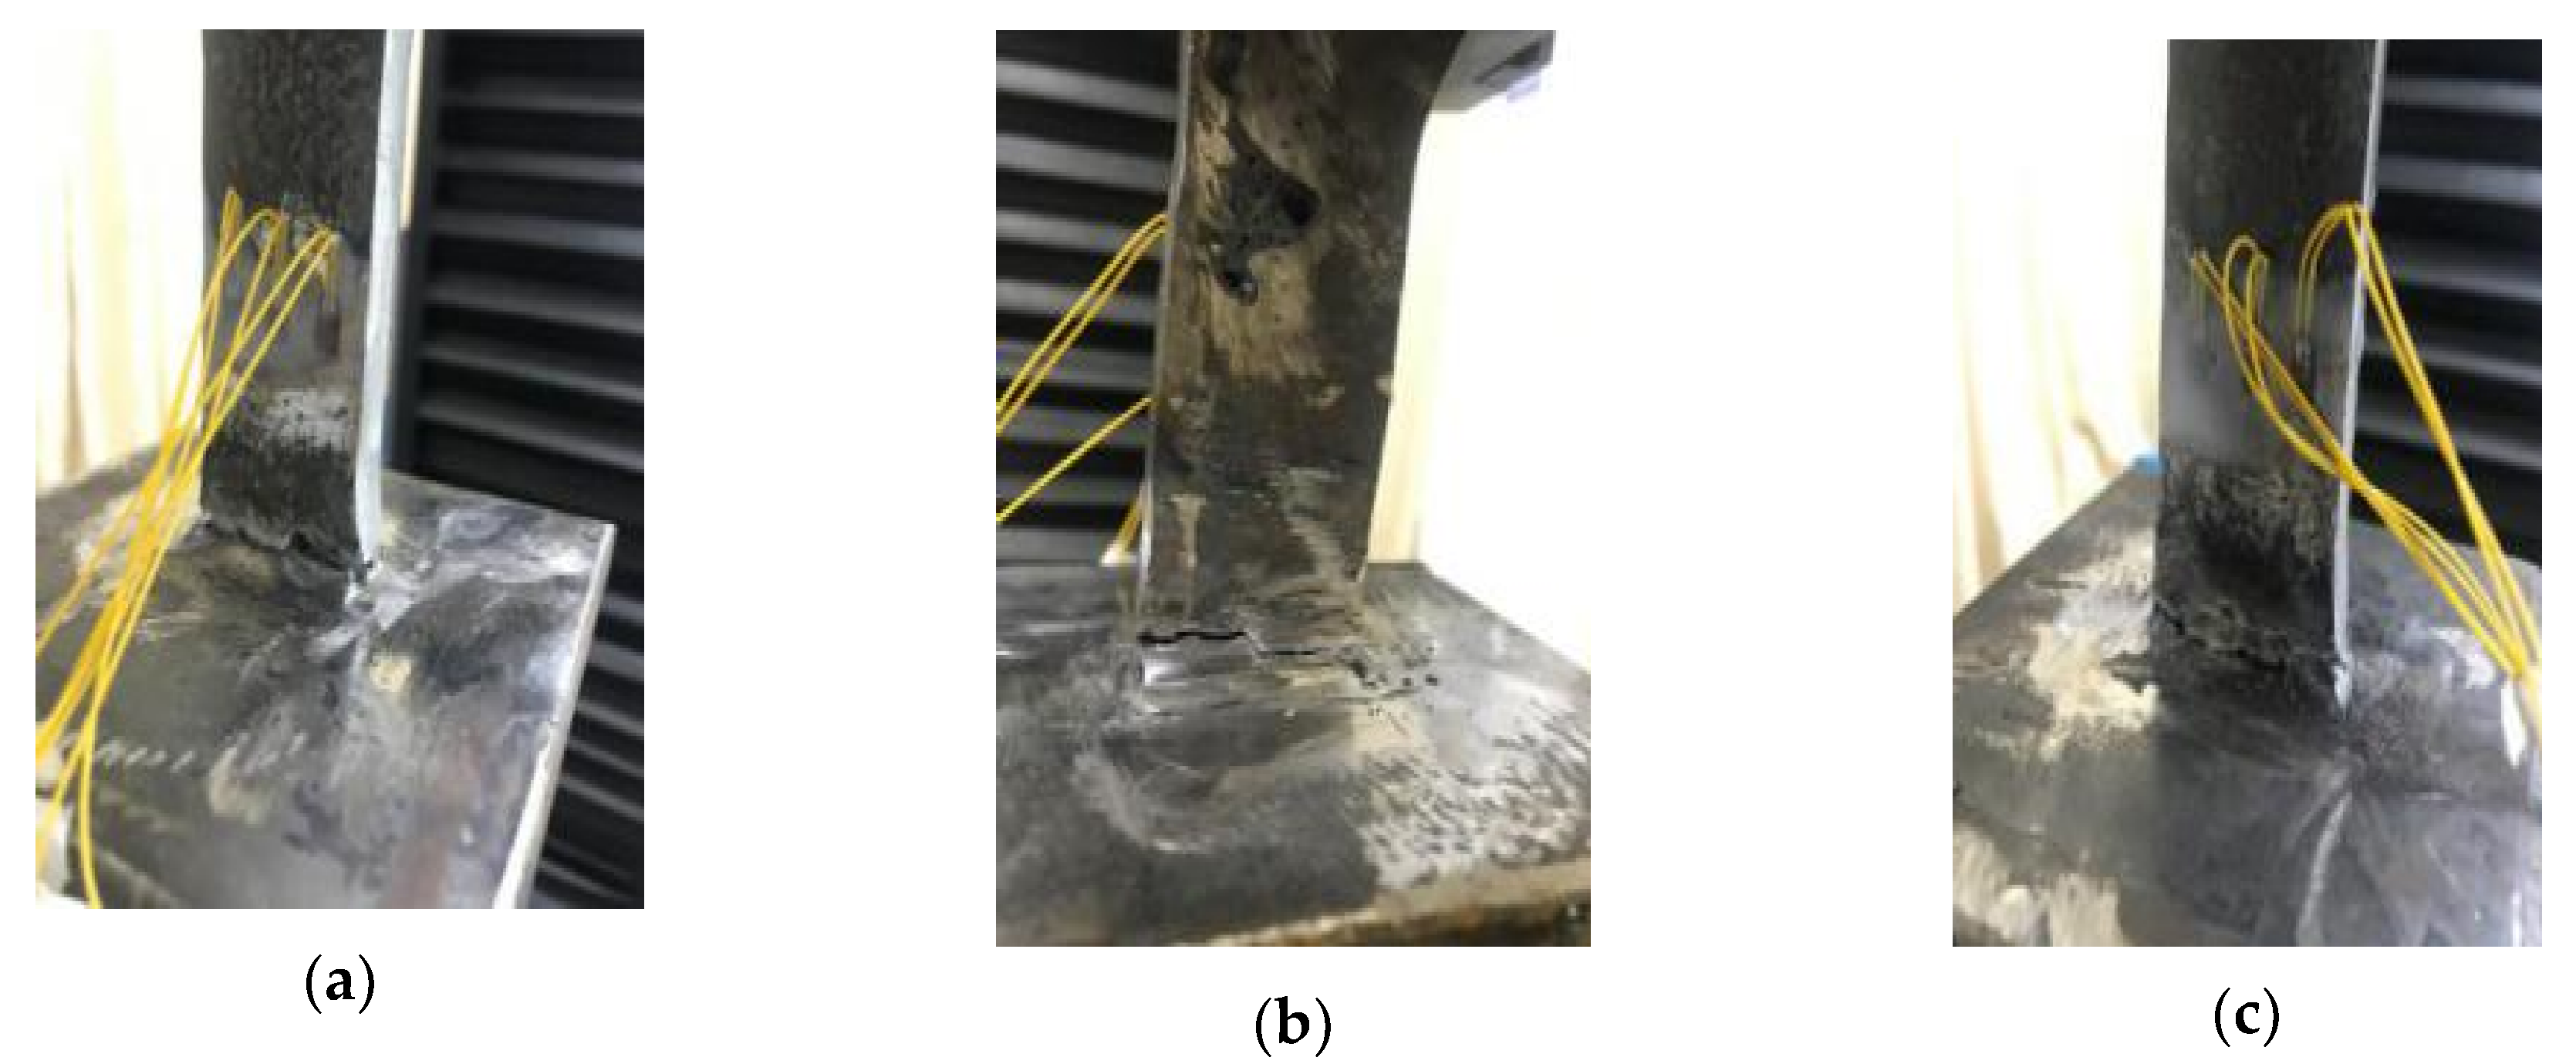
When compared with the cracks that developed under a monotonically applied tensile load, the cracks that developed under a cyclically tensile and compressive applied load have more complex failure modes, resulting in a rather uneven fracture surface and a small amount of residue material left on the center plate. For Specimen S-4, when the displacement reached 2.89 mm, a small crack appeared at one end of the weld. When the direction of the applied load was reversed, the crack closed, and when the displacement increased to 3.15 mm, the crack grew until the weld fractured, as shown in Figure 7a. For Specimen S-5, when the displacement reached 2.54 mm, a crack was initiated at one end of the heat-affected zone and extended to the other end, as shown in Figure 7b. When the displacement reached 3.04 mm, weld fracturing occurred suddenly. For Specimen S-6, fine cracks were observed at the welded end of the beam. These cracks closed, and the specimen inclined when the direction of the applied load was reversed. When the displacement reached 3.34 mm, the original cracks extended at one end and new cracks formed at the other end. Both types of crack grew until the weld fractured, as shown in Figure 7c.
3.3. Weld Damage
According to the failure modes of the abovementioned two test specimens and the seismic damage mechanism of steel structures considering the cumulative effect of damage [24], the joint damage is generally divided into three categories: (1) damage caused by plate buckling; (2) damage caused by specimen cracking; (3) no obvious damage before failure, which can be categorized as damage caused by the cracking of welds under tension. According to the experimental results, the load–displacement curve, stress–strain curve, skeleton curve [25], and damage modulus curve [26] under the two loading modes are analyzed.
3.3.1. Weld Damage under Monotonic Loading
• Load–displacement curve
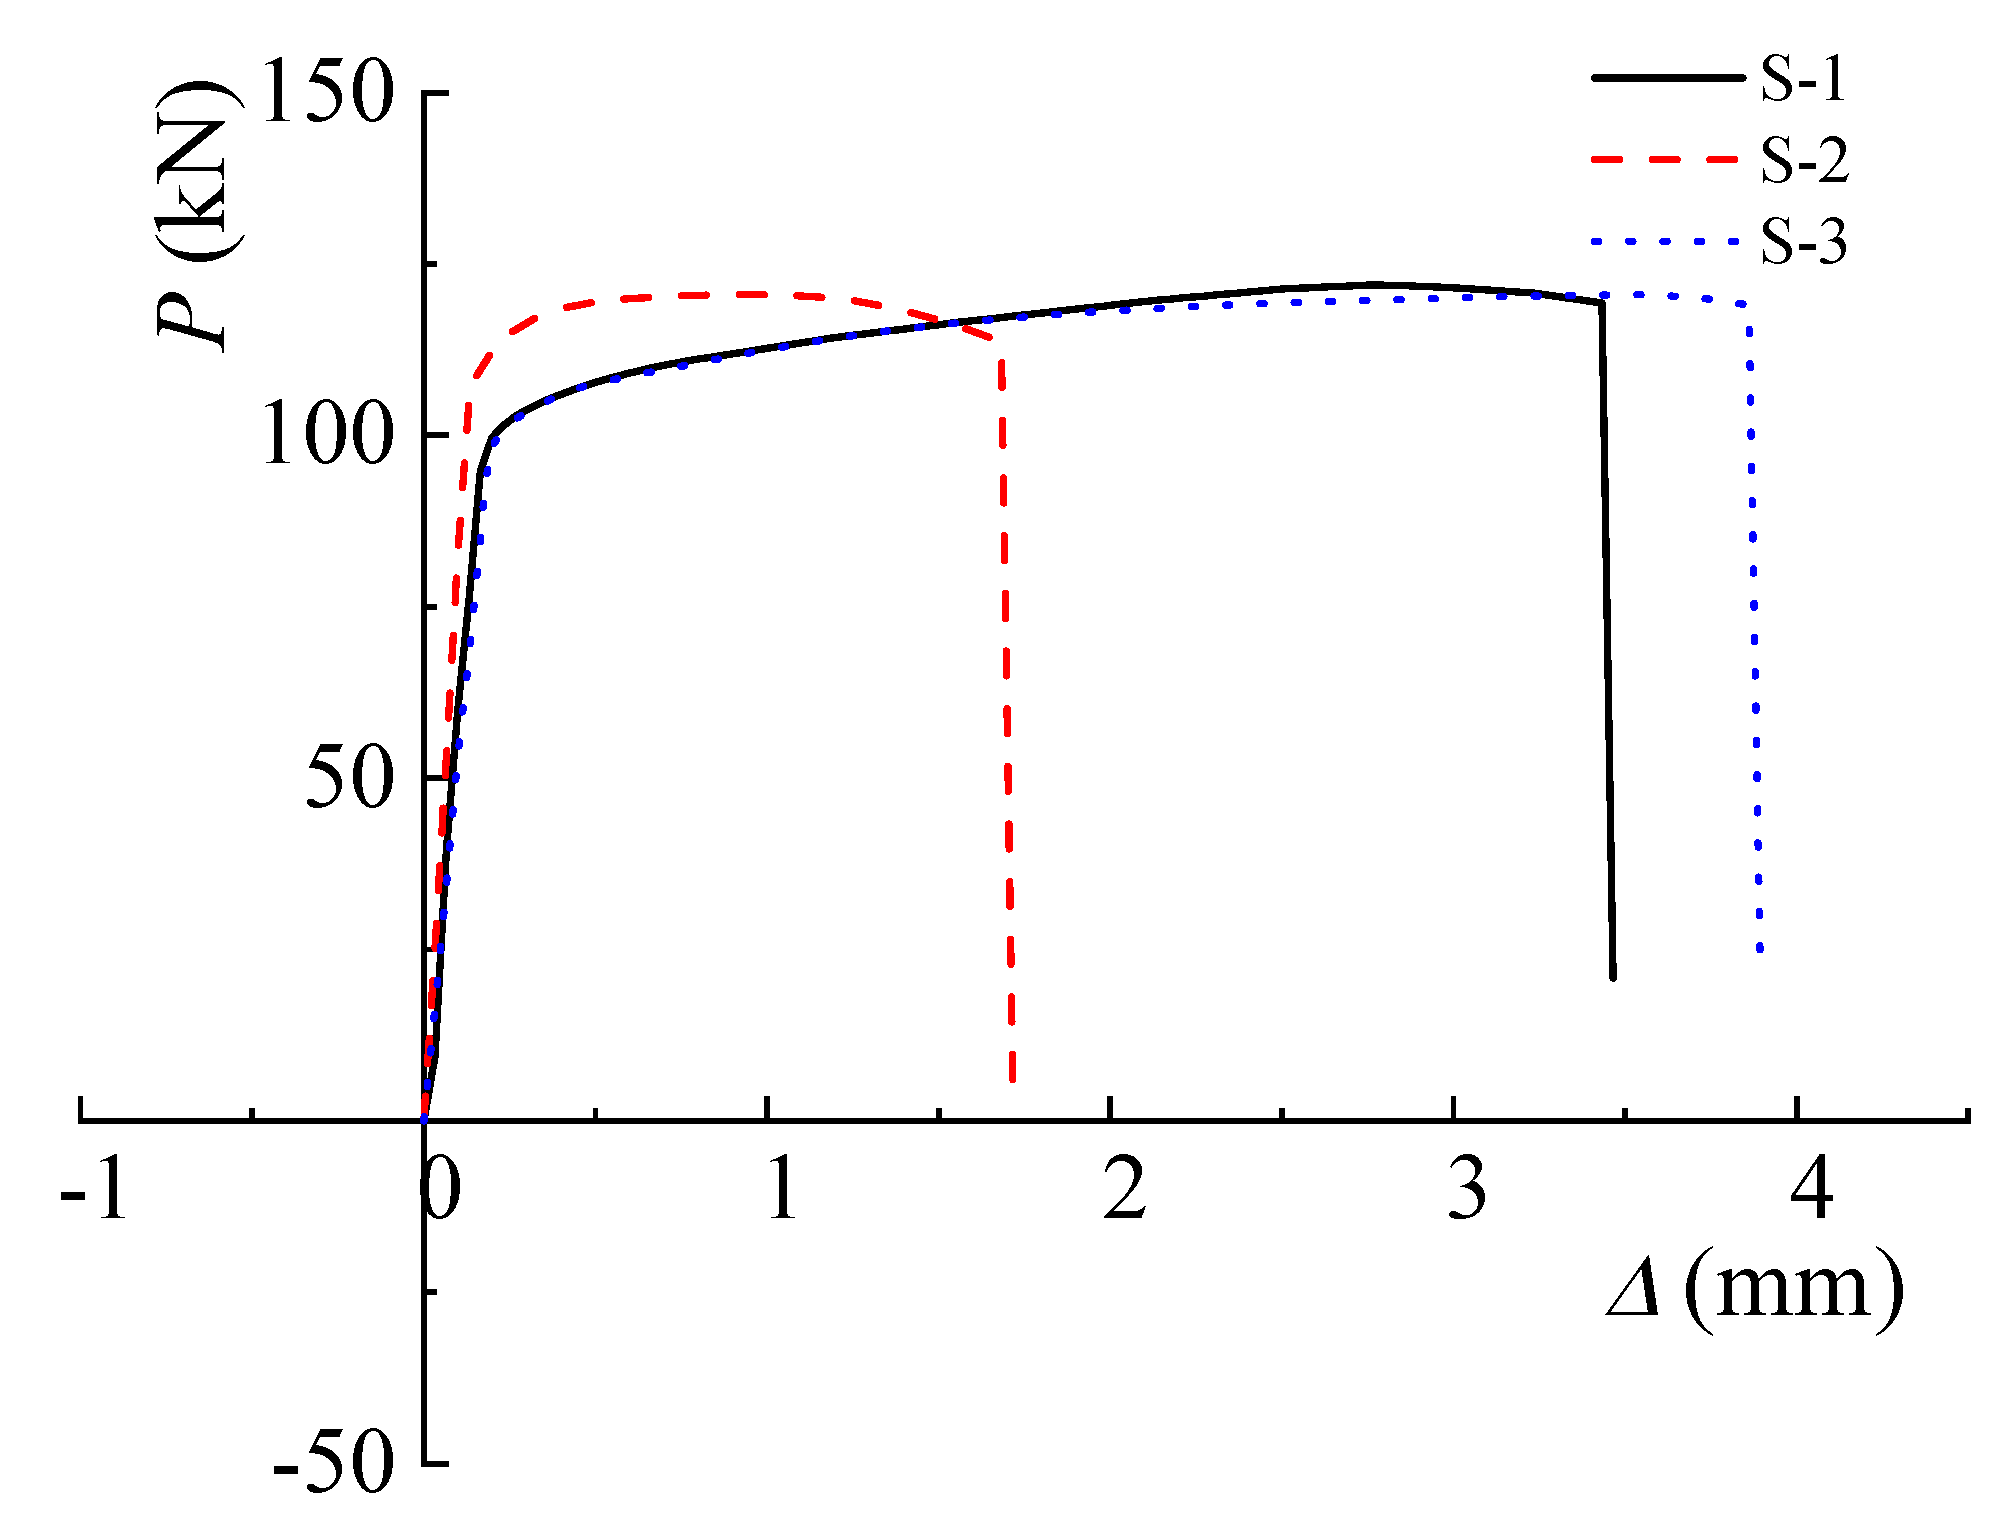
Load–displacement curves of the welded joints from the monotonic tension tests are shown in Figure 8. ΔA is a monotonic tension-induced displacement under the action of change [27]. It can be seen from the diagram that the trend of the S-1 and S-3 curves is somewhat similar. The S-2 curves are quite different from the other two curves due to the non-uniform weld material since the weld was welded manually. The S-2 curves exhibit early damage, and the hardening behavior is not obvious. Considering the non-uniform welding materials, the S-1 curves are not uniform.
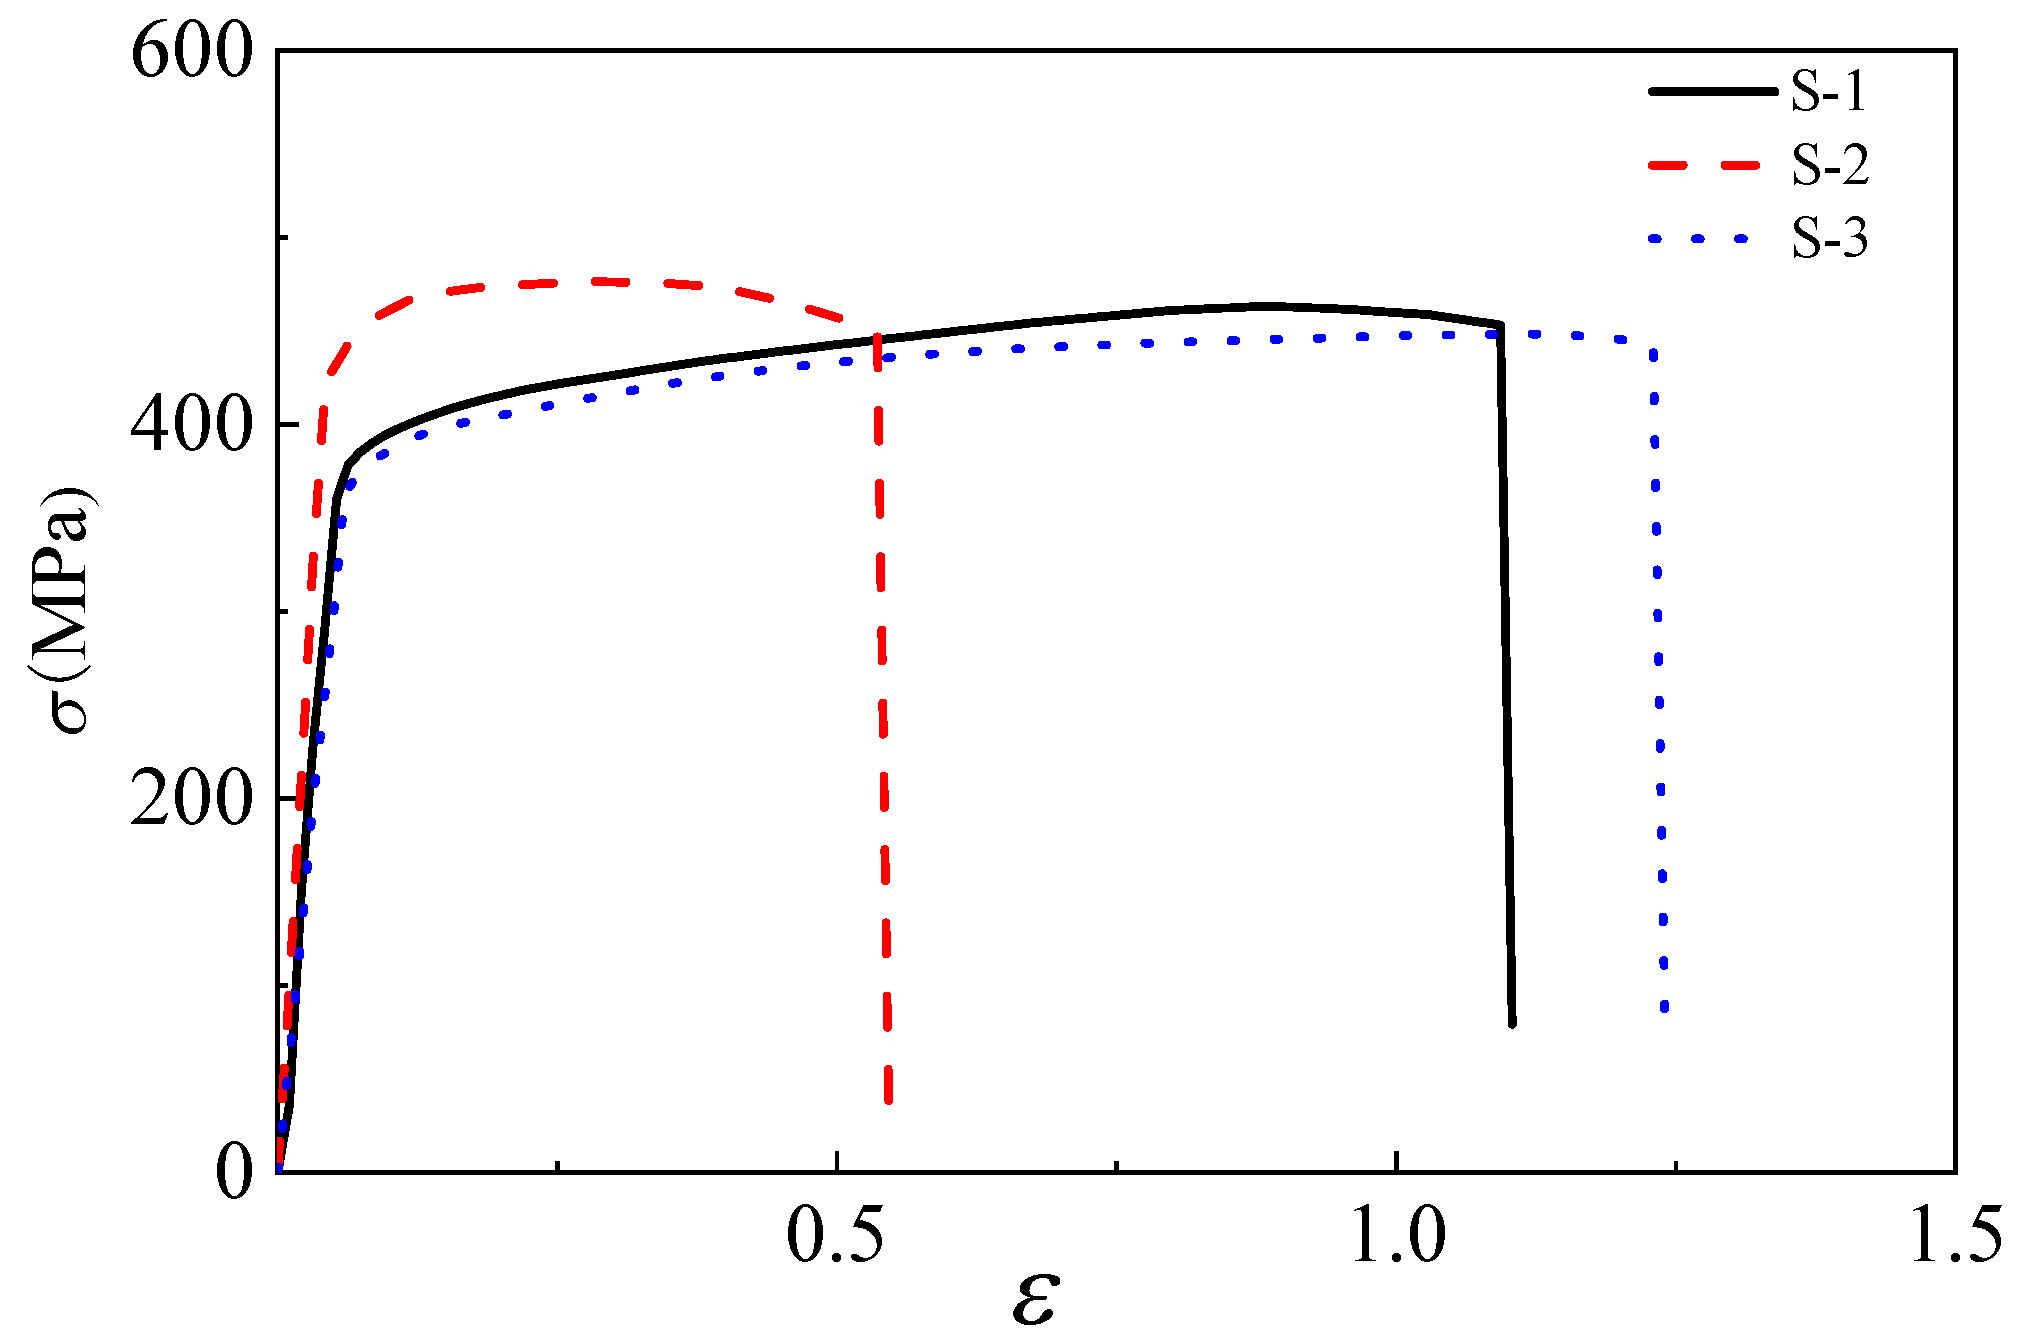
• Stress–strain curve
Stress–strain curves of the welded joints from monotonic tension tests [28] are shown in Figure 9. The curves of S-1 and S-3 are similar, while the curves of S-2 specimens change abruptly, reflecting no obvious strengthening stage and early fracturing. These results may be caused by the non-uniform weld material. Before the specimen yielded, the strain in both the upper and lower plates showed a slow rise. After entering the plastic stage, the rate of increase in the strain increased, but the strain value decreased slightly before fracturing occurred.
• Ultimate bearing capacity and deformation
Through data extraction and calculation, the ultimate bearing capacity and deformation values of the welded joints in the monotonic tension test are shown in Table 2 below.
• Strain distribution
By observing the strain values of the tension plates in the monotonic tension test, it can be seen that the changes in the strain of the three specimens are basically the same, which can be summarized with the following three points:
- Before yielding, the strains of the two pairs of tension plates show a steady increase, and the strain value of the upper plate is obviously larger than that of the lower plate; when the specimen enters the plastic stage, the strain value increases rapidly, and a slight decrease occurs in the early stage of fracturing.
- In the stage between yielding and destruction, the strain values of the two pairs of tension plates increase rapidly, while the strain values at both ends increase slowly.
- The strain changes at the drawing plate are within the allowable range of the material, and there is no necking or fracturing.
3.3.2. Weld Damage under Cyclic Loading
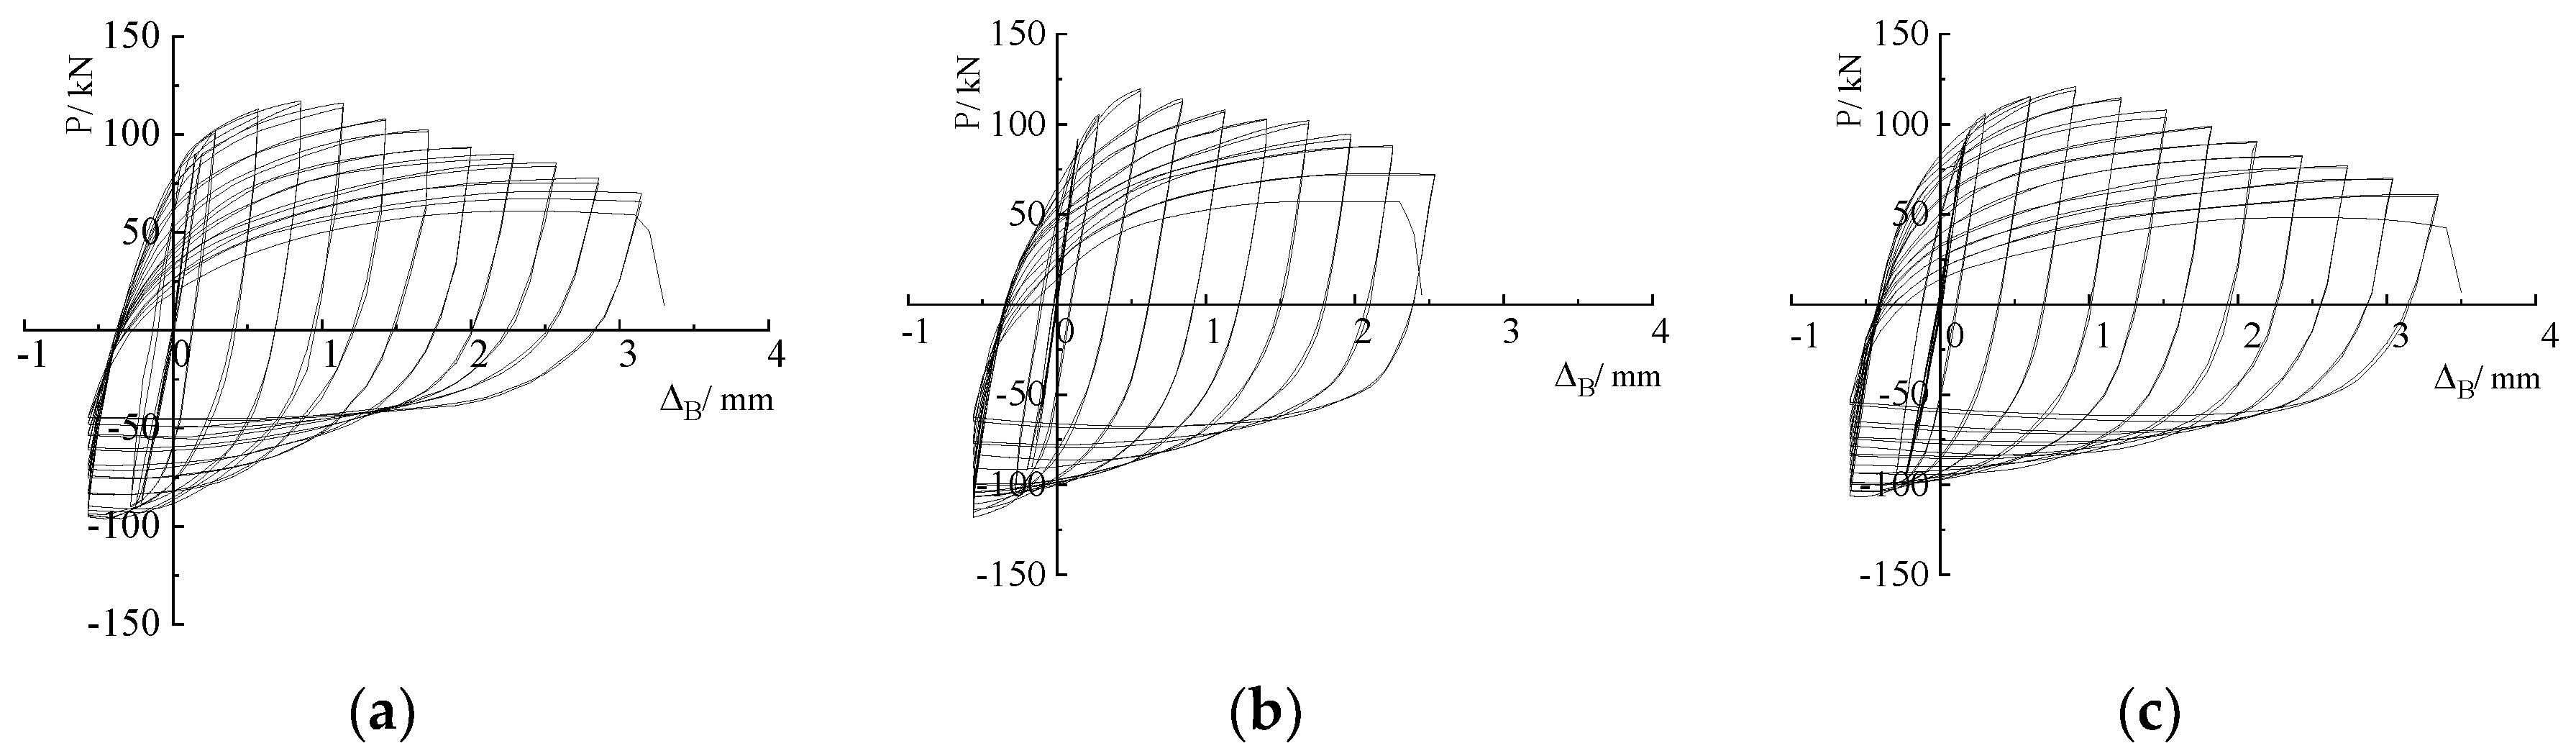
• Load–displacement curve
Load–displacement curves of the welded joints of S-4, S-5, and S-6 from the cyclic tension–compression tests are shown in Figure 10, where only the envelope of each hysteresis curve is shown. ΔB is the displacement change under a cycle of tension and compression.
The three curves all stop at the first quadrant, consuming more energy in tension and less energy in compression, and the pressure load value decreases with the increase in compression-induced displacement at the later stage of loading. Among the specimens, S-6 can bear the largest tension-induced displacement, and S-5 has a small number of hysteresis loop cycles and can bear the largest pressure value.
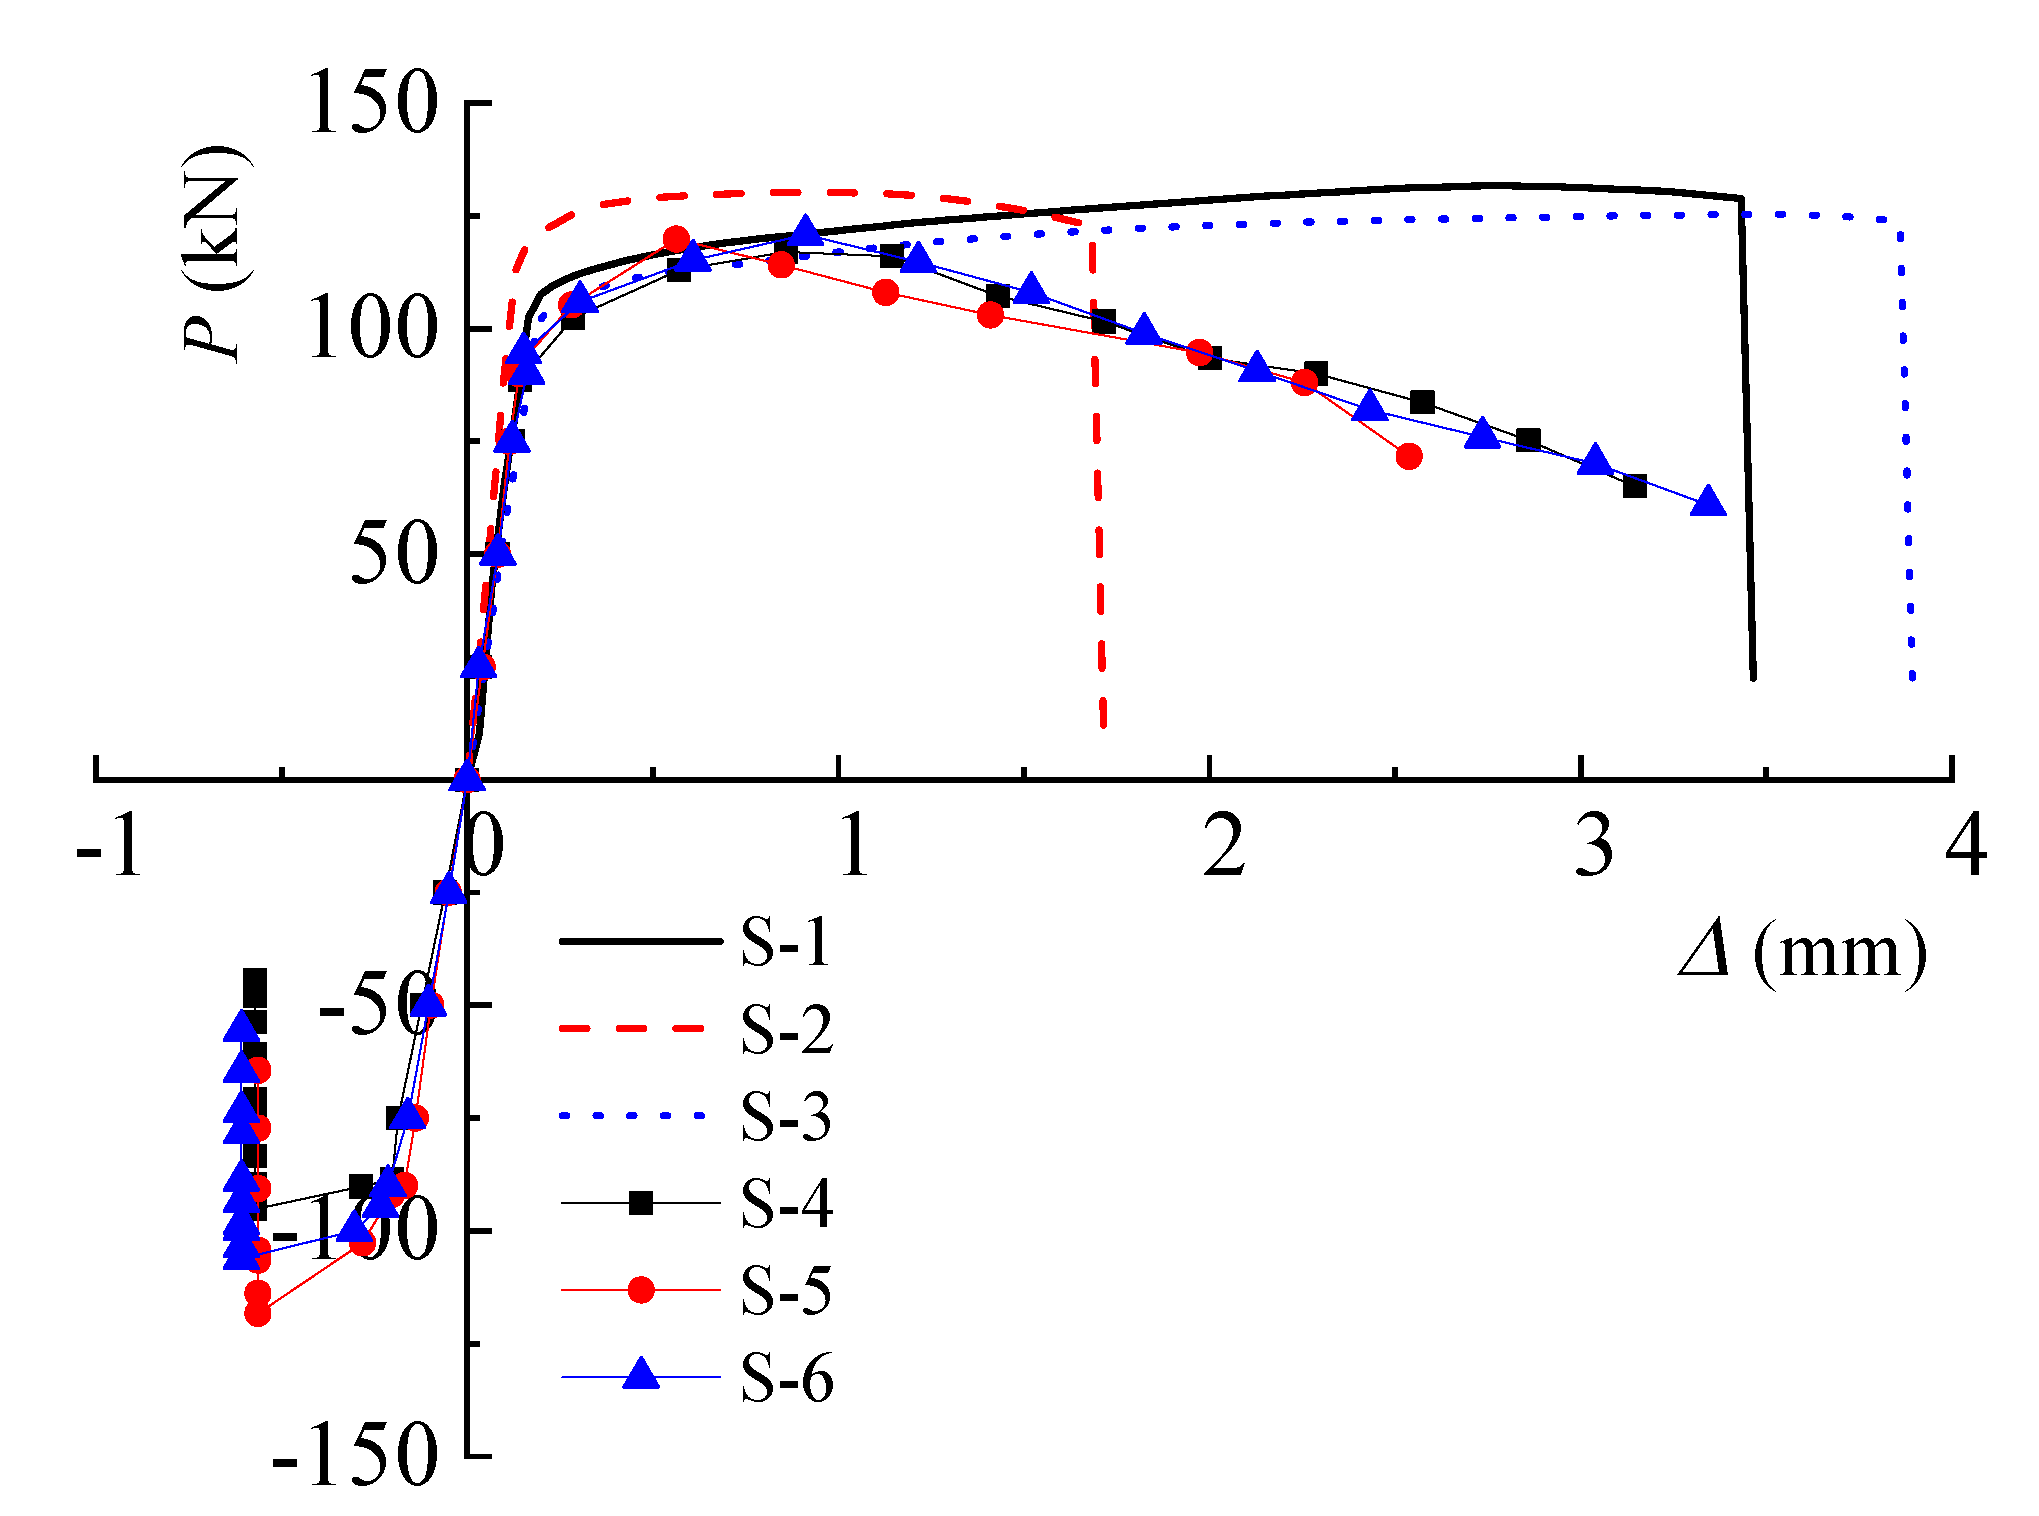
• Skeleton curve
The skeleton curves of the six specimens are drawn from the connection of the extreme points of the cyclic loads in each cycle of the load–displacement curve [29], which illustrate the major characteristics in the loading process, as shown in Figure 11. According to the graph, the peak values of the envelope indicate that the material undergoes a damaging process that deteriorates the mechanical performance of the joints.
• Bearing capacity and deformation
The ductility coefficient is introduced to measure the ductility performance of the specimens [27]:
where Δu is the ultimate displacement of the specimen and Δy is the yield displacement of the specimen.
The number of hysteresis cycles, the load-carrying capacity, and the deformation values of the cyclic tension–compression tests are shown in Table 3.
• Strain distribution
The strain development of the three specimens in the cyclic tension–compression test is basically the same as that in the monotonic tension test, but the peak strain in the cyclic tension–compression test is smaller. When the displacement reaches 4Δy, the strain values at the left and right ends of the specimens vary greatly and show an irregular state, indicating that the welded joint plate specimens slightly buckle under pressure.
3.4. Degradation Process of Weld Damage
3.4.1. Damage Modulus Curve
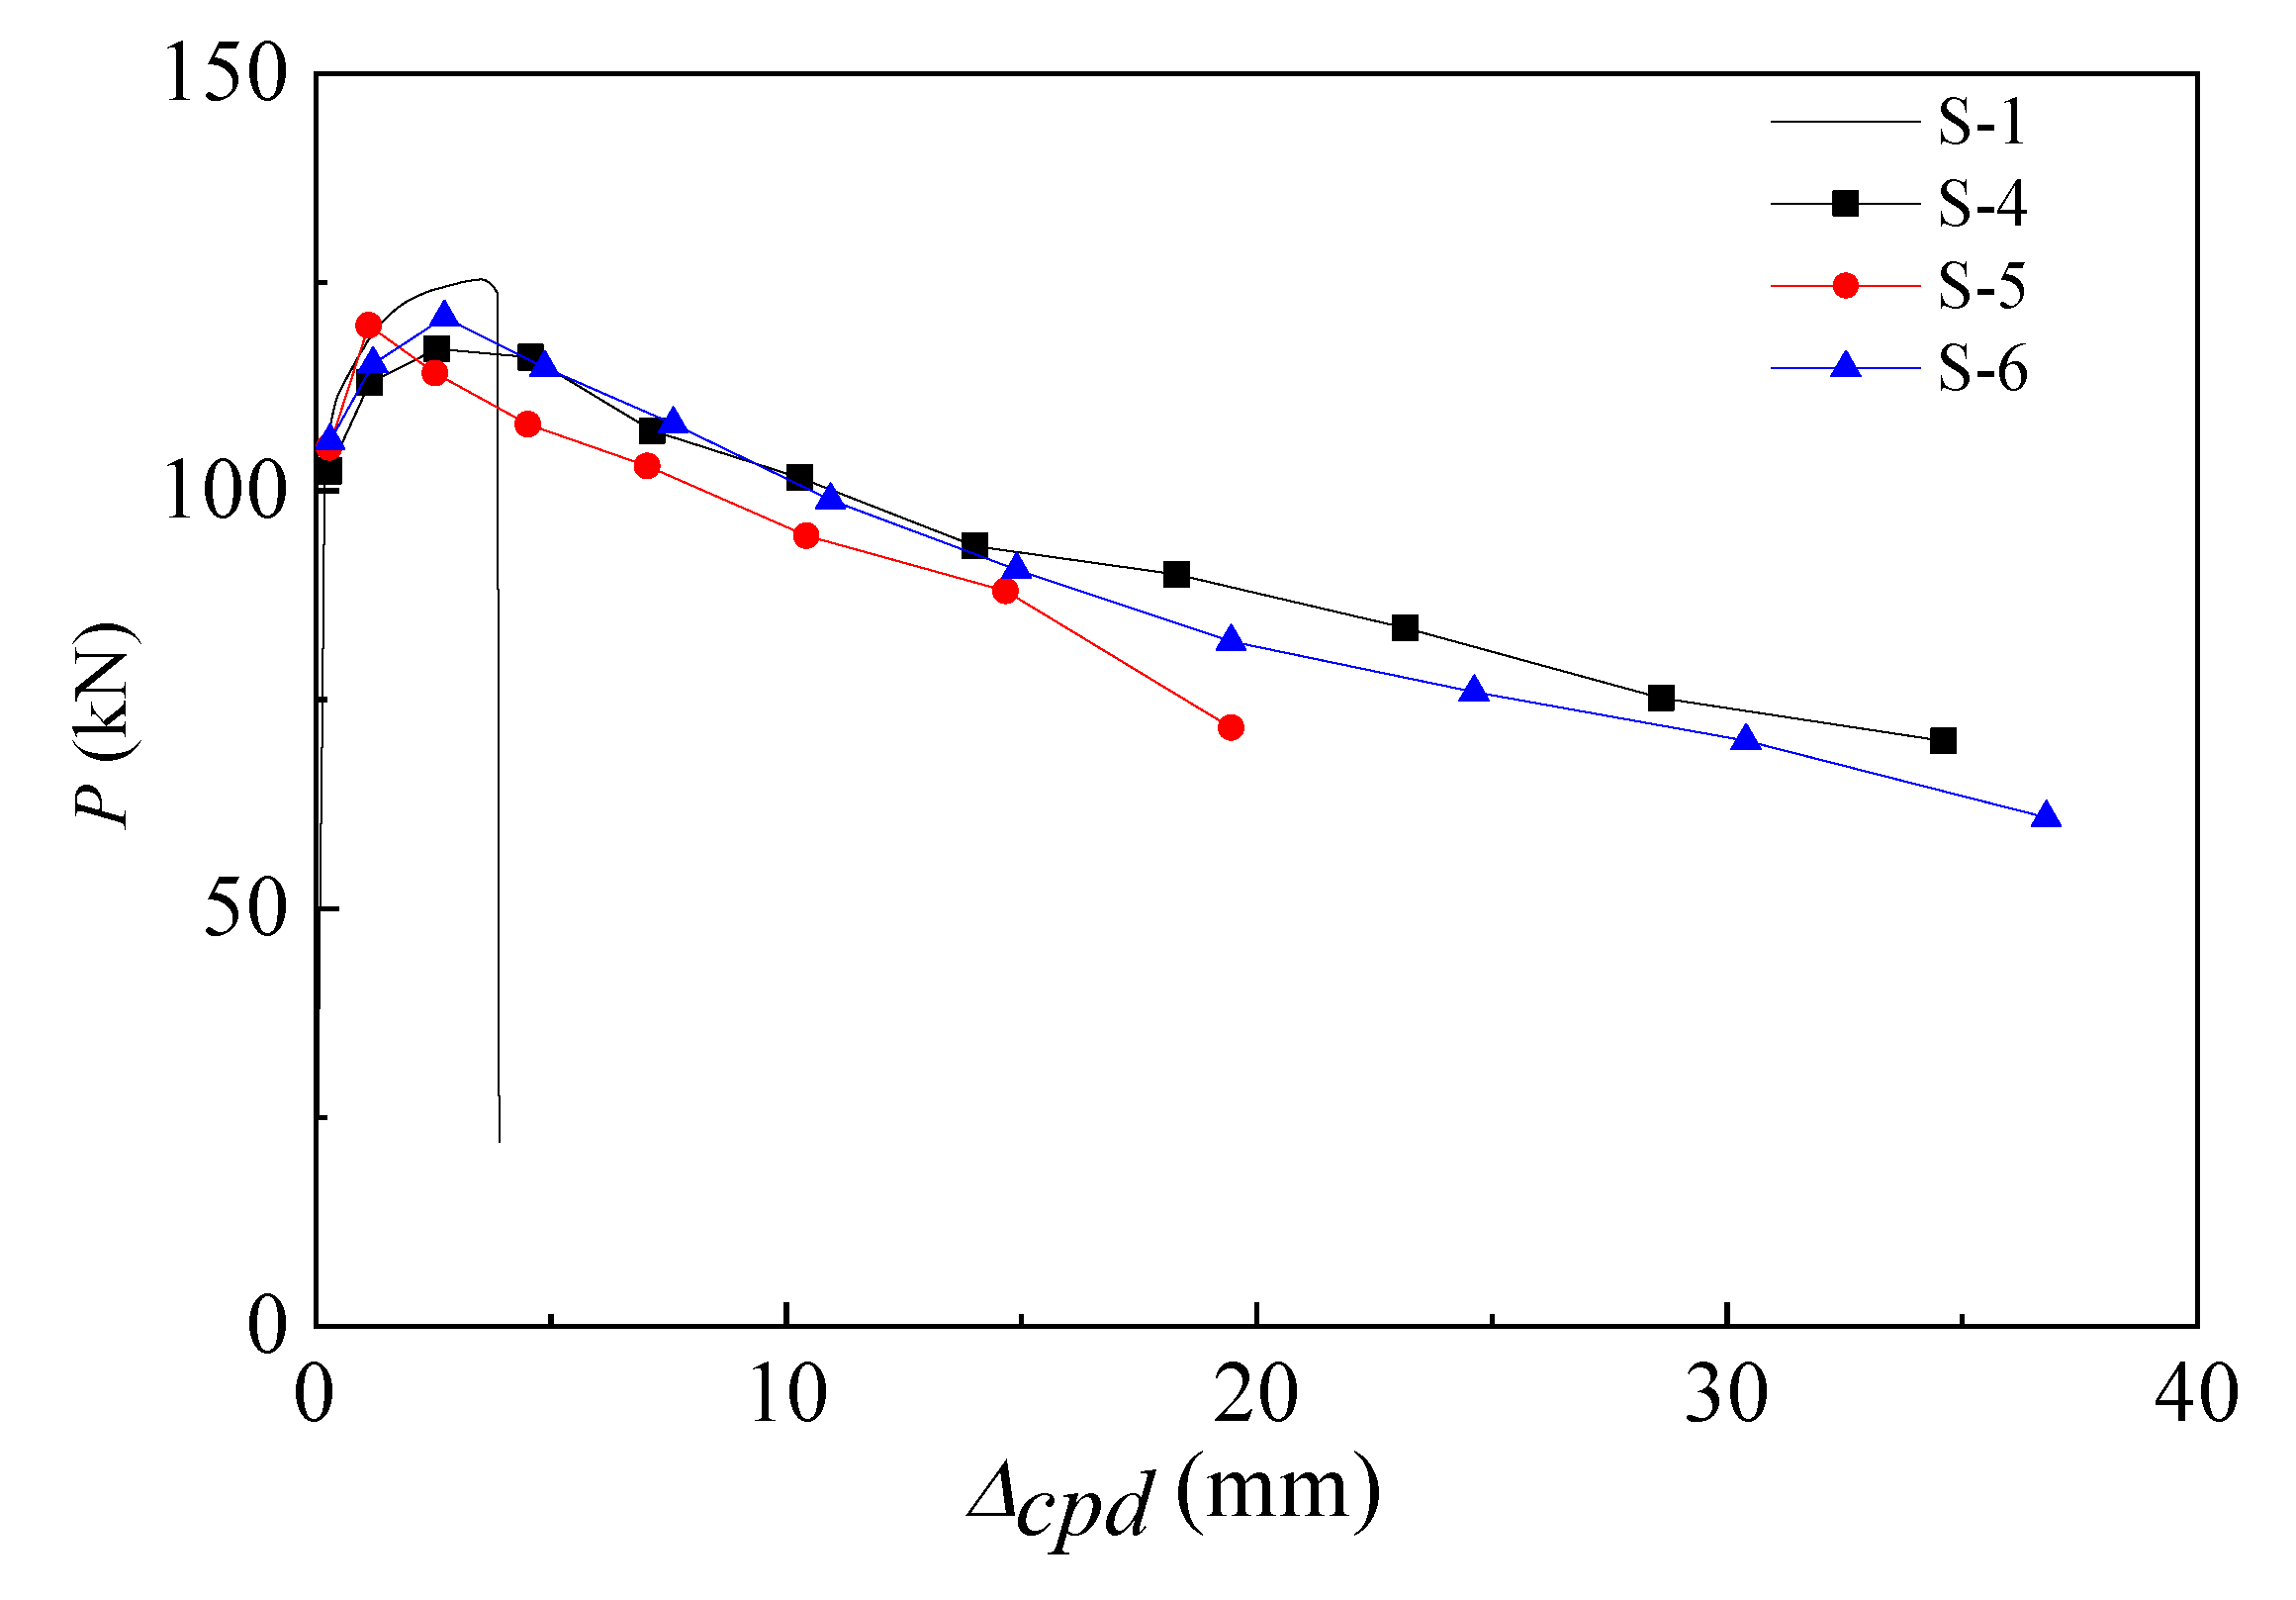
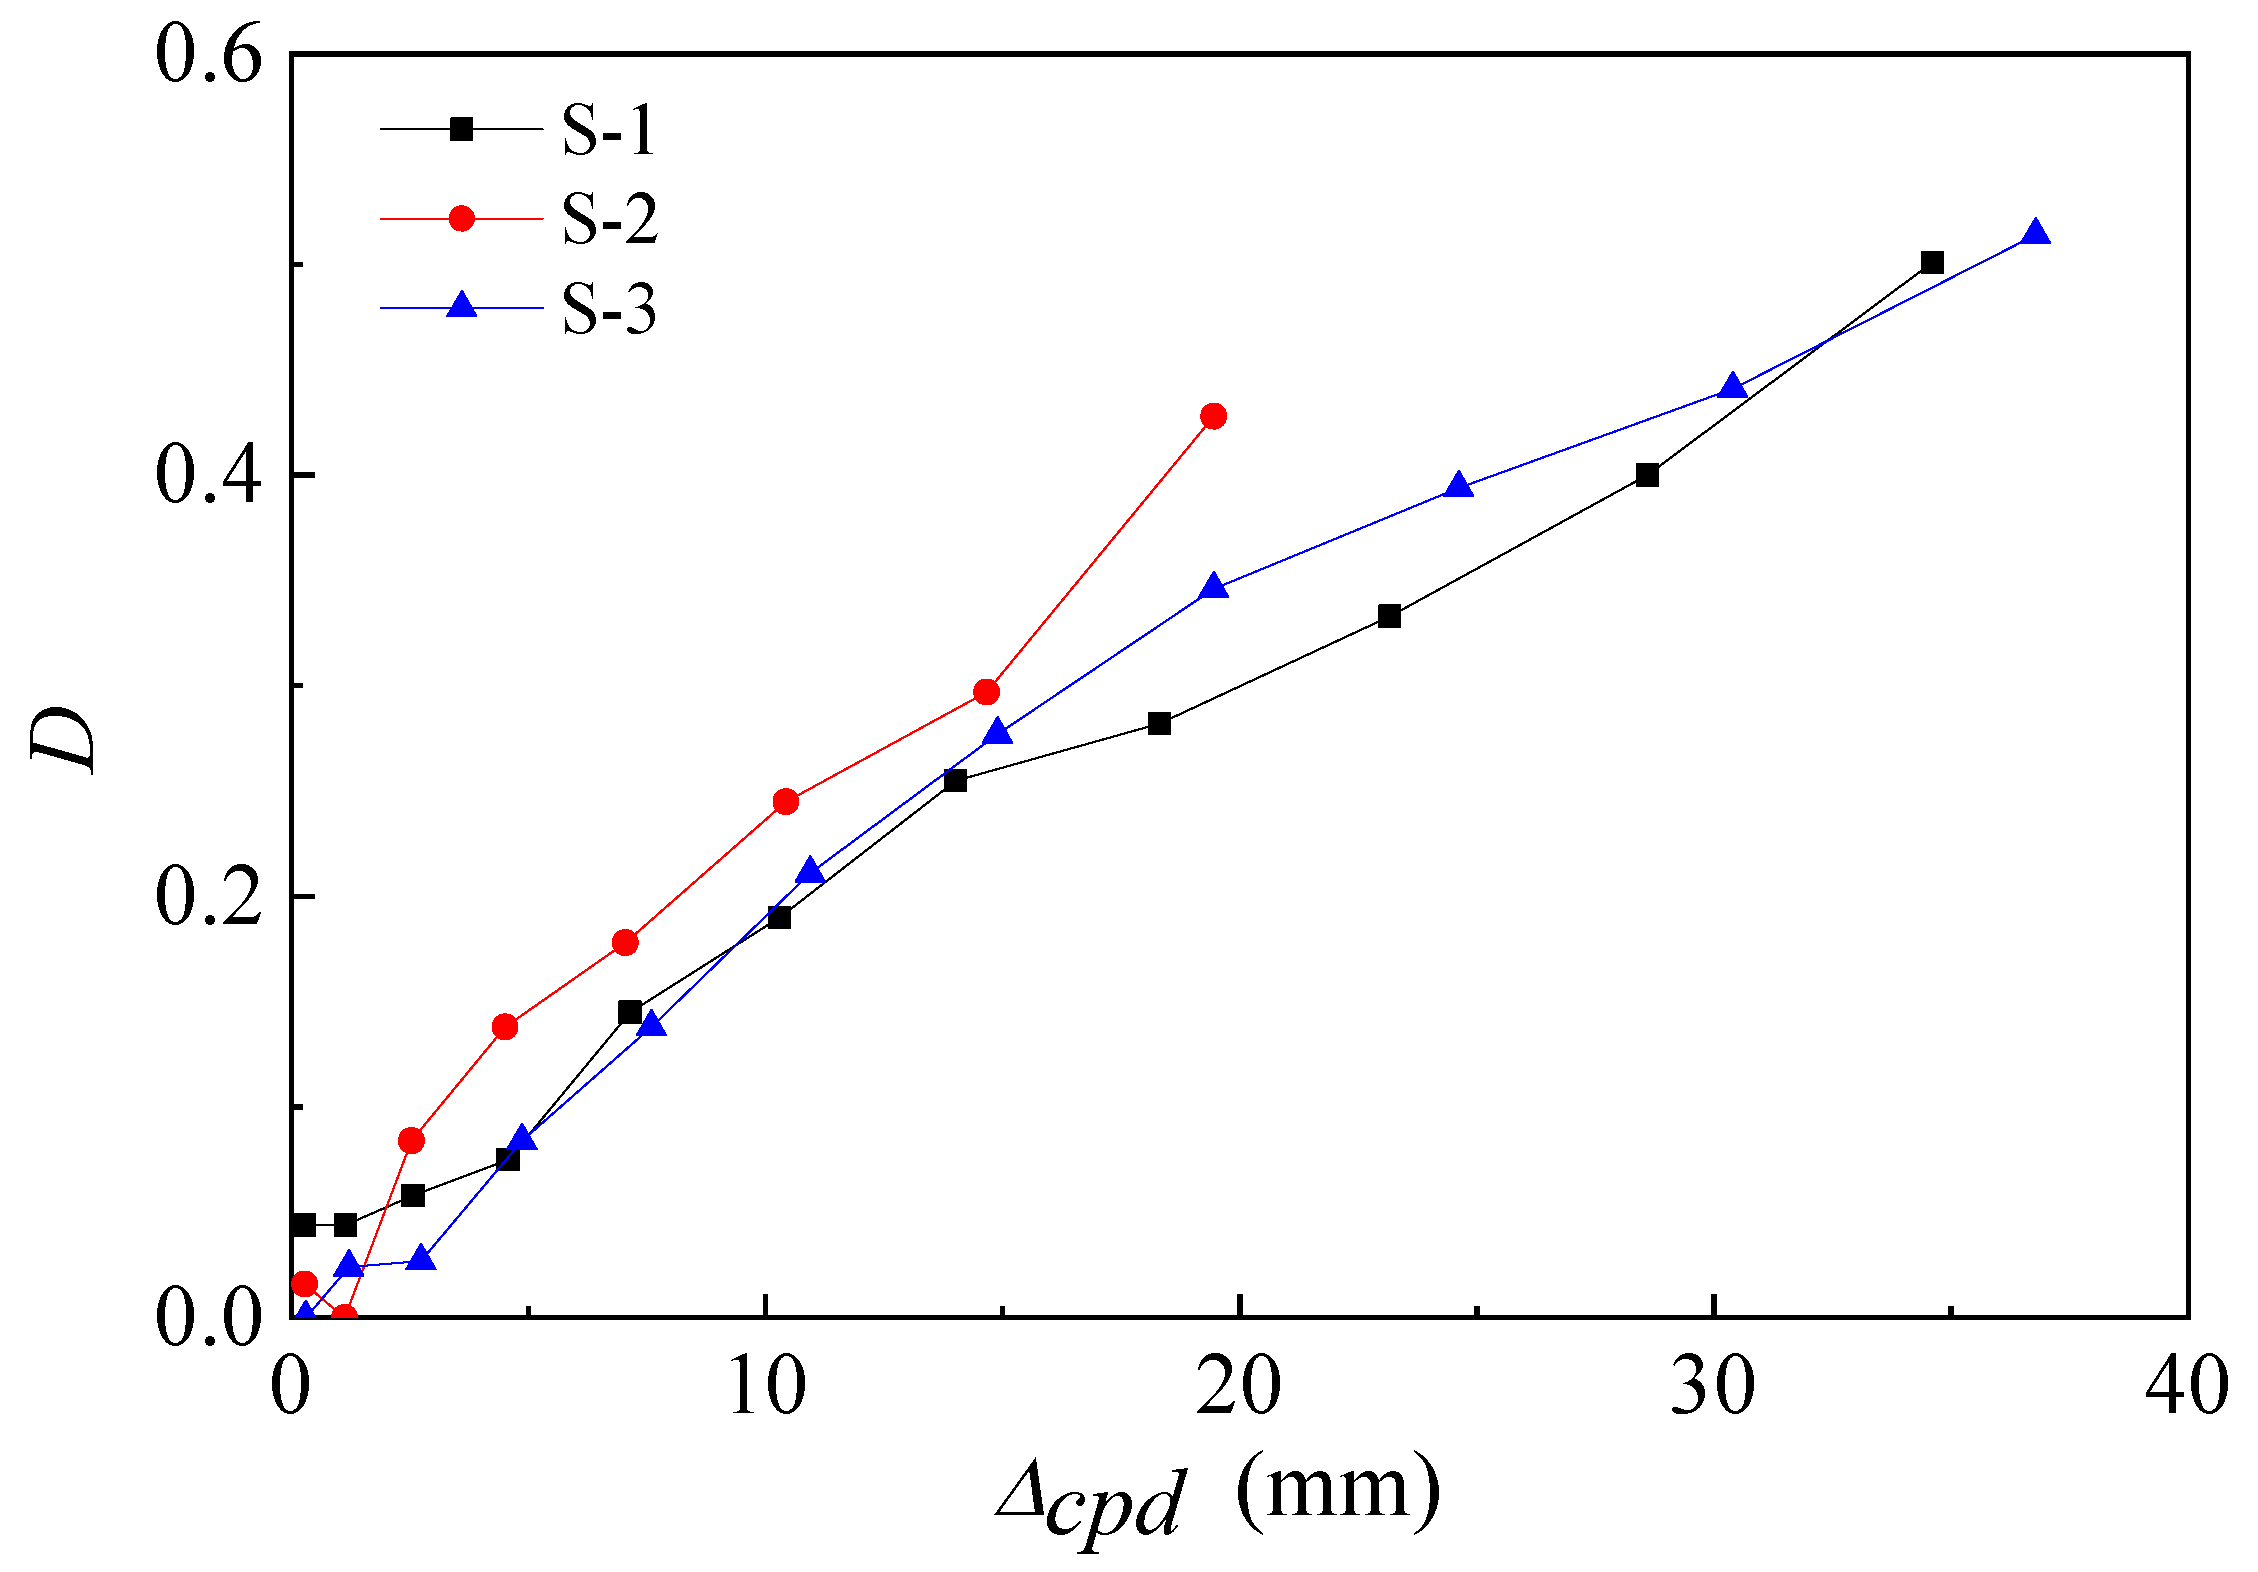
The damage modulus of the cyclic tension–compression test [30] specimens under cumulative plastic displacement (Δcpd) after the specimen enters the plasticity stage, is the plastic damage displacement accumulated during the statistical loading process, which is formed by the plastic displacement of each enveloping ring on the hysteretic curve; this value is more advantageous to use as the abscissa when drawing the skeleton curve and the damage modulus curve to more thoroughly and intuitively analyze the damage degradation of the joints) is calculated according to the following formula:
where FD is the bearing capacity of the specimen after damage and Fu is the bearing capacity of the specimen without damage. Fu, here, corresponds to the load value of the load–displacement curve in the monotonic tension test. Because of the small deviation between the maximum strength and material strength of S-1, the data of S-1 are taken as reference data. At the same time, the skeleton curve of the direction of tension with changing cumulative plastic displacement under cyclic tension–compression loading is drawn, as shown in Figure 12.
If the cumulative plastic displacement of the cyclic tension–compression test specimens exceeds that of the monotonic tension test specimens, the ultimate load of monotonic tension test specimens is taken as the nondestructive bearing capacity. The damage modulus curves for the tension and compression cycles are obtained by substitution formulas, as shown in Figure 13.
3.4.2. Damage Model Validation
The damage process of a joint plate is usually divided into three kinds of damage models [31] which are based on the deformation index, the energy index, and a combination index of the deformation and energy. After the above data acquisition and processing, Origin software was used to fit and analyze the parameters C of the above three theoretical models, in which C is the weighted index of the energy damage model and the weighted value of the combined damage model.
The fitting value was negative because the maximum displacement obtained from the tension–compression cyclic loading test was close to the limit displacement of the monotonic tensile test, so the combined damage model of deformation and energy was not suitable. The average value C of the weighted index fitting result of the deformation damage model was 7.81, and that of the energy damage model was 3.57. Thus, the energy damage model is more suitable for the analysis of this type of weld than the displacement damage model.
Substituting the value of parameter C into the formula,
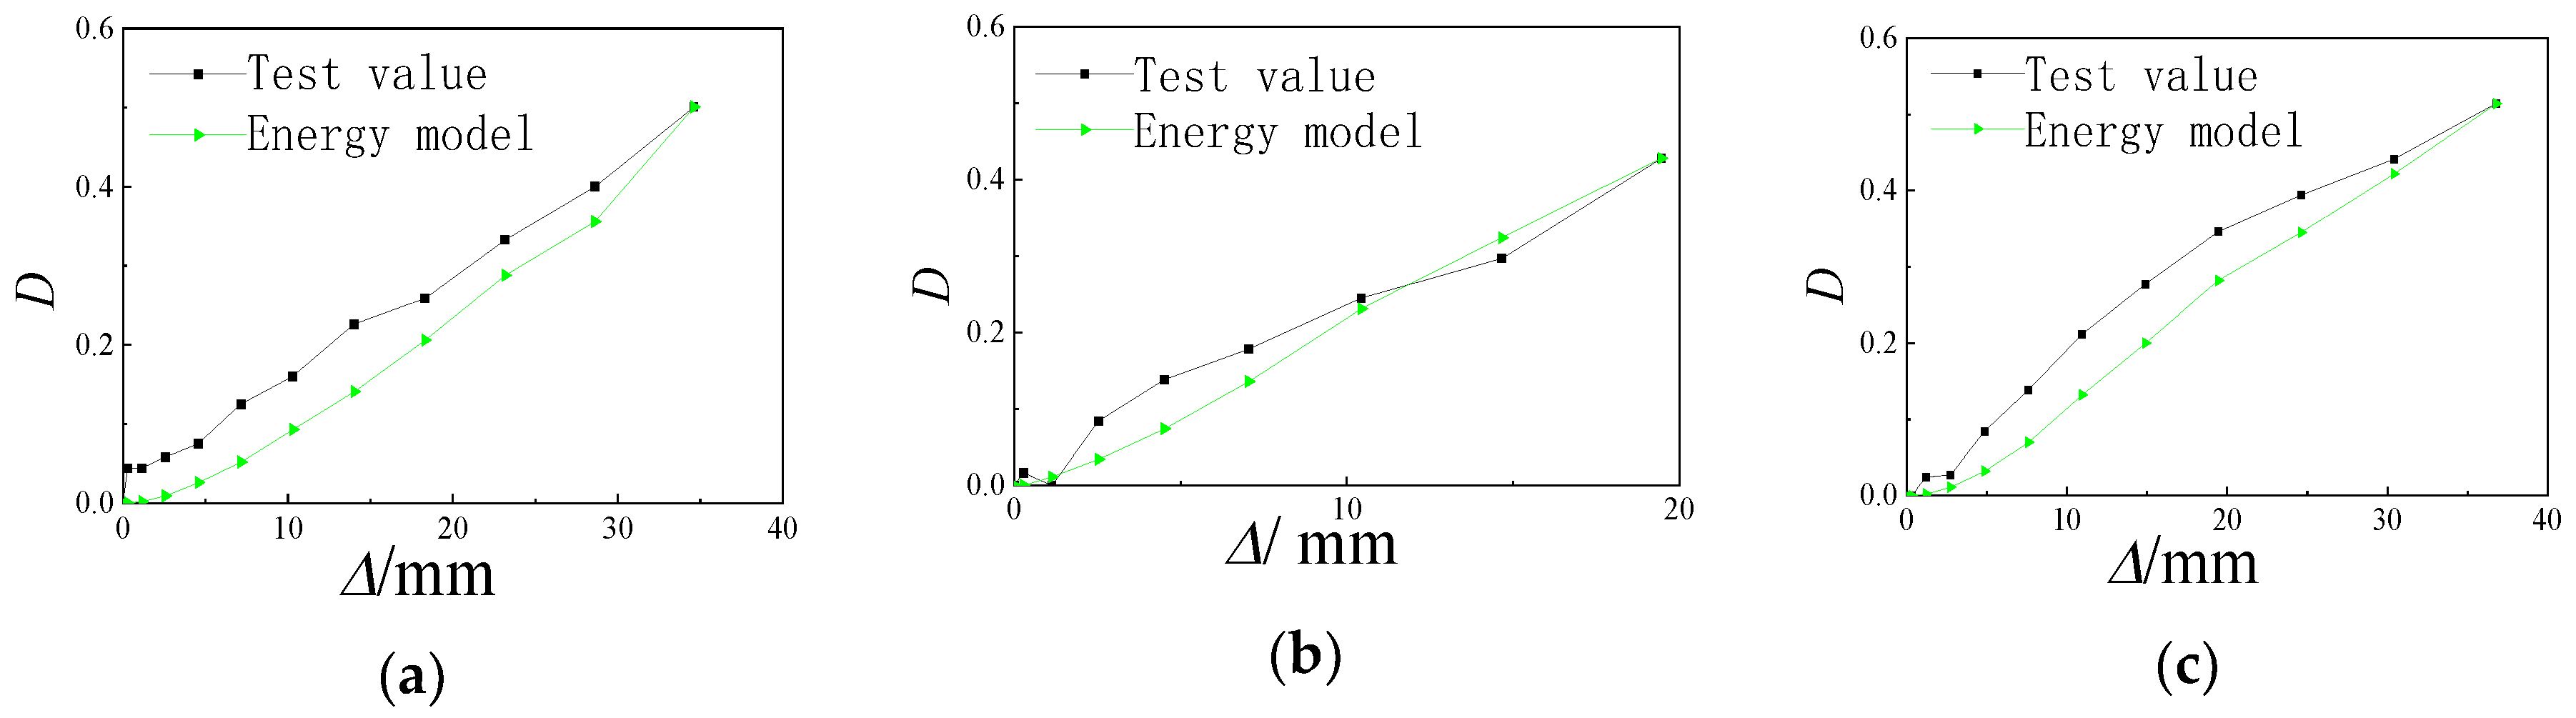
Then, the damage process of the three specimens was simulated. Figure 14 shows the comparison between the energy damage model and the test data, and Table 4 compares the damage model D and the slope K in Figure 14 with the test data. According to the curve and the related data, the energy damage model of the damage modulus slowly increases with increasing cumulative plastic displacement, the overall trend with the test curve is consistent, the early-stage values are lower than the test results, and the fluctuation is larger. The slope comparison is meaningless, as three points of the test results present a stable growth rule, and the differences between the S-4 and S-6 curve slopes and the test curves are small, approximately ±0.005, showing a good simulation effect.
4. Finite Element Analysis
To strengthen further research on weld seam damage, a plate joint analysis model of E5015 electrode welding was established in ABAQUS. The load conditions of this finite element model were the same as those applied to the test specimens. Finally, the simulated value obtained by the finite element model was compared with the experimental value.
4.1. Finite Element Model
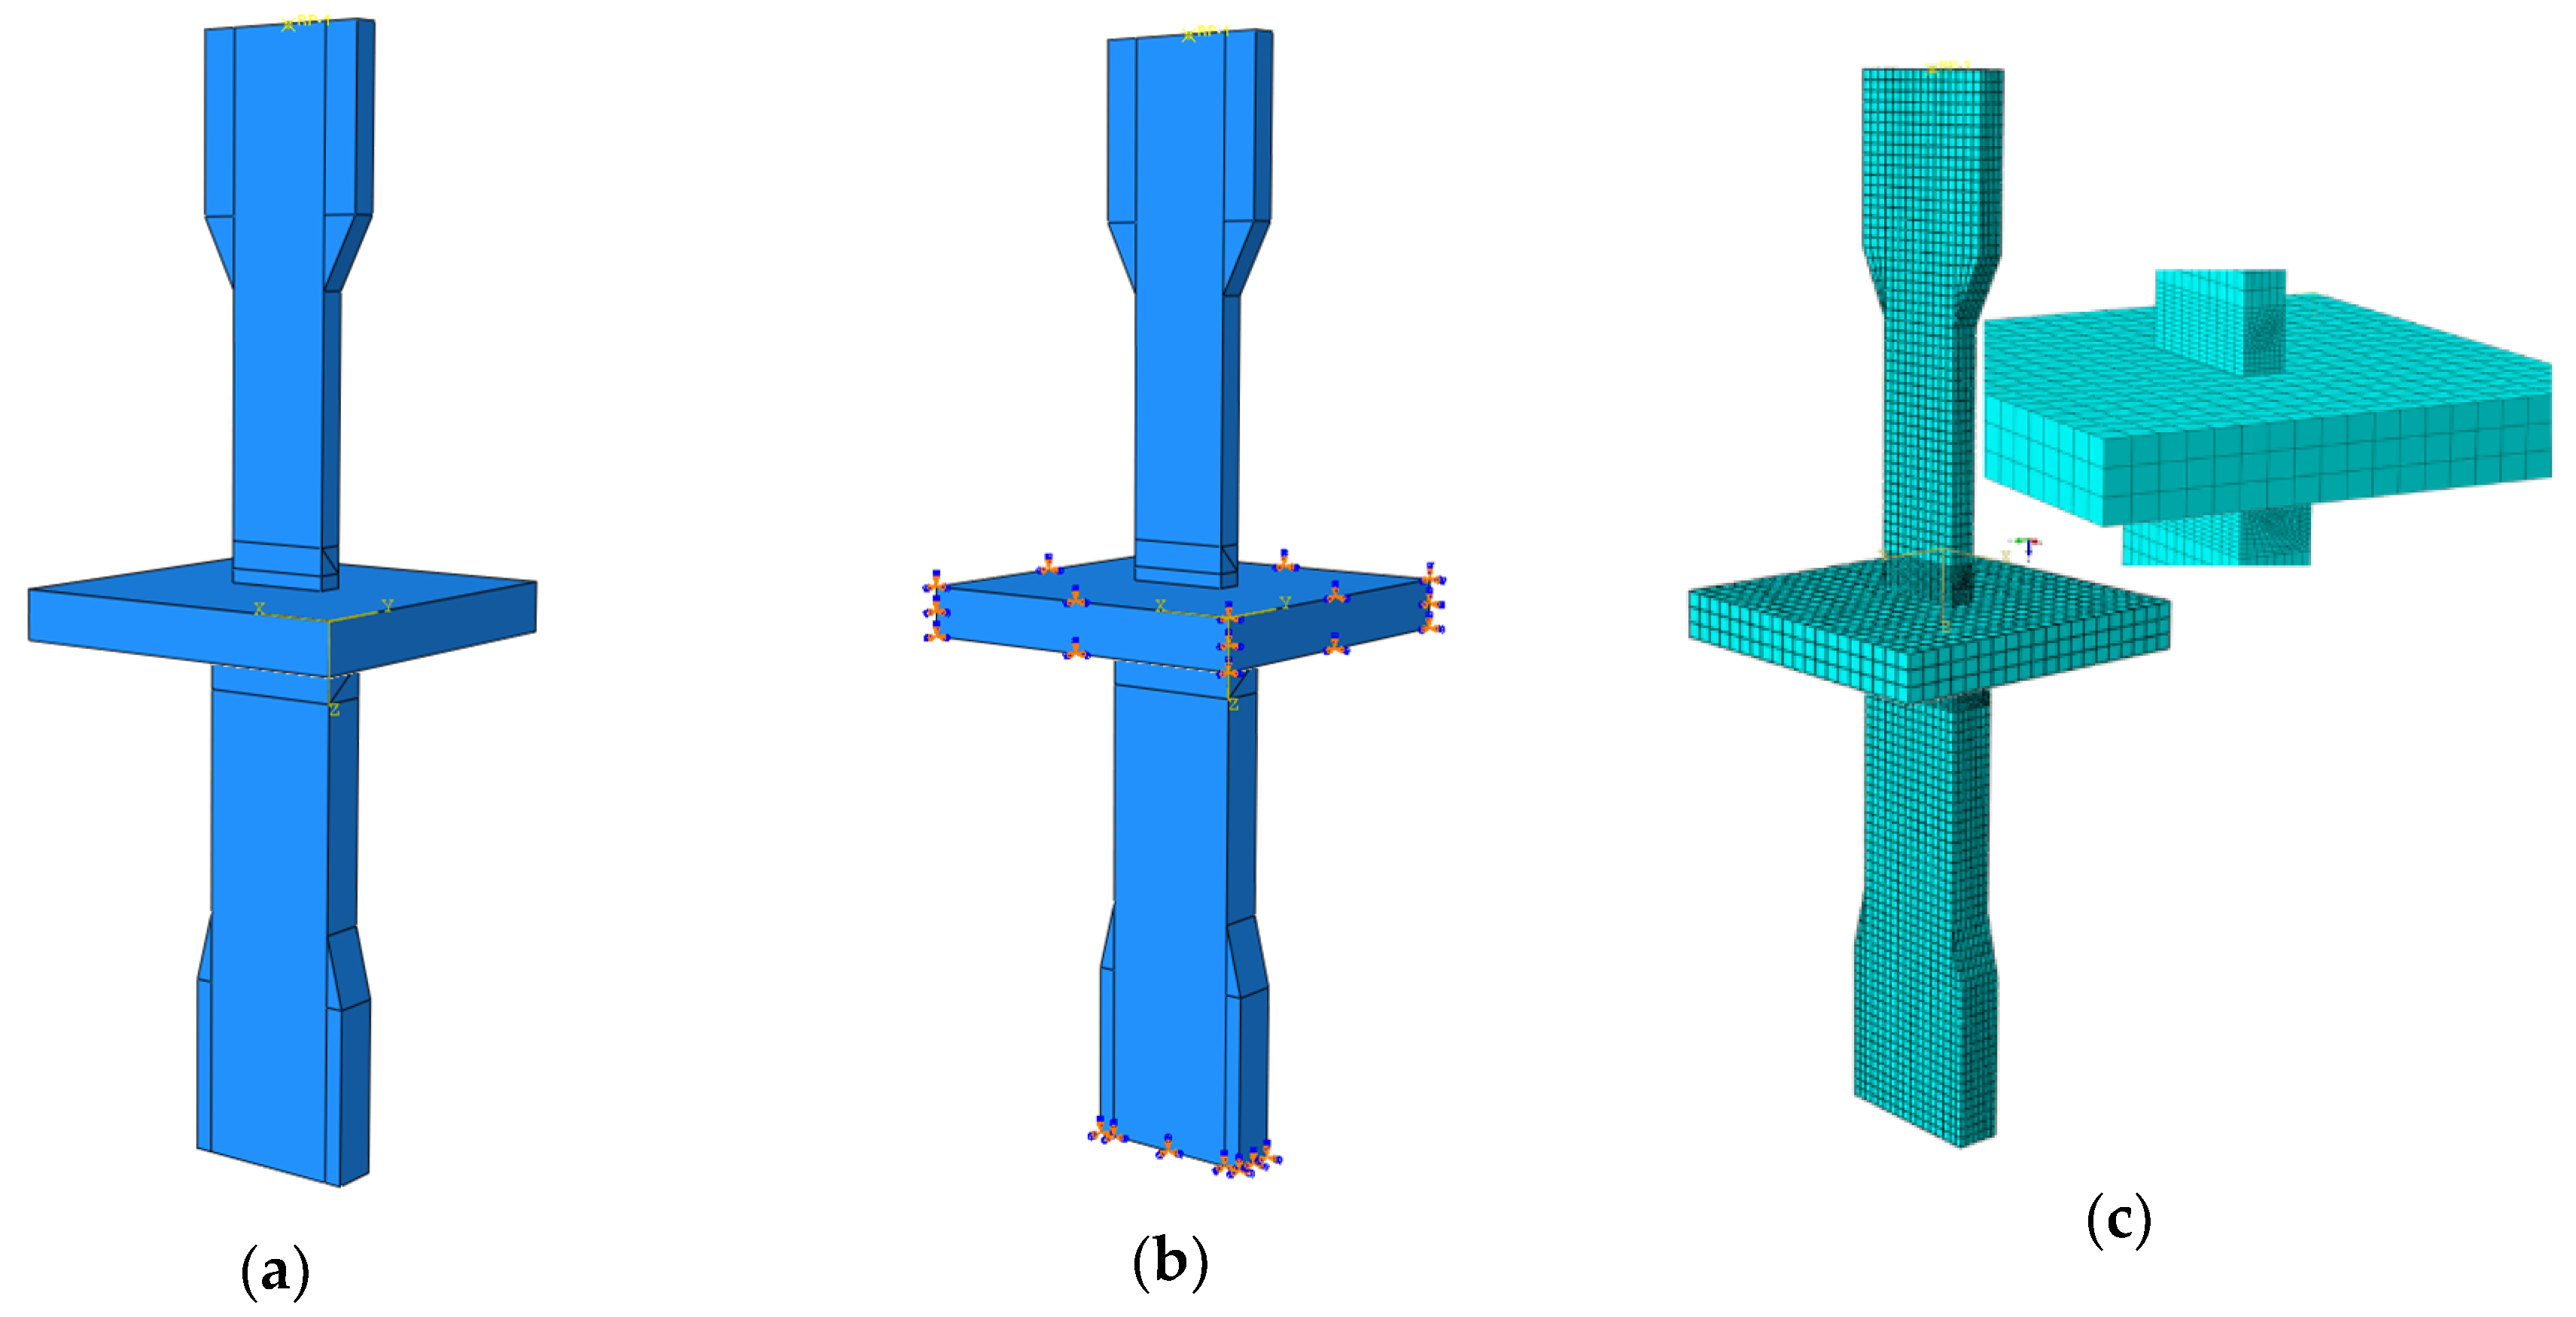
First, the performance parameters of the E5015 electrode determined with E5015 is 204, 720 N/mm2, and Poisson’s ratio is 0.3. A high-precision assembly of the welding seam and steel parts and the assembly model are shown in Figure 15. After the model was built, the interaction between components was defined.
In the load interface module, first the displacements and angles of the x, y, and z axes at both ends of the board were constrained and the displacement at the coupling point was controlled. The loading and boundary conditions are shown in Figure 15b. The loading system is consistent with the test and adopts the cyclic tension and compression loading method. Because the continuous finite element method is used in this analysis, the model will only buckle, without forming cracks.
In the finite element analysis, the solid eight-node hexahedron linear reduction integral element (C3D8R) was selected to conduct mesh division of the model. This element has the advantages of a high division accuracy, lower computing time, and better resistance to buckling deformation. After the overall layout, the grid of the key research areas should be divided. The element size was set as 30 mm, and the mesh of the key area was subdivided. The density at the beam end was 180 mm, the floor plate was set as 10 mm, and the weld was set as 2 mm. The number of elements and nodes was 15,034 and 18,678, respectively. Geometric nonlinearity can be considered in the elastic and elastic-plastic stages of initial loading. The specific division is shown in Figure 15c.
4.2. Verification of the Numerical Model
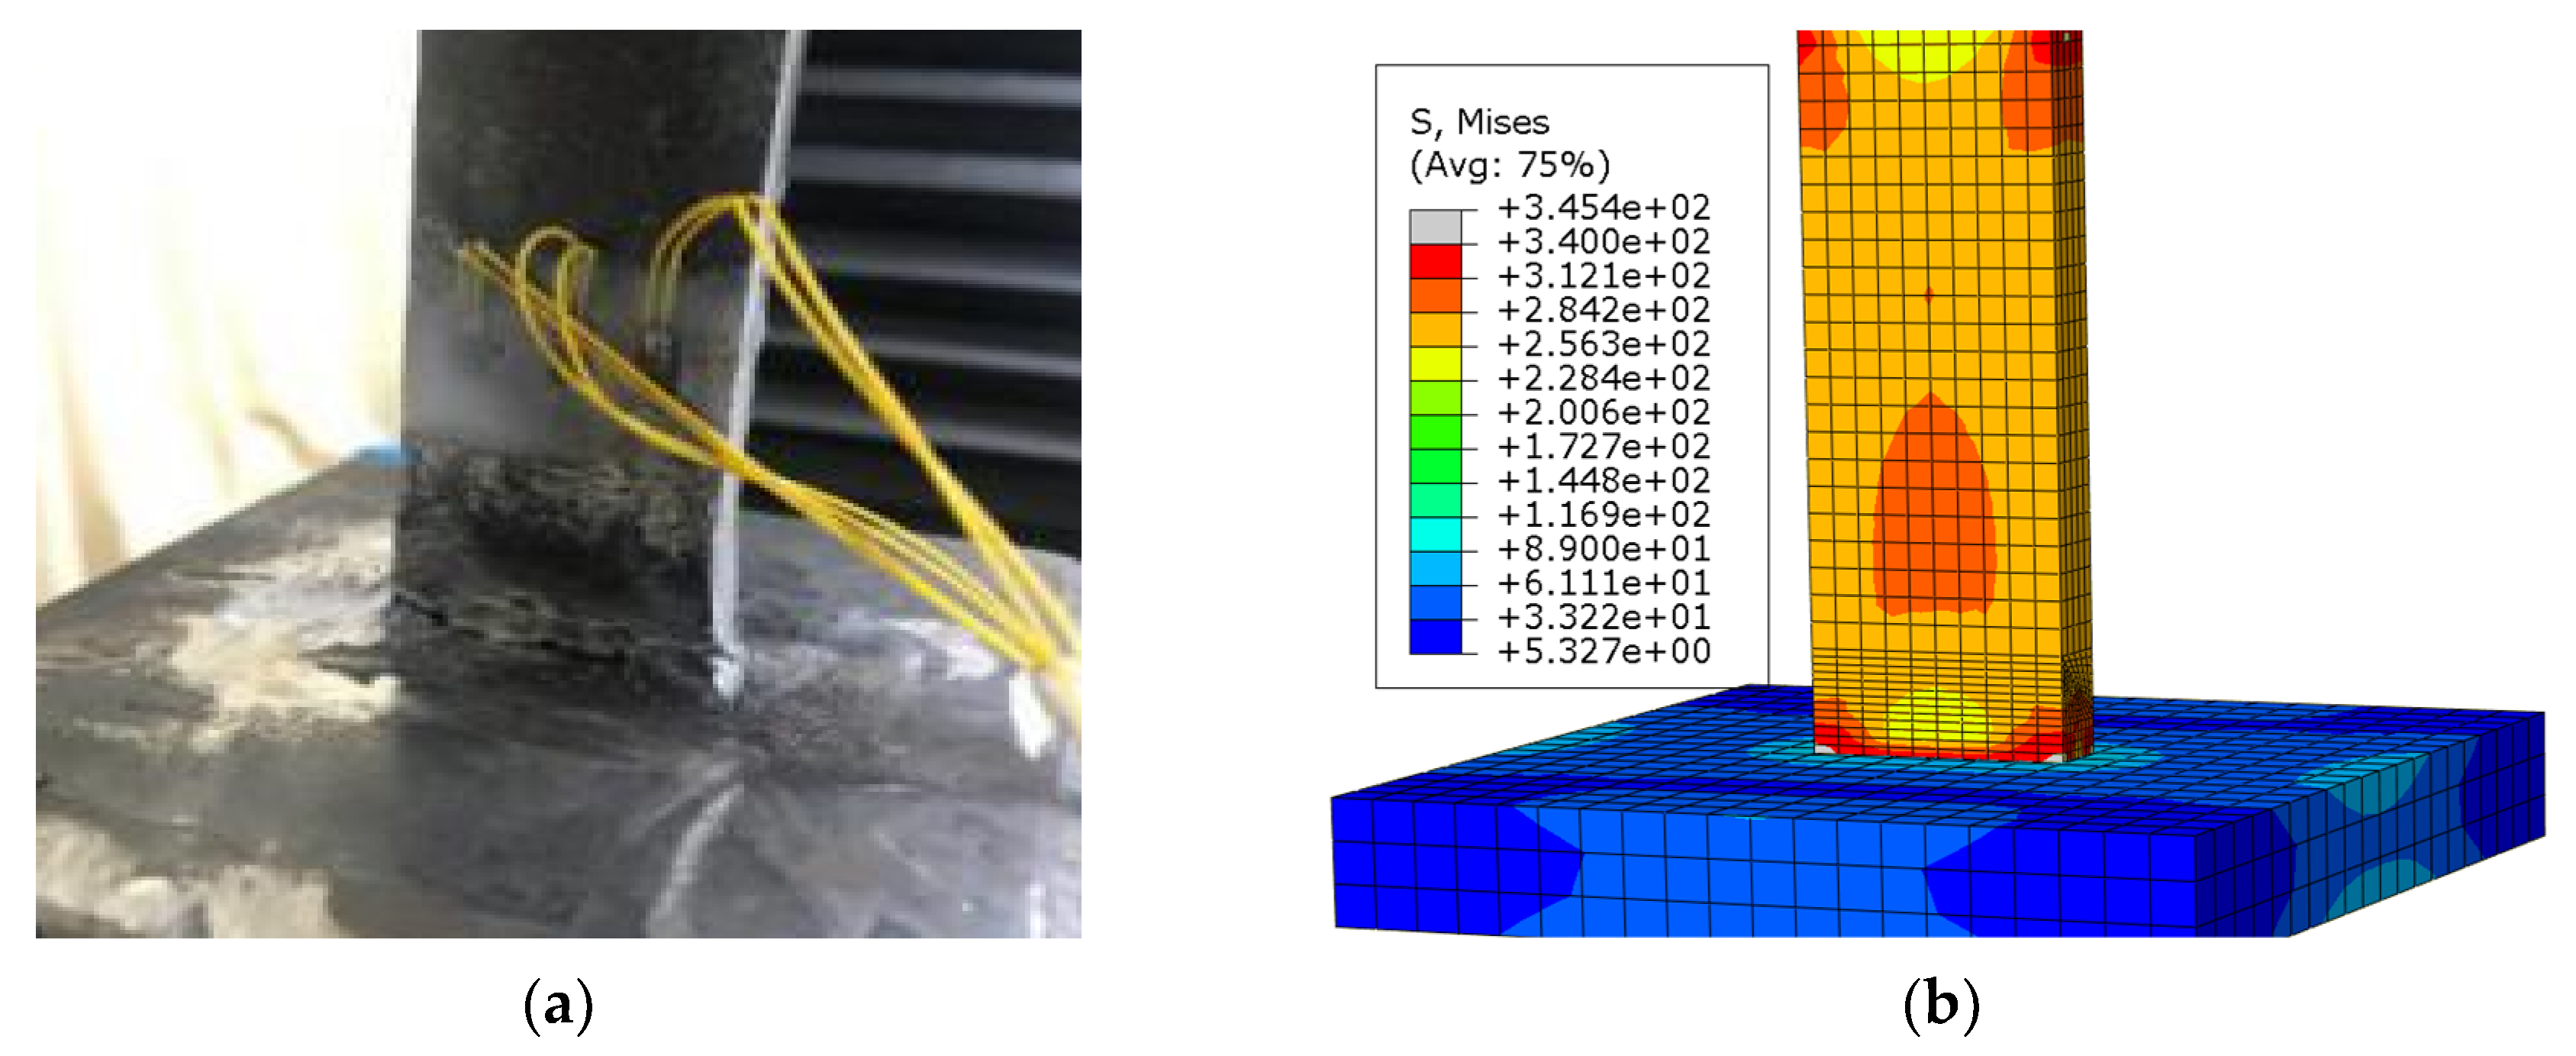
By comparing the stress distributions from the experimental and finite element simulations, it was found that the final fracture of the plate joint does not occur in the center of the plate but in the welding seam, as shown in Figure 16.
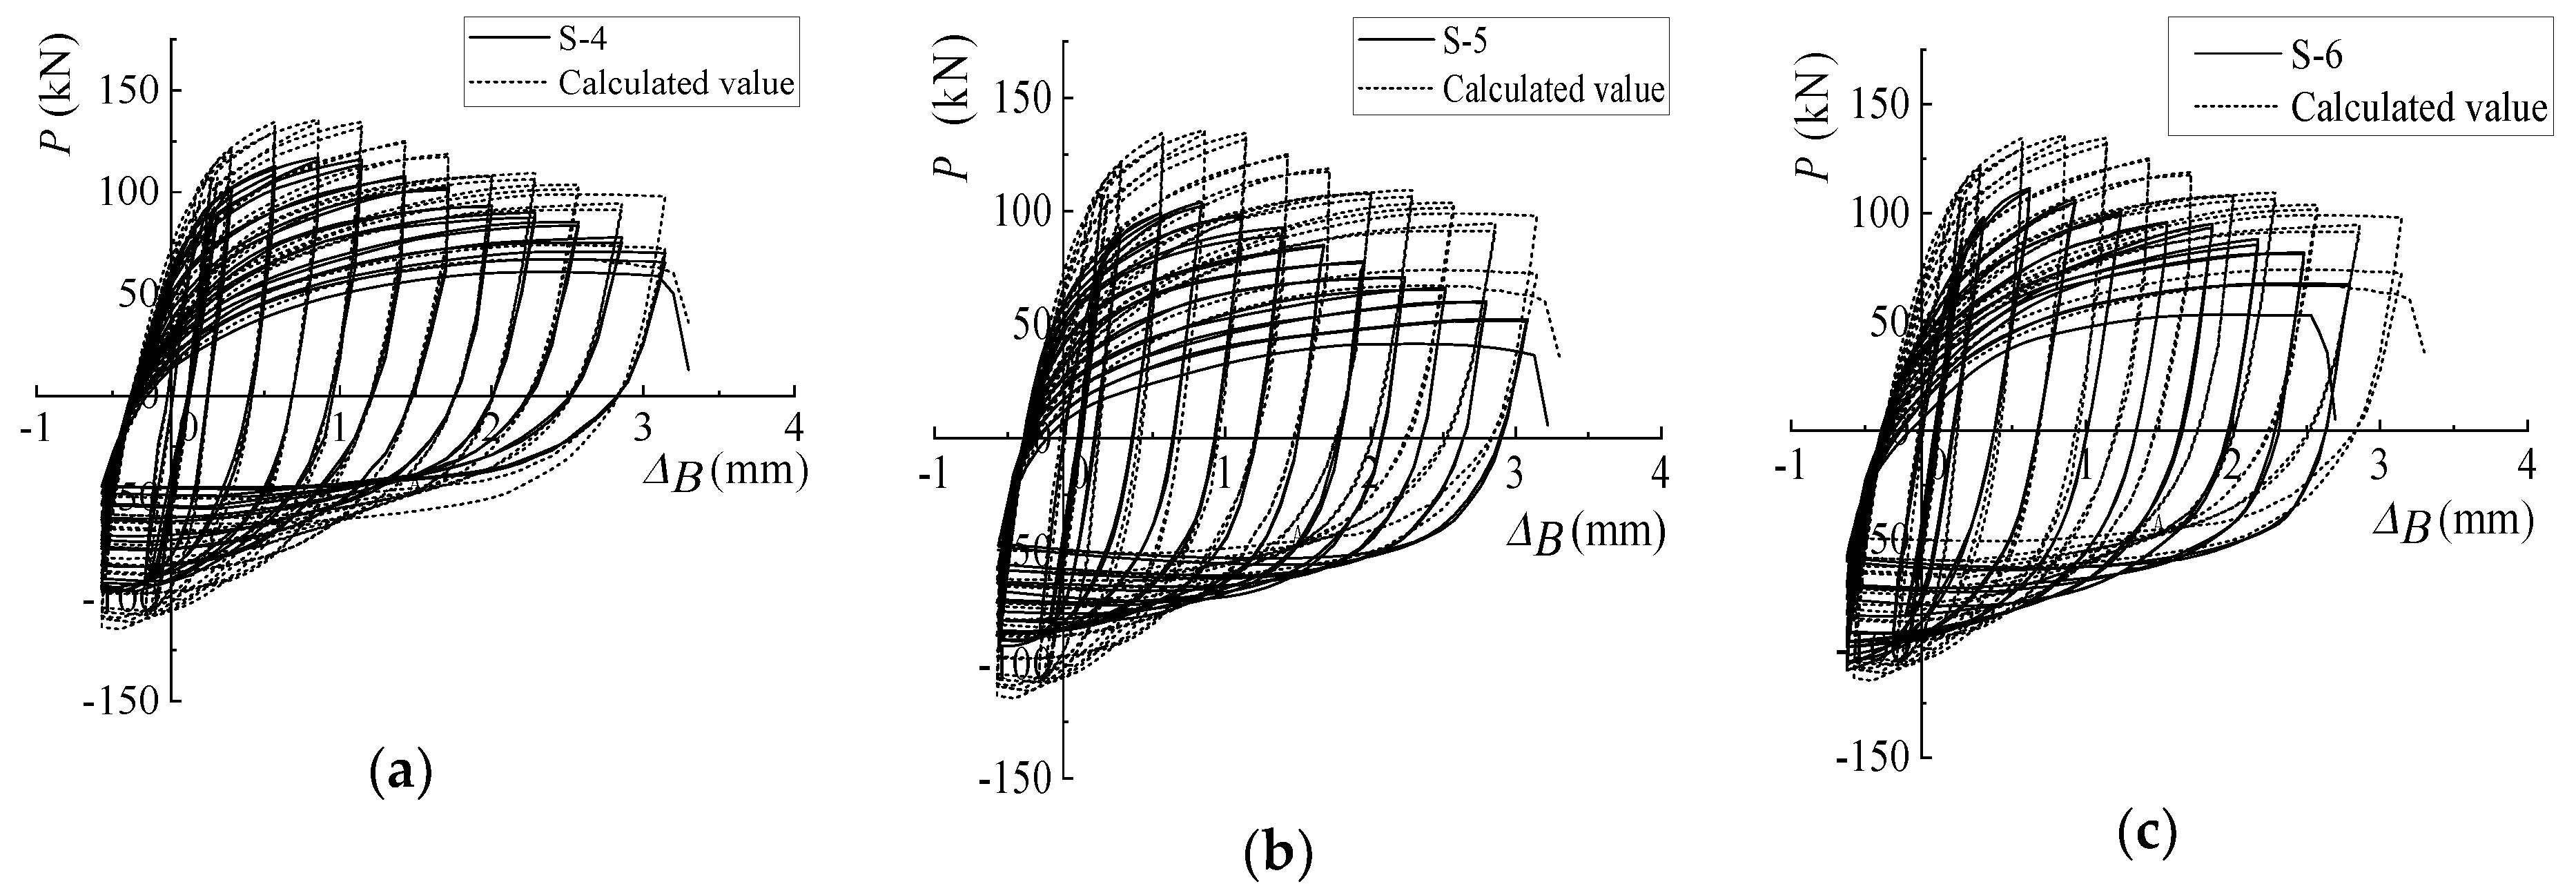
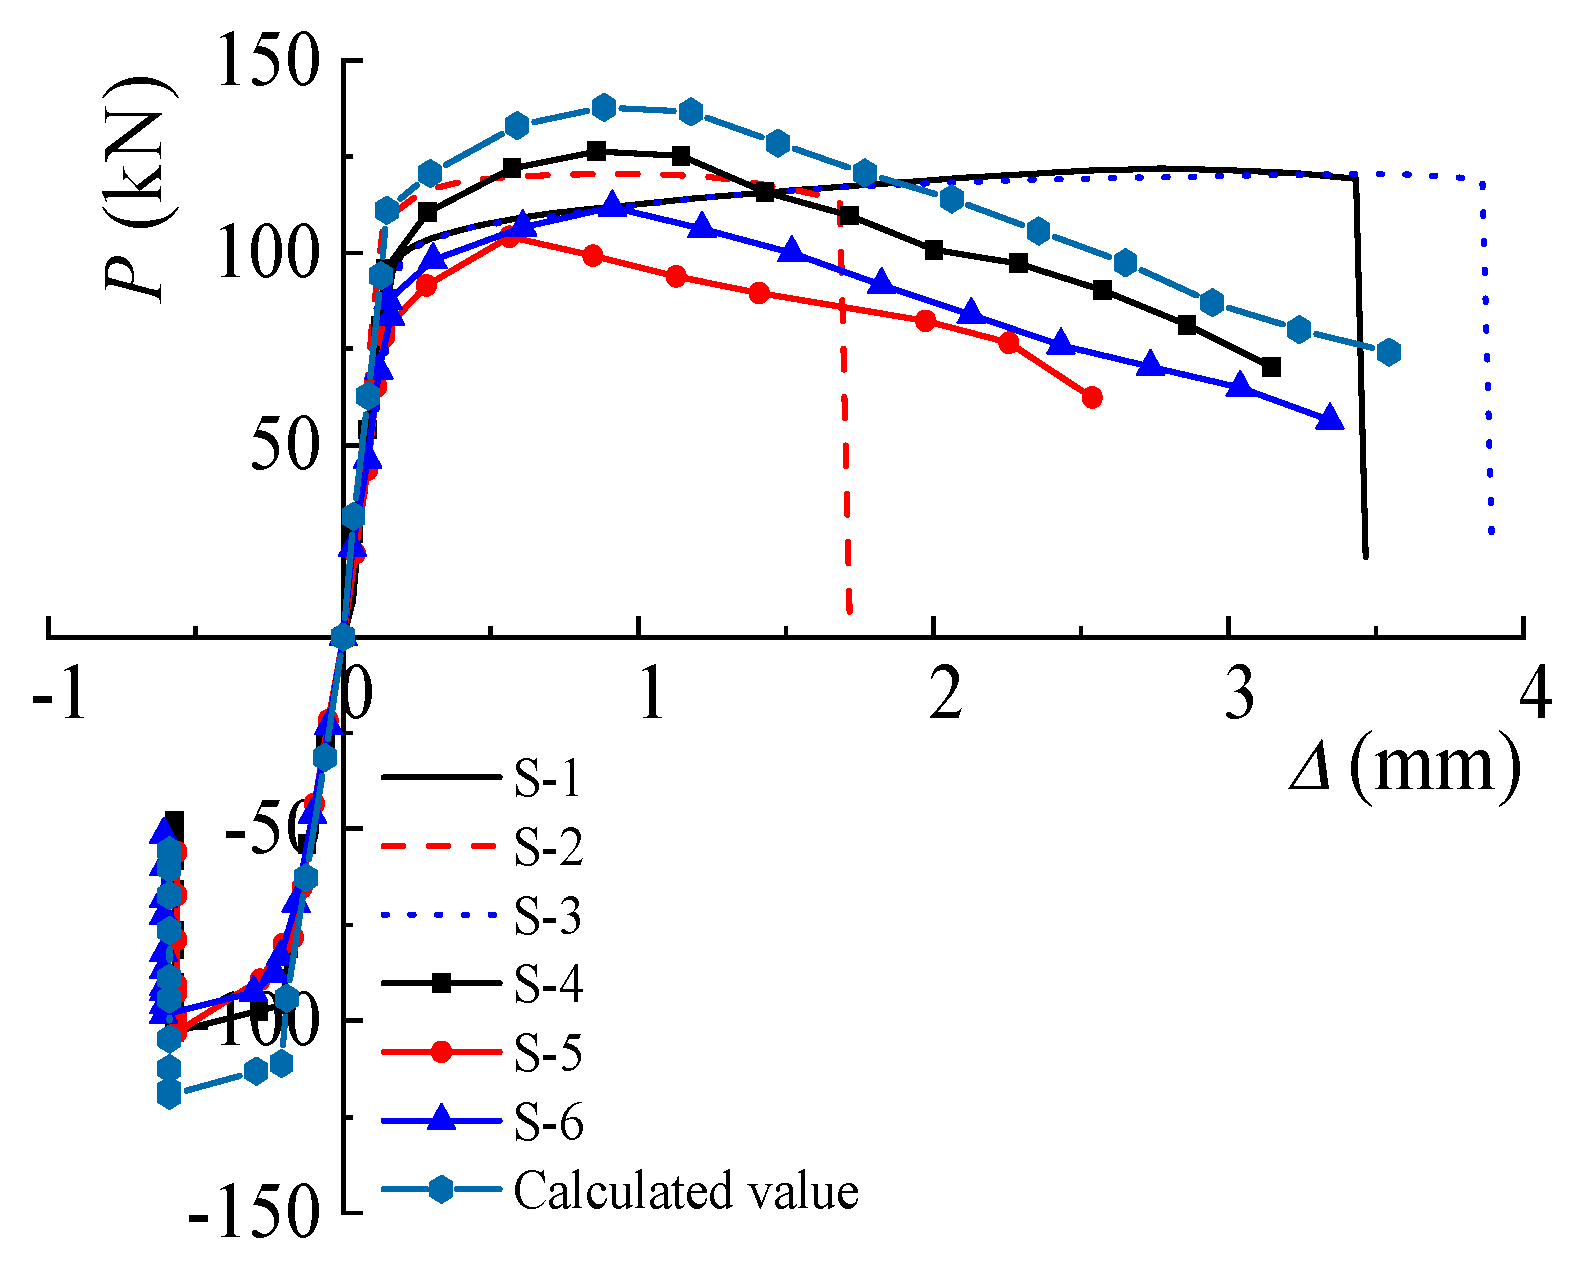
Figure 17 shows the comparison between the calculated hysteretic curve and the measured hysteretic curve. The calculated results are in basic agreement with the test results, but the non-proportional damage evolution should be taken into account in future studies. The skeleton curve is shown in Figure 18. By comparing these two curves, it can be seen that the theoretical results are basically consistent with the experimental failure pattern. The maximum error of the hysteresis curve is 5%, while the maximum error of the skeleton curve is 8%, which proves the reliability of the finite element model analysis.
5. Conclusions
In this paper, an experimental study of three full-scale monotonic tensile-resisting plate-welded joints [32] and three full-scale cyclic tensile- and compression-resisting plate-welded joints is presented. In each of the two groups of test specimens, three specimens were used with the same shape and dimensions [33]. The material performances of the weld to be investigated in the first group were the yield strength, tensile strength, axial displacement, load–displacement relation, stress–strain relation, ultimate bearing capacity, deformation, and strain distribution. For the second group and finite element analysis, the hysteretic behavior, the damage degradation process, and the damage model of the weld were discussed. From the experimental results and numerical analysis, the following observations can be drawn:
- The welds of the plate-welded joints are damaged, and the average values of the yield strength, maximum strength, and modulus of elasticity of electrode E5015 are close to the theoretical values of the materials, which indicate that the test error is small and that the data are convincing. The fracture created under monotonic drawing is smooth. Furthermore, a large amount of residue appears in the fractured section during the tension and compression cycles, and the overall limit displacement is high. The reason for these results is that the stress redistribution reduces the damage rate of the weld during the cycles of tension and compression.
- Compared with the test and numerical results of the second group of specimens, the maximum error of the hysteresis curve is 5%, and the maximum error of the skeleton curve is 8%, which could prove the reliability of the finite element model analysis. These results show that the mechanical parameters of the welds from the monotonic test could be used in the finite element model.
- According to the verification of the three damage models for the specimens under the action of tension and compression cycles, it can be concluded that the changing trend and corresponding value of the damage modulus of the energy damage model are closer to the test value, so the energy damage model obtained from these tests fits the damage curves better than that obtained from the cyclic tension and compression tests.
- The E5015 weld material performance parameters obtained in this paper and the weld damage law under the action of tension and compression cycles can provide a reference for further research on the mechanical properties of the welded part of steel frame joints.
Author Contributions
Conceptualization, H.M. and H.Z.; methodology, H.M and E.M.L.; software, H.Z.; validation, W.Z. and Z.T.; formal analysis, H.M.; investigation, W.Z. and E.M.L.; resources, H.M.; data curation, Z.T.; writing—original draft preparation, H.Z. and E.M.L.; writing—review and editing, W.Z. and E.M.L.; visualization, Z.T.; supervision, W.Z.; project administration, W.Z.; funding acquisition, H.M. and Z.T. All authors have read and agreed to the published version of the manuscript.
Funding
This research was funded by the National Science Foundation of China (No. 51708485, 51878590), the Natural Science Foundation of Jiangsu Province (No. BK20191441), the Jiangsu Planned Projects for Postdoctoral Research Funds (No. 1701191B), the China Postdoctoral Science Foundation (No. 2017M611925), the Science and Technology projects of the Ministry of Housing and Urban-Rural Development (2014-K2-045 and 2014-K2-022), the Talent Plan of Innovate and Entrepreneurship in Jiangsu Province, and the Talent Plan of Yangzhou City.
Conflicts of Interest
The authors declare no conflict of interest.
References
- Saher, E.K.; Sakr, M.A.; Khalifa, T.M.; Eladly, M.M. Modelling and behavior of beam-to-column connections under axial force and cyclic bending. J. Constr. Steel Res. 2017, 129, 171–184. [Google Scholar]
- Ma, H.W.; Wang, J.W.; Eric, M.L.; Wan, Z.Q.; Wang, K. Experimental study of the behavior of beam-column connections with expanded beam flanges. Steel Compos. Struct. 2019, 31, 319–327. [Google Scholar]
- Bae, D. Experimental study on fatigue strength of in-plane welded gusset joints. KSCE J. Civ. Eng. 2004, 8, 89–93. [Google Scholar] [CrossRef]
- Cho, J.R.; Lee, B.Y.; Moon, Y.H.; Van Tyne, C.J. Investigation of residual stress and post weld heat treatment of multi-pass welds by finite element method and experiments. J. Mater. Process. Technol. 2004, 155, 1690–1695. [Google Scholar] [CrossRef]
- Radhi, H.E.; Barrans, S. Finite Element Analysis of Effect of Weld Toe Radius and Plate Thickness on Fatigue Life of Butt Welded Joint; University of Huddersfield: Huddersfield, UK, 2010. [Google Scholar]
- Chen, Y.X.; Peng, M.L.; Da, T.L. Study of Fatigue strength of structural details of U-Rib and diaphragm welding joints. Bridge Constr. 2014, 44, 63–68. [Google Scholar]
- Wang, W.L.; He, J.; Zhang, M.M. Fatigue damage analysis of monolithic joint of steel truss bridge considering welding residual stress. Appl. Mech. Mater. 2011, 71–78, 3123–3126. [Google Scholar] [CrossRef]
- Coelho, A.M.G.; Bijlaard, F.S.K.; Gresnigt, N.; da Silva, L.S. Experimental assessment of the behavior of bolted T-stub connections made up of welded plates. J. Constr. Steel Res. 2004, 60, 269–311. [Google Scholar] [CrossRef]
- Konda, N.; Arimochi, K.; Nishio, M.; Kiyokawa, S. Development of Fatigue Test Method and improvement of fatigue life by new functional steel plates for welding of trough rib and deck plate of orthotropic decks. Int. J. Steel Struct. 2013, 13, 191–197. [Google Scholar] [CrossRef]
- Takahashi, I.; Takada, A.; Ushijima, M.; Akiyama, S. Fatigue behavior of a box-welded joint under biaxial cyclic loading: Effects of biaxial load range ratio and cyclic compressive loads in the lateral direction. Fatigue Fract. Eng. Mater. Struct. 2002, 22, 869–877. [Google Scholar] [CrossRef]
- Shvets, V.P.; Degtyarev, V.A.; Muzyka, N.R.; Maslo, A.N. Assessment of the damageability of low-carbon steel welded joint zones under cyclic loading conditions. Strength Mater. 2013, 45, 199–204. [Google Scholar] [CrossRef]
- Guo, H.; Wan, J.; Liu, Y.; Hao, J.P. Experimental study on fatigue performance of high strength steel welded joints. Thin-Walled Struct. 2018, 131, 45–54. [Google Scholar] [CrossRef]
- Kim, I.T.; Kainuma, S. Fatigue life assessment of load-carrying fillet-welded cruciform joints inclined to uniaxial cyclic loading. Int. J. Press. Vessel. Pip. 2005, 82, 807–813. [Google Scholar] [CrossRef]
- Zhang, Q.H.; Luo, P.J.; Xu, G.Y.; Bo, Y.Z. Experiment on fatigue performance of rib-to-deck welded joint with new rolled rib. China J. Highw. Transp. 2018, 31, 42–52. [Google Scholar]
- Lie, S.T.; Lee, C.K.; Wong, S.M. Modelling and mesh generation of weld profile in tubular Y-joint. J. Constr. Steel Res. 2001, 57, 547–567. [Google Scholar] [CrossRef]
- Yang, S.L.; Bu, Y.Z.; Cui, C.; Zhang, Q.H. Analysis of stress intensity factors of 3-Dimensional fatigue crack in butt weld joint of U Rib. Bridge Constr. 2015, 45, 54–59. [Google Scholar]
- Lan, K.; Ge, H.; Kato, T. Experimental and ductile fracture model study of single-groove welded joints under monotonic loading. Eng. Struct. 2015, 85, 36–51. [Google Scholar]
- Ravi, K.; Khandelwal, K.A. Micromechanical cyclic void growth model for ultra-low cycle fatigue. Int. J. Fatigue 2015, 70, 24–37. [Google Scholar]
- Tsutsumi, S.; Fincato, R.; Momii, H. Effect of tangential plasticity on structural response under non-proportional cyclic loading. Acta Mech. 2019, 230, 2425–2446. [Google Scholar] [CrossRef]
- Ucak, A.; Tsopelas, P. Accurate modeling of the cyclic response of structural components constructed of steel with yield plateau. Eng. Struct. 2012, 35, 272–280. [Google Scholar] [CrossRef]
- GB50017. In Standard for Design of Steel Structures; China Planning Press: Beijing, China, 2017.
- CEN. ENV1993-1-8. Part 1.8: Design of joints. In Eurocode 3. Design of Steel Structures; European Committee for Standardizations: Oxford, UK, 2015. [Google Scholar]
- Lowes, L.N.; Altoontash, A. Modeling reinforced-concrete beam-column joints subjected to cyclic loading. J. Struct. Eng. 2003, 12, 1686–1697. [Google Scholar] [CrossRef]
- Kumar, R.; Gardoni, P.; Sanchez, S.M. Effect of cumulative seismic damage and corrosion on the life-cycle cost of reinforced concrete bridges. Earthq. Eng. Struct. Dyn. 2010, 38, 887–905. [Google Scholar] [CrossRef] [Green Version]
- Zhao, J.; Dun, H. A restoring force model for steel fiber reinforced concrete shear walls. Eng. Struct. 2014, 75, 469–476. [Google Scholar] [CrossRef]
- Abu Al-Rub, R.; Darabi, M.K.; Kim, S.-M.; Little, D.N.; Glover, C.J. Mechanistic-based constitutive modeling of oxidative aging in aging-susceptible materials and its effect on the damage potential of asphalt concrete. Constr. Build. Mater. 2013, 41, 439–454. [Google Scholar] [CrossRef]
- Chen, L.; Guan, P.; Wang, H. Analysis for the ductility and bearing capacity of axially loaded short steel tubular columns filled with steel-reinforced concrete. J. Liaoning Tech. Univ. 2015, 34, 623–627. [Google Scholar]
- Papasidero, J.; Doquet, V.; Mohr, D. Ductile fracture of aluminum 2024-T351 under proportional and non-proportional multi-axial loading: Bao–Wierzbicki results revisited. Int. J. Solids Struct. 2015, 69–70, 459–474. [Google Scholar] [CrossRef]
- Cortese, L.; Nalli, F.; Rossi, M. A nonlinear model for ductile damage accumulation under multiaxial non-proportional loading conditions. Int. J. Plast. 2015, 85, 77–92. [Google Scholar] [CrossRef]
- Isono, Y.; Kito, H.; Kikuchi, T.; Katayama, M. New fatigue damage evaluation of MEMS materials under tension-compression cyclic loading. In Proceedings of the IEEE International Conference on Micro Electro Mechanical Systems (MEMS), Miami Beach, FL, USA, 30 January–3 February 2005. [Google Scholar]
- Satow, T.; Nakagawa, T. Three replacement models with two kinds of damage. Microelectron. Reliab. 1997, 37, 909–913. [Google Scholar] [CrossRef]
- Tsutsumi, S.; Kitamura, T.R. Ductile behaviour of carbon steel for welded structures: Experiments and numerical simulations. J. Constr. Steel Res. 2020, 172, 106185. [Google Scholar] [CrossRef]
- Van Do, V.N.; Lee, C.H.; Chang, K.H. A nonlinear CDM model for ductile failure analysis of steel bridge columns under cyclic loading. Comput. Mech. 2014, 53, 1209–1222. [Google Scholar]
Figure 1.
Welded plate joint specimens: (a) monotonic loading test set; (b) cyclic loading test set.
Figure 1.
Welded plate joint specimens: (a) monotonic loading test set; (b) cyclic loading test set.

Figure 2.
Configuration and dimensions of welded plate joint (mm): (a) top view; (b) side profile.

Figure 3.
Test setup: (a) overview; (b) specimen on the test machine.

Figure 4.
Loading method.

Figure 5.
Layout of measuring points (mm).

Figure 6.
Weld damage of plate joints under monotonic loading: (a) S-1; (b) S-2; (c) S-3.

Figure 7.
Failure mode of plate joints under monotonic loading: (a) S-4; (b) S-5; (c) S-6.

Figure 8.
Load–displacement curve of monotonic tensile test.

Figure 9.
Stress–strain curves of monotonic tensile tests.

Figure 10.
Load–displacement curves: (a) S-4; (b) S-5; (c) S-6.

Figure 11.
Skeleton curves.

Figure 12.
Skeleton curve with cumulative plastic displacement.

Figure 13.
Damage modulus curve.

Figure 14.
Damage model and test curve comparisons: (a) S-4; (b) S-5; (c) S-6.

Figure 15.
Finite element analysis model: (a) welded plate joint model; (b) loading and boundary conditions; (c) grid diagram.
Figure 15.
Finite element analysis model: (a) welded plate joint model; (b) loading and boundary conditions; (c) grid diagram.

Figure 16.
Results of finite element analysis and experimental testing: (a) experimental results; (b) finite element analysis.
Figure 16.
Results of finite element analysis and experimental testing: (a) experimental results; (b) finite element analysis.

Figure 17.
Hysteresis curve comparison: (a) S-4; (b) S-5; (c) S-6.

Figure 18.
Skeleton curves.


Table 1.
Mechanical performance of the welded plate joints.
| Specimen | Loading Condition | Yield Strength σy (MPa) | Tensile Strength σu (MPa) | Axial Displacement of Welding Δl (mm) | Cross-Sectional Area (mm2) |
|---|---|---|---|---|---|
| S-1 | Monotonic tensile | 383 | 610 | 0.0274 | 342.95 |
| S-2 | Monotonic tensile | 375 | 601 | 0.0276 | 348.57 |
| S-3 | Monotonic tensile | 390 | 589 | 0.0278 | 340.16 |
| S-4 | Tension and compression cycle | 335 | 438 | 0.0282 | 342.65 |
| S-5 | Tension and compression cycle | 340 | 445 | 0.0281 | 347.47 |
| S-6 | Tension and compression cycle | 445 | 454 | 0.0280 | 346.73 |
Table 2.
Results of monotonic tensile specimens of welded plate joints.
| Specimen | S-1 | S-2 | S-3 | Average Value |
|---|---|---|---|---|
| Yield displacement ΔyA/mm | 0.165 | 0.14 | 0.178 | 0.161 |
| Yield load PyA/kN | 102.44 | 115.83 | 96.58 | 104.95 |
| Ultimate displacement ΔuA/mm | 3.432 | 1.683 | 3.861 | 2.992 |
| Ultimate load PuA/kN | 131.74 | 130.24 | 125.35 | 129.11 |
| Yield strength σyA/MPa | 382.52 | 375.34 | 389.51 | 382.46 |
| Maximum strength σuA/MPa | 609.64 | 601.44 | 588.53 | 599.87 |
| Dissipative energy EA/J | 0.165 | 0.14 | 0.178 | 0.161 |
Table 3.
Testing results for the jointed plates.
| Specimen | S-4 | S-5 | S-6 | Average Value |
|---|---|---|---|---|
| Total cycle | 30 | 26 | 32 | / |
| Plastic cycle | 22 | 16 | 22 | / |
| Yield displacement ΔyB/mm | 0.143 | 0.141 | 0.152 | 0.145 |
| Yield load PyB/kN | 88.6 | 91.98 | 94.63 | 91.74 |
| Limit displacement ΔuB/mm | 3.41 | 2.54 | 3.50 | 3.149 |
| Ultimate load PuB/kN | 115.82 | 120.26 | 120.81 | 118.96 |
| Ductility coefficient u | 23.85 | 18.00 | 23.03 | 21.63 |
| Yield strength fyB/MPa | 334.78 | 340.11 | 444.68 | 373.19 |
| Tensile strength fuB/MPa | 437.63 | 444.68 | 454.16 | 445.49 |
| Cumulative dissipated energy EB/J | 2278 | 1540 | 2302 | 2040.0 |
Table 4.
Comparison of damage models and experimental results.
| Specimen | 1 | 2 | 3 | 4 | 5 | 6 | 7 | 8 | 9 | 10 | 11 | ||
|---|---|---|---|---|---|---|---|---|---|---|---|---|---|
| S−4 | Test value | D | 0.044 | 0.046 | 0.058 | 0.075 | 0.125 | 0.160 | 0.226 | 0.259 | 0.333 | 0.400 | 0.502 |
| K | 0.15 | 0.00 | 0.01 | 0.01 | 0.02 | 0.01 | 0.02 | 0.01 | 0.02 | 0.01 | 0.02 | ||
| Energy damage model | D1 | 0.000 | 0.004 | 0.008 | 0.024 | 0.056 | 0.094 | 0.142 | 0.212 | 0.286 | 0.360 | 0.500 | |
| error | −0.044 | −0.042 | −0.050 | −0.051 | −0.069 | −0.066 | −0.084 | −0.047 | −0.046 | −0.040 | −0.002 | ||
| K2 | 0.00 | 0.00 | 0.00 | 0.01 | 0.01 | 0.01 | 0.01 | 0.02 | 0.02 | 0.01 | 0.02 | ||
| error | −0.150 | 0.000 | −0.010 | 0.000 | −0.010 | 0.000 | −0.010 | 0.010 | 0.000 | 0.000 | 0.000 | ||
| S−5 | Test value | D | 0.016 | 0.003 | 0.084 | 0.138 | 0.178 | 0.245 | 0.297 | 0.428 | / | / | / |
| K | 0.06 | −0.02 | 0.06 | 0.03 | 0.02 | 0.02 | 0.01 | 0.03 | / | / | / | ||
| Energy damage model | D1 | 0.000 | 0.011 | 0.035 | 0.073 | 0.136 | 0.231 | 0.323 | 0.430 | / | / | / | |
| error | −0.016 | 0.008 | −0.049 | −0.065 | −0.042 | −0.014 | 0.028 | 0.002 | / | / | / | ||
| K2 | 0.00 | 0.01 | 0.02 | 0.02 | 0.02 | 0.03 | 0.02 | 0.02 | / | / | / | ||
| error | −0.060 | 0.030 | −0.040 | −0.010 | 0.000 | 0.010 | 0.010 | −0.010 | / | / | / | ||
| S−6 | Test value | D | 0.000 | 0.024 | 0.027 | 0.084 | 0.138 | 0.211 | 0.277 | 0.346 | 0.394 | 0.441 | 0.514 |
| K | 0.00 | 0.03 | 0.00 | 0.03 | 0.02 | 0.02 | 0.02 | 0.02 | 0.01 | 0.01 | 0.01 | ||
| Energy damage model | D1 | 0.000 | 0.003 | 0.011 | 0.033 | 0.070 | 0.131 | 0.210 | 0.274 | 0.345 | 0.421 | 0.514 | |
| error | 0.000 | −0.021 | −0.016 | −0.051 | −0.068 | −0.080 | −0.067 | −0.072 | −0.049 | −0.020 | 0.000 | ||
| K2 | 0.00 | 0.00 | 0.01 | 0.01 | 0.01 | 0.02 | 0.02 | 0.01 | 0.02 | 0.01 | 0.01 | ||
| error | 0.000 | −0.030 | 0.010 | −0.020 | −0.010 | −0.000 | 0.000 | −0.010 | 0.010 | 0.000 | 0.000 | ||
© 2020 by the authors. Licensee MDPI, Basel, Switzerland. This article is an open access article distributed under the terms and conditions of the Creative Commons Attribution (CC BY) license (http://creativecommons.org/licenses/by/4.0/).
Share and Cite
MDPI and ACS Style
Ma, H.; Zheng, H.; Zhang, W.; Tang, Z.; Lui, E.M. Experimental and Numerical Study of Mechanical Behavior of Welded Steel Plate Joints. Metals 2020, 10, 1293. https://doi.org/10.3390/met10101293
AMA Style
Ma H, Zheng H, Zhang W, Tang Z, Lui EM. Experimental and Numerical Study of Mechanical Behavior of Welded Steel Plate Joints. Metals. 2020; 10(10):1293. https://doi.org/10.3390/met10101293
Chicago/Turabian StyleMa, Hongwei, Hao Zheng, Wei Zhang, Zhanzhan Tang, and Eric M. Lui. 2020. "Experimental and Numerical Study of Mechanical Behavior of Welded Steel Plate Joints" Metals 10, no. 10: 1293. https://doi.org/10.3390/met10101293
Note that from the first issue of 2016, this journal uses article numbers instead of page numbers. See further details here.