Transformation Pathway upon Heating of Metastable β Titanium Alloy Ti-15Mo Investigated by Neutron Diffraction

 , ,
, ,  , , , , and
Abstract
:1. Introduction
2. Materials and Methods
2.1. Materials
2.2. Neutron Diffraction
2.3. Dilatometry
3. Results
4. Discussion
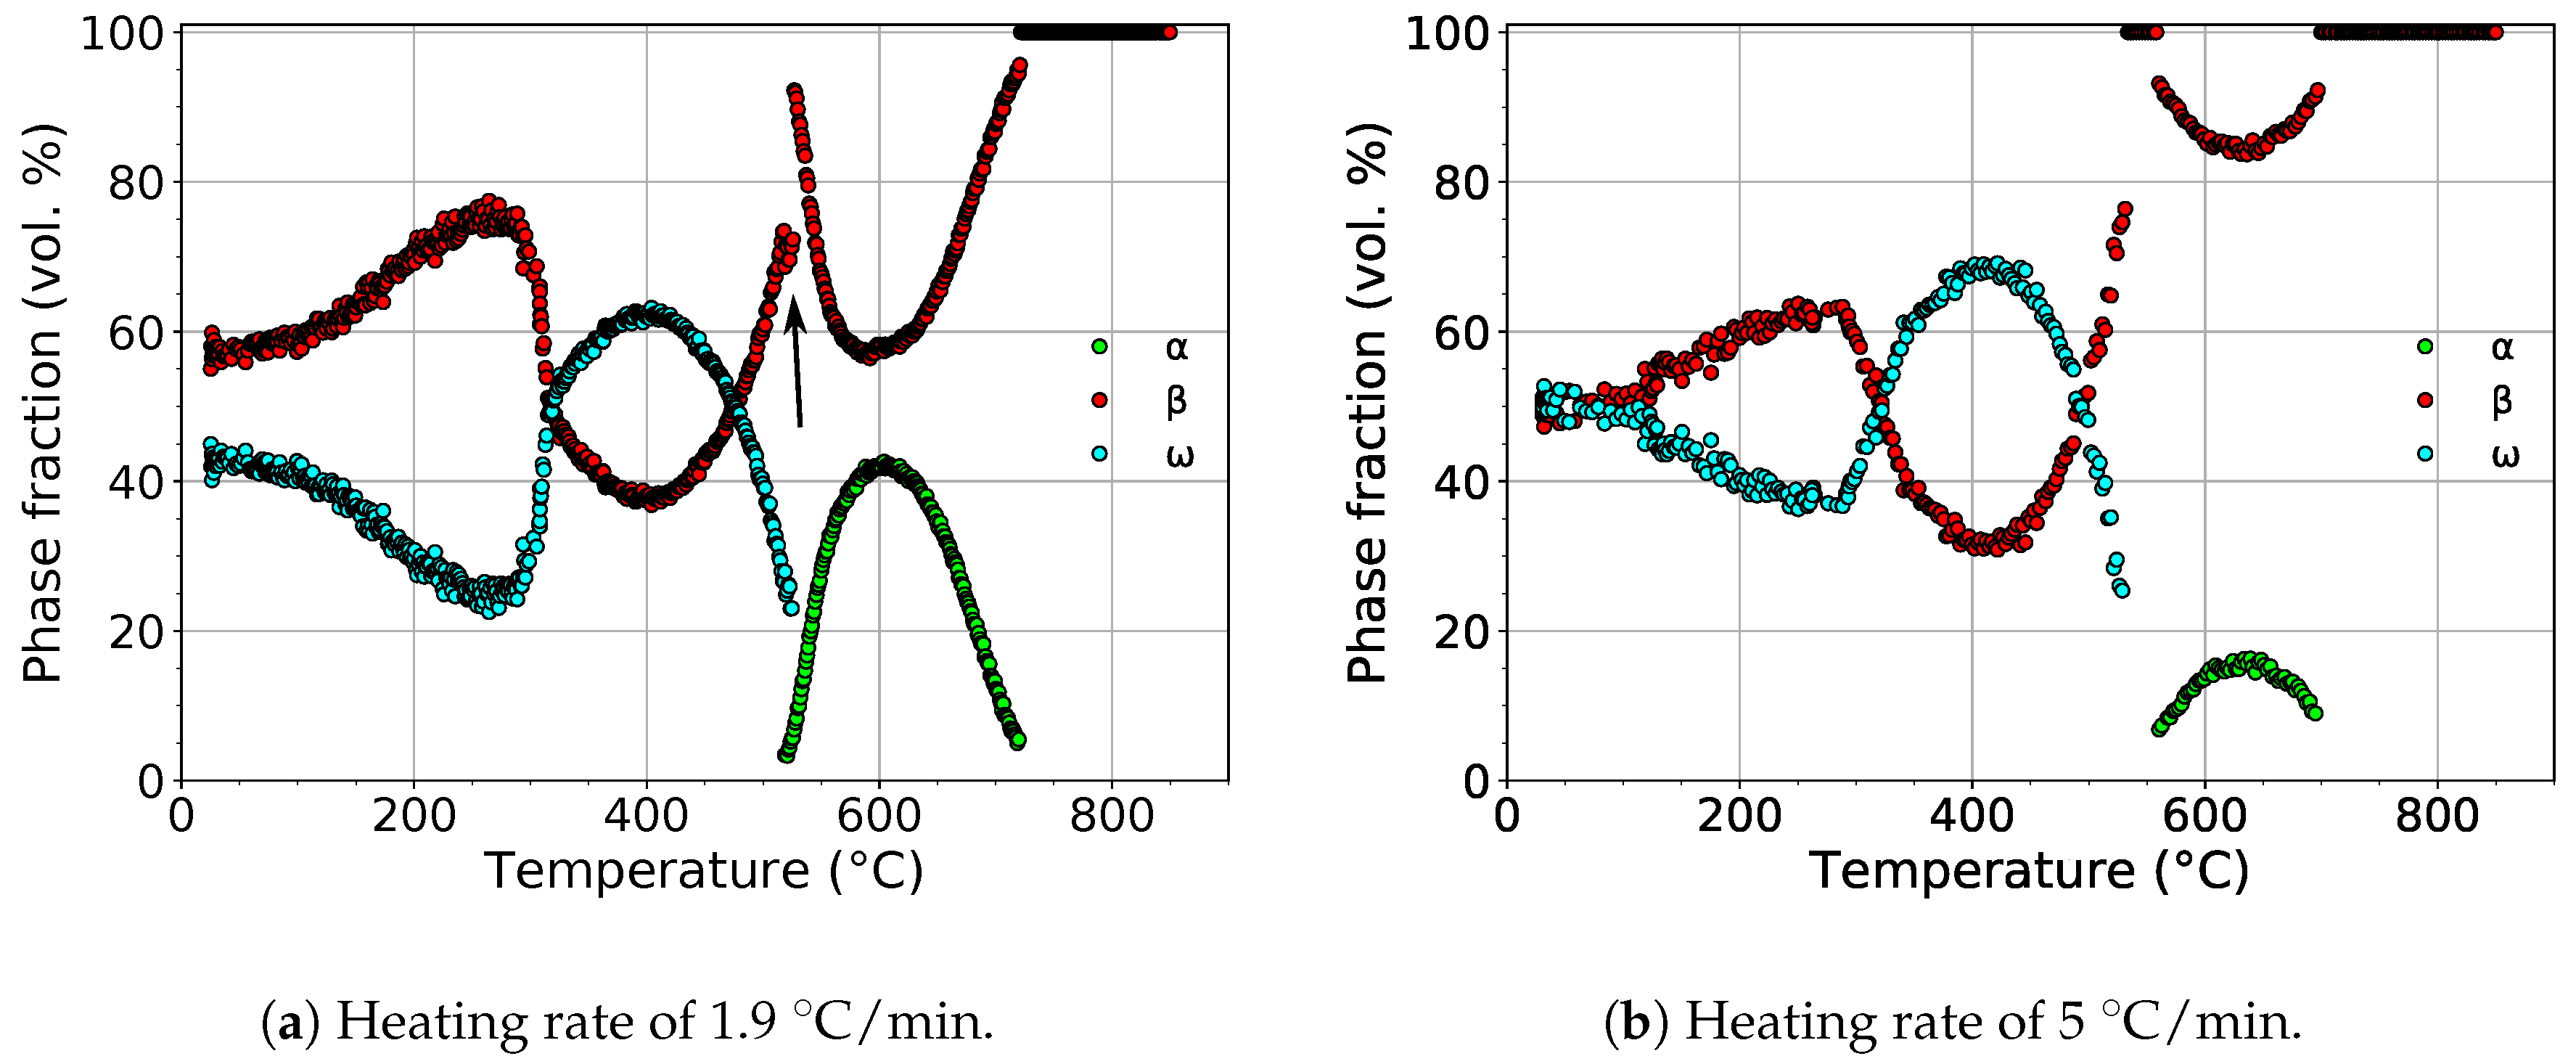
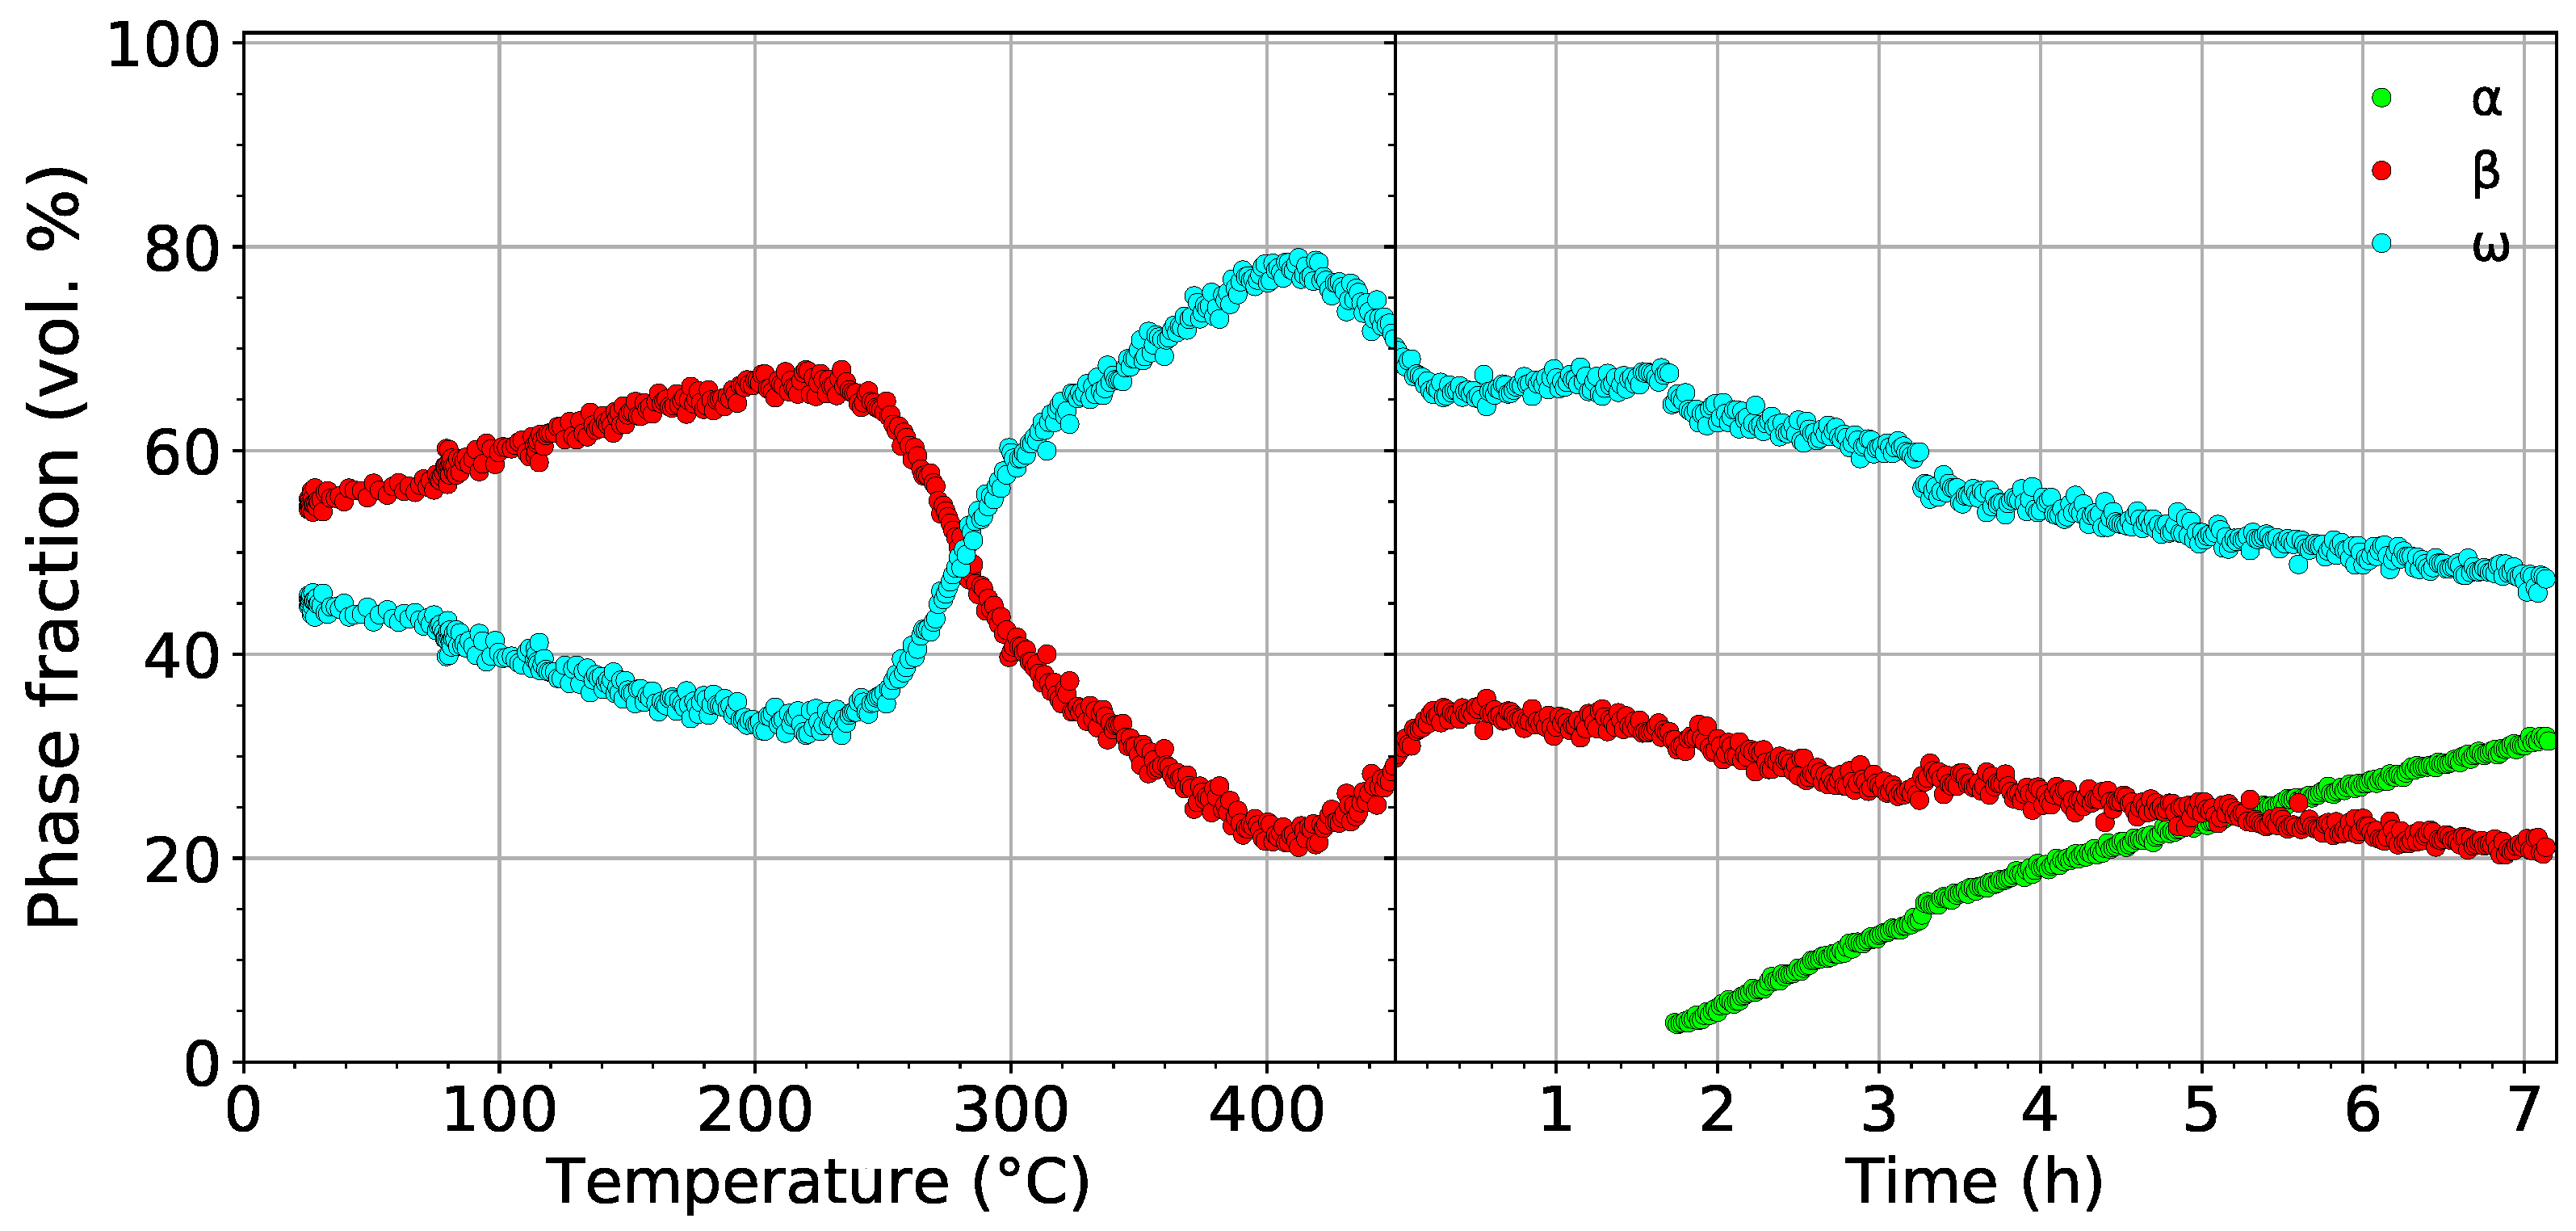
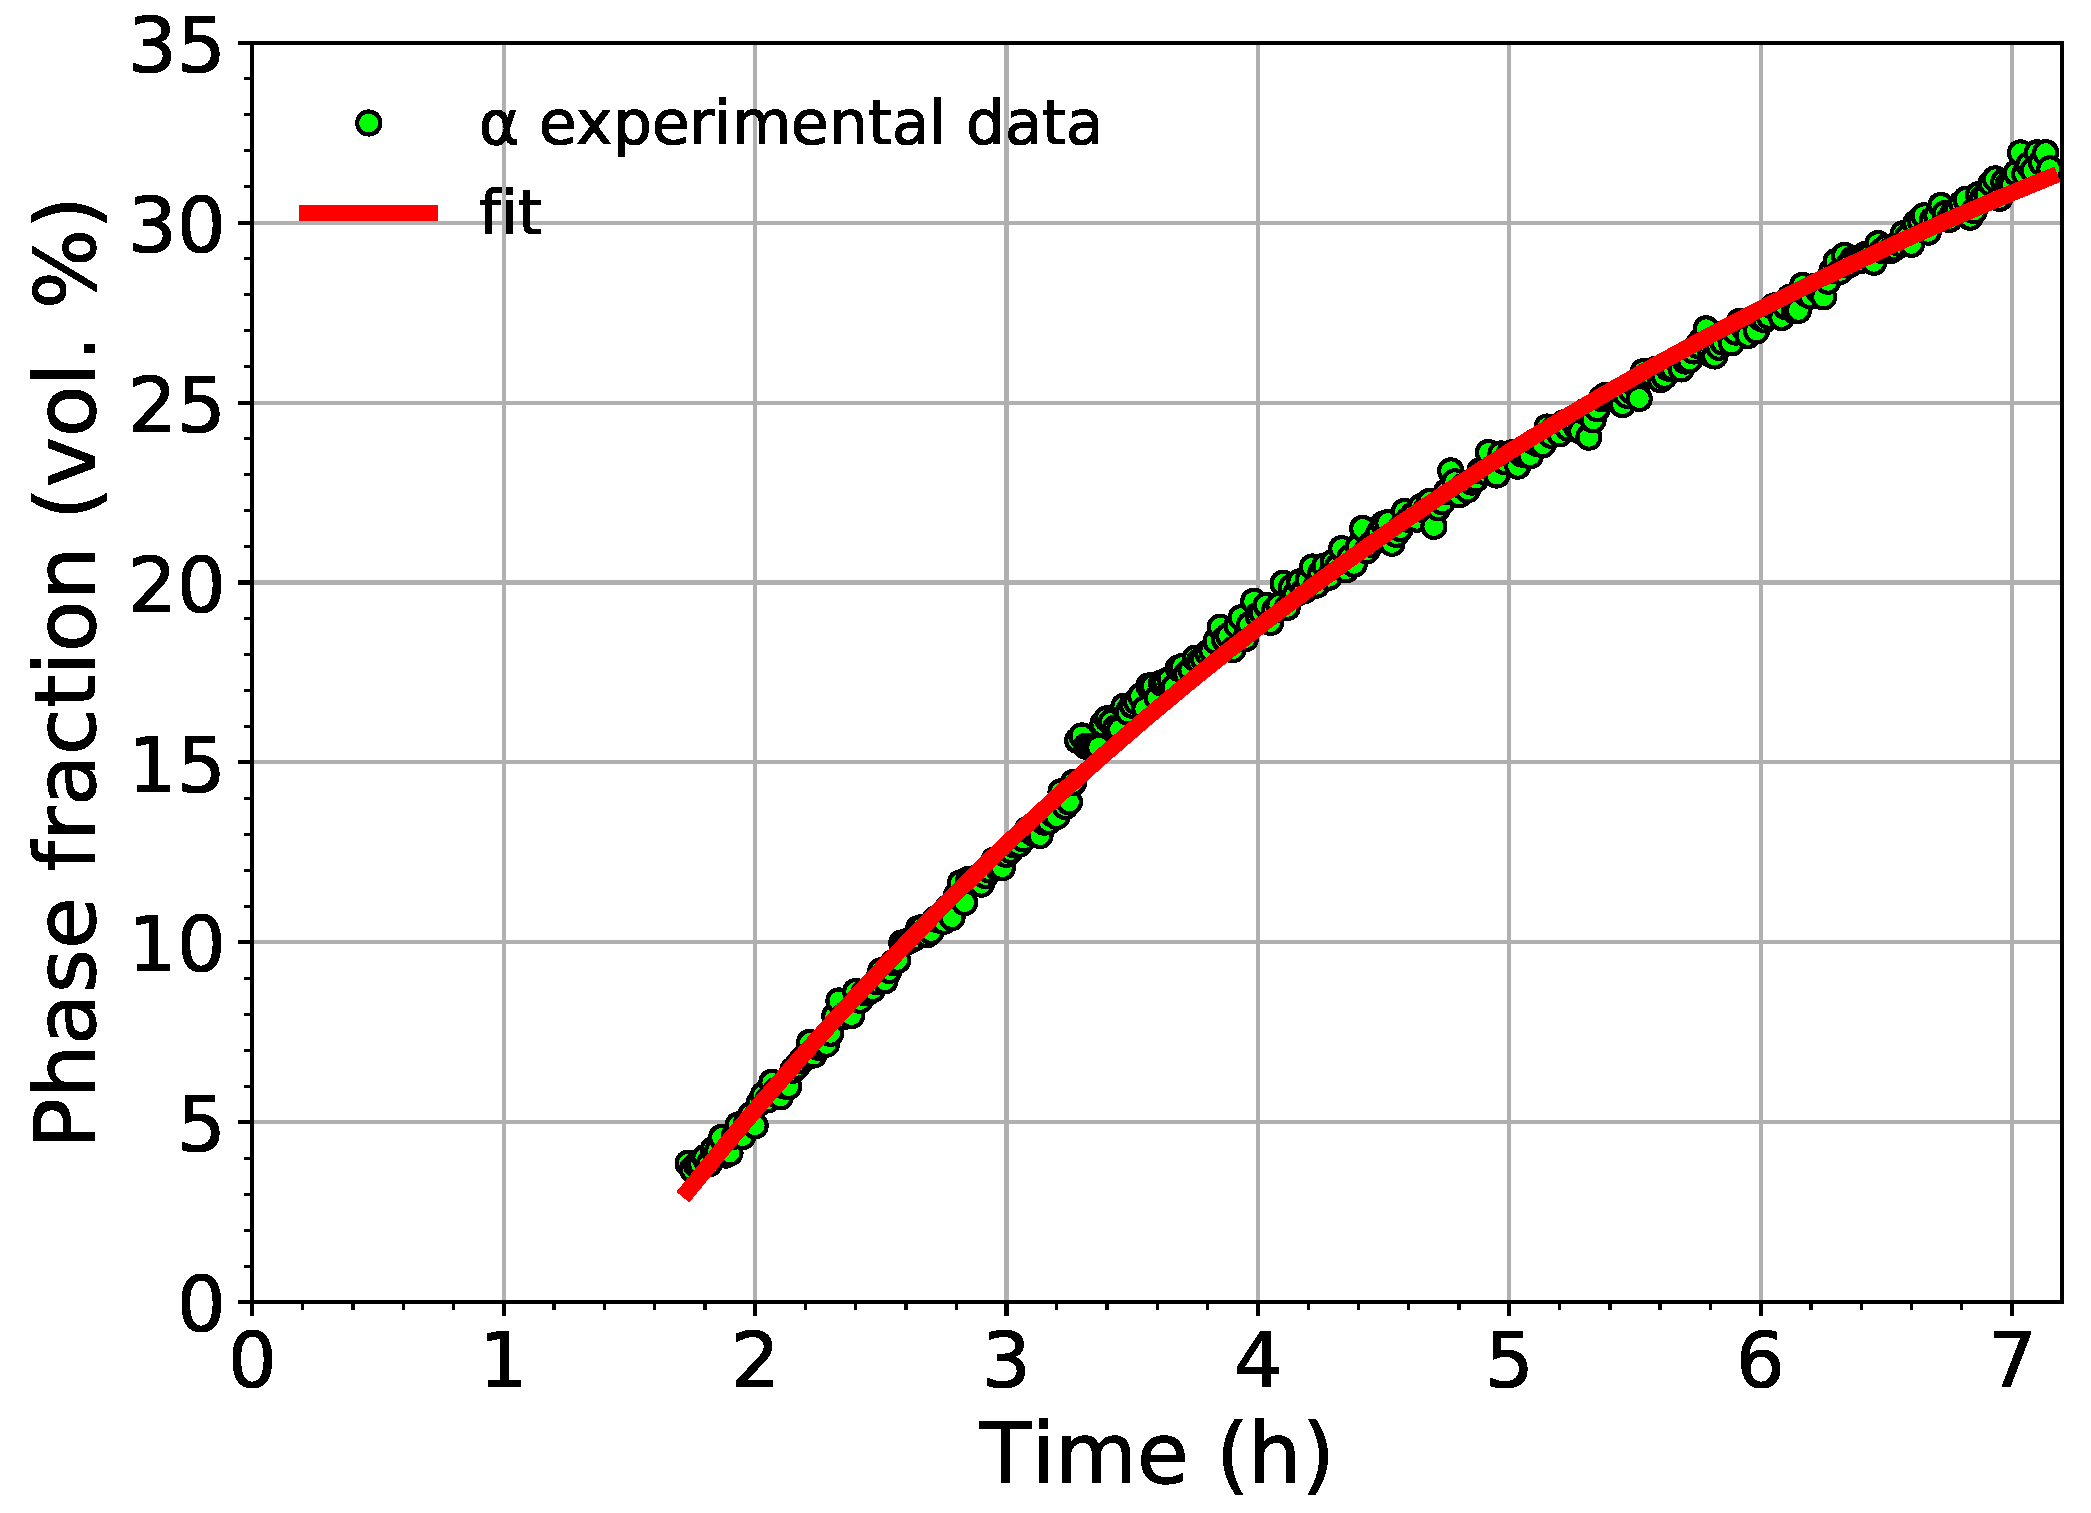
4.1. Volume Fraction Evolution
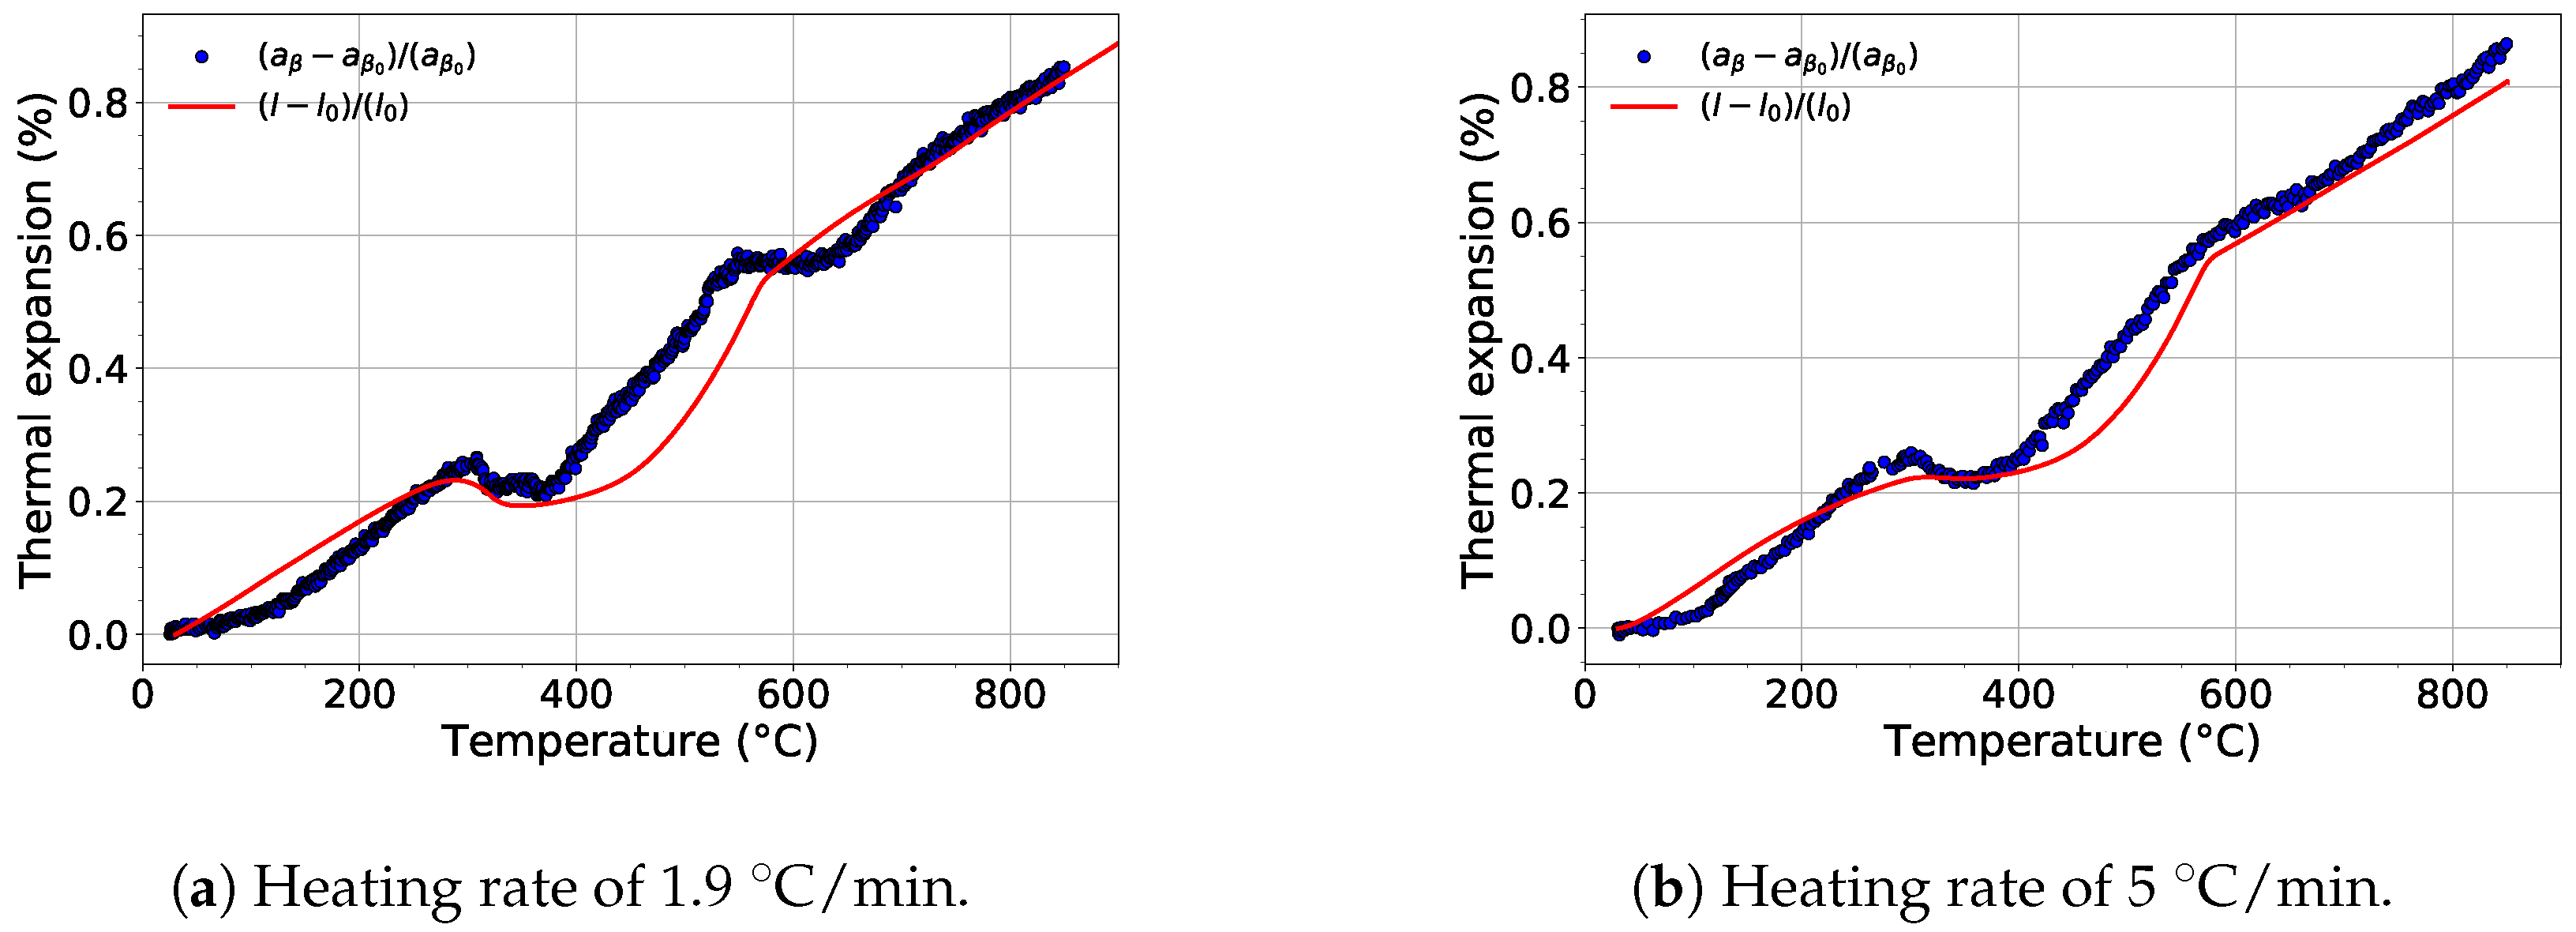
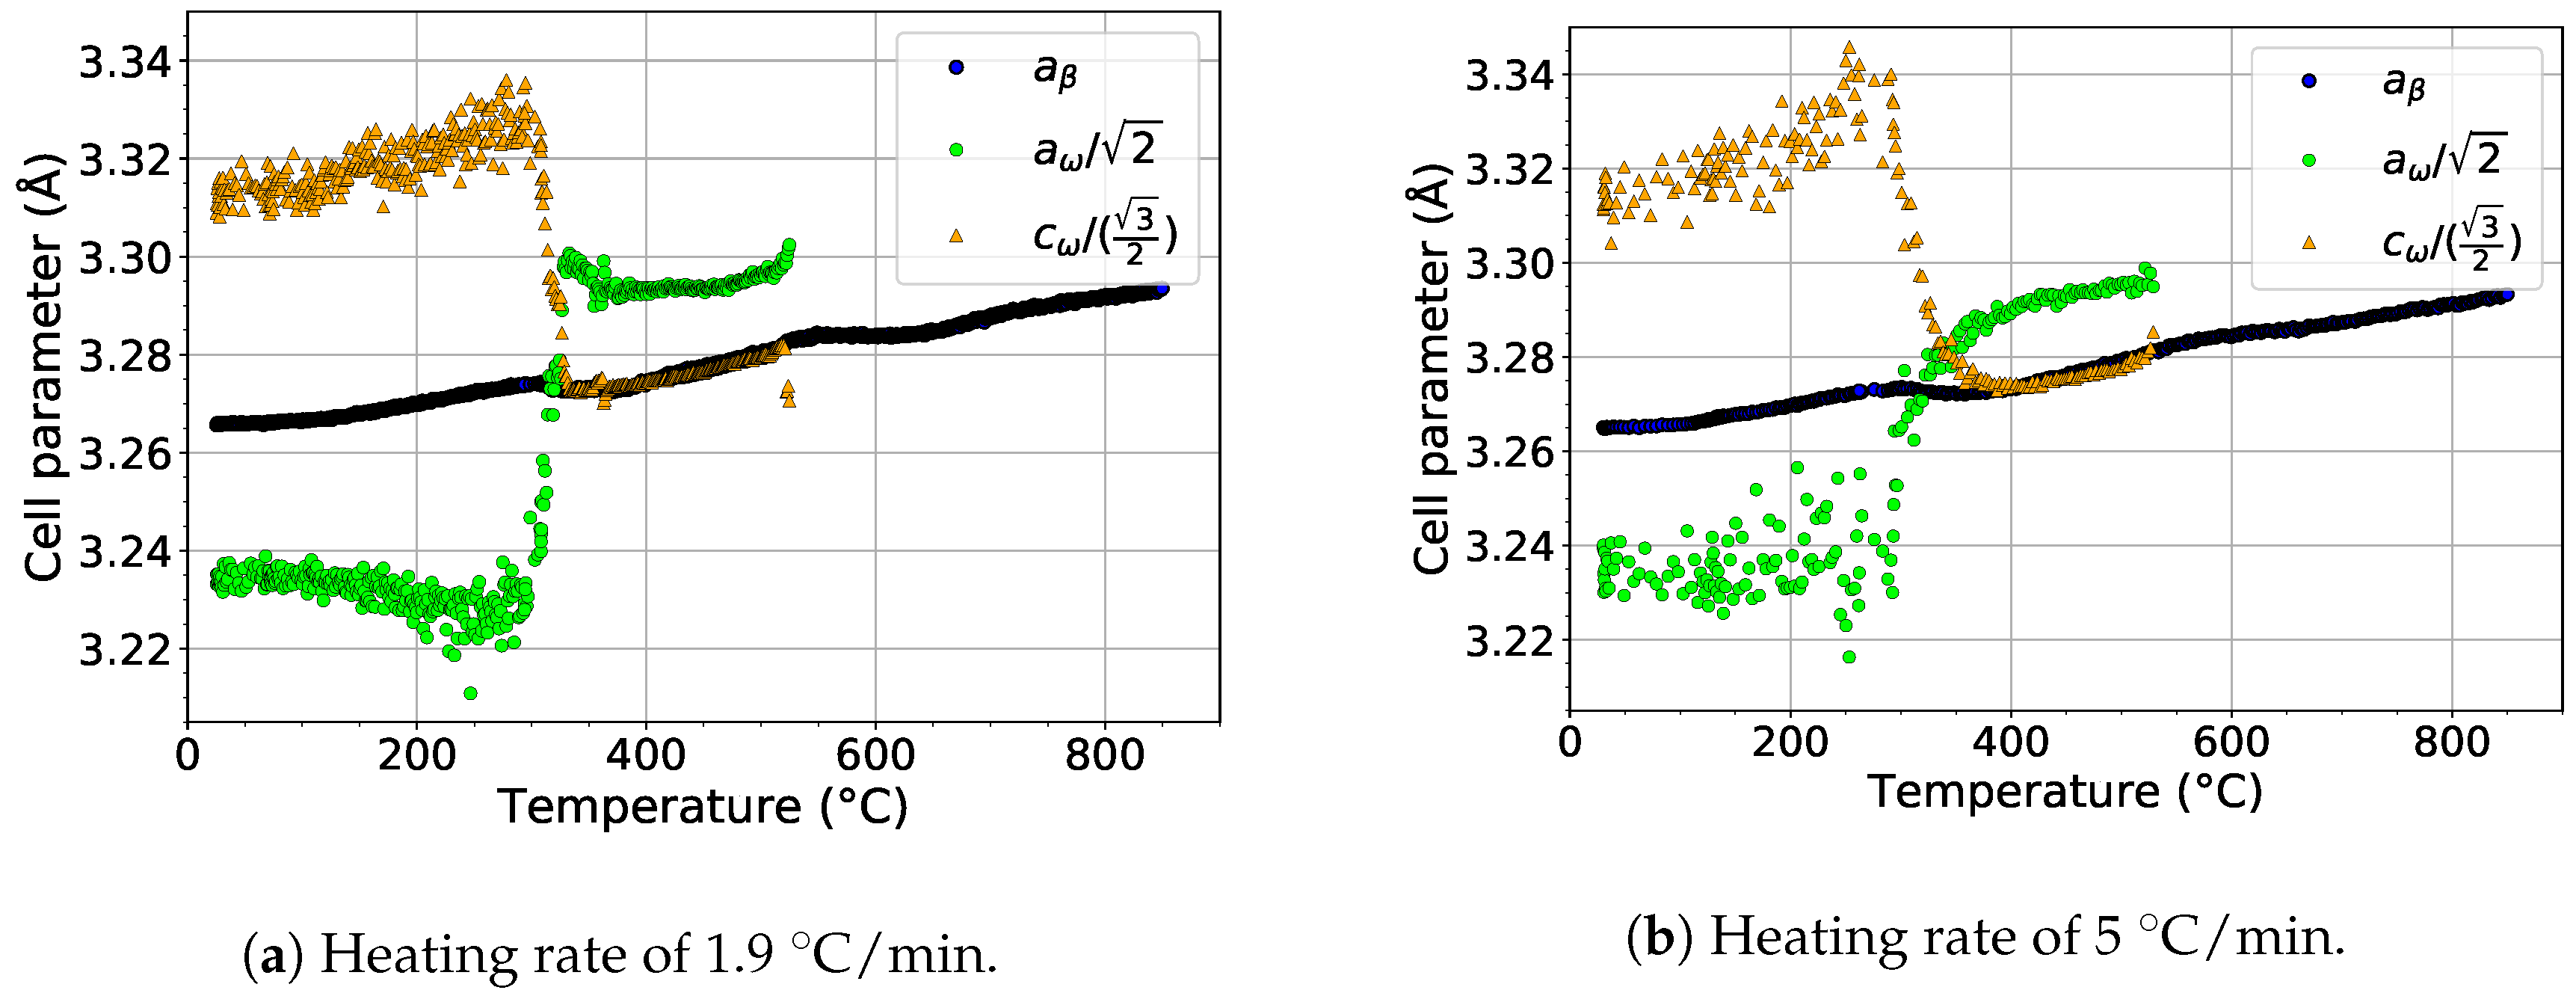
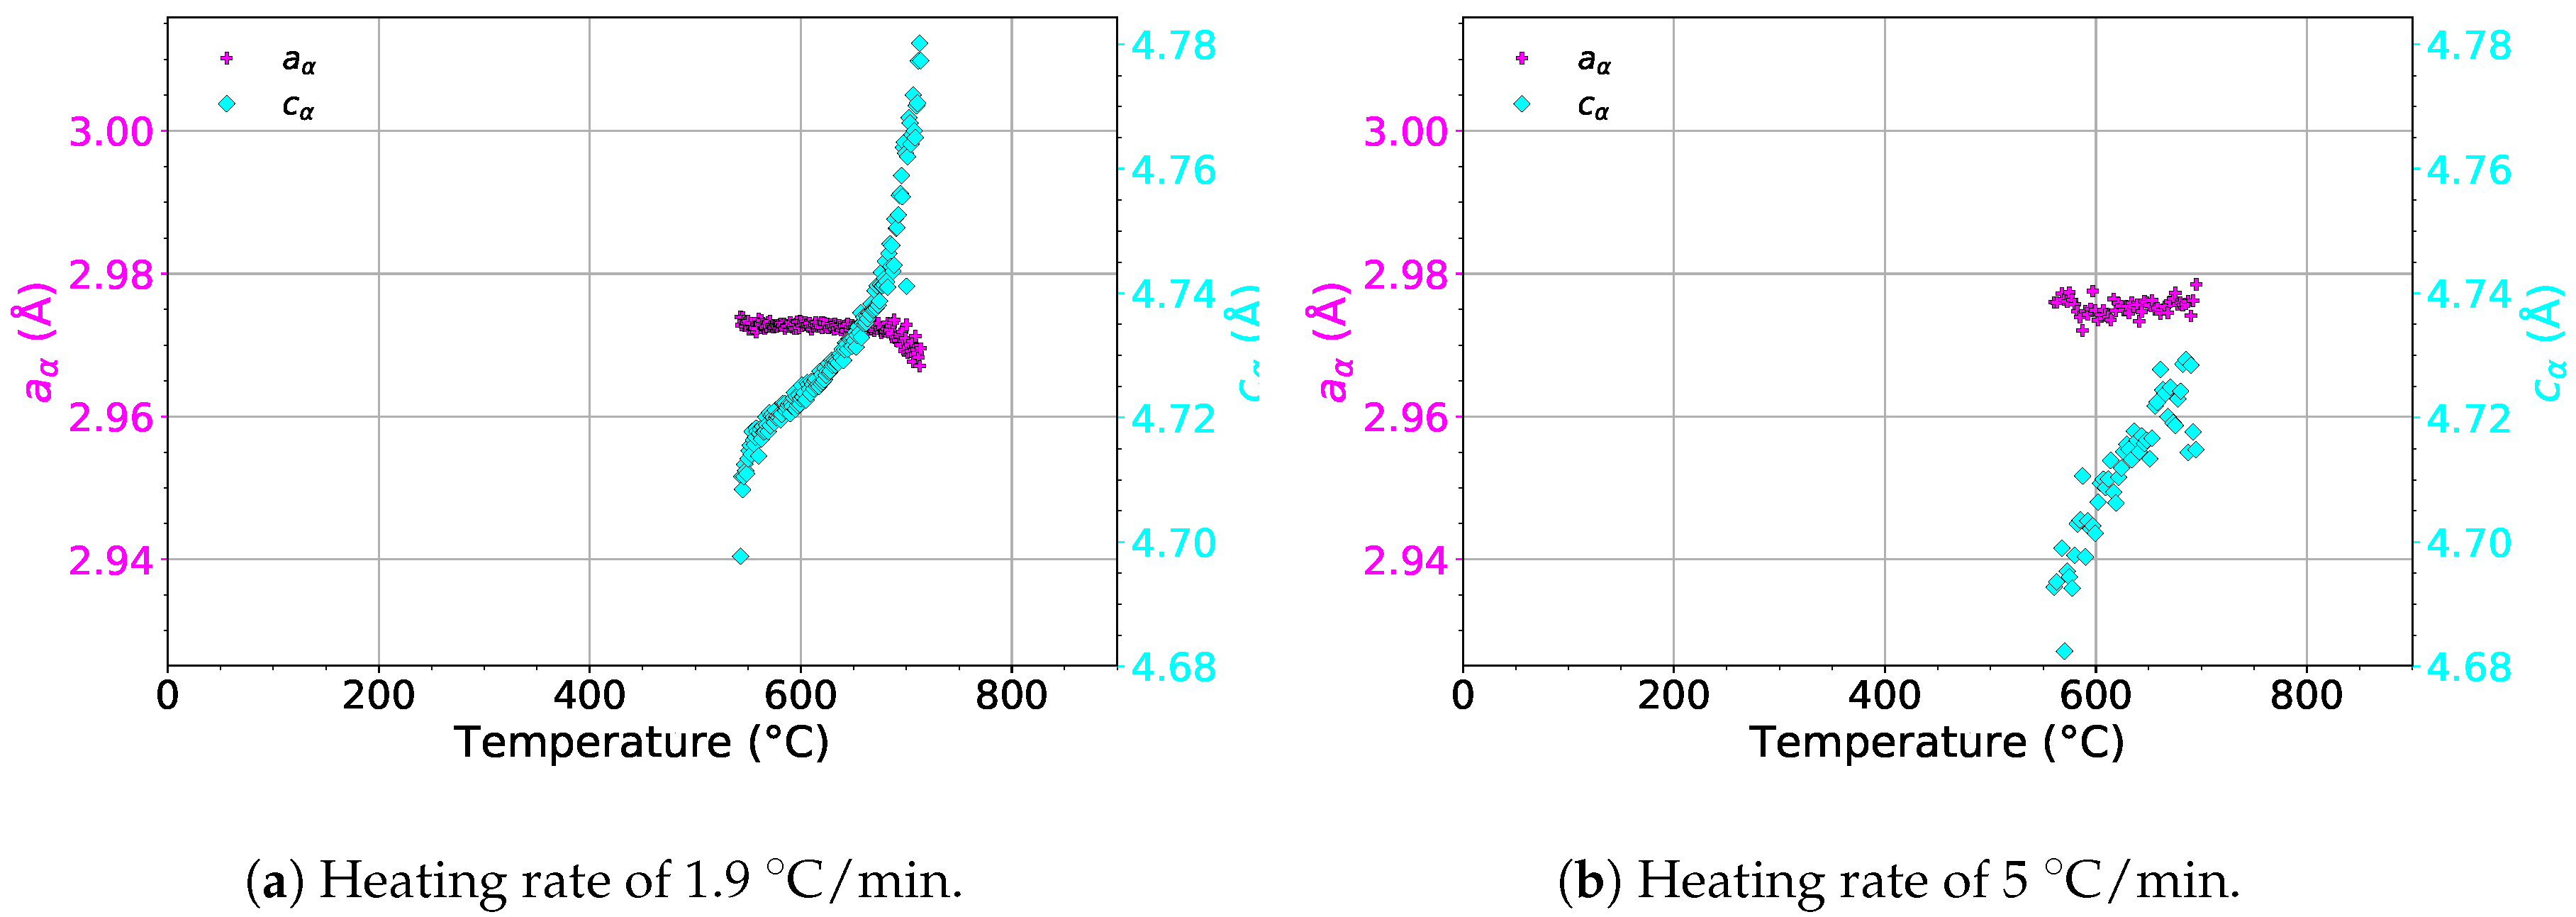
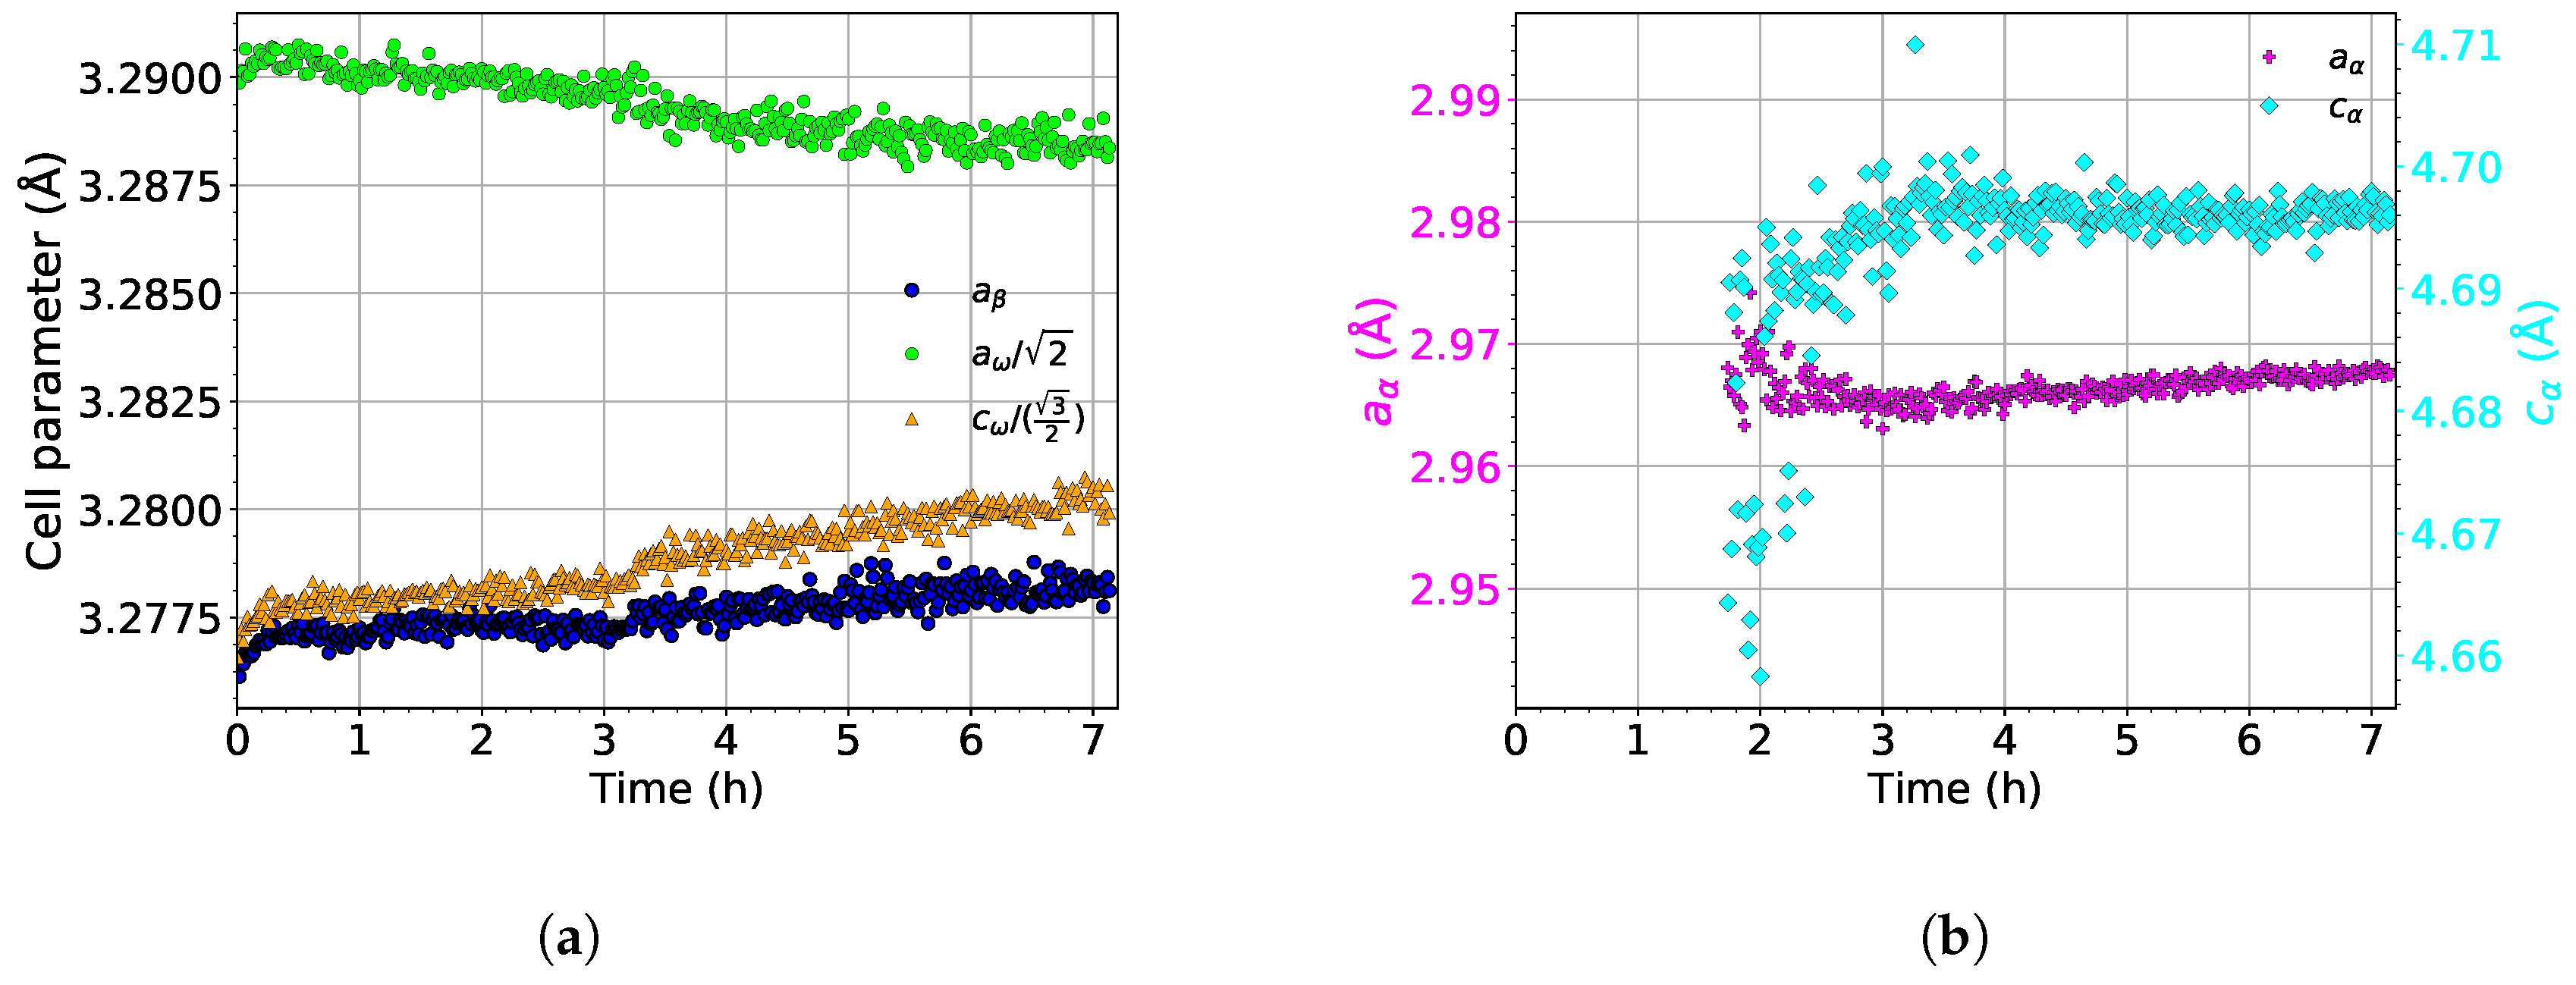
4.2. Evolution of Lattice Parameters
5. Conclusions
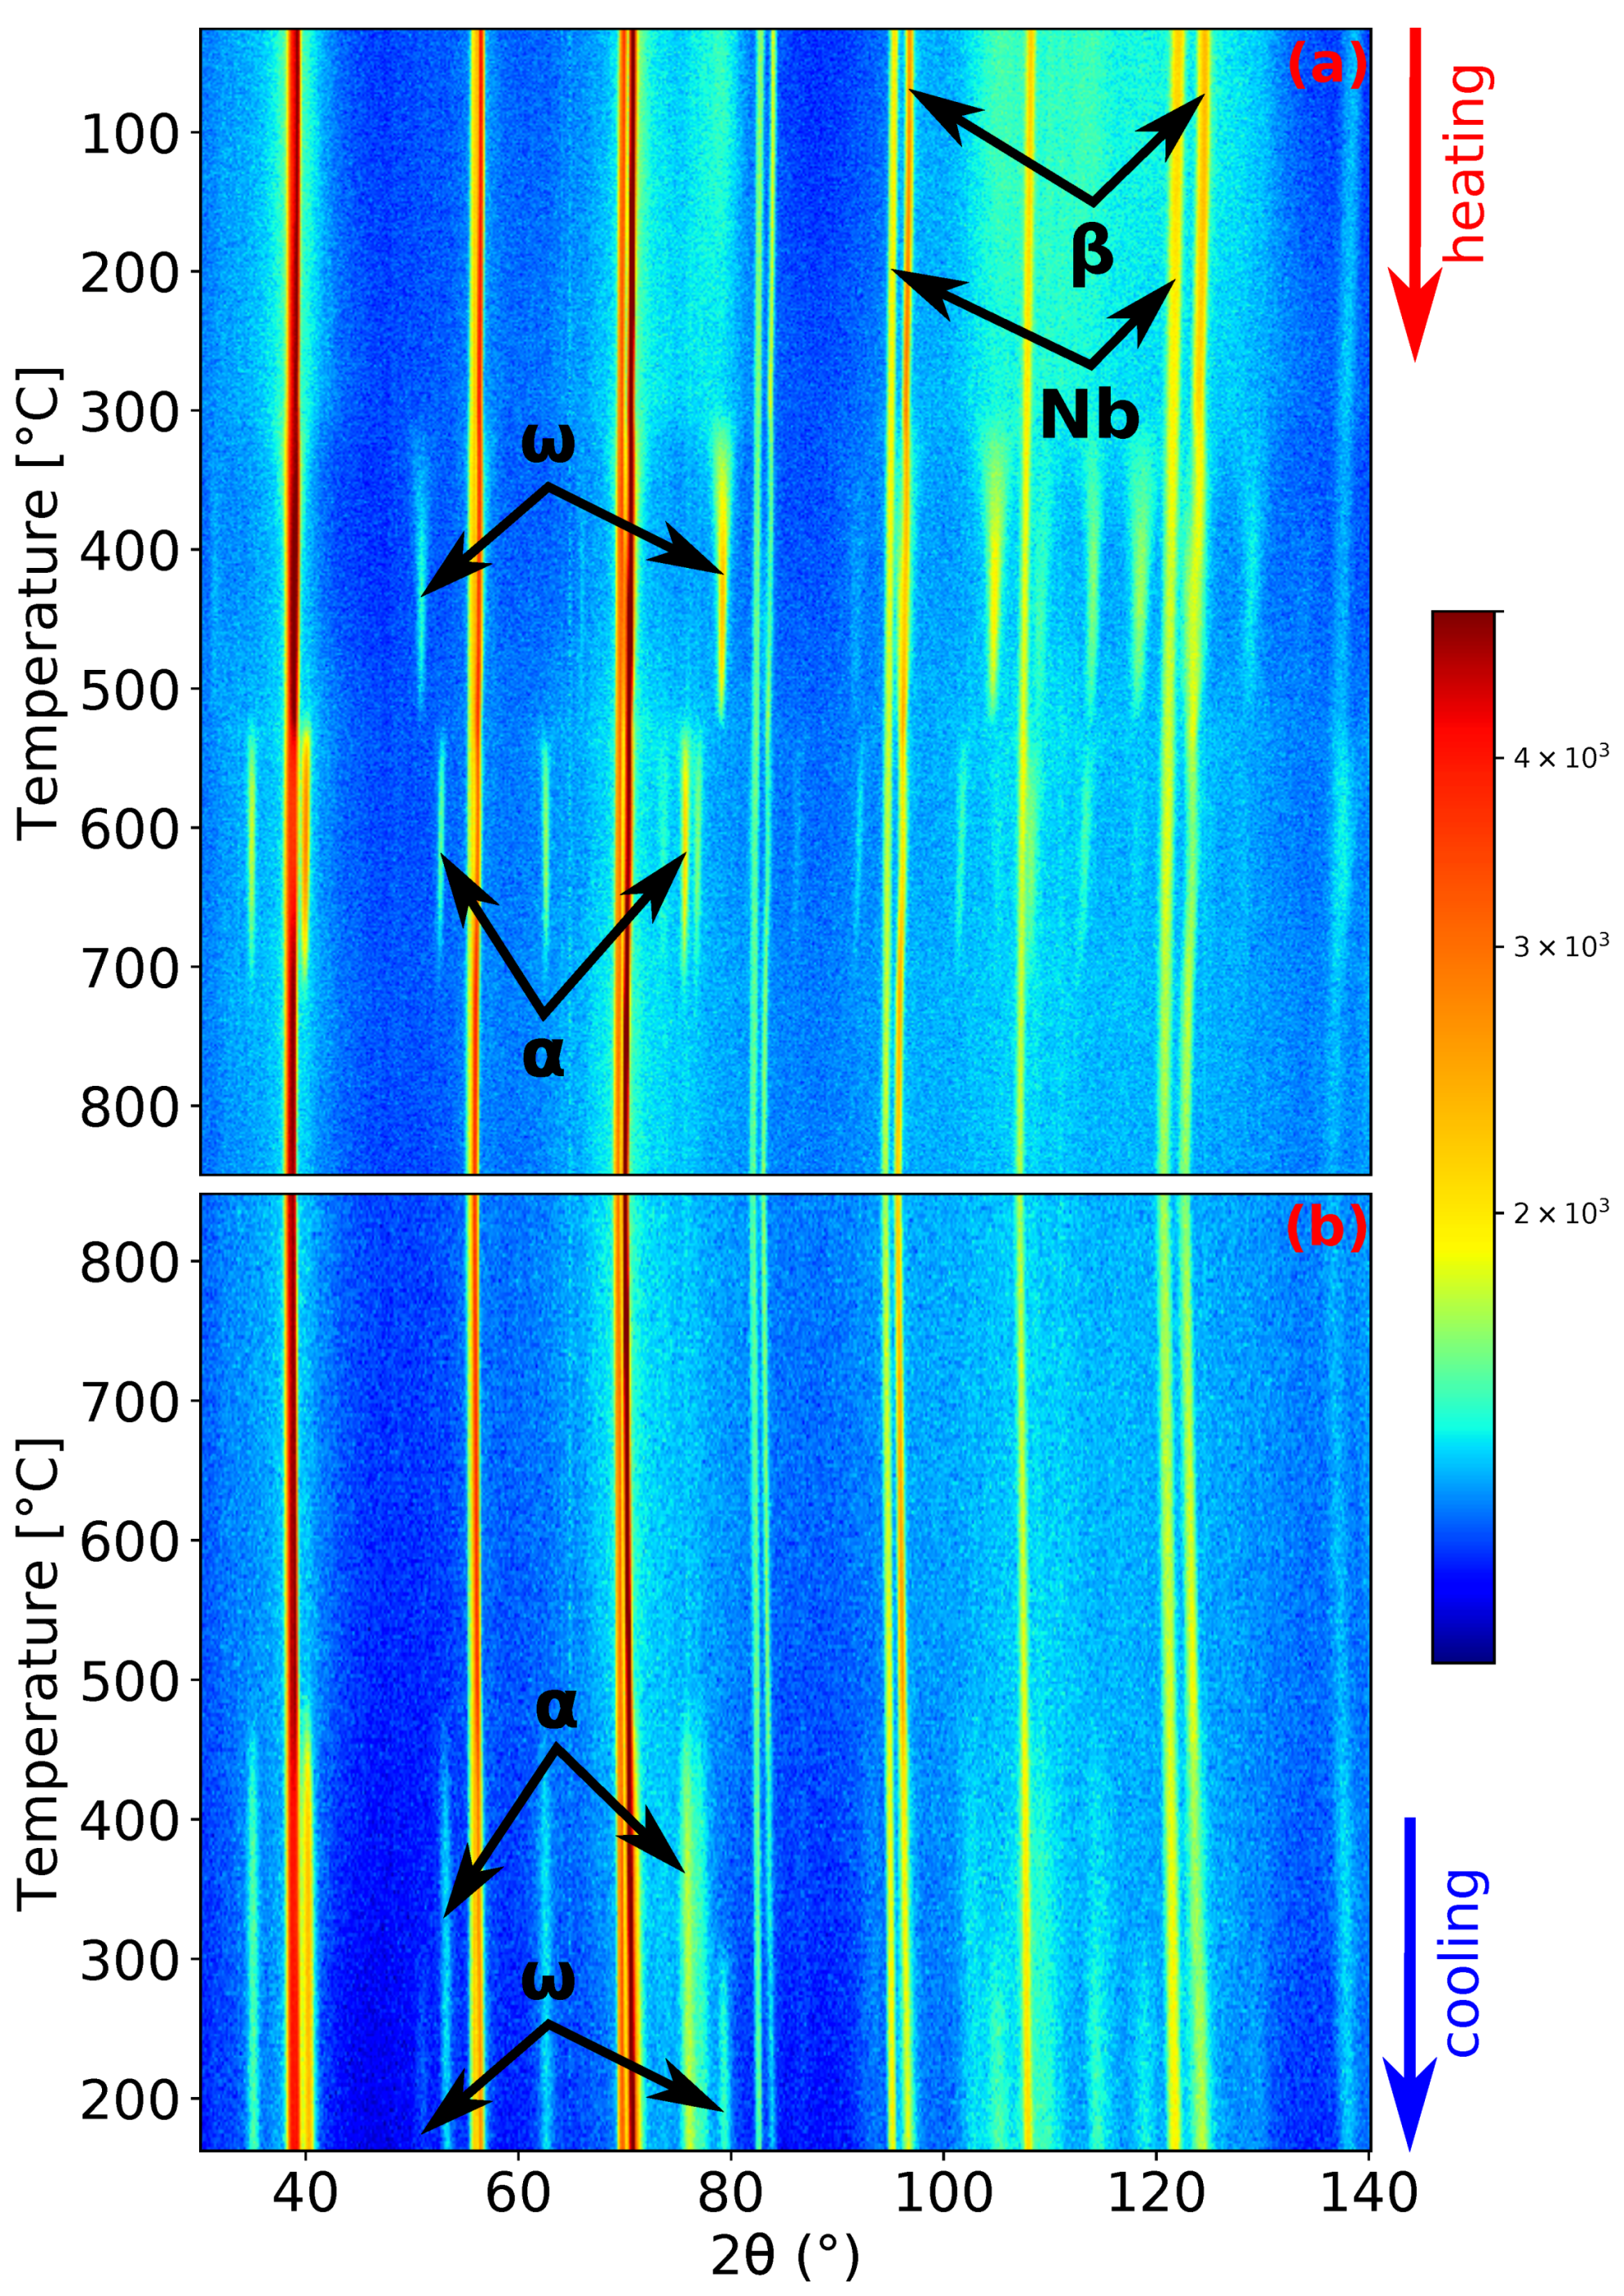
- For the heating rate of 1.9 :
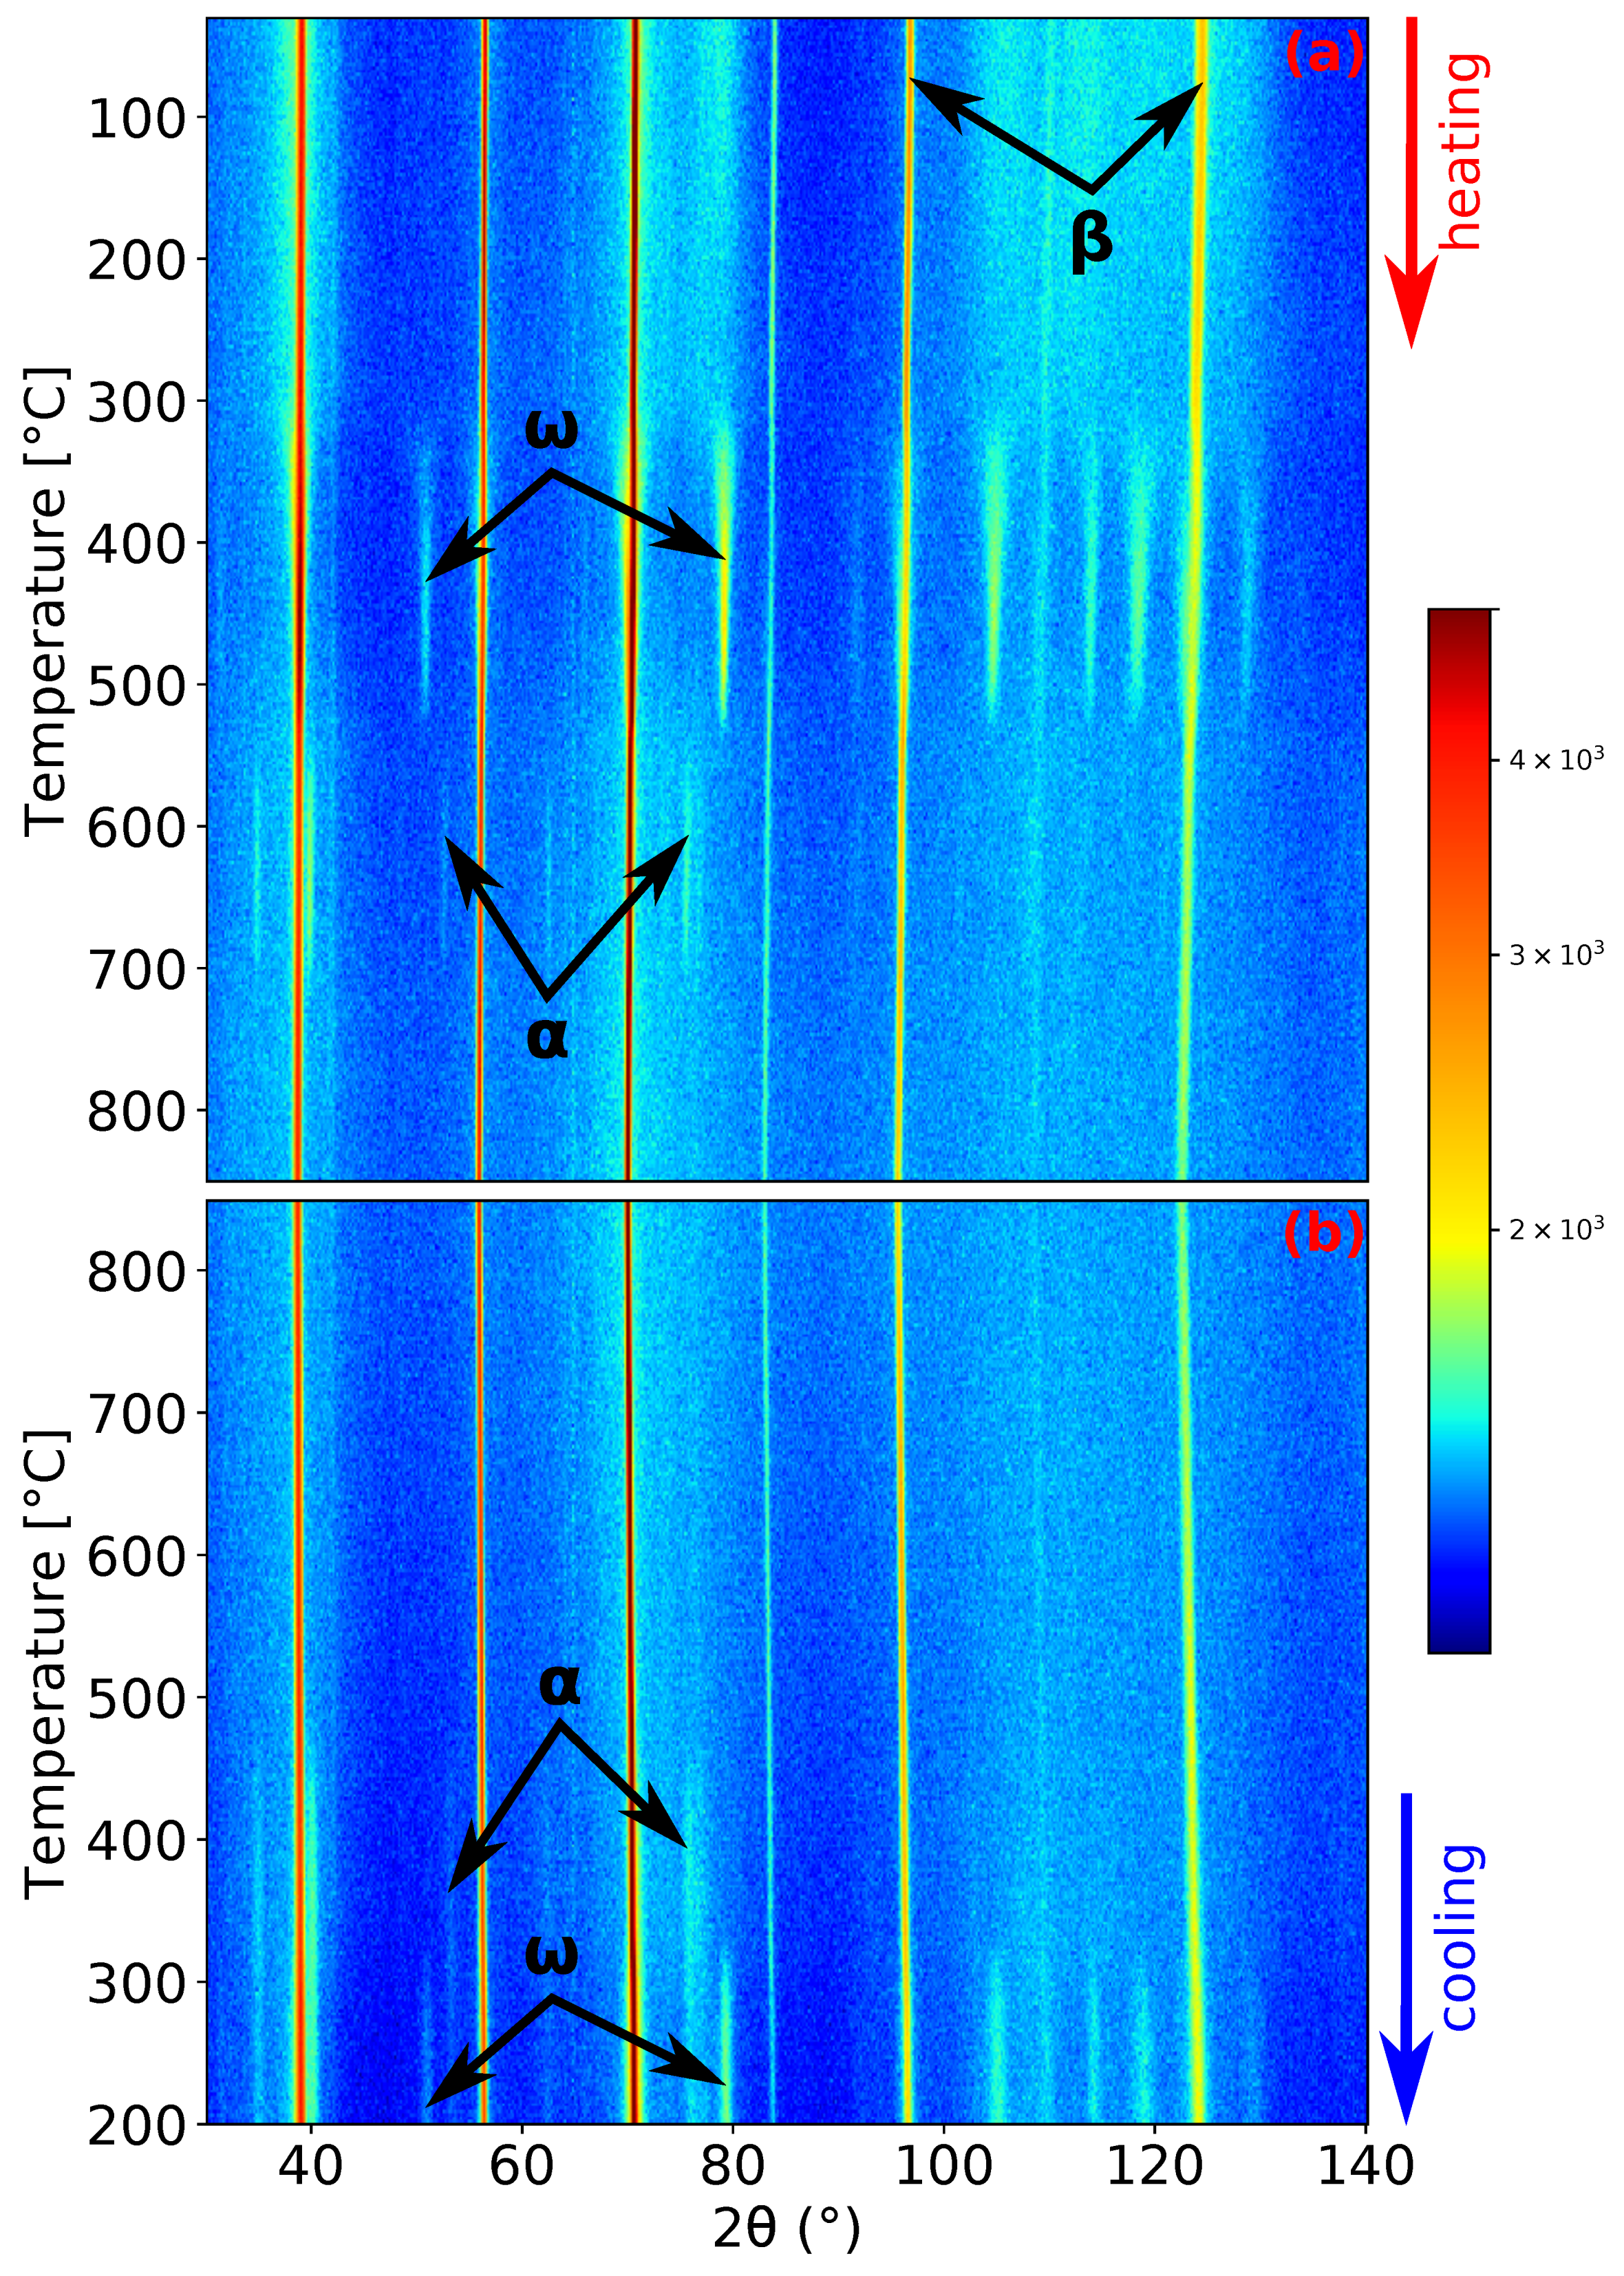
- For the heating rate of 5 :
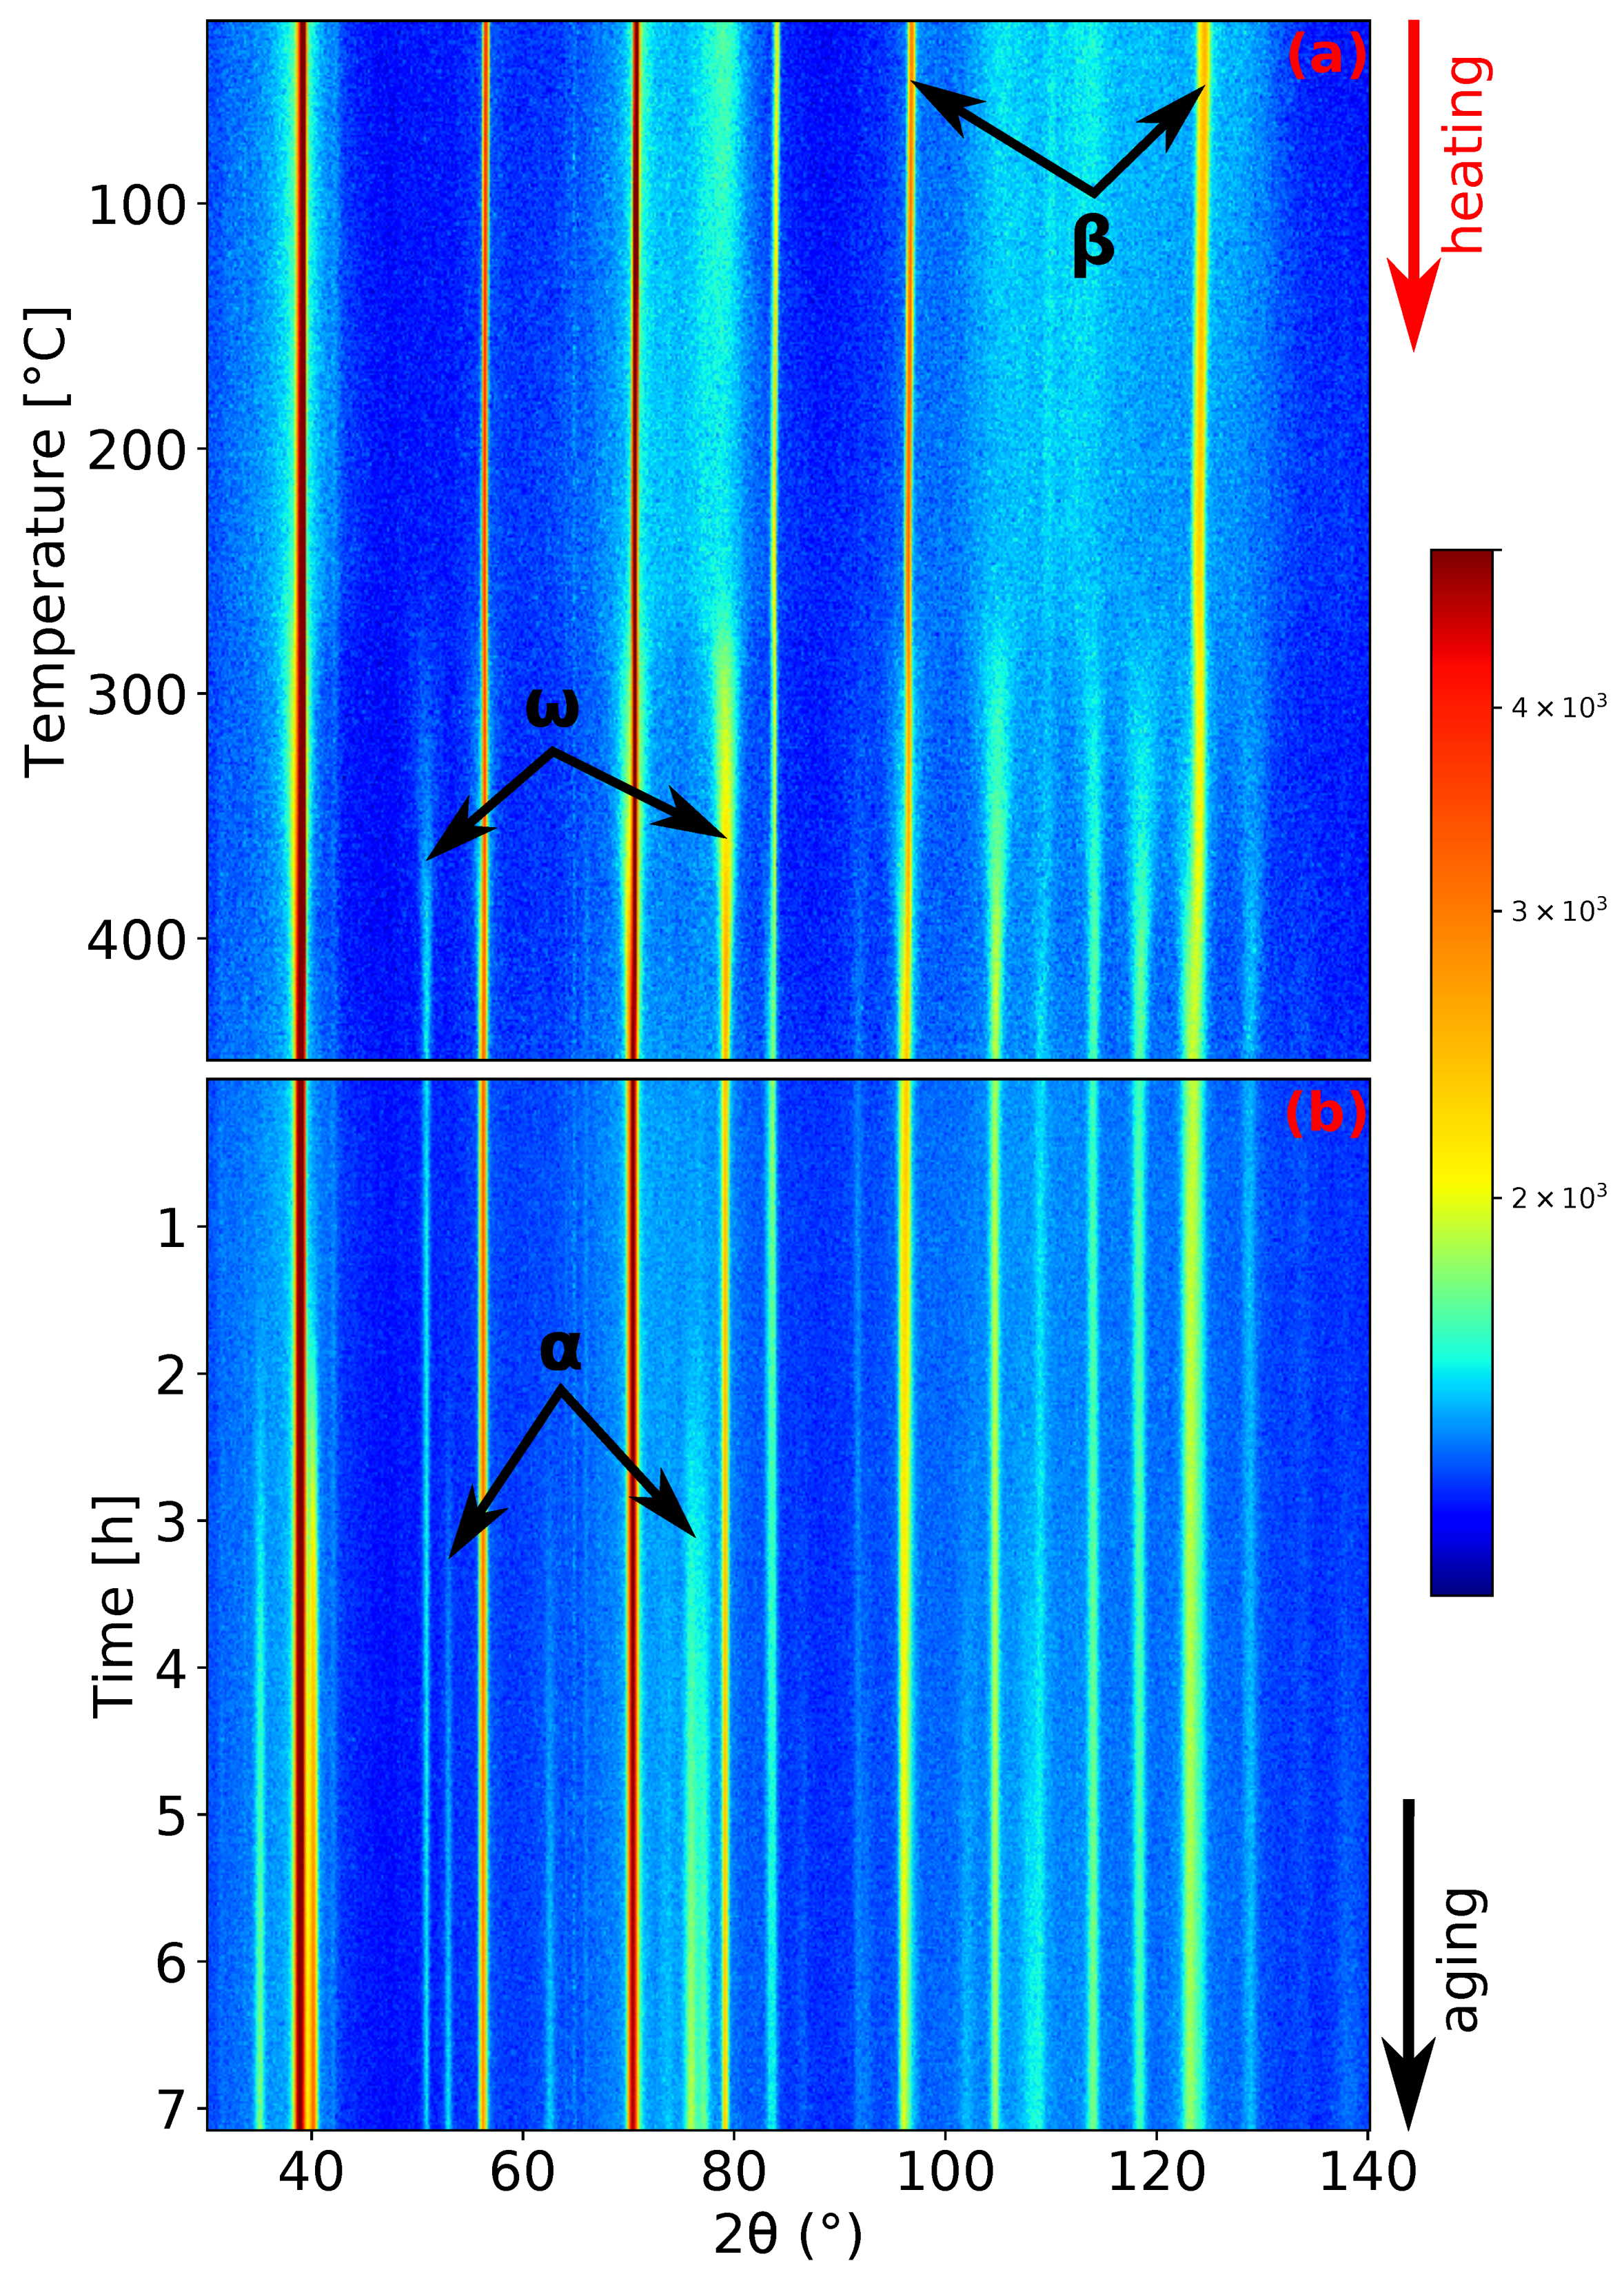
- For the heating rate of 1.9 and aging at 450 for seven hours:
Author Contributions
Funding
Conflicts of Interest
References
- Banerjee, D.; Williams, J.C. Perspectives on Titanium Science and Technology. Acta Mater. 2013, 61, 844–879. [Google Scholar] [CrossRef]
- Boyer, R.R.; Briggs, R.D. The use of β titanium alloys in the aerospace industry. J. Mater. Eng. Perform. 2005, 14, 681–685. [Google Scholar] [CrossRef]
- Duerig, T.W.; Williams, J.C. Overview: Microstructure and Properies of Beta-Titanium. In Beta-Titanium Alloys in the 1980’s; Boyer, R.R., Rosenberg, H.W., Eds.; The Metallurgical Society of AIME: Warrendale, PA, USA, 1984; pp. 19–69. [Google Scholar]
- Williams, J.C.; Hickman, B.S.; Marcus, H.L. The effect of omega phase on the mechanical properties of titanium alloys. Metall. Trans. 1971, 2, 1913–1919. [Google Scholar] [CrossRef]
- Ivasishin, O.M.; Markovsky, P.E.; Matviychuk, Y.V.; Semiatin, S.L.; Ward, C.H.; Fox, S. A comparative study of the mechanical properties of high-strength β-titanium alloys. J. Alloys Compd. 2008, 457, 296–309. [Google Scholar] [CrossRef]
- Zheng, Y.; Williams, R.E.; Sosa, J.M.; Alam, T.; Wang, Y.; Banerjee, R.; Fraser, H.L. The indirect influence of the ω phase on the degree of refinement of distributions of the α phase in metastable β-Titanium alloys. Acta Mater. 2016, 103, 165–173. [Google Scholar] [CrossRef]
- de Fontaine, D. Simple models for the omega phase transformation. Metall. Trans. A 1988, 19, 169–175. [Google Scholar] [CrossRef]
- Bennett, J.M.; Barnard, J.S.; Stone, H.J.; Midgley, P.A.; Rugg, D.; Jones, N.G. On the nature of the omega tri-layer periodicity in rapidly cooled Ti-15Mo. Scr. Mater. 2015, 107, 79–82. [Google Scholar] [CrossRef]
- Jones, N.; Dashwood, R.; Jackson, M.; Dye, D. β Phase decomposition in Ti-5Al-5Mo-5V-3Cr. Acta Mater. 2009, 57, 3830–3839. [Google Scholar] [CrossRef]
- Prima, F.; Vermaut, P.; Texier, G.; Ansel, D.; Gloriant, T. Evidence of α-nanophase heterogeneous nucleation from ω particles in a β-metastable Ti-based alloy by high-resolution electron microscopy. Scr. Mater. 2006, 54, 645–648. [Google Scholar] [CrossRef]
- Kim, S.H.; Kang, S.J.; Park, M.H.; Yang, C.W.; Lee, H.C.; Han, H.N.; Kim, M. Vacancy-mediated ω-assisted α-phase formation mechanism in titanium–molybdenum alloy. Acta Mater. 2015, 83, 499–506. [Google Scholar] [CrossRef]
- Ohmori, Y.; Ogo, T.; Nakai, K.; Kobayashi, S. Effects of ω-phase precipitation on β→α, α″ transformations in a metastable β titanium alloy. Mater. Sci. Eng. A 2001, 312, 182–188. [Google Scholar] [CrossRef]
- Zháňal, P.; Harcuba, P.; Hájek, M.; Smola, B.; Stráský, J.; Šmilauerová, J.; Veselý, J.; Janeček, M. Evolution of ω phase during heating of metastable β titanium alloy Ti-15Mo. J. Mater. Sci. 2018, 53, 837–845. [Google Scholar] [CrossRef]
- Zháňal, P.; Harcuba, P.; Hájek, M.; Stráský, J.; Śmilauerová, J.; Veselý, J.; Horák, L.; Janeček, M.; Holý, V. In situ detection of stability limit of ω phase in Ti–15Mo alloy during heating. J. Appl. Crystallogr. 2019, 52. [Google Scholar] [CrossRef]
- Zheng, Y.; Alam, T.; Williams, R.E.; Nag, S.; Banerjee, R.; Fraser, H.L. Structural and Compositional Characteristics of Isothermal Omega Phase in Beta Titanium Alloys. In Proceedings of the 13th World Conference on Titanium; John Wiley & Sons, Inc.: Hoboken, NJ, USA, 2016; pp. 559–562. [Google Scholar] [CrossRef]
- Zháňal, P.; Beran, P.; Hansen, T.; Šmilauerová, J.; Stráský, J.; Janeček, M.; Harcuba, P. Thermal expansion evolution of metastable β Ti-15Mo alloy during linear heating. IOP Conf. Ser. Mater. Sci. Eng. 2018, 461, 012094. [Google Scholar] [CrossRef]
- Barriobero-Vila, P.; Requena, G.; Schwarz, S.; Warchomicka, F.; Buslaps, T. Influence of phase transformation kinetics on the formation of α in a β-quenched Ti–5Al–5Mo–5V–3Cr–1Zr alloy. Acta Mater. 2015, 95, 90–101. [Google Scholar] [CrossRef]
- Barriobero-Vila, P.; Requena, G.; Warchomicka, F.; Stark, A.; Schell, N.; Buslaps, T. Phase transformation kinetics during continuous heating of a β-quenched Ti-10V-2Fe-3Al alloy. J. Mater. Sci. 2015, 50, 1412–1426. [Google Scholar] [CrossRef]
- Ho, J.C.; Collings, E.W. Anomalous Electrical Resistivity in Titanium-Molybdenum Alloys. Phys. Rev. B 1972, 6, 3727. [Google Scholar] [CrossRef]
- Luhman, T.S.; Taggart, R.; Polonis, D.H. A resistance anomaly in beta stabilized Ti-Cr alloys. Scr. Metall. 1968, 2, 169–172. [Google Scholar] [CrossRef]
- Hake, R.R.; Leslie, D.H.; Berlincourt, T.G. Electrical resistivity, Hall effect and superconductivity of some b.c.c. titanium-molybdenum alloys. J. Phys. Chem. Solids 1961, 20, 177–186. [Google Scholar] [CrossRef]
- Komatsu, S.y.; Ikeda, M.; Sugimoto, T.; Kamei, K.; Maesaki, O.; Kojima, M.a. Aging behaviour of Ti15Mo5Zr and Ti15Mo5Zr3Al alloy up to 573 K. Mater. Sci. Eng. A 1996, 213, 61–65. [Google Scholar] [CrossRef]
- Sun, F.; Prima, F.; Gloriant, T. High-strength nanostructured Ti-12Mo alloy from ductile metastable beta state precursor. Mater. Sci. Eng. A 2010, 527, 4262–4269. [Google Scholar] [CrossRef]
- Hill, M.A.; Polonis, D.H. Influence of beta phase decomposition on the temperature coefficient of resistivity of titanium alloys. J. Mater. Sci. 1987, 22, 2181–2184. [Google Scholar] [CrossRef]
- Yoshida, S.; Tsuya, Y. The Temperature Dependence of the Electrical Resistivity of the β-phase Titanium-Molybdenum Alloys. J. Phys. Soc. Jpn. 1956, 11, 1206–1207. [Google Scholar] [CrossRef]
- Prima, F.; Debuigne, J.; Boliveau, M.; Ansel, D. Control of omega phase volume fraction precipitated in a beta titanium alloy: Development of an experimental method. J. Mater. Sci. Lett. 2000, 19, 2219–2221. [Google Scholar] [CrossRef]
- Martins Júnior, J.R.S.; Nogueira, R.A.; Araújo, R.O.d.; Donato, T.A.G.; Arana-Chavez, V.E.; Claro, A.P.R.A.; Moraes, J.C.S.; Buzalaf, M.A.R.; Grandini, C.R. Preparation and characterization of Ti-15Mo alloy used as biomaterial. Mater. Res. 2011, 14, 107–112. [Google Scholar] [CrossRef] [Green Version]
- ATI 15MoTM Titanium Alloy; Technical Report; Allegheny Technologies Incorporated: Pittsburgh, PA, USA, 2014.
- Disegi, J. Implant Materials. Wrought Titanium—15% Molybdenum; Synthes: Warsaw, IN, USA, 2009. [Google Scholar]
- ASTM F2066-18, Standard Specification for Wrought Titanium-15 Molybdenum Alloy for Surgical Implant Applications (UNS R58150); Technical Report; ASTM International: West Conshohocken, PA, USA, 2018. [CrossRef]
- Zháňal, P.; Beran, P.; Hansen, T. Study of Phase Transformations in Ti-15Mo Alloy Leading to Inverse Resistivity Evolution; Technical Report; Institut Laue-Langevin: Grenoble, France, 2018. [Google Scholar] [CrossRef]
- Hansen, T.C.; Henry, P.F.; Fischer, H.E.; Torregrossa, J.; Convert, P. The D20 instrument at the ILL: A versatile high-intensity two-axis neutron diffractometer. Meas. Sci. Technol. 2008, 19, 034001. [Google Scholar] [CrossRef]
- ILL Neutrons for Society—Instrument Layout. Available online: https://www.ill.eu/users/instruments/instruments-list/d20/description/instrument-layout/ (accessed on 18 June 2018).
- Nejezchlebová, J.; Seiner, H.; Sedlák, P.; Landa, M.; Šmilauerová, J.; Aeby-Gautier, E.; Denand, B.; Dehmas, M.; Appolaire, B. On the complementarity between resistivity measurement and ultrasonic measurement for in situ characterization of phase transitions in Ti-alloys. J. Alloys Compd. 2018, 762, 868–872. [Google Scholar] [CrossRef]
- Rodriguez-Carvajal, J. FULLPROF: A program for Rietveld refinement and pattern matching analysis. In Proceedings of the Satellite Meeting on Powder Diffraction of the XV Congress of the IUCr, Toulouse, France, 16–19 July 1990; p. 127. [Google Scholar]
- Zháňal, P.; Harcuba, P.; Janeček, M.; Šmilauerová, J.; Veselý, J.; Smola, B.; Zimina, M. Phase Transformations in Metastable Ti-15Mo During Linear Heating. In Proceedings of the 13th World Conference on Titanium; Venkatesh, V., Pilchak, A.L., Allison, J.E., Ankem, S., Boyer, R.R., Christodoulou, J., Fraser, H.L., Imam, M.A., Kosaka, Y., Rack, H.J., et al., Eds.; TMS (The Minerals, Metals & Materials Society): Pittsburgh, PA, USA, 2016; pp. 431–436. [Google Scholar] [CrossRef]
- Prima, F.; Vermaut, P.; Thibon, I.; Ansel, D.; Debuigne, J.; Gloriant, T. Nanostructured Metastable β-Titanium Based Alloy. J. Metastable Nanocryst. Mater. 2002, 13, 307–314. [Google Scholar] [CrossRef]
- Furuhara, T.; Makino, T.; Idei, Y.; Ishigaki, H.; Takada, A.; Maki, T. Morphology and Crystallography of α Precipitates in β Ti-Mo Binary Alloys. Mater. Trans. JIM 1998, 39, 31–39. [Google Scholar] [CrossRef]
- Banerjee, S.; Mukhopadhyay, P. Phase transformations: Examples from Titanium and Zirconium Alloys; Number 12 in Pergamon Materials Series; Elsevier: Pergamon, Turkey, 2007; p. 813. [Google Scholar]
- Avrami, M. Kinetics of Phase Change. II Transformation-Time Relations for Random Distribution of Nuclei. J. Chem. Phys. 1940, 8, 212–224. [Google Scholar] [CrossRef]
- Christian, J. The Theory of Transformations in Metals and Alloys; Pergamon: Oxford, UK, 2002; p. 568. [Google Scholar] [CrossRef]
- Leyens, C.; Peters, M. (Eds.) Titanium and Titanium Alloys: Fundamentals and Applications; John Wiley & Sons: Hoboken, NJ, USA, 2003; p. 513. [Google Scholar] [CrossRef]
- Cao, P.; Tian, F.; Wang, Y. Effect of Mo on the phase stability and elastic mechanical properties of Ti–Mo random alloys from ab initio calculations. J. Phys. Condens. Matter 2017, 29, 435703. [Google Scholar] [CrossRef] [PubMed]
- Gloriant, T.; Texier, G.; Sun, F.; Thibon, I.; Prima, F.; Soubeyroux, J. Characterization of nanophase precipitation in a metastable β titanium-based alloy by electrical resistivity, dilatometry and neutron diffraction. Scr. Mater. 2008, 58, 271–274. [Google Scholar] [CrossRef]
- Zháňal, P.; Harcuba, P.; Hájek, M.; Šmilauerová, J.; Veselý, J.; Janeček, M. Characterization of Phase Transitions Occurring in Solution Treated Ti-15Mo during Heating by Thermal Expansion and Electrical Resistance Measurements. Mater. Sci. Forum 2017, 879, 2318–2323. [Google Scholar] [CrossRef]
- Silcock, J.M. An X-ray examination of the to phase in TiV, TiMo and TiCr alloys. Acta Metall. 1958, 6, 481–493. [Google Scholar] [CrossRef]


© 2019 by the authors. Licensee MDPI, Basel, Switzerland. This article is an open access article distributed under the terms and conditions of the Creative Commons Attribution (CC BY) license (http://creativecommons.org/licenses/by/4.0/).
Share and Cite
Zháňal, P.; Harcuba, P.; Stráský, J.; Šmilauerová, J.; Beran, P.; Hansen, T.C.; Seiner, H.; Janeček, M. Transformation Pathway upon Heating of Metastable β Titanium Alloy Ti-15Mo Investigated by Neutron Diffraction. Materials 2019, 12, 3570. https://doi.org/10.3390/ma12213570
Zháňal P, Harcuba P, Stráský J, Šmilauerová J, Beran P, Hansen TC, Seiner H, Janeček M. Transformation Pathway upon Heating of Metastable β Titanium Alloy Ti-15Mo Investigated by Neutron Diffraction. Materials. 2019; 12(21):3570. https://doi.org/10.3390/ma12213570
Chicago/Turabian StyleZháňal, Pavel, Petr Harcuba, Josef Stráský, Jana Šmilauerová, Přemysl Beran, Thomas C. Hansen, Hanuš Seiner, and Miloš Janeček. 2019. "Transformation Pathway upon Heating of Metastable β Titanium Alloy Ti-15Mo Investigated by Neutron Diffraction" Materials 12, no. 21: 3570. https://doi.org/10.3390/ma12213570