Analysis of Wind-Induced Vibration of a Spoke-Wise Cable–Membrane Structure


1
School of Civil Engineering, Chang’an University, Xi’an 710061, Shaanxi, China
2
School of Civil Engineering, Fujian University of Technology, Fuzhou 350118, China
3
Institute of Theoretical and Applied Mechanics of the Czech Academy of Sciences, 19000 Prague, Czech Republic
*
Author to whom correspondence should be addressed.
J. Mar. Sci. Eng. 2020, 8(8), 603; https://doi.org/10.3390/jmse8080603
Submission received: 2 July 2020
/
Revised: 7 August 2020
/
Accepted: 10 August 2020
/
Published: 13 August 2020
Abstract
:Lightweight cable–membrane structures can span large distances and undertake aesthetically pleasing shapes. They are widely used for roofs and modern structural canopies and in the aerospace industry for large on-board antenna reflectors that are to be deployed in space. This paper studies a wind-induced vibration under different cable stress relaxation conditions based on the wind load time-history to obtain the dynamic behavior of such a structure. Particularly, the focus is put upon its wind resistance in the event of stress relaxation. This research can provide an important reference for the design of wind resistance, damage assessment, and emergency maintenance for the spoke-wise cable–membrane structure (SCMS).
1. Introduction
The lightweight structures of cable membranes are sensitive to the wind. A small change in the wind load could lead to the large deformation and even destruction of a cable membrane. In 1995, four pieces of the membrane material of the Georgia Dome in the United States were torn by a strong windstorm. This damage resulted in cracking with a length of more than 10 m. In 1999, the open-type membrane roof of the Olympic stadium in Montreal, Canada, fell apart because of a sudden storm. In 2003, the wrapping materials of the east side of the roof of the Shanghai Grand Theater were torn by strong winds. In 2005, Typhoon Matsa tore up the membrane structure roof of Ningbo Beilun Sport and Art Center [1]. When these damages occurred, the local wind speed was significantly lower than the design wind speed used for the design of cable membranes structures. Therefore, the membrane structure appears to be limited by the design theory and by the calculation methods as well. Due to these limitations, the resistance design of the membrane structure should also be improved concerning the possible damage induced by wind-induced vibration.
Over the years, various studies have focused on the mechanical properties and failure mechanism of cable membrane structures under wind loads. Gluck et al. (2003) applied a partitioned coupling approach for time-dependent fluid-structure interactions to thin shells and membrane structures with large displacements. The investigation was focused on several phenomena, such as vortex shedding, resonance, and influence of the interaction between several flexible plates at different Reynolds numbers [2]. Zhang et al. [3] presented preliminary results of the wind tunnel test on an aeroelastic model of a cable dome focusing on the aeroelastic instability issues. Wei et al. [4] used the finite element method to analyze nonlinear wind-induced vibration response of cable–membrane structures, including the influences of the wind direction, velocity, and membrane prestress. Yang et al. [5] studied the effects of both static and dynamic interaction on structural characteristics. Moreover, they analyzed the relationship between the interaction parameters and the covered area of a membrane structure for the static interaction, as well as the relationship between the interaction parameters and wind direction and speed for the dynamic interaction.
Rojratsirikul et al. [6] used a high-speed camera to measure the deformation of the membrane as a function of the wind incidence angle and free-stream velocity. They investigated the effects of the membrane pre-strain and excess length upon the unsteady fluid-structure interactions of membrane airfoils. Kim et al. [7] carried out long-term monitoring of the acceleration responses of the World Cup Stadium’s roof structure in Jeju-do, Korea. They examined the changes in the modal properties associated with the difference in temperature and vibration amplitudes. Michalski et al. [8] outlined a practical design methodology for lightweight, flexible membrane structures under the effect of fluctuating wind. They provided results on the unique validation at an extremely flexible 29 m tall umbrella. Zhou et al. [9] applied the boundary element method, based on two proposed added mass models, to estimate the added mass for open flat membranes vibrating in the still air. Zhao et al. [10] illustrated the dynamic properties of the non-fully symmetric Geiger cable dome. They revealed that the initial prestress has significant effects on the natural vibration of a membrane structure. Frey et al. [11] modeled a flag as a membrane to investigate two-dimensional properties of its vibration response in the uniform flow. They introduced and utilized the affecting tension and pressure functions for the wind flow with a constant velocity. Wu et al. (2015) investigated the aero-elastic instability mechanism of two membrane structures in a uniform wind flow with the identical shape but with different pretension levels [12]. Wood et al. [13] investigated in a wind tunnel experiments fluid-structure interaction of a thin-walled membranous hemispherical flexible structure and implemented measurements of the membrane oscillation. In such a way, they obtained the characterization of the flexible structure under changing flow conditions. Dutta et al. [14] proposed a double-loop reliability-based design optimization of tensile membrane structures under uncertain wind load, thus reducing the cost of the inner-loop reliability analysis within finite element calculation. However, the study of Hao et al. [15] shows that the prestress relaxation occurs in the actual structure during the construction process, and their construction monitoring data show that the stress distribution of the structural cable system is not uniform. These factors would affect the mechanical properties of the membrane structure under wind load. Nevertheless, only a few researchers have focused on this issue.
Spoke-wise cable–membrane structure (SCMS), a large-span spatial structure, is commonly used in sports stadiums, exhibition halls, and other public buildings. The mechanical principle of this structural system originated from the construction of the bicycle wheel, which consists of an inner ring cable (IRC), radial cables, and an external pressure ring. A self-balanced system of external ring compression and inner ring tension is formed by applying pre-stress to a radial cable. Due to the corrosion, collision, and relaxation of prestressing, the internal cable system is deformed, which will lead to unpredictable vibration under wind load. To obtain the dynamic behavior of an SCMS under wind load, especially its wind resistance in the event of stress relaxation, this paper deals with the wind-induced vibration of a membrane structure in the conditions of the cables stress relaxation that is loaded by the simulated wind load time-history. It should create an additional essential reference for the design of wind resistance, damage assessment, and emergency maintenance for SCMS.
2. Analytical Derivation
2.1. Profile of the Spoke-Wise Cable–Membrane Structure (SCMS)
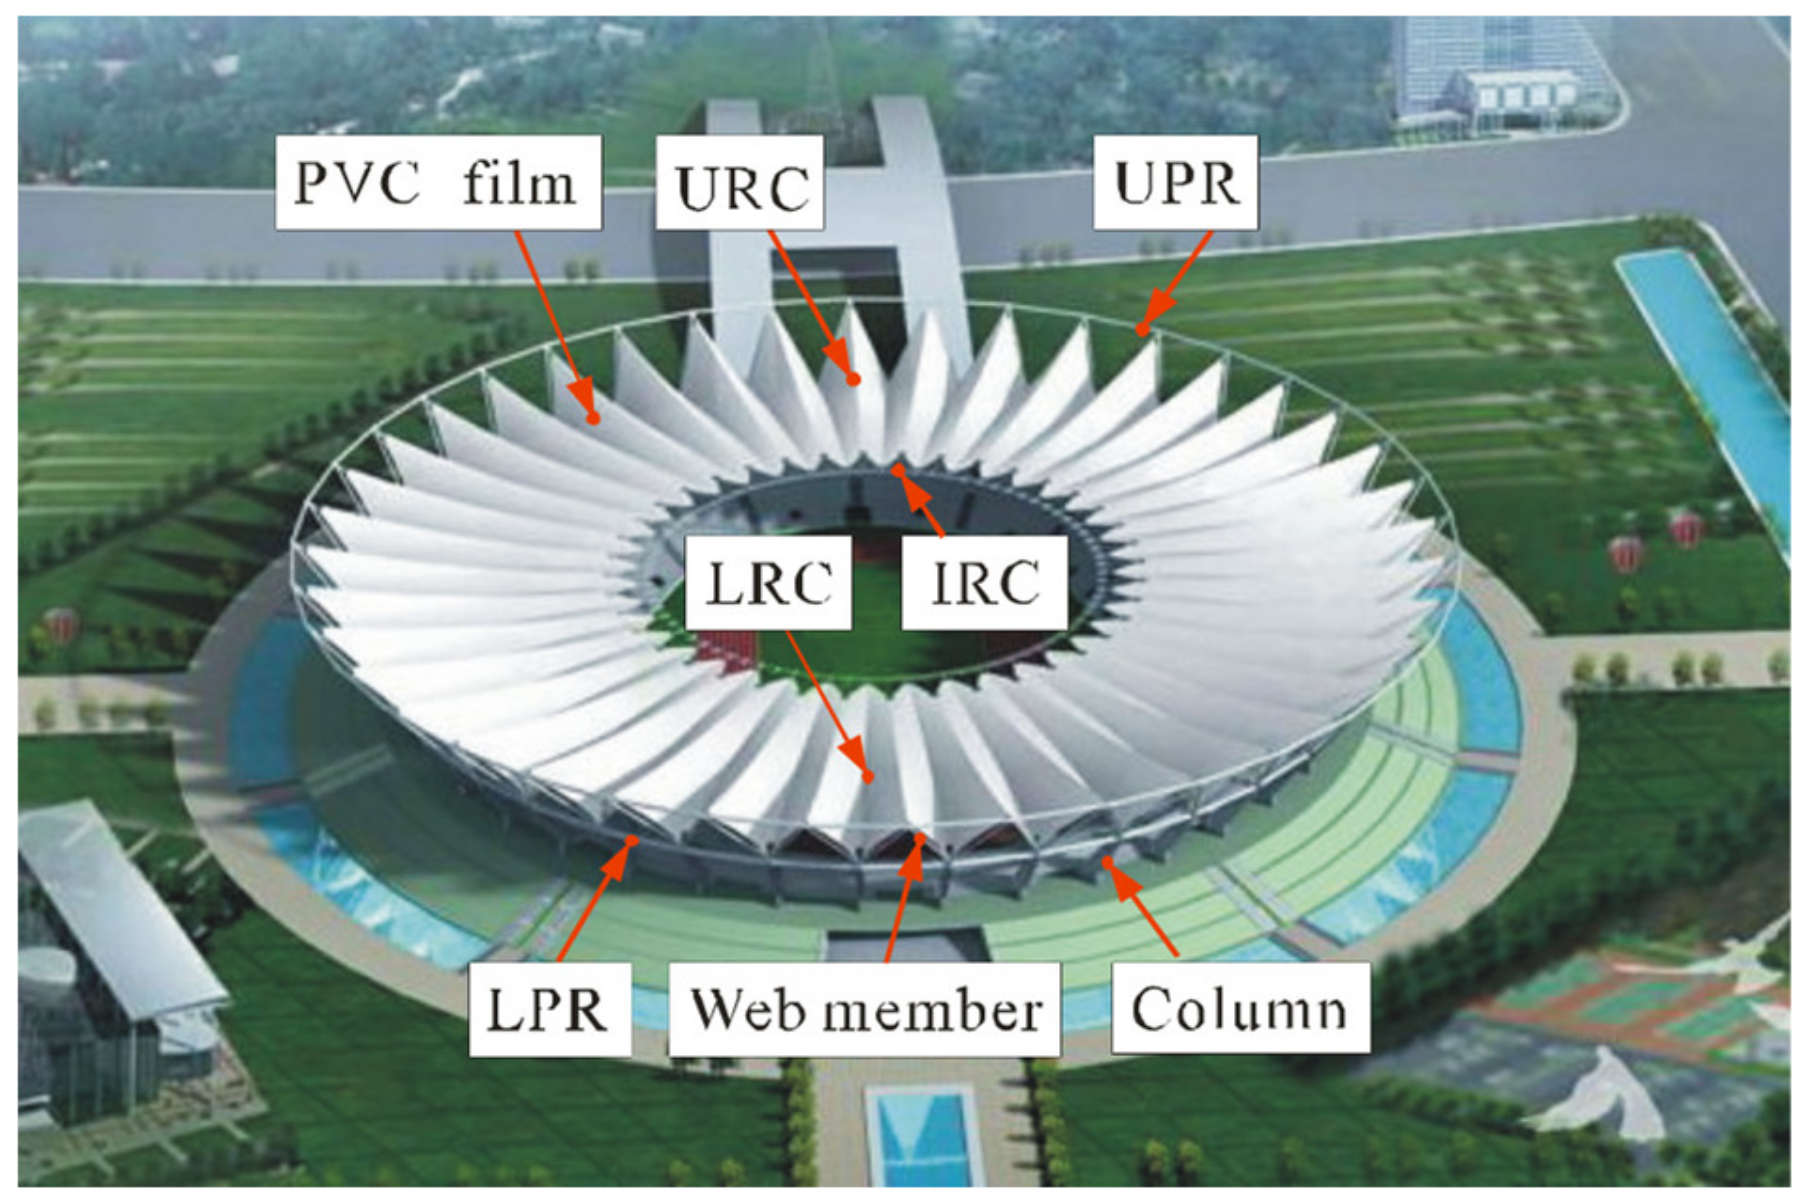
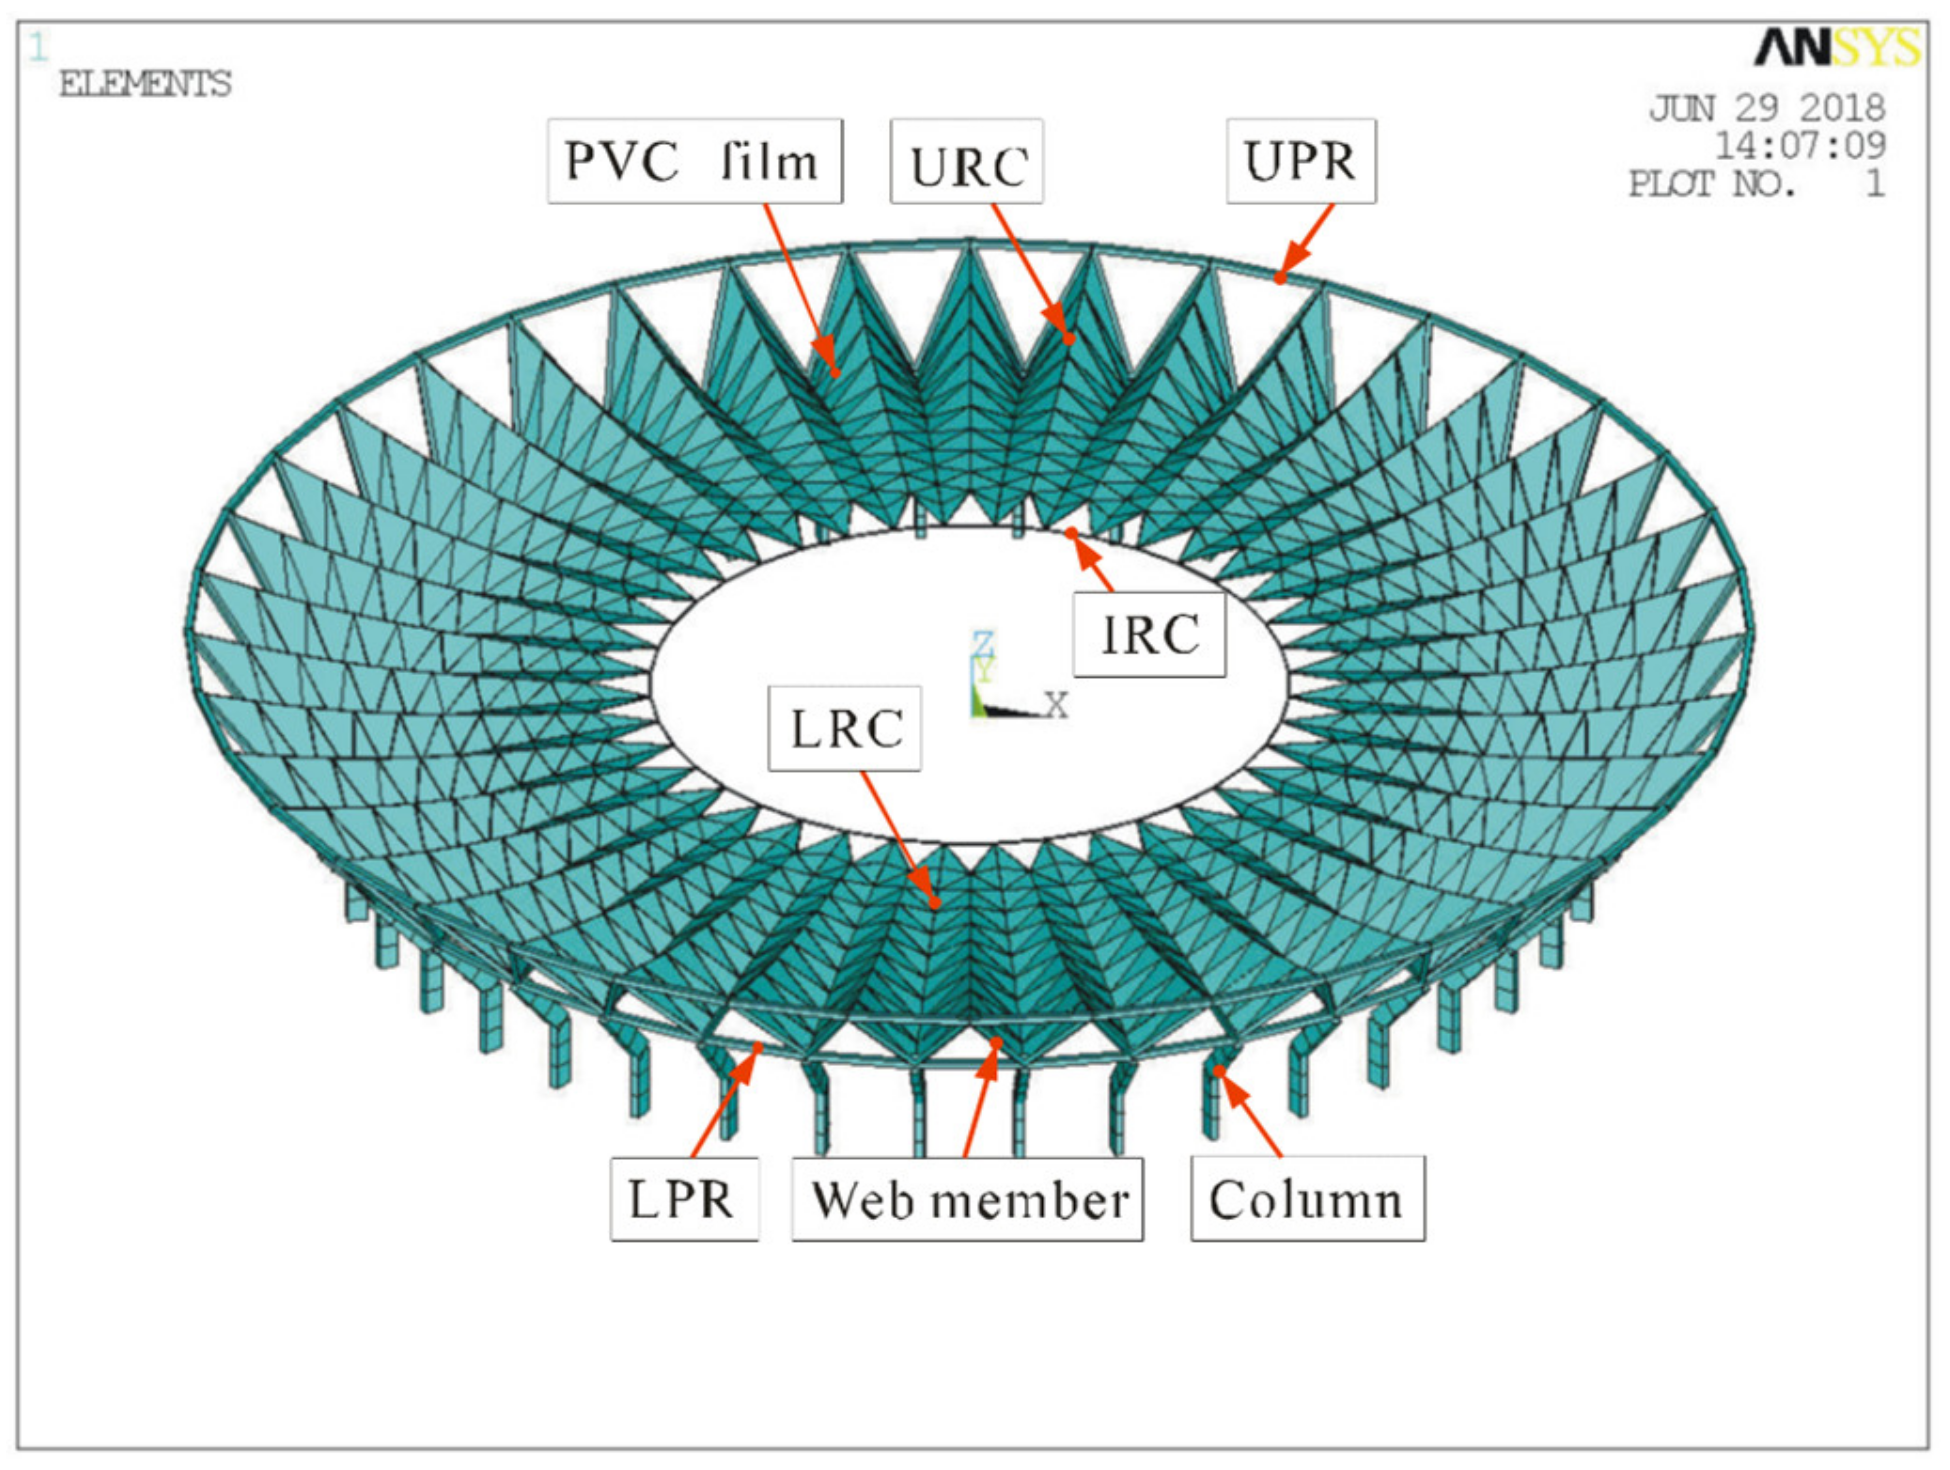
The prototype of the SMCS is the Foshan Century Lotus Sports Center (FCLSC), which can accommodate 36,680 spectators. The aerial view of this structure is shown in Figure 1. The structure is mainly composed of an Upper-Pressure Ring (UPR), a Lower Pressure Ring (LPR), Web Members, Inner Ring Cables (IRCs), Upper Radial Cables (URCs), and Lower Radial Cables (LRCs). LRCs and URCs are connected by suspension cables and polyvinyl chloride (PVC) film. The main cable system of the roof structure is constituted of the URCs, LRCs, and IRCs, which are pre-stressed high-strength steel strands. The UPR, LPR, and web members are concrete-filled steel tube structures, and the UPR and LPR are connected by V-shaped web members to form a hole to withstand the tension from the cable system. The entire roof is connected with the foundation of the structure by prestressed RC columns. Among the stadiums in China, this project has the largest spoke-wise cable membranes roof structure with the construction area of 1 m2.
2.2. Wind Tunnel Test of Foshan Century Lotus Sports Center (FCLSC)
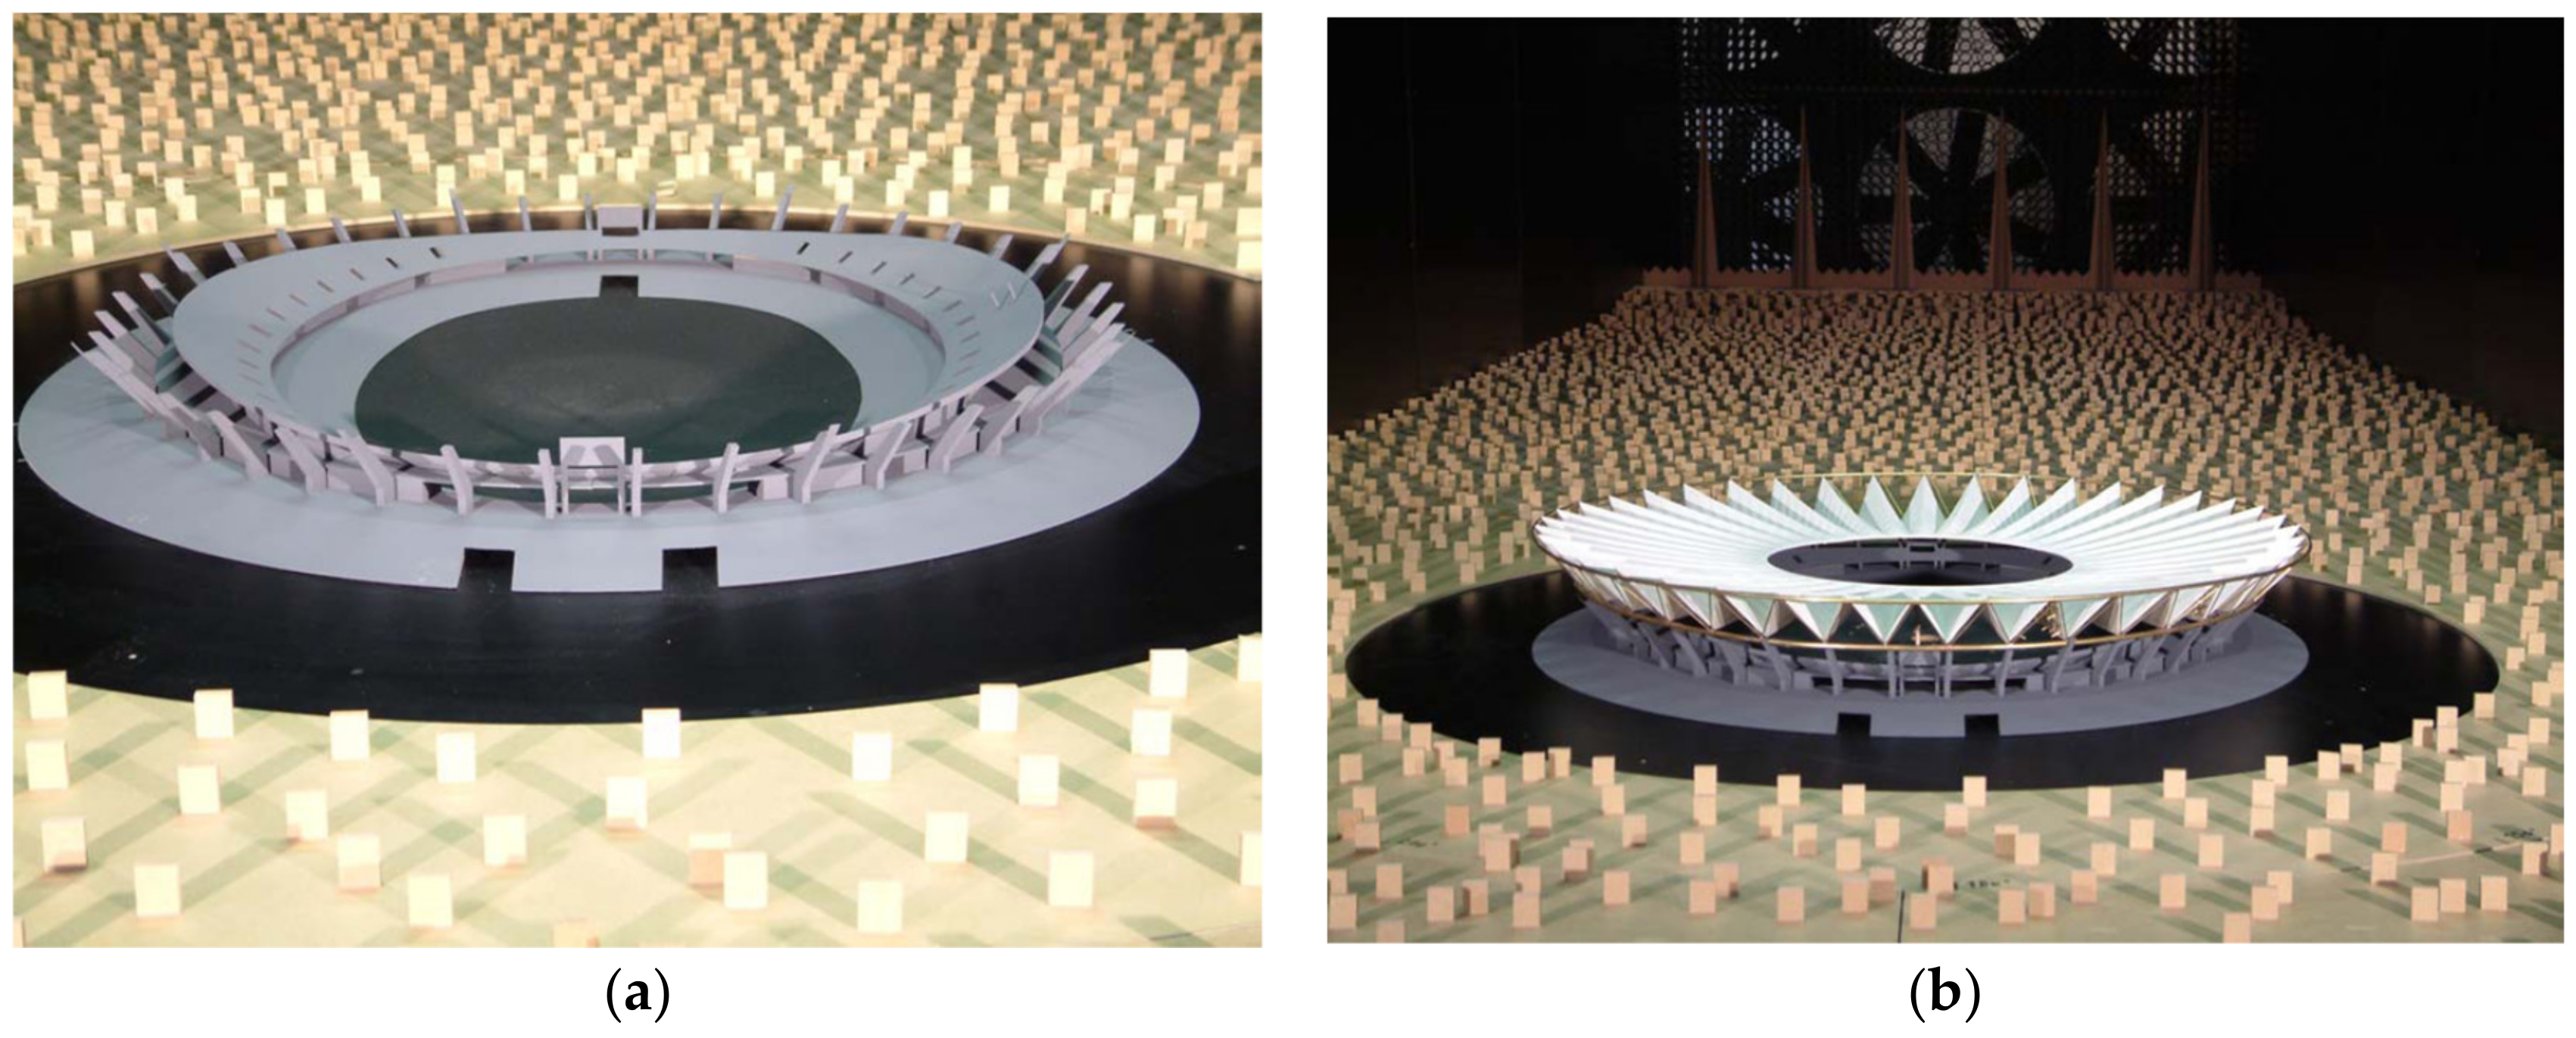
The small-scale test of FCLSC was carried out in a wind tunnel of Wacker Ingenieure in Germany. Due to the vast complex of the full aeroelastic model, this structure adopts a rigid model with scale 1: 320, as shown in Figure 2. With this scale, the blockage ratio is only 3%, and no corrections are needed. The atmospheric wind profile is modeled with the power-law, as shown in Equation (1), and it is using the coefficient alpha = 0.20 [16].
where
- a certain height above the ground.
- the standard reference height.
- the mean wind speed at height z.
- the mean wind speed at the standard reference height.
Besides the average velocity section, the effect of pulsating wind must also be considered. The turbulence intensity model Tv is defined by height as the standard deviation of wind velocity fluctuation σu(z) relative to average velocity V(z). Figure 3 shows the mean wind speed and the turbulent intensity profile measured by the Prandtl tube and hot wire anemometer.
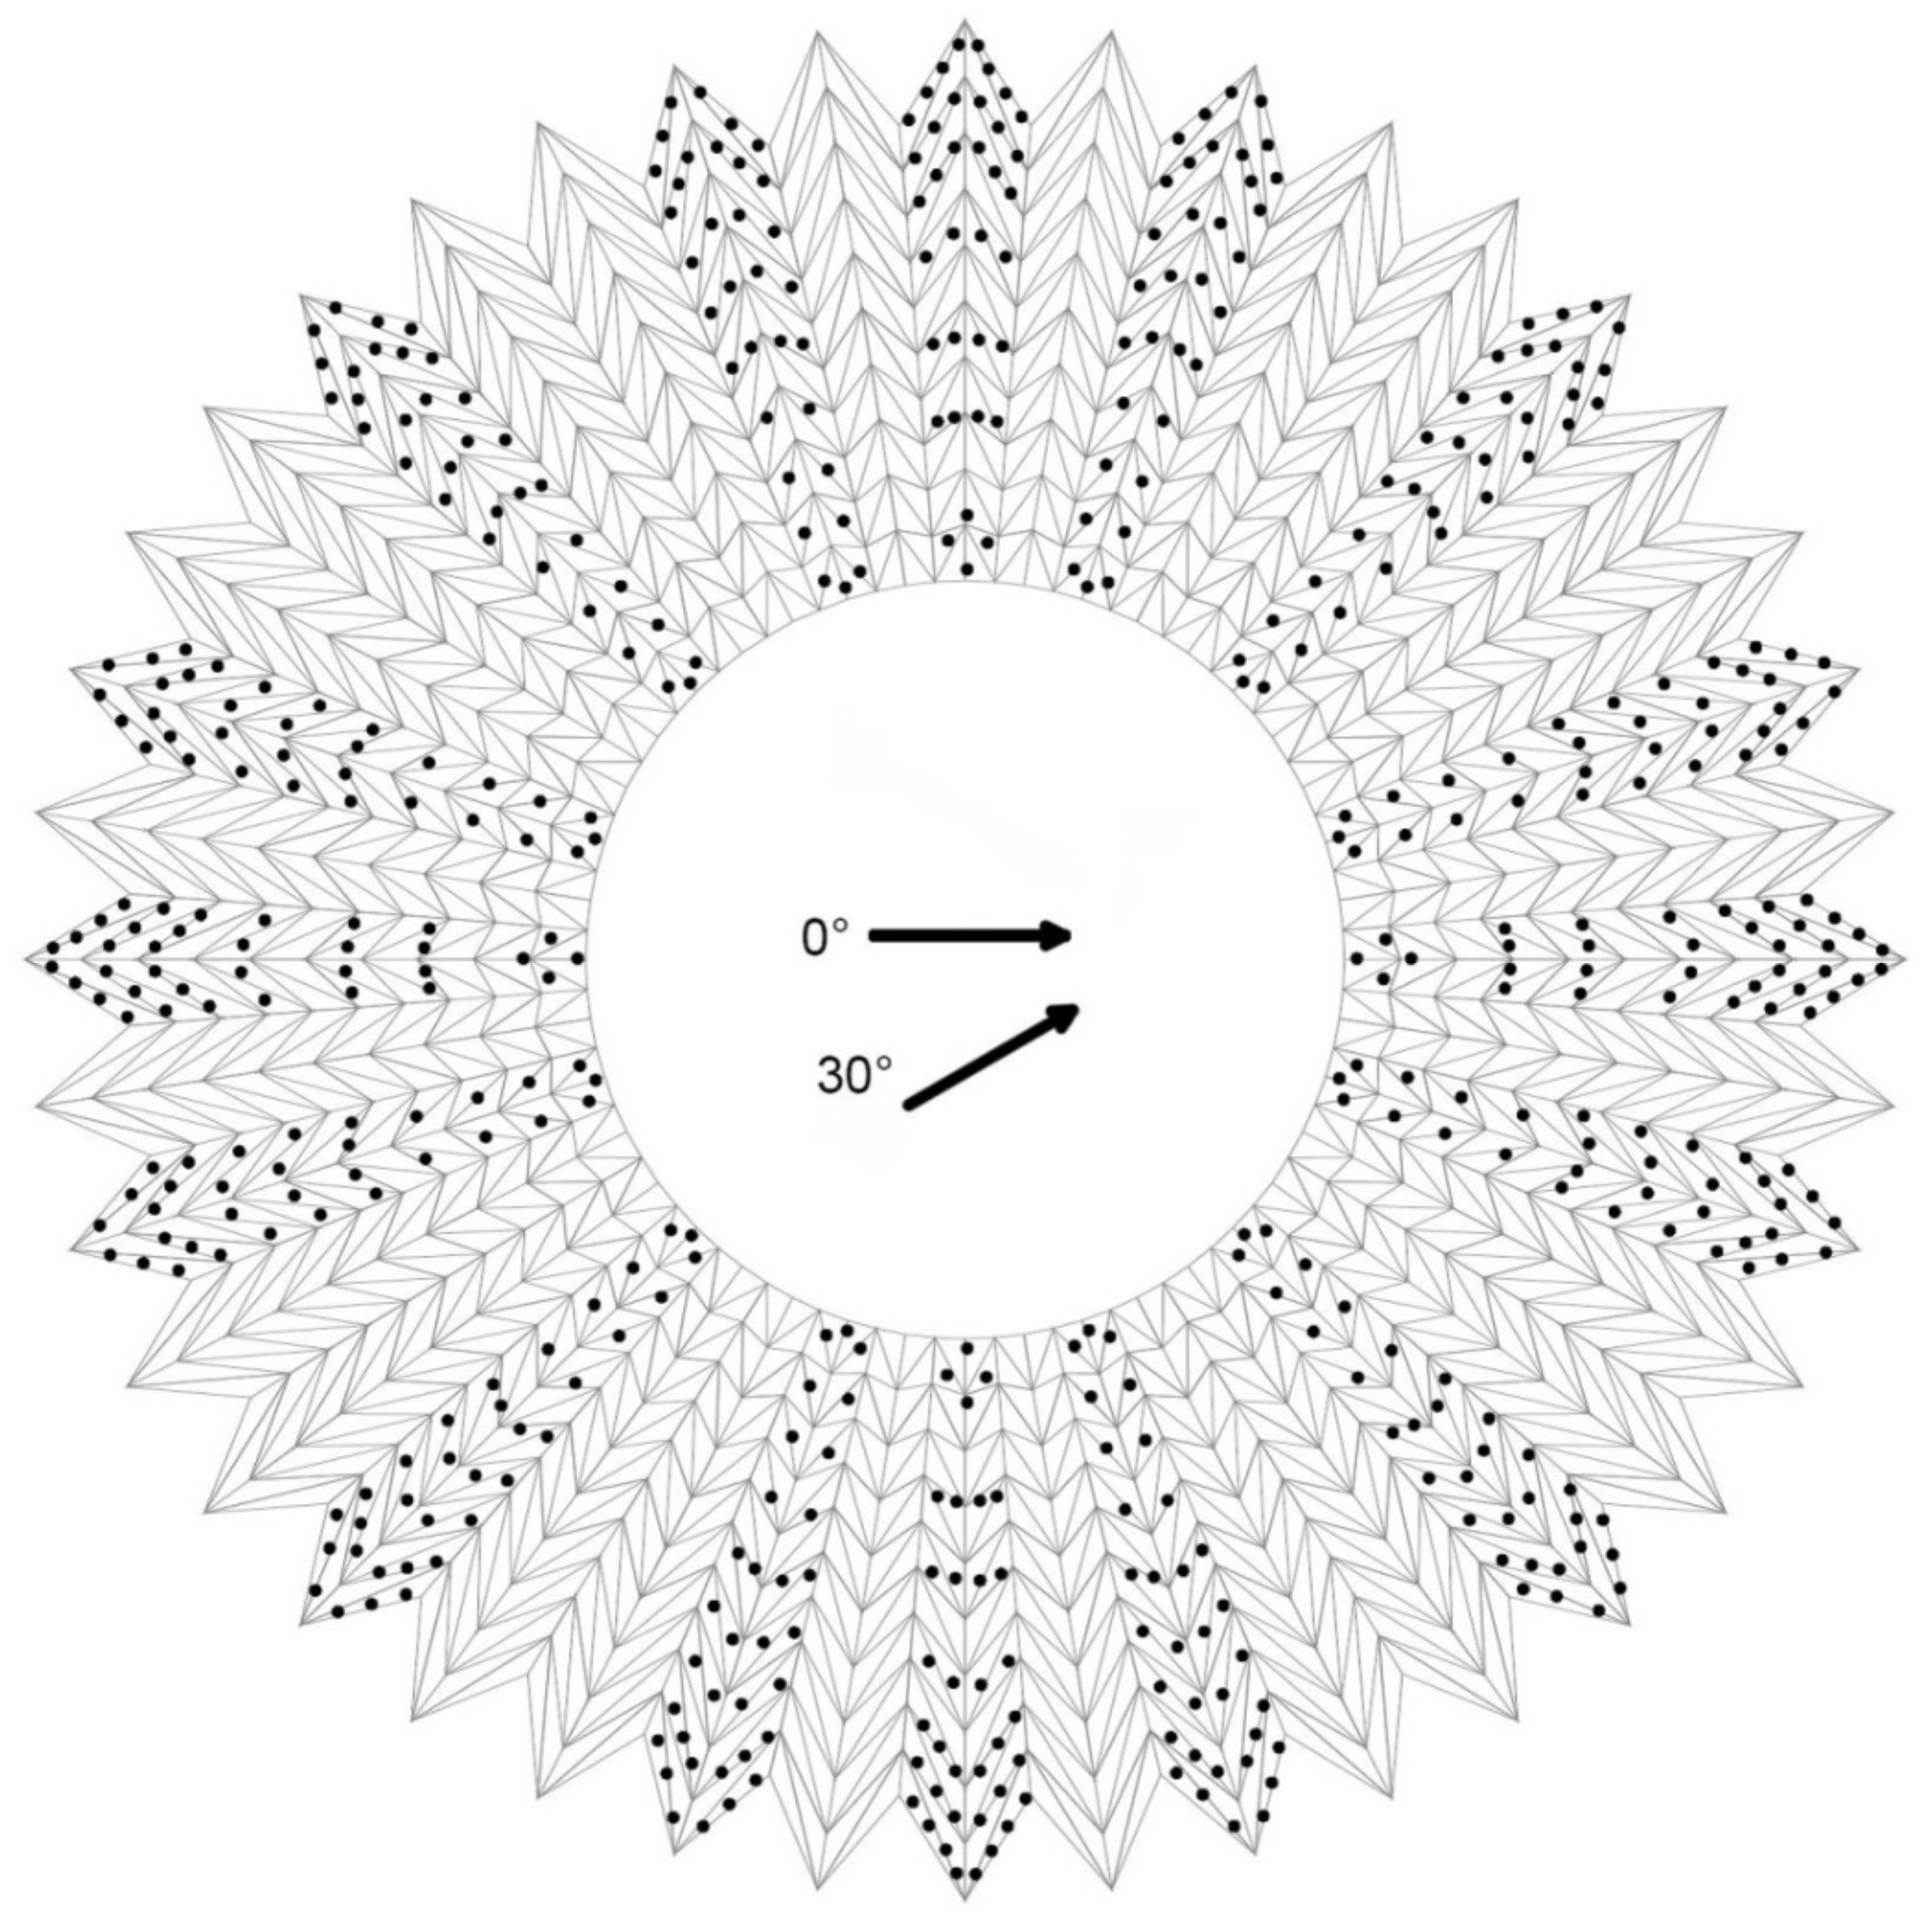
A total number of 900 pressure holes were placed on the roof (upper and lower parts of the pavilion) and the grand-stands, as shown in Figure 4. The advantage of the symmetry of the structure is fully used to measure the wind pressures. The positions of the pressure holes at the bottom of the model are identical with that of the pavilion roof. The wind incidence angle four cases of 0°, 330°, 300°, and 270° are measured respectively. The pressure test is carried out with a high-resolution pressure differential meter, which is connected through a hosepipe to the pressure test holes located on the roof of the pavilion.
According to the load code [17], the ground roughness of the area where the structure is located in class B. According to the measured data of local natural wind [18], average wind speed from the ground up to 10 m V0 = 30.98 m/s2, and basic wind pressure of 0.6 kN/m2. According to the standard [17], the average wind pressure coefficient, and the root mean square wind pressure coefficient is calculated from the measured wind pressure time series, as shown below:
where
- Cpijk the k th wind pressure coefficient transient value of the jth sample at ith pressure point on the model;
- Pijk the kth wind pressure transient value of the j sample at ith pressure point on the model;
- P∞ the static pressure value of the reference point; ρ is the air density;
- V∞ the reference point wind speed. According to the wind tunnel experiment report [16], the average wind velocity of the upper part of the model is about 7 m/s at the height of approximately 14.6 m in the wind tunnel (equivalent to 47 m in the natural state).
The average wind pressure coefficient of the K sample can be obtained by calculating the average wind pressure coefficient of N sampling points of each sample.
Finally, the average wind pressure coefficient of the ith measured point is obtained by the mean value of the total sample number M. The mean wind pressure coefficient at the ith measuring point can be obtained from the arithmetic mean value of the total samples number (M) as follows:
The calculation of the root means square wind pressure coefficient at the point i is as follows:
Therefore, the mean wind pressure coefficient of the double-face wind can be acquired simply as below:
The calculation of the double-face mean square root wind pressure coefficient is as follows:
The relation between wind pressure on unit area W(t) and pressure coefficient Cp(t) and wind pressure q(t) is as follows:
Therefore, the structural single-face wind pressure and the double-face wind pressure calculation formulas are as follows:
where
- u the peak factor;
- q the wind pressure.
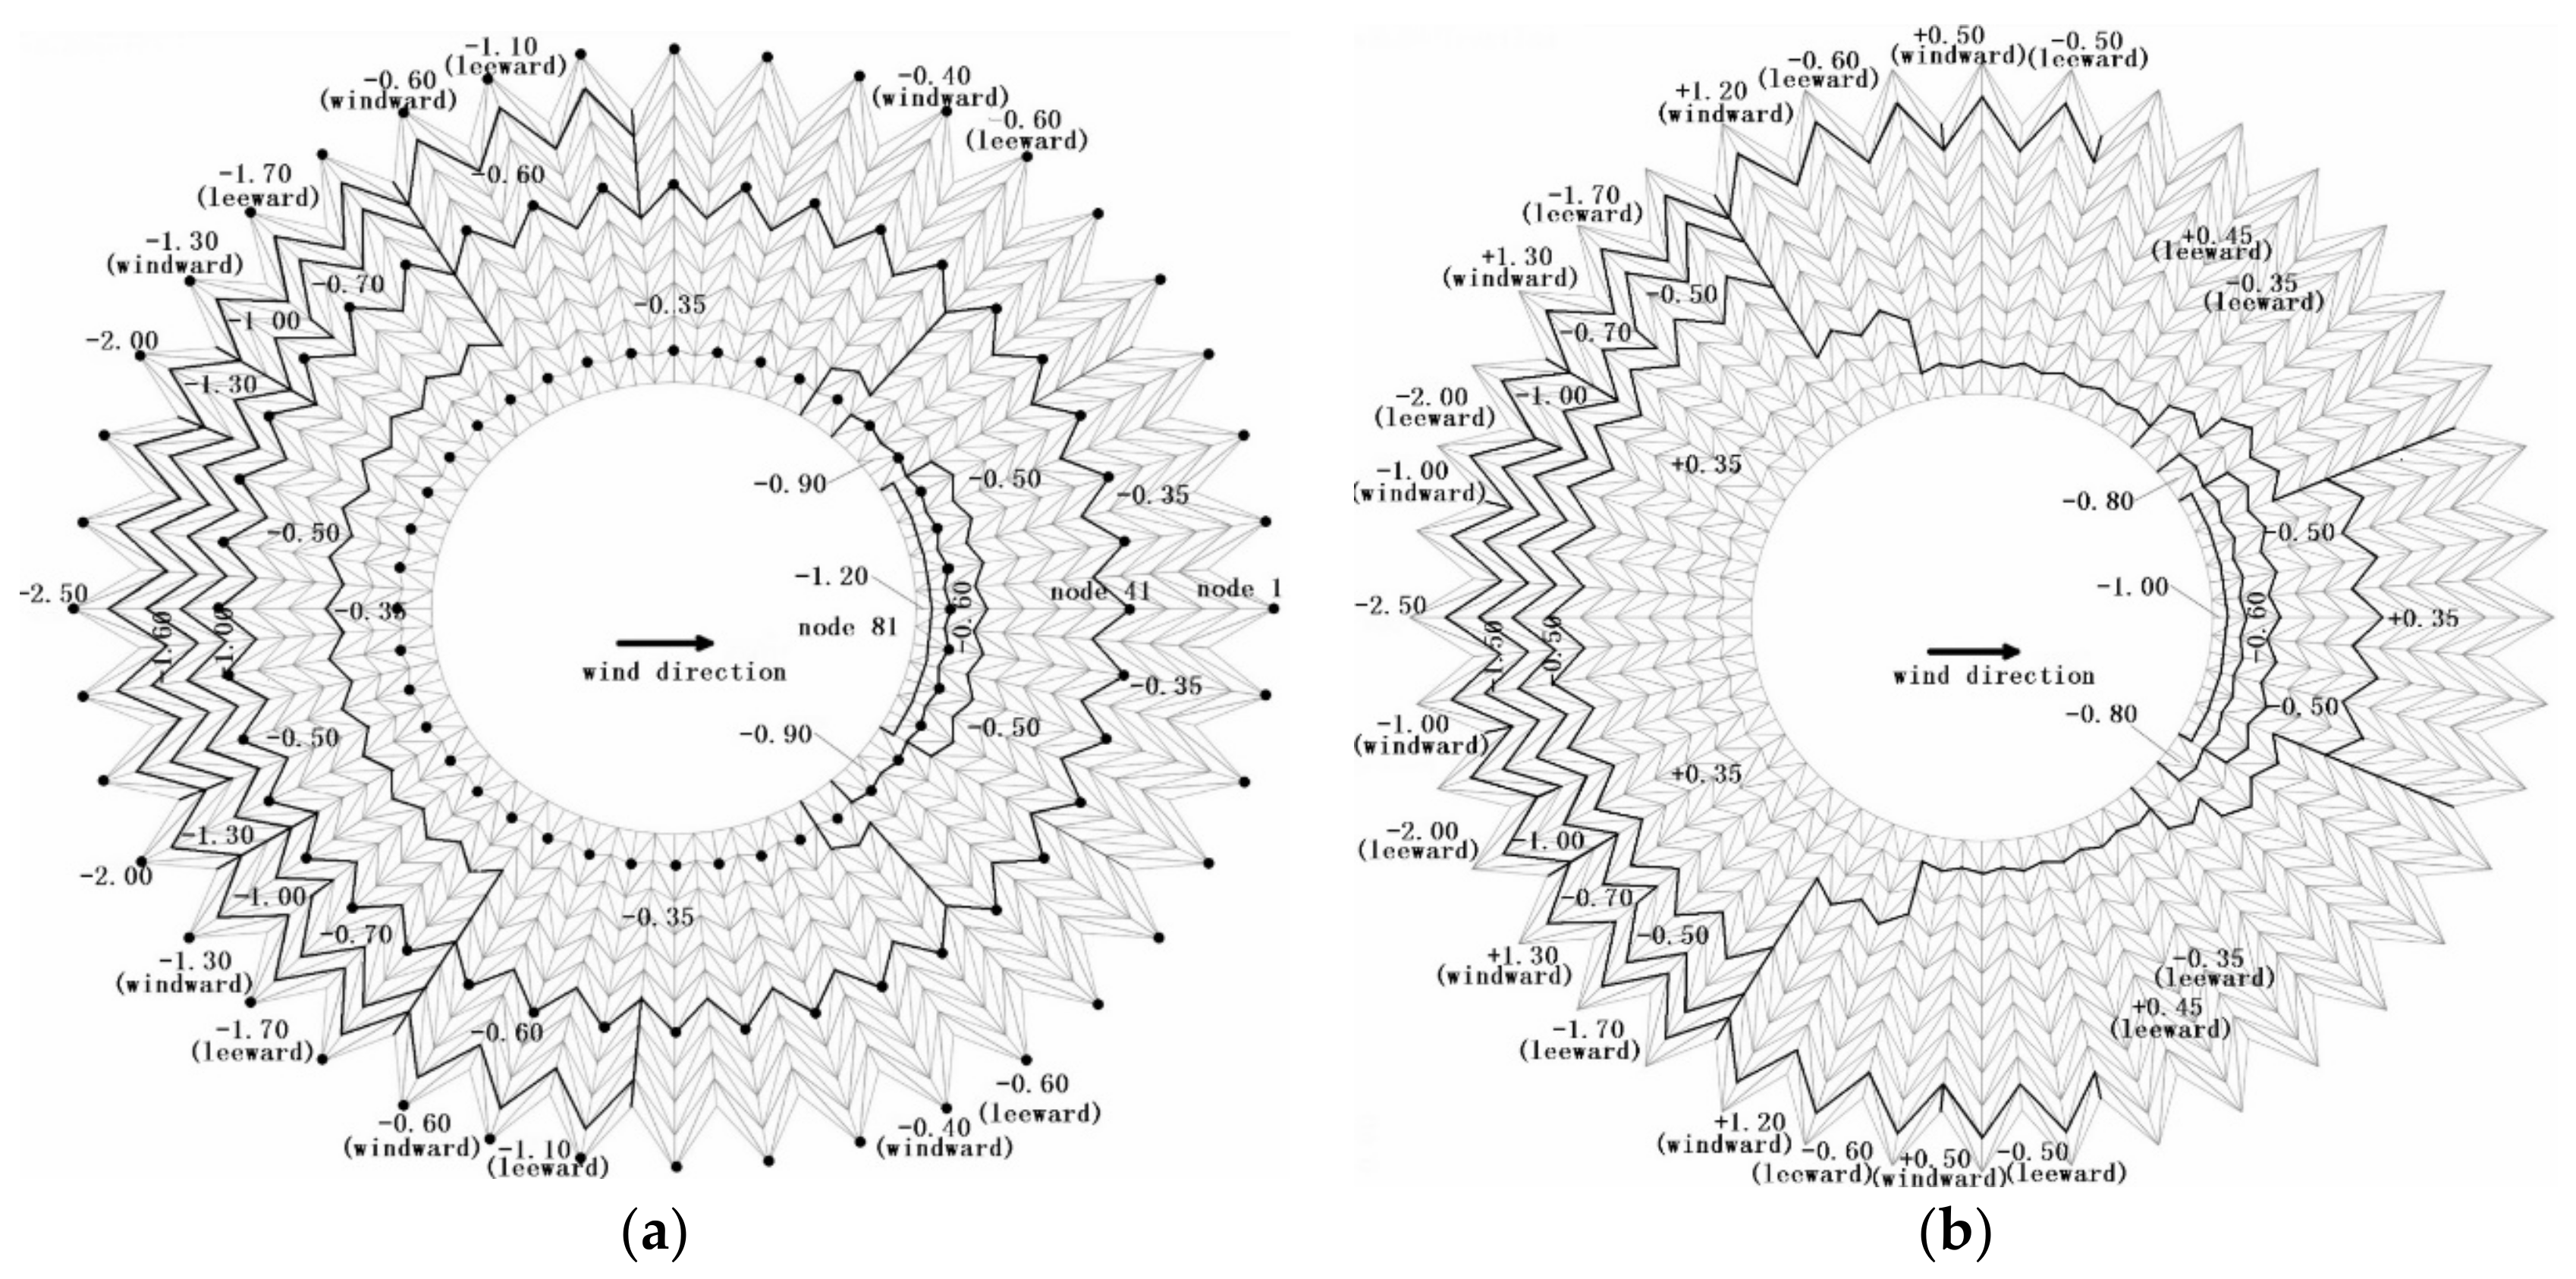
With the responses acquired in the wind tunnel test and usage of the equations mentioned above, one can obtain the distribution of the wind pressures. Figure 5 shows the distribution of wind pressure under the effect of the wind with the incidence angle 0° [16]. For the symmetric wind condition observed from these figures, it can be found only the wind suction is observed from the top of the structure. For the asymmetric wind condition, the wind suction and wind pressure are both observed from the top of the structure. The symbols “−” and “+” refer to wind suction and wind pressure, respectively.
The wind pressure spectrum is calculated based on the measured wind pressure-time history to reflect the fluctuation of wind pressure and the distribution of associated energy at different frequencies. The spectral density of the excitation force can be calculated based on the observation from the following items, such as the wind tunnel test results, the pressure, the bearing surface, and the node displacement, which is used as large size and inductive quantity. Meanwhile, the initial data of natural frequency and damping are taken into account in the model scale (the geometric ratio is 1:320, the time scale is 1:56). The wind vibration coefficient of the quasi-static total suction load is 1.4, while that of the quasi-static asymmetrical full load is 1.1.
2.3. Fluctuating Wind Load
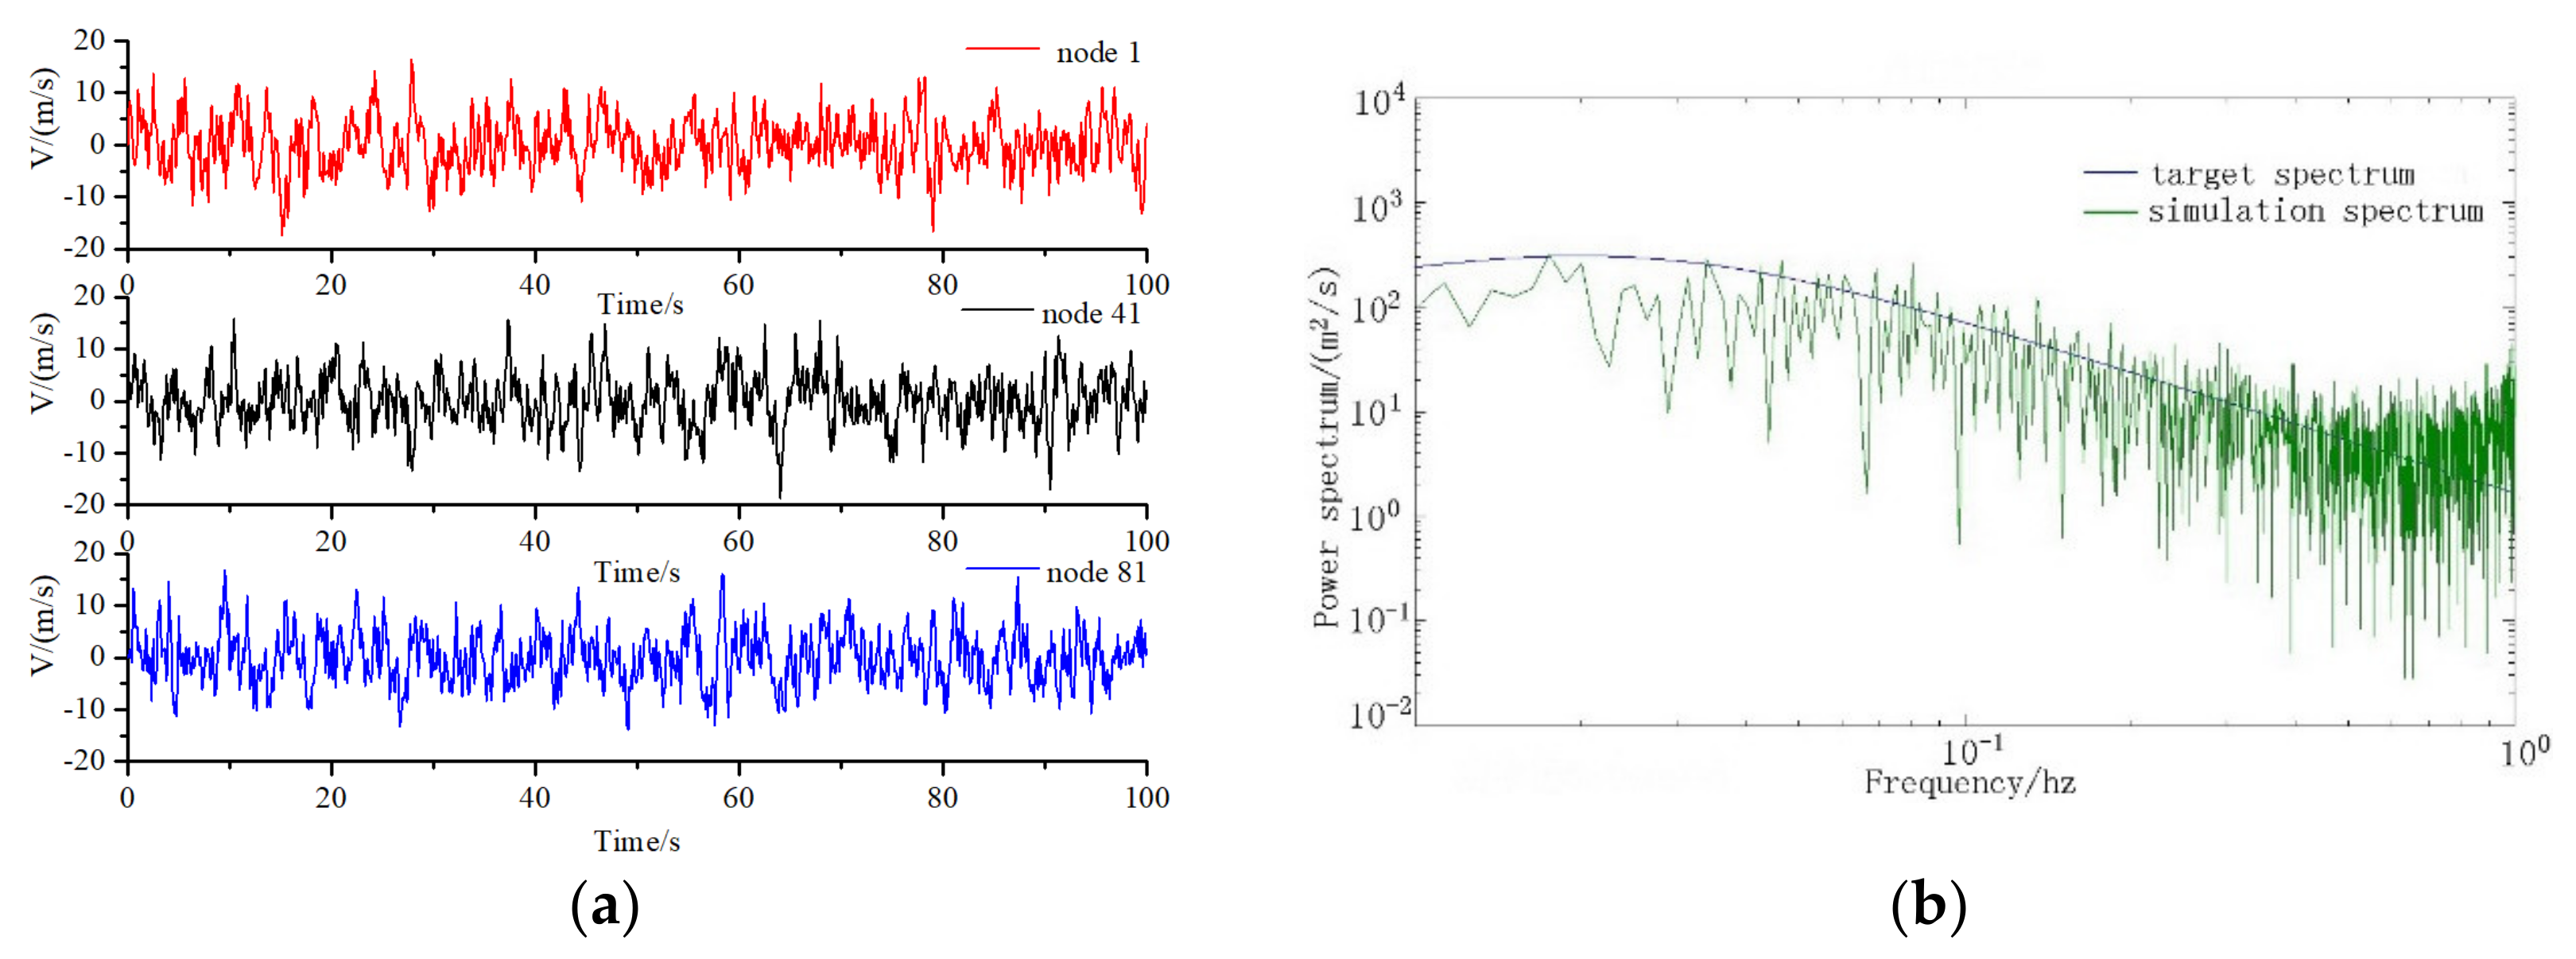
When carrying out the wind load simulation, the along-wind velocity spectrum adopts the Davenport spectrum. For both horizontal and vertical winds, the Panofsky velocity spectrum is used. The three-dimensional Davenport coherence function is used to describe the spatial correlation of fluctuating wind [11,19]. In particular, the roughness coefficient k = 0.005, the time interval Δt = 0.1 s, and the cut-off frequency = 1 Hz are used for calculation. The pulsating wind speed time history curve of 120 nodes is simulated in the MATLAB programming environment to carry out the appropriate simulation analysis as described, e.g., [20]. These nodes are represented by the black spot in Figure 5a and are numbered counterclockwise from inside to outside.
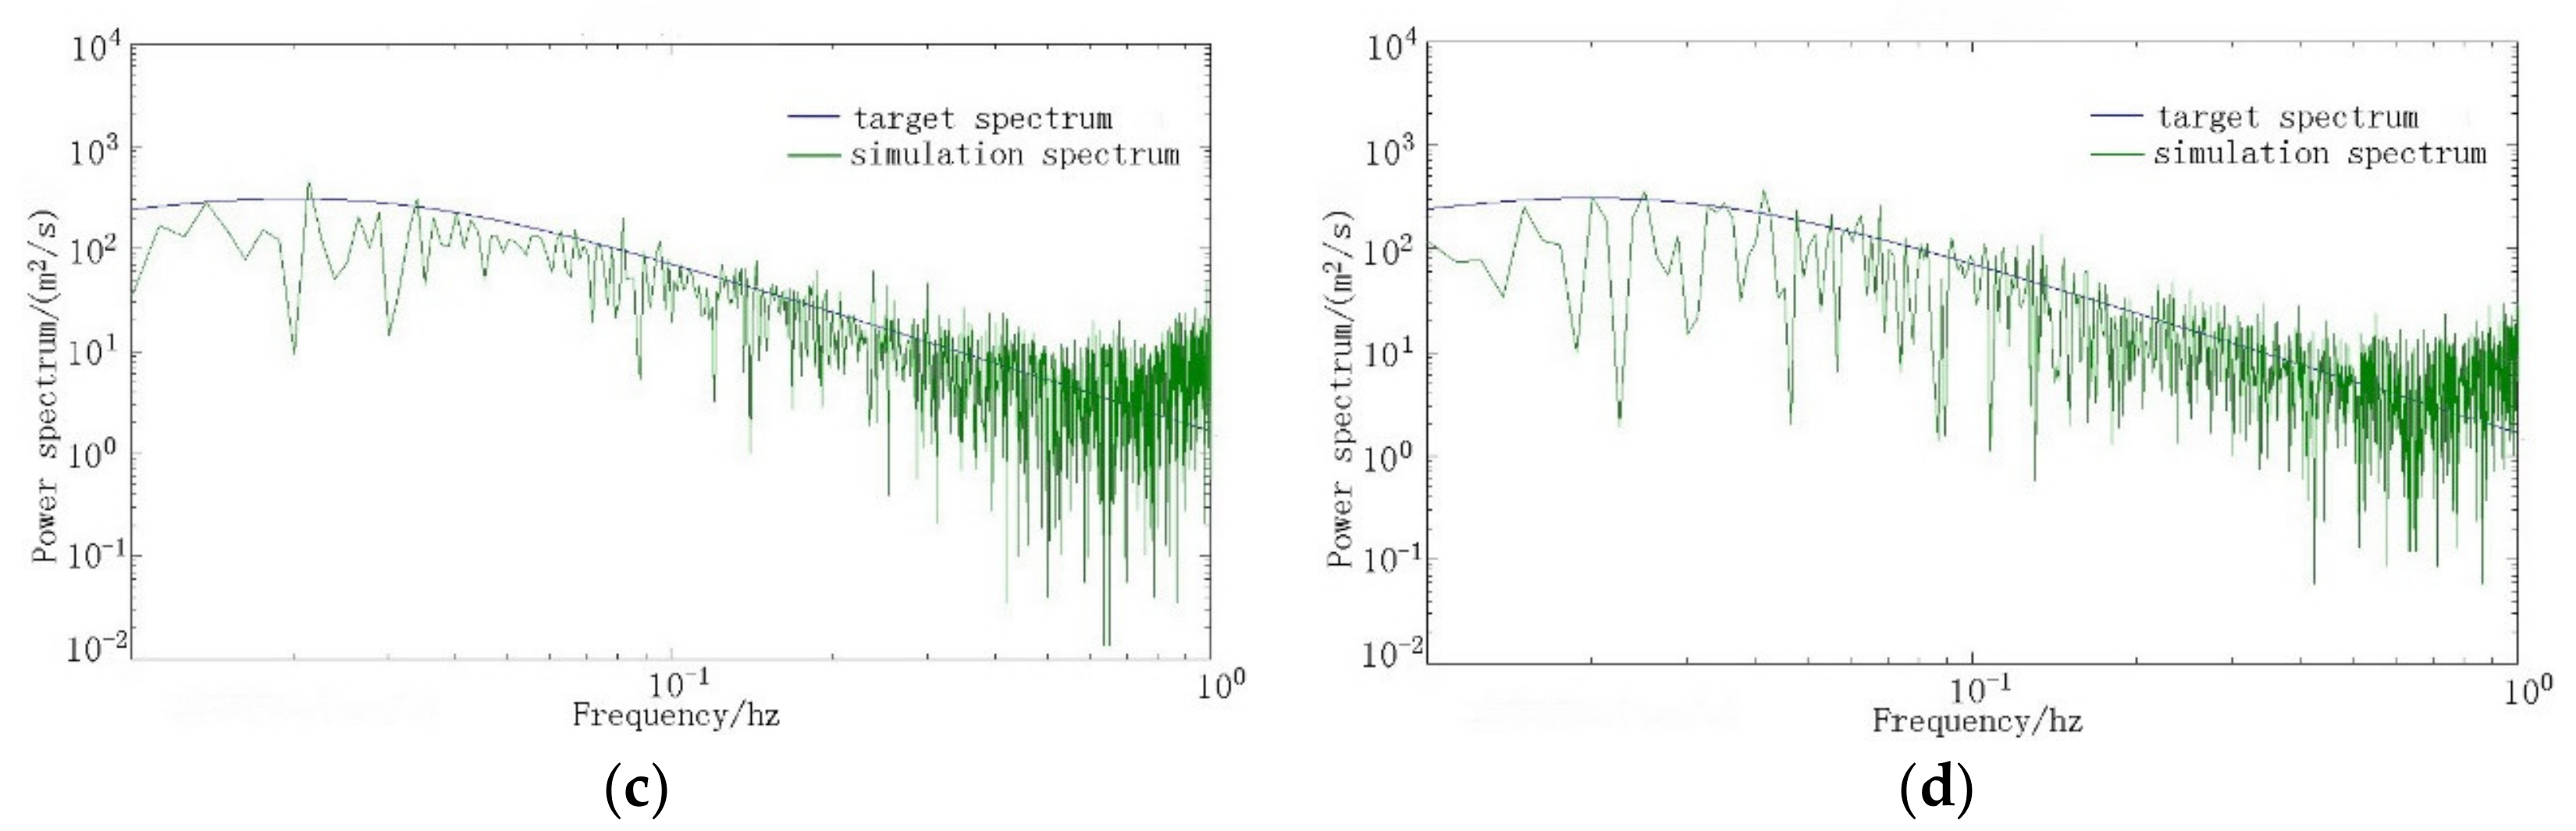
The fluctuating wind speed time histories of the along-wind of 1, 41, and 81 nodes, including a comparison of their simulation power spectrum with the target spectrum, are shown in Figure 6. The comparison indicates that the three spectra at nodes 1, 41, and 81 are almost identical to the target spectrum. The time history of wind speed obtained by the method described above can be used in the mechanical analysis of structures under wind load. The wind pressure of wind speed on the unit area can be calculated by Equation (11):
and the wind load can be calculated by the following formula:
where
- the air mass density (1.23 kg/m3);
- the affected area;
- the time history of wind speed, which is equal to the sum of the average wind speed and fluctuating wind speed;
- the coefficient of wind pressure distribution. By the Equations (11) and (12), the wind load time history of 120 nodes shown in Figure 5a can be calculated.
2.4. Analysis of Wind Vibration for Uniform Distribution
The finite element (FE) model of FCLSC shown in Figure 7 is created in ANSYS. The cable system adopts “link10 bar” elements, whereas UPR, LPR, web members, and pier columns are created by the element “beam44”. It assumes that the connection between the cable and the pressing ring is the hinge joints, as well as the same connection between the connecting cable segments. By contrast, the connection between the pier column and the pressure ring is rigid as well as the connection between the web member and the pressing ring.
The Newmark method was utilized to solve the geometric nonlinearity and prestress effect in FE simulation. The Rayleigh hypothesis modeled the damping according to the following expression:
where
- the lumped mass matrix;
- the Rayleigh damping matrix;
- the stiffness matrix;
α and the proportionality coefficients calculated by the first- and second-order circular frequencies at 0.0629 and 0.0036, respectively.
The roof is a composite structure of steel and cable structures. The damping ratio for the cables was selected as ζ = 0.01, while the damping ratio of steel structures is ζ = 0.02. In total, the damping of the roof structure can be expressed as ζ = 0.015 [21].
When the cable force has a uniform distribution without relaxation, the coefficient of wind pressure distribution (as shown in Figure 5) should be obtained from the wind tunnel test. Wind speed time history should be simulated through the Davenport along-wind velocity spectrum. The Panofsky wind speed spectrum should be used for the simulation of horizontal and vertical winds. Then, the time history of wind load with 120 nodes can be generated by Equations (11) and (12).
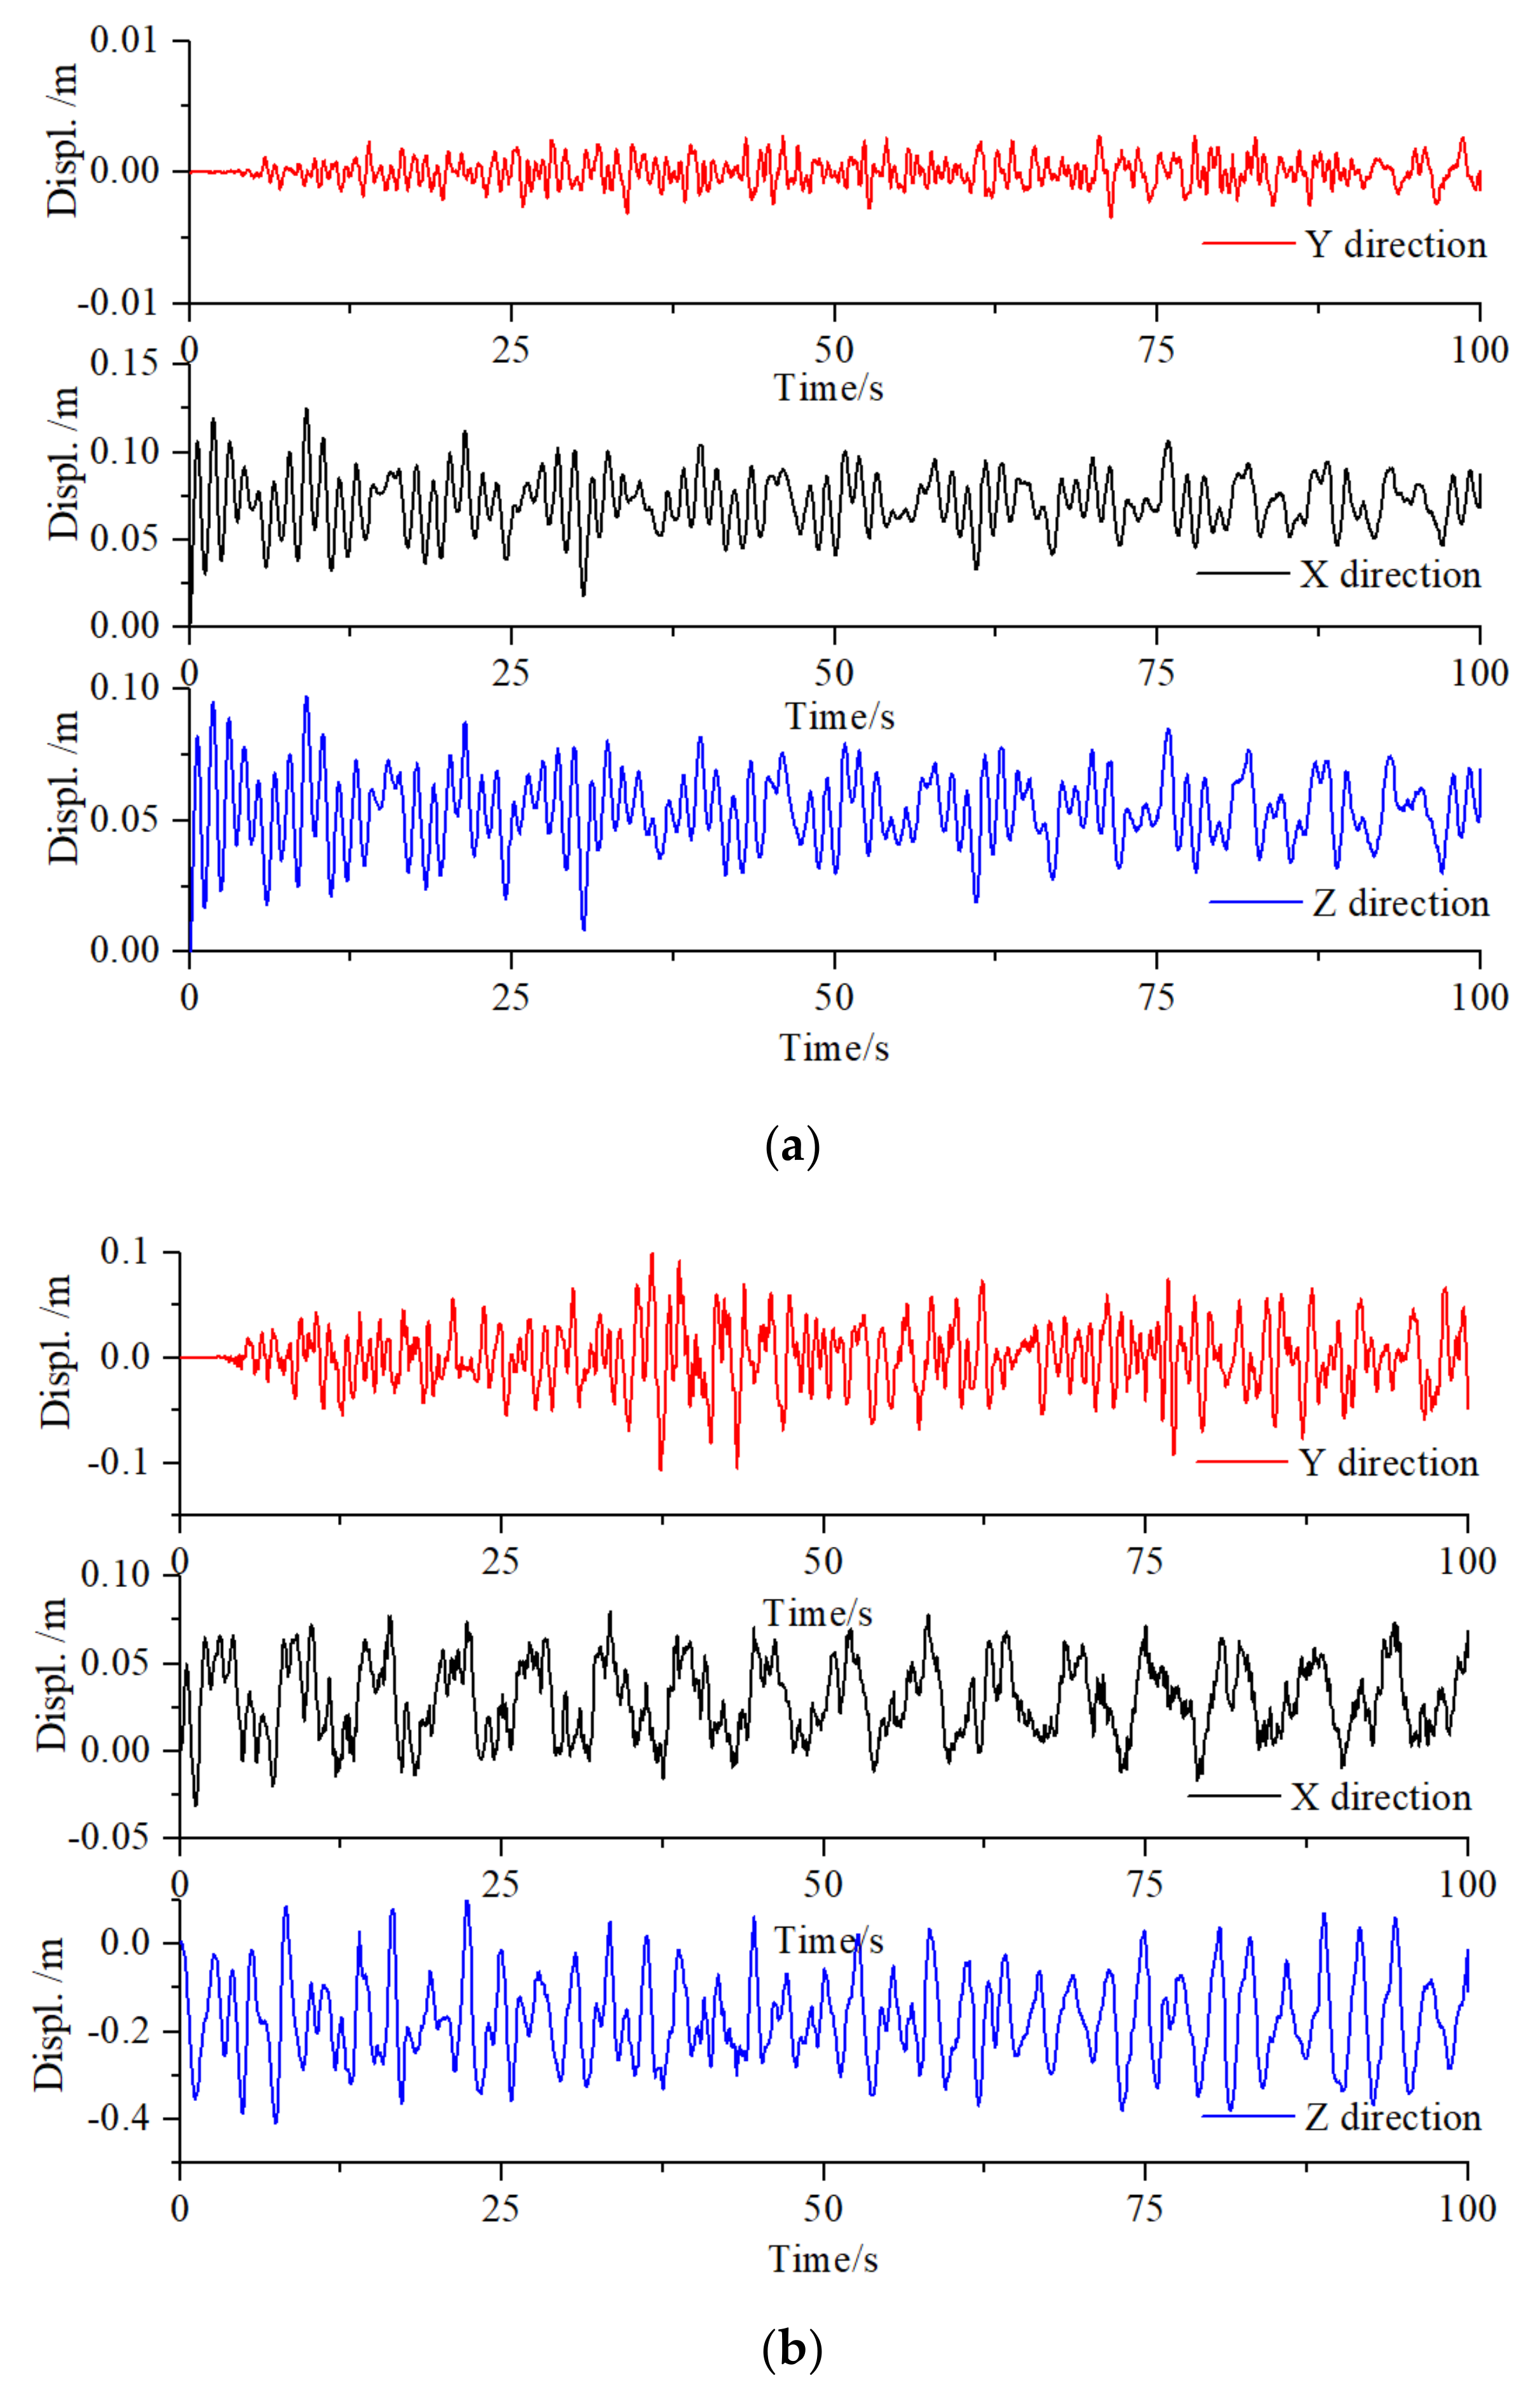
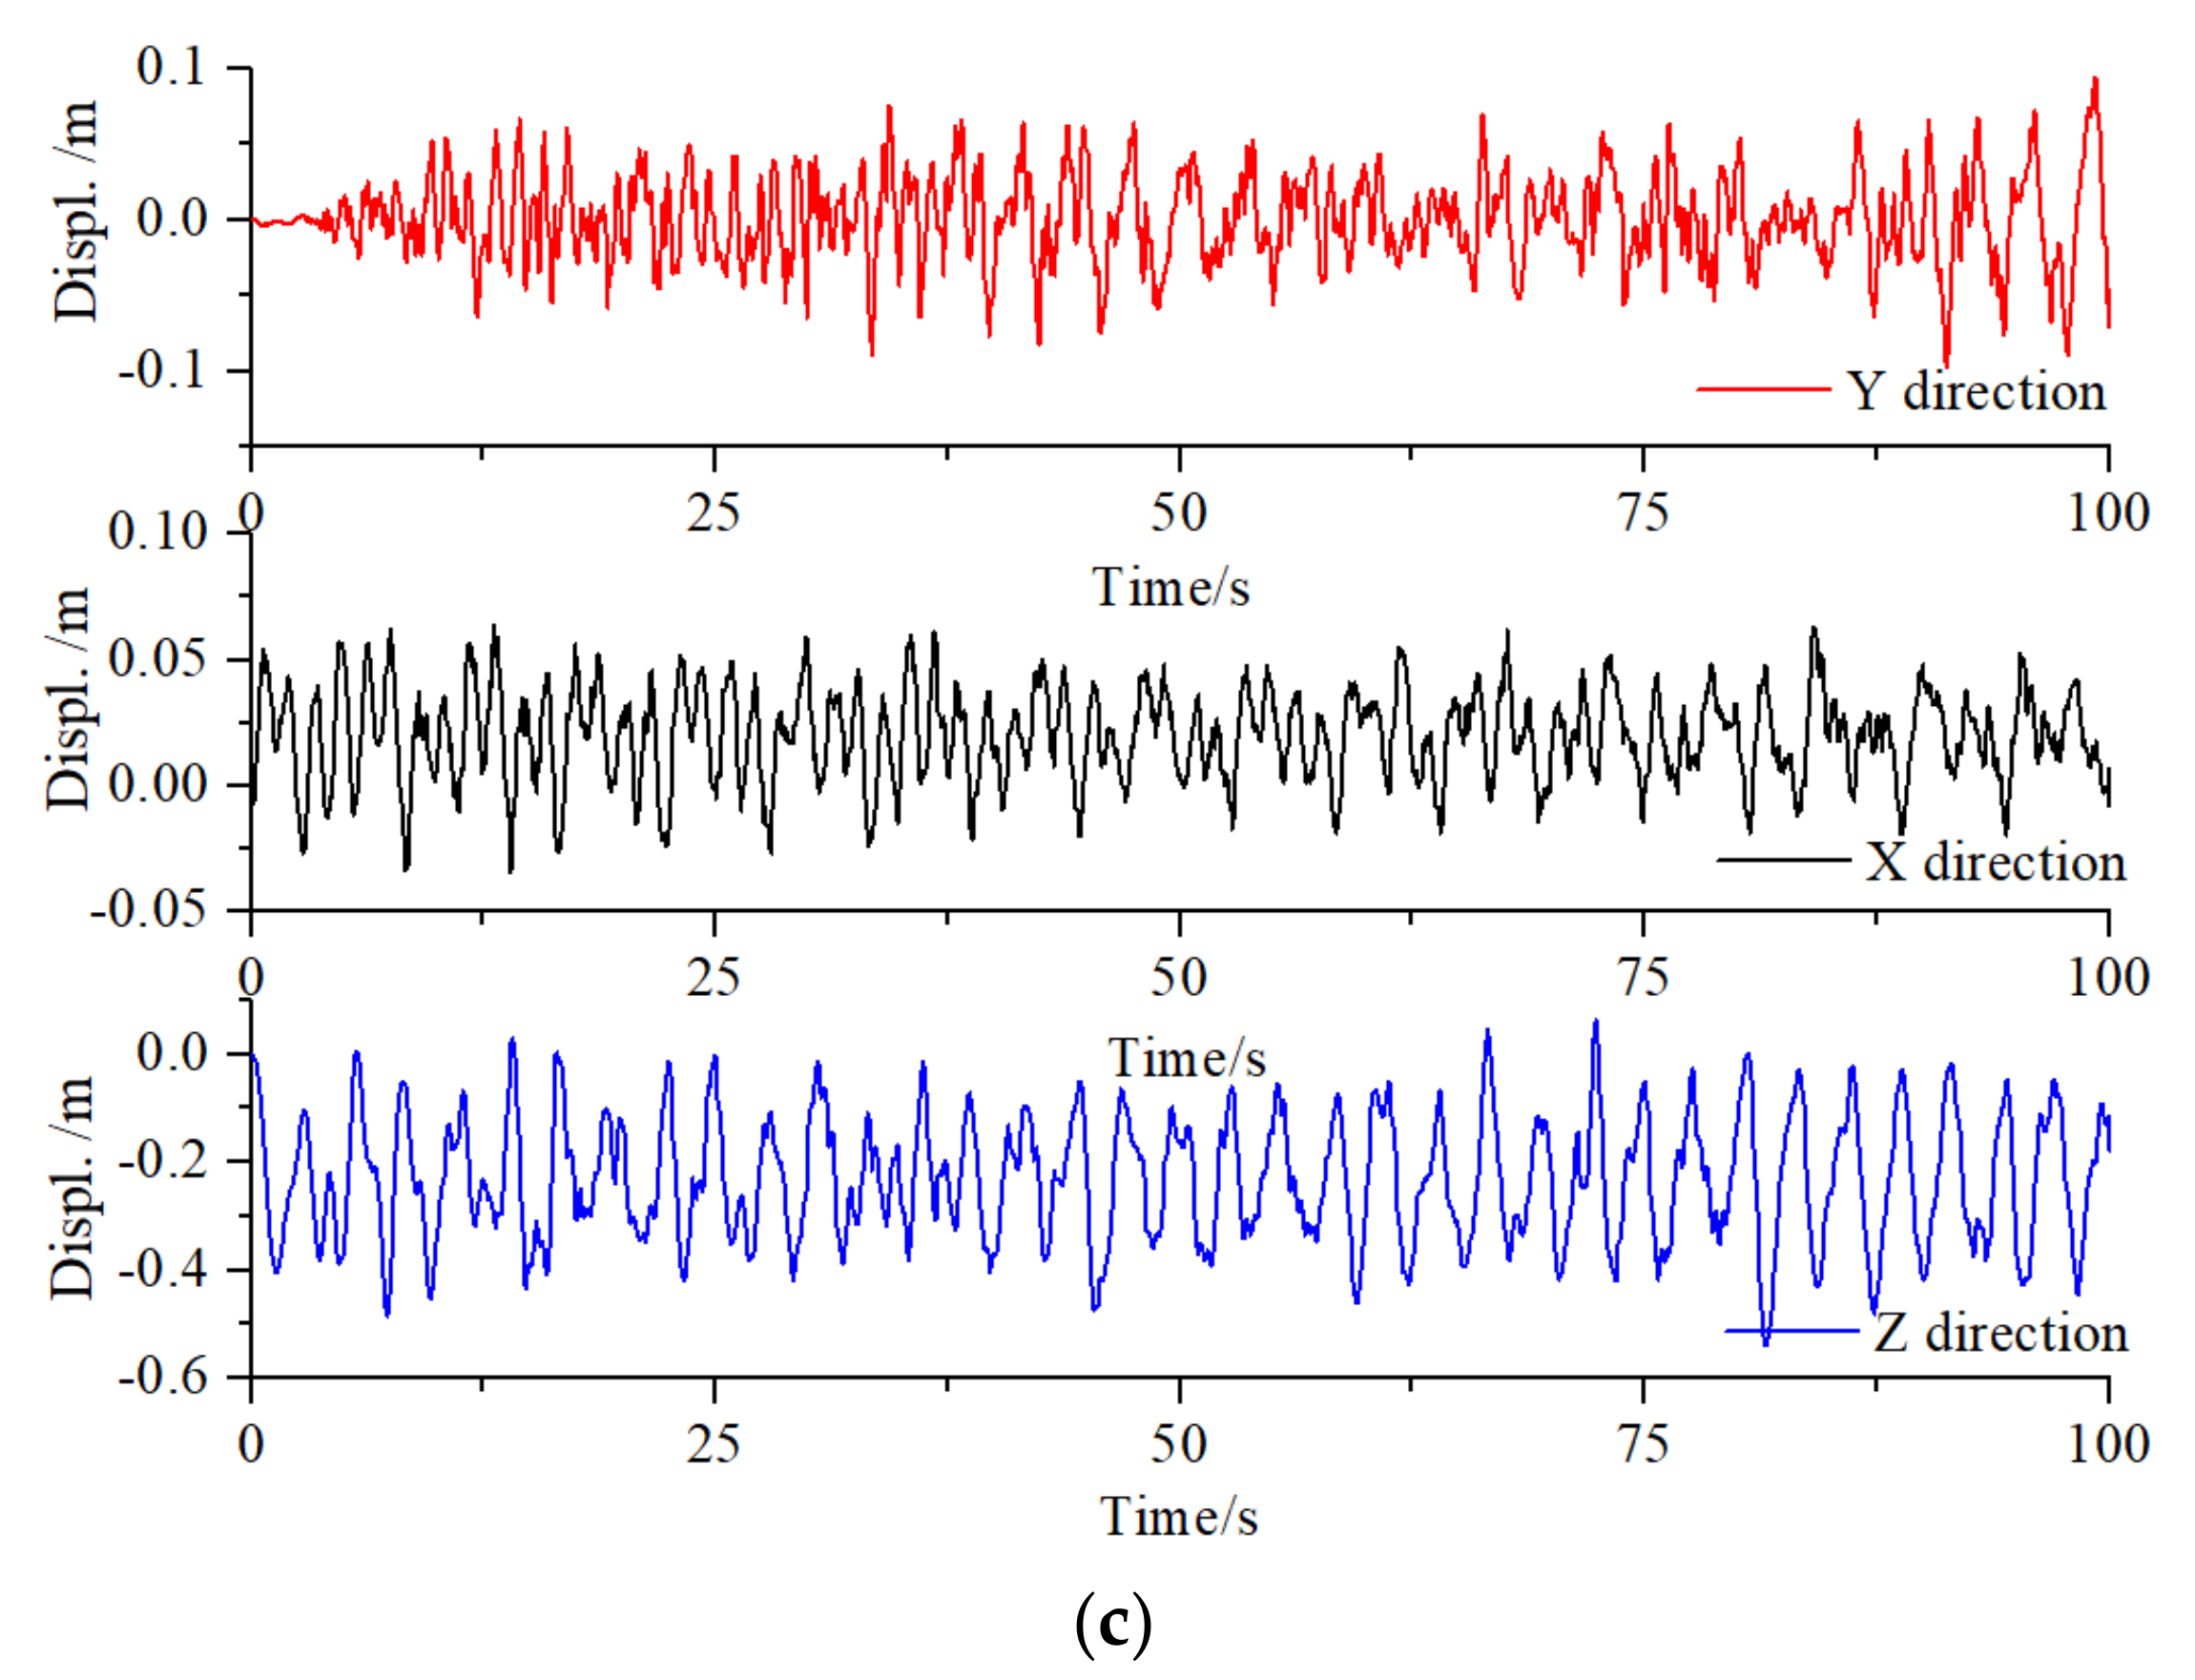
Under the effect of symmetric wind, the dynamic performance of the structure was analyzed. Three representative displacement time history curves of the nodes of UPR20, URC21, and LRC20 were selected, as shown from Figure 8a–c. The displacement time histories show that the vertical vibration of the structure is larger than the horizontal vibration. The vibration of the cable system is larger than the vibration of the rigid bar, such as UPR, LPR, and web members. Remark: the response time history of the structure under asymmetric wind is similar to that under the symmetric wind. Thus, these values are not presented. Asymmetric wind load refers to the wind direction observed on the top of the Foshan Century Lotus Sports Center (FCLSC). There is both wind suction and wind pressure, which is the unbalanced wind load.
The maximum response was obtained from the statistics of the response time history of each bar under wind load. The coefficient of dynamic magnification (as shown in Table 1) was acquired by Equation (14).
where
- the coefficient of dynamic magnification for the i-th member, ;
- the average value of the time history of dynamic response for his member, including the internal force and displacement of the components;
- the maximum displacement that corresponds to βi;
- the root-mean-square of the dynamic response time history of the structure;
- the peak factor when u = 2.2 with an assurance rate of 98.61%.
The values of the internal force magnification coefficient and the displacement magnification coefficient under the effect of symmetric wind are 1.46 and 1.60, respectively. The values of the internal force magnification coefficient and the displacement magnification coefficient for the asymmetric wind are 1.51 and 1.59, respectively. Table 1 shows the dynamic amplification coefficients of various kinds of bars. The vibration amplitude of the cable system is higher than that of the pressure ring. The coefficient of wind vibration obtained during the wind tunnel test [16] is 1.4; this value is lower than the result of numerical analysis for geometric nonlinearity. The nonlinear geometric characteristics of such a flexible membrane structure should be considered. The result is consistent with the previous researches [22,23]; this finding indicates that the results in the present study are reliable, and the structural model, as well as the wind load time history, can be used for analysis.
2.5. Wind Vibration Analysis of the Relaxed Cable Force
When the cable force is not relaxed, the dynamic response of the structure is consistent for both the symmetric and asymmetric winds. Thus, the wind vibration analysis of the structure considers only the effect of symmetric wind when the cable force was relaxed. Five relaxation modes were analyzed to analyze the influence of different cable stress relaxations on the structure: single URC relaxation (SUR), single LRC relaxation (SLR), two adjacent URCs relaxations (TAUR), two adjacent LRCs relaxation (TALR), and two adjacent cables (URC and LRC) relaxation (TACR). A different relaxation degree of TACR was used to analyze the effect of different relaxation degree on the structure. Relaxing URC Nos. 1 to 21 are to emphasize the effect of the wind incidence angle. The responses of typical bars, such as UPR, URC, and IRC, were used to analyze the influence of wind vibration on the damaged structures in this study. Previous studies [24,25,26] show that the difference in the amplification coefficient of internal force at each node in the large-span roof is high. However, the dynamic displacement coefficient undergoes insignificant changes and has a stable value. Therefore, the present study considers mainly the displacement amplification coefficient (DAC) in the dynamic effect of wind load.
3. Structure Response
3.1. Structure Response at Different Kinds of Cable Relaxations
To analyze the wind-induced vibration with varying relaxations of cable, the stress relaxation was set to 3% of the initial prestress applied in the finite element simulation and used five conditions, which are SUR, SLR, TAUR, TALR, and TACR.
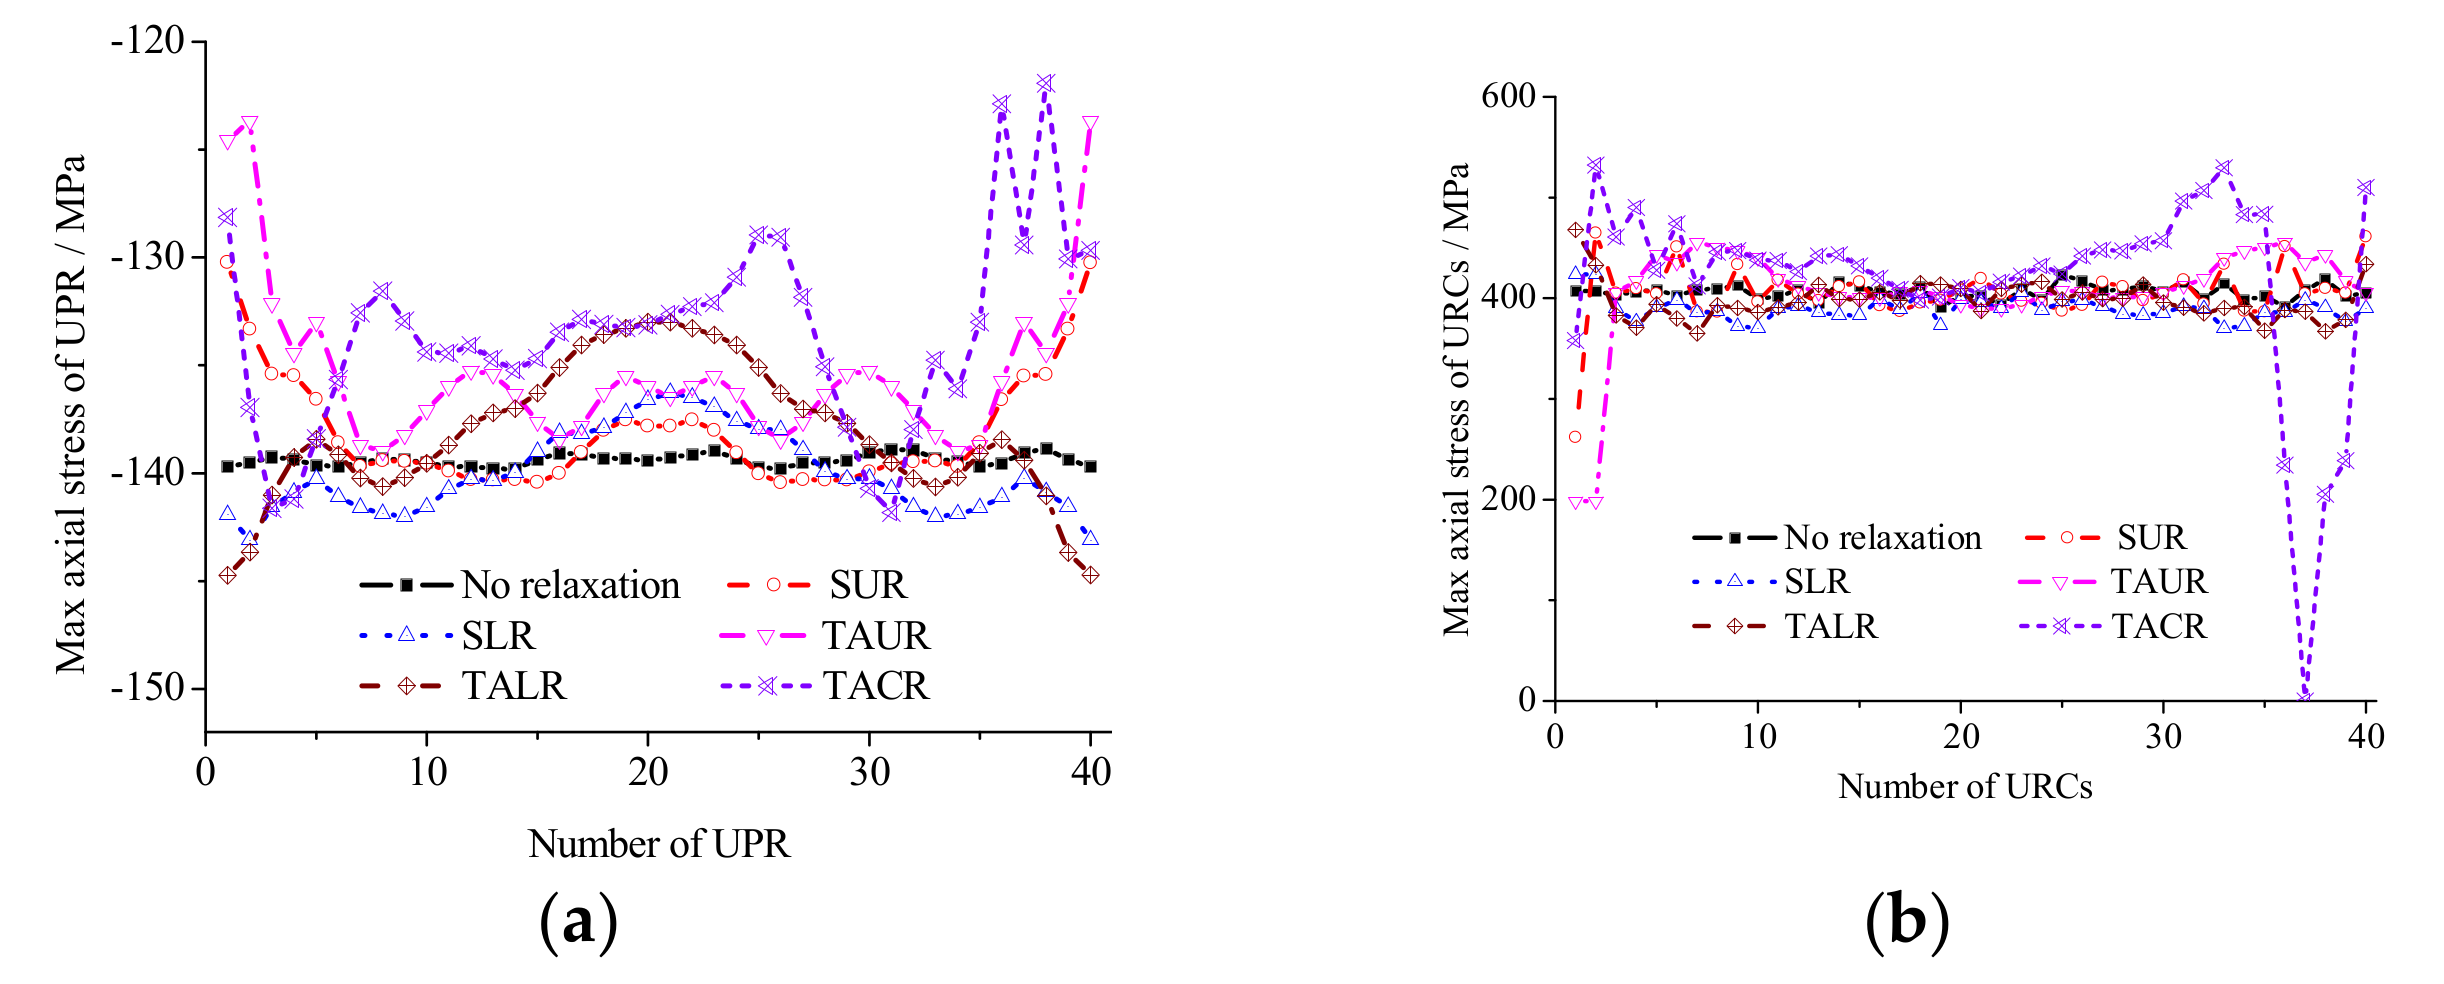
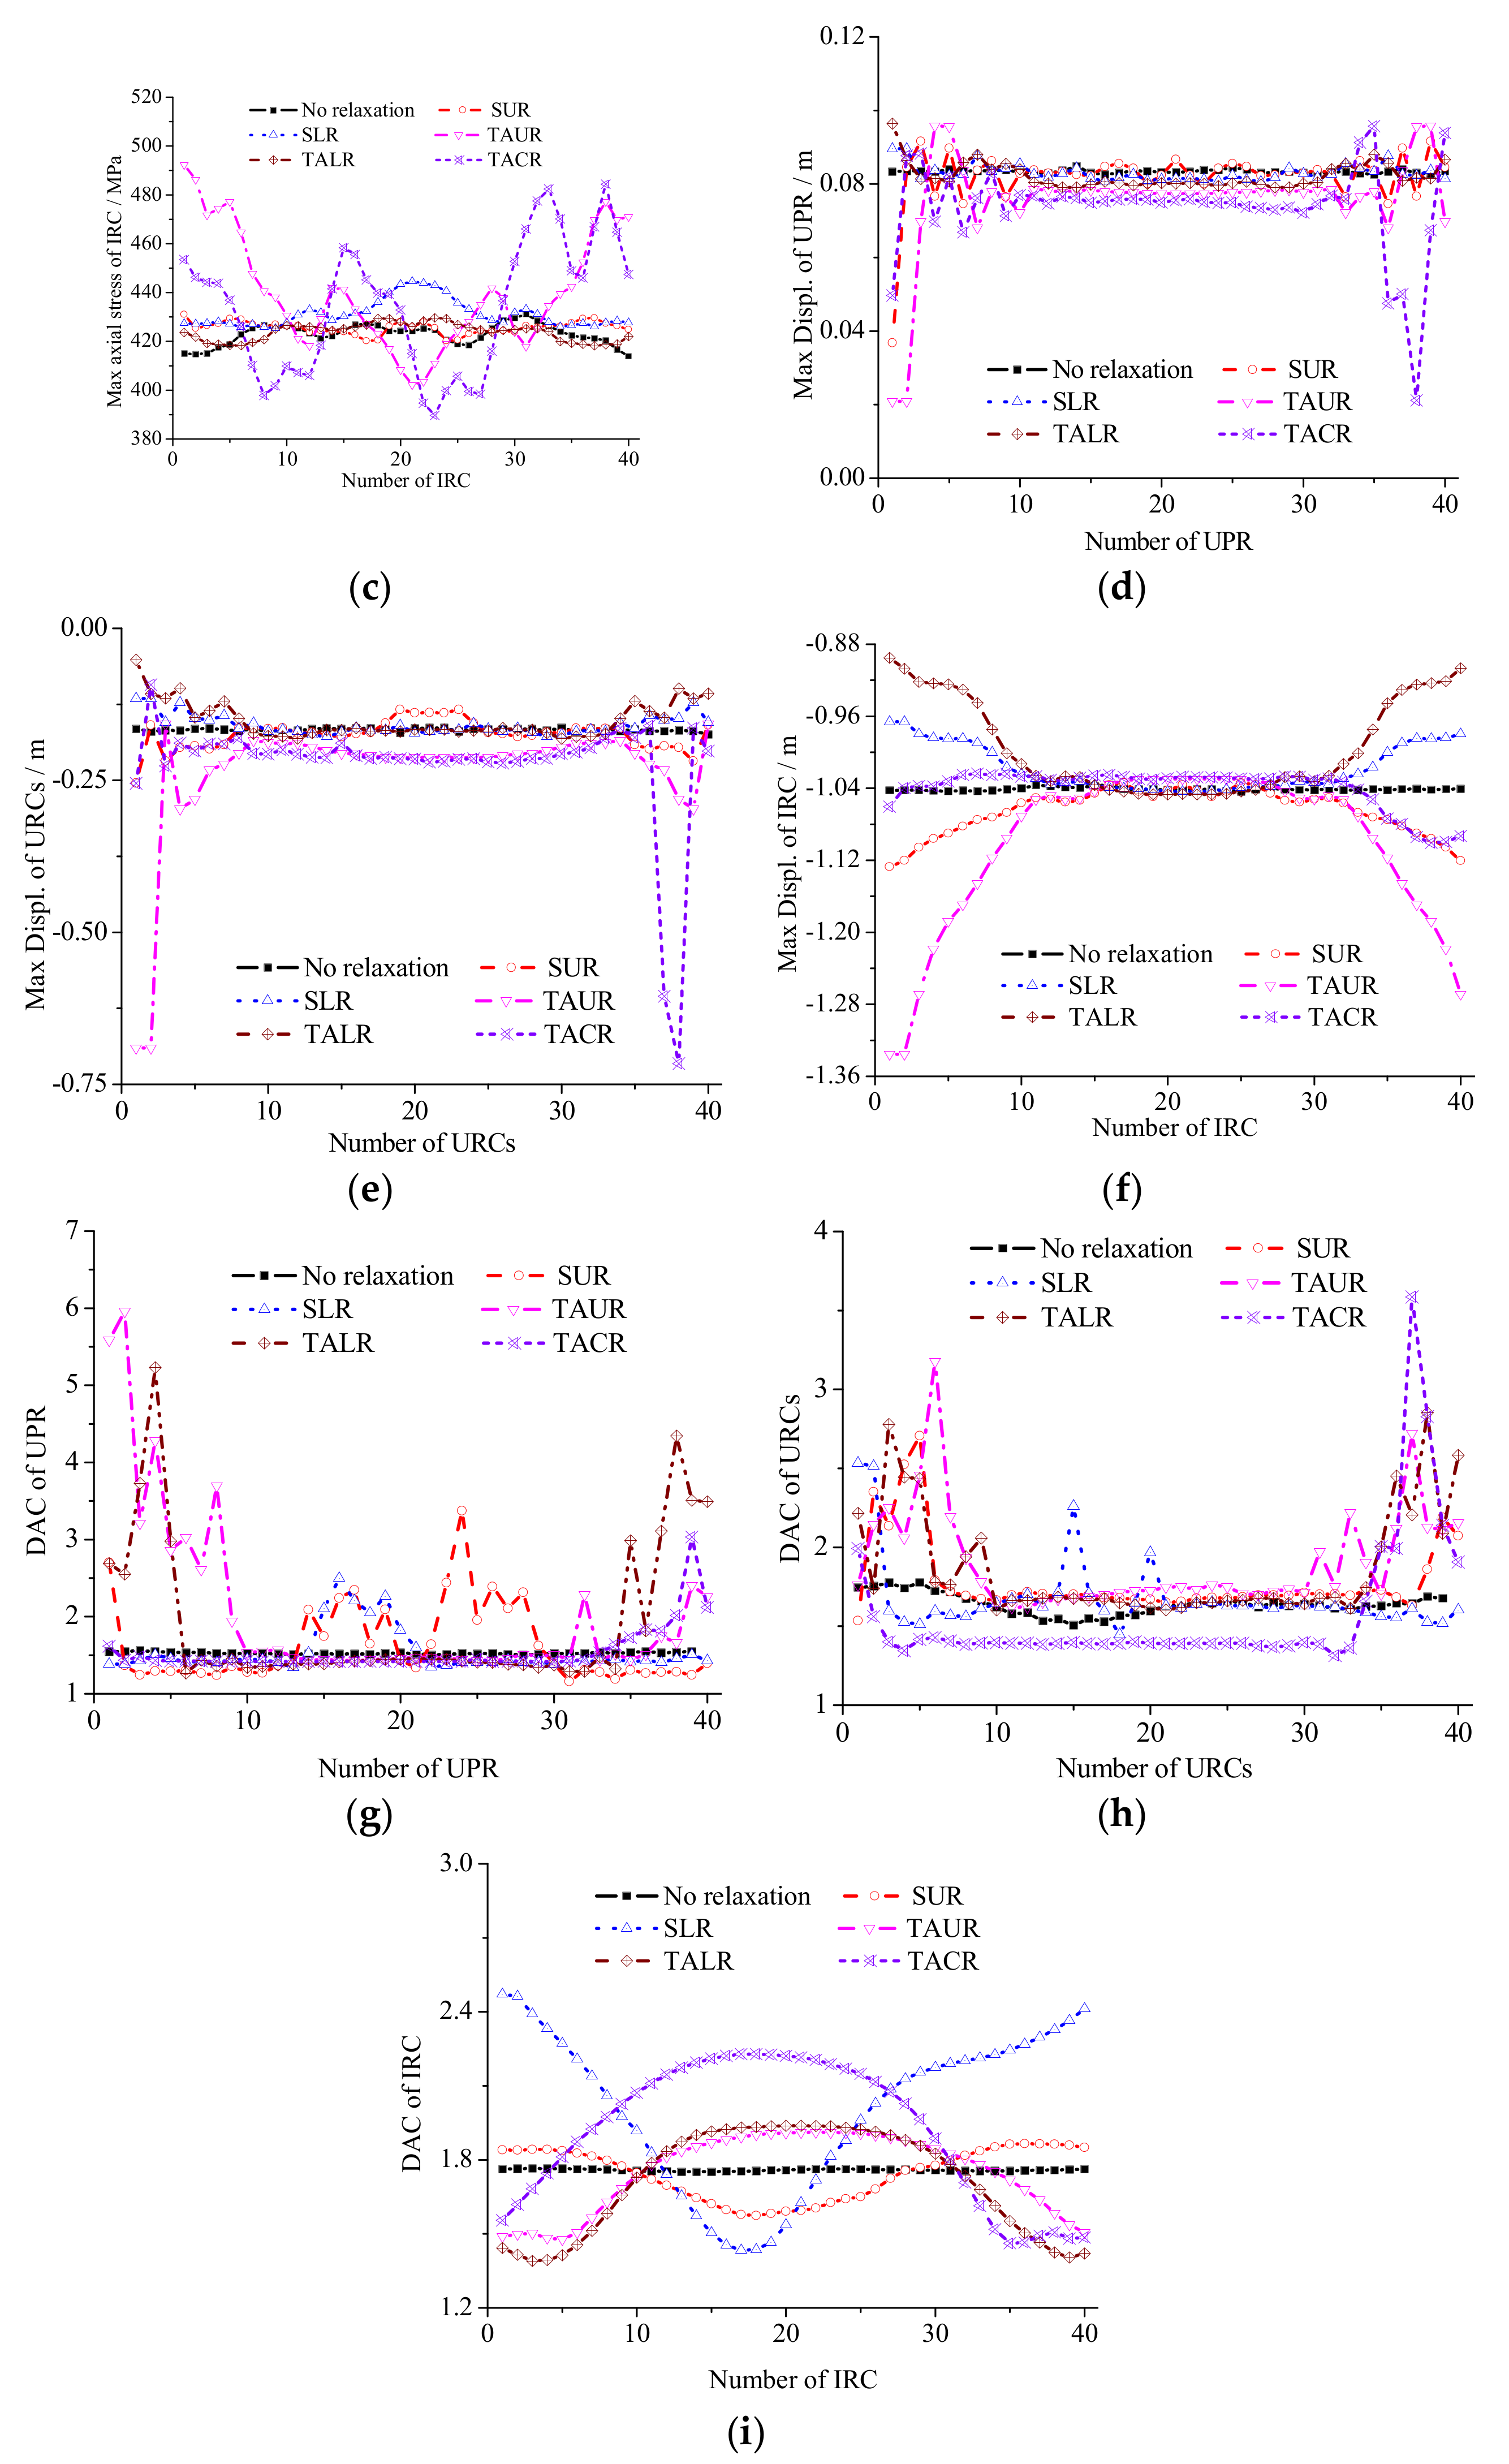
The response time history of the above mentioned 120 nodes when the cable is relaxed is not significantly different from that when the cable is not relaxed, except for the significant change of amplitude under different conditions. The details are depicted in Figure 9. The maximum and the minimum values of the deformation of the main bars and the maximum and the minimum values of their internal force are shown in Table 2. The distributions of the main bars; internal force, including their displacements and DACs under corresponding cases, are shown in Figure 9.
As presented in Table 2 and Figure 9, structural dynamic response under different cable relaxations has an axial symmetrical distribution with the resulting line between the position of relaxation cable and the circle center. The bar member connected to the relaxation cable has the most significant response. The response of the remaining bars gradually decreases on both sides of the relaxation cable. In cable relaxation condition, the change in stress and the displacement of the press ring are small. When the two adjacent cables are relaxed, the press ring undergoes the maximum stress changes and the maximum displacement changes, thereby reaching 12.2% and 74.7%, respectively. The difference in the internal force and the displacement of the cable system is significant. When the two adjacent cables relax, URC No. 37 is completely relaxed. The maximum stress of the cable system increases to 25.8%. The maximum URC displacement is 0.716 m and increases 3.1 times. The displacement of the inner ring is the highest when two adjacent URCs are flabby, and its displacement reaches 1.335 m with accompanying increases to 27.9%. Thus, the change in structure displacement is significant. When an LRC is flabby, the DAC reaches 2.00 and increases to 13.6%. Based on the stress changes and the DAC of UPR, URC, and IRC, the degrees of the effect of cable relaxation on the structure can be listed as follows: two adjacent cables, two adjacent URCs, two adjacent LRCs, single URC, and single LRC.
3.2. Structure Response to Different Relaxation Degrees
In this part, the response of the structure under different degrees of relaxation is analyzed for the case of two adjacent cables under the effect of symmetric wind and relaxations of 3%, 6%, 9%, 12%, and 15%, respectively. Table 3 shows the maximum and the minimum values of the deformation of the main bars and the maximum and the minimum values of the internal force of the main bars under different cable relaxation levels. At different degrees of relaxation, the distribution of the bar’s internal force and the displacement and DAC are close to the condition of 3% relaxation. Such a state has a symmetrical distribution with the line that connects the relaxation cable and the circle center.
The bar attached to the relaxation cables has the largest response. The maximum reaction of the remaining bars happened in most close to the relaxation cables and gradually declines, accompanied by the far away from the relaxation cables (Figure 9). When the cable relaxation is 9%, changes in the stress and displacement of the press ring are the highest and reach 43.3% and 1.61 times, respectively. When cable relaxations are 3% and 12%, the URC is completely relaxed. When cable relaxation is 9%, the URC stress increases to 1.31 times. When relaxation is 6%, the stress of the IRC can increase to 19.0%. Cable relaxation at 6% has the greatest influence on the displacement of the cable system, and the URC displacement increases to 3.86 times and the IRC increases even up to 14.1%. The maximum DAC appears at the cable relaxations of 3% and 9% and shows a similar DAC in the rest of the cases. The dynamic characteristic of the structure at the cable relaxation of 6% has been changed similarly to the effect of wind loads, which caused larger vibration on the structure. Therefore, the significant changes in the stress, the displacement, the DAC of the press ring, the URC, and the IRC, the structure should generate the greatest response at the relaxation of 6%. When relaxation of the cable system occurs, the location of the relaxation cable can be determined by monitoring the internal structure force and displacement changes.
3.3. Structure Response to Different Relaxation Locations
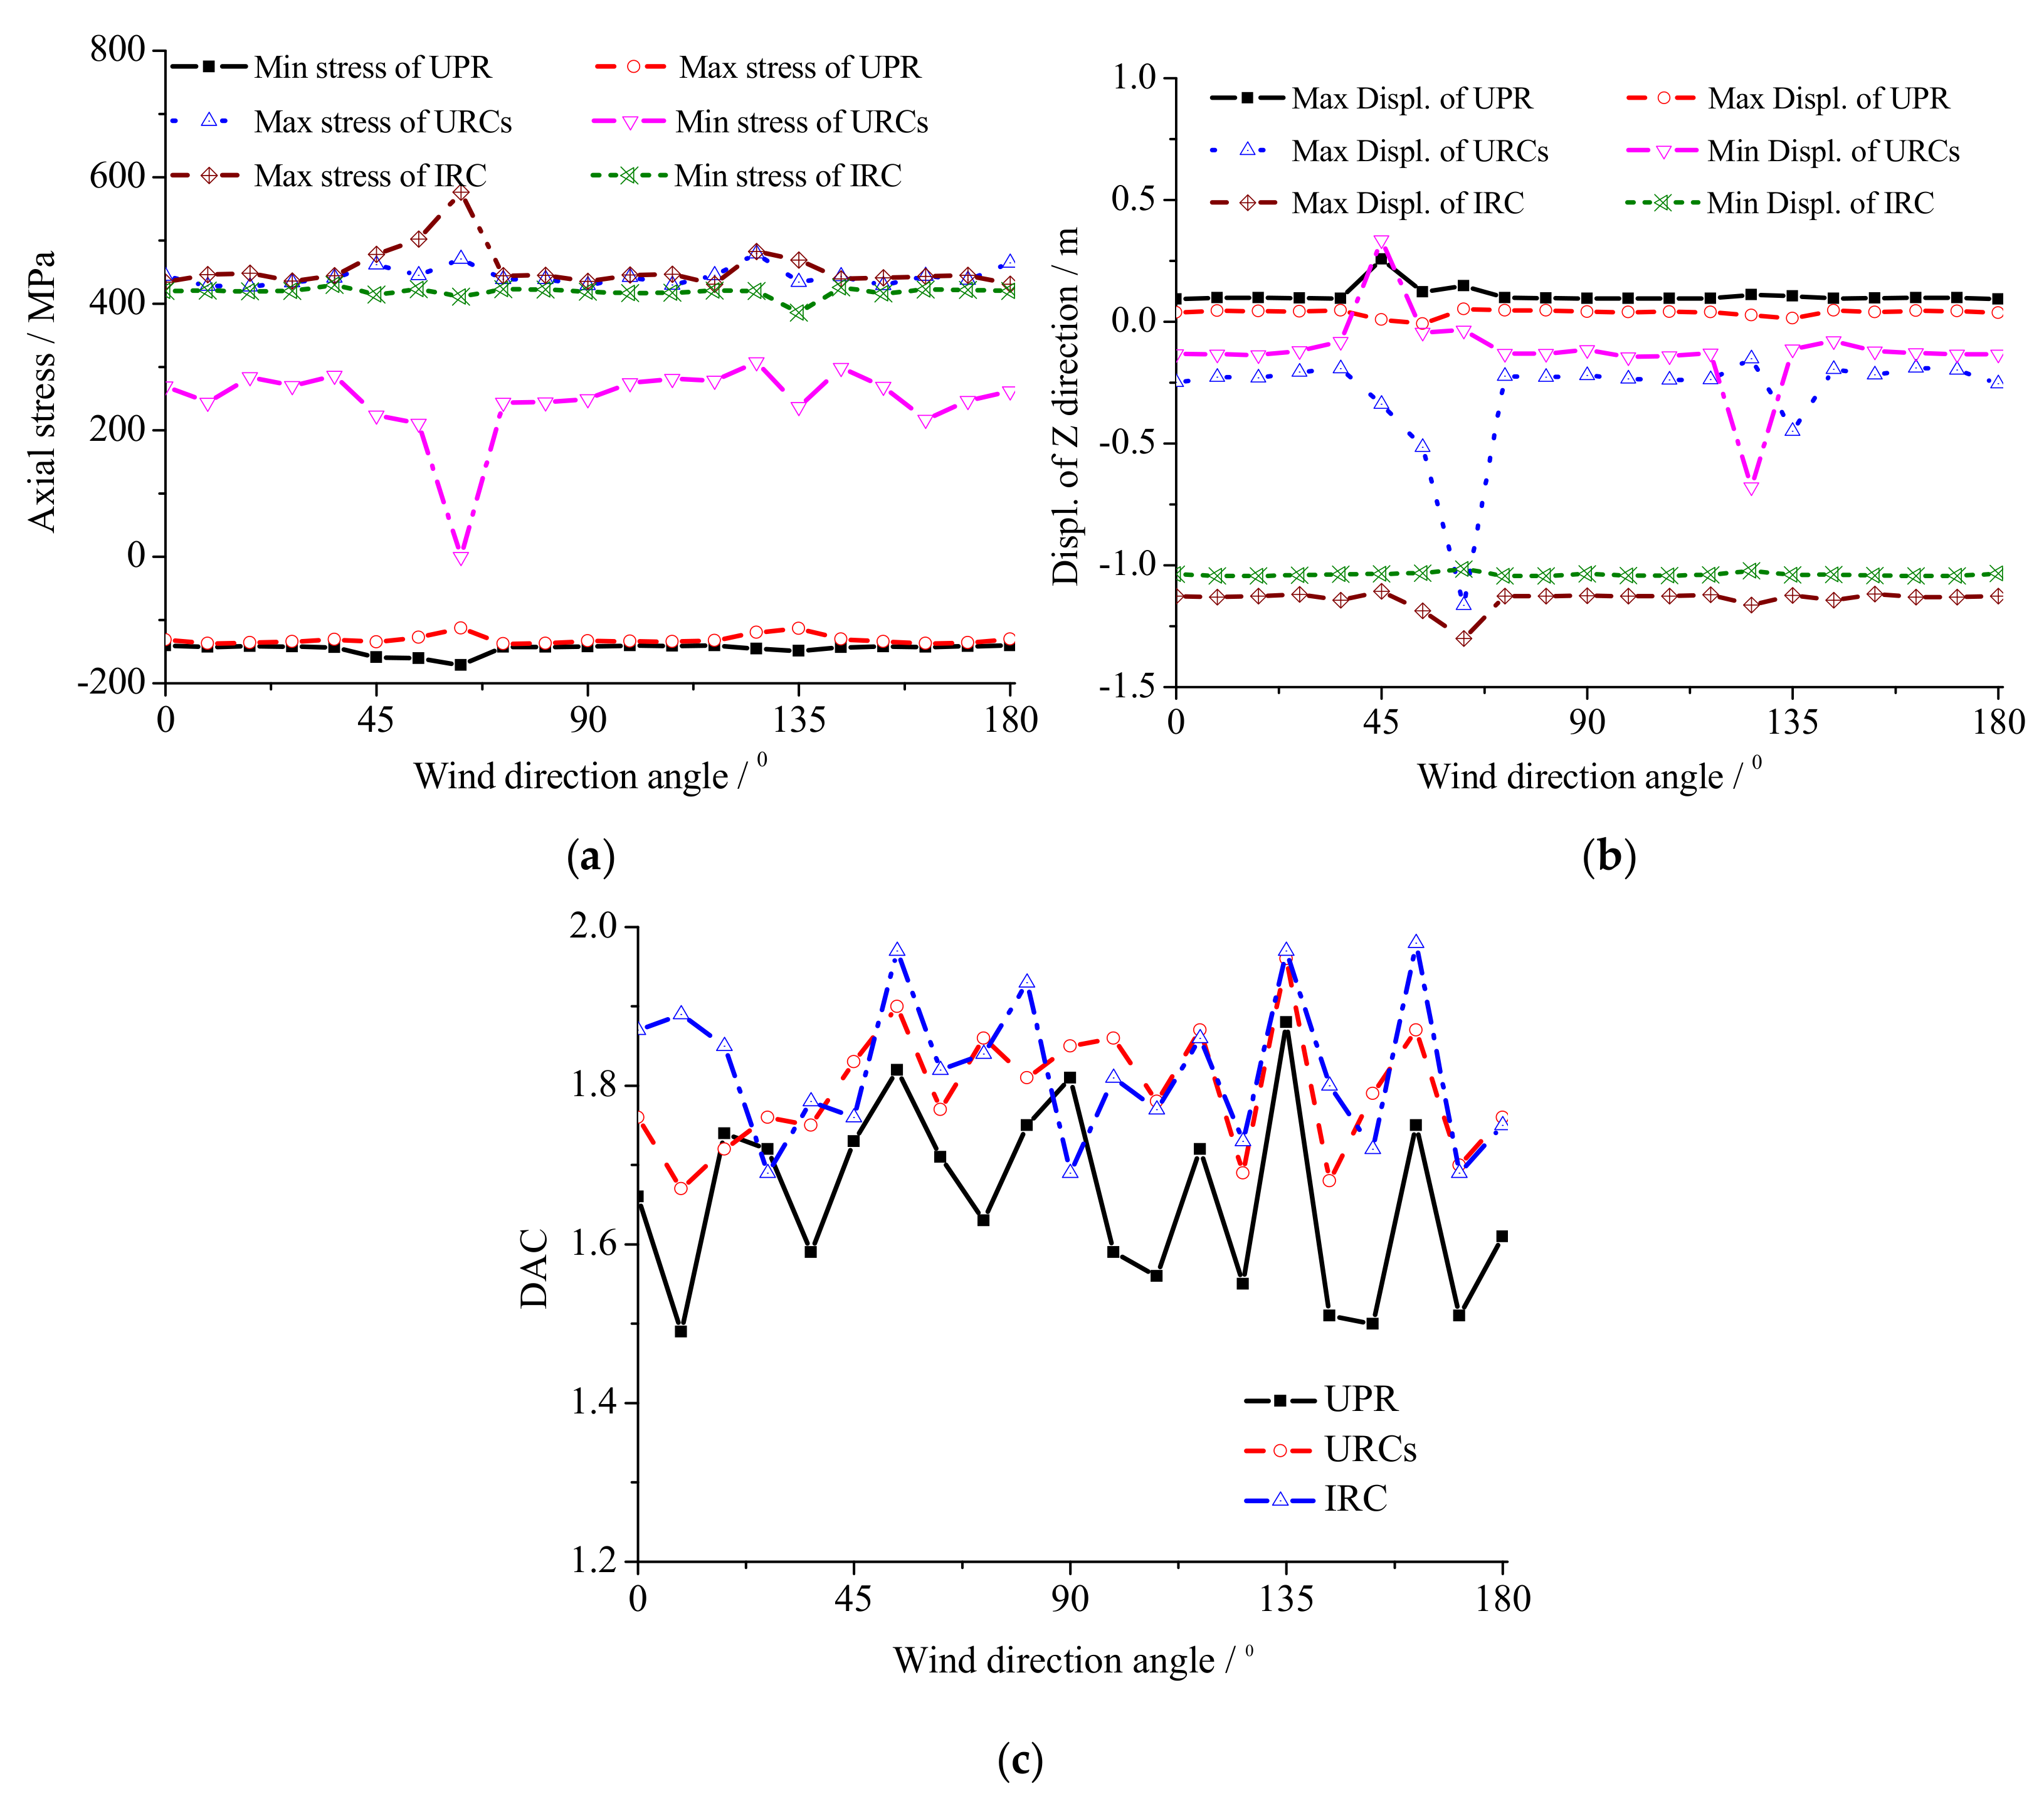
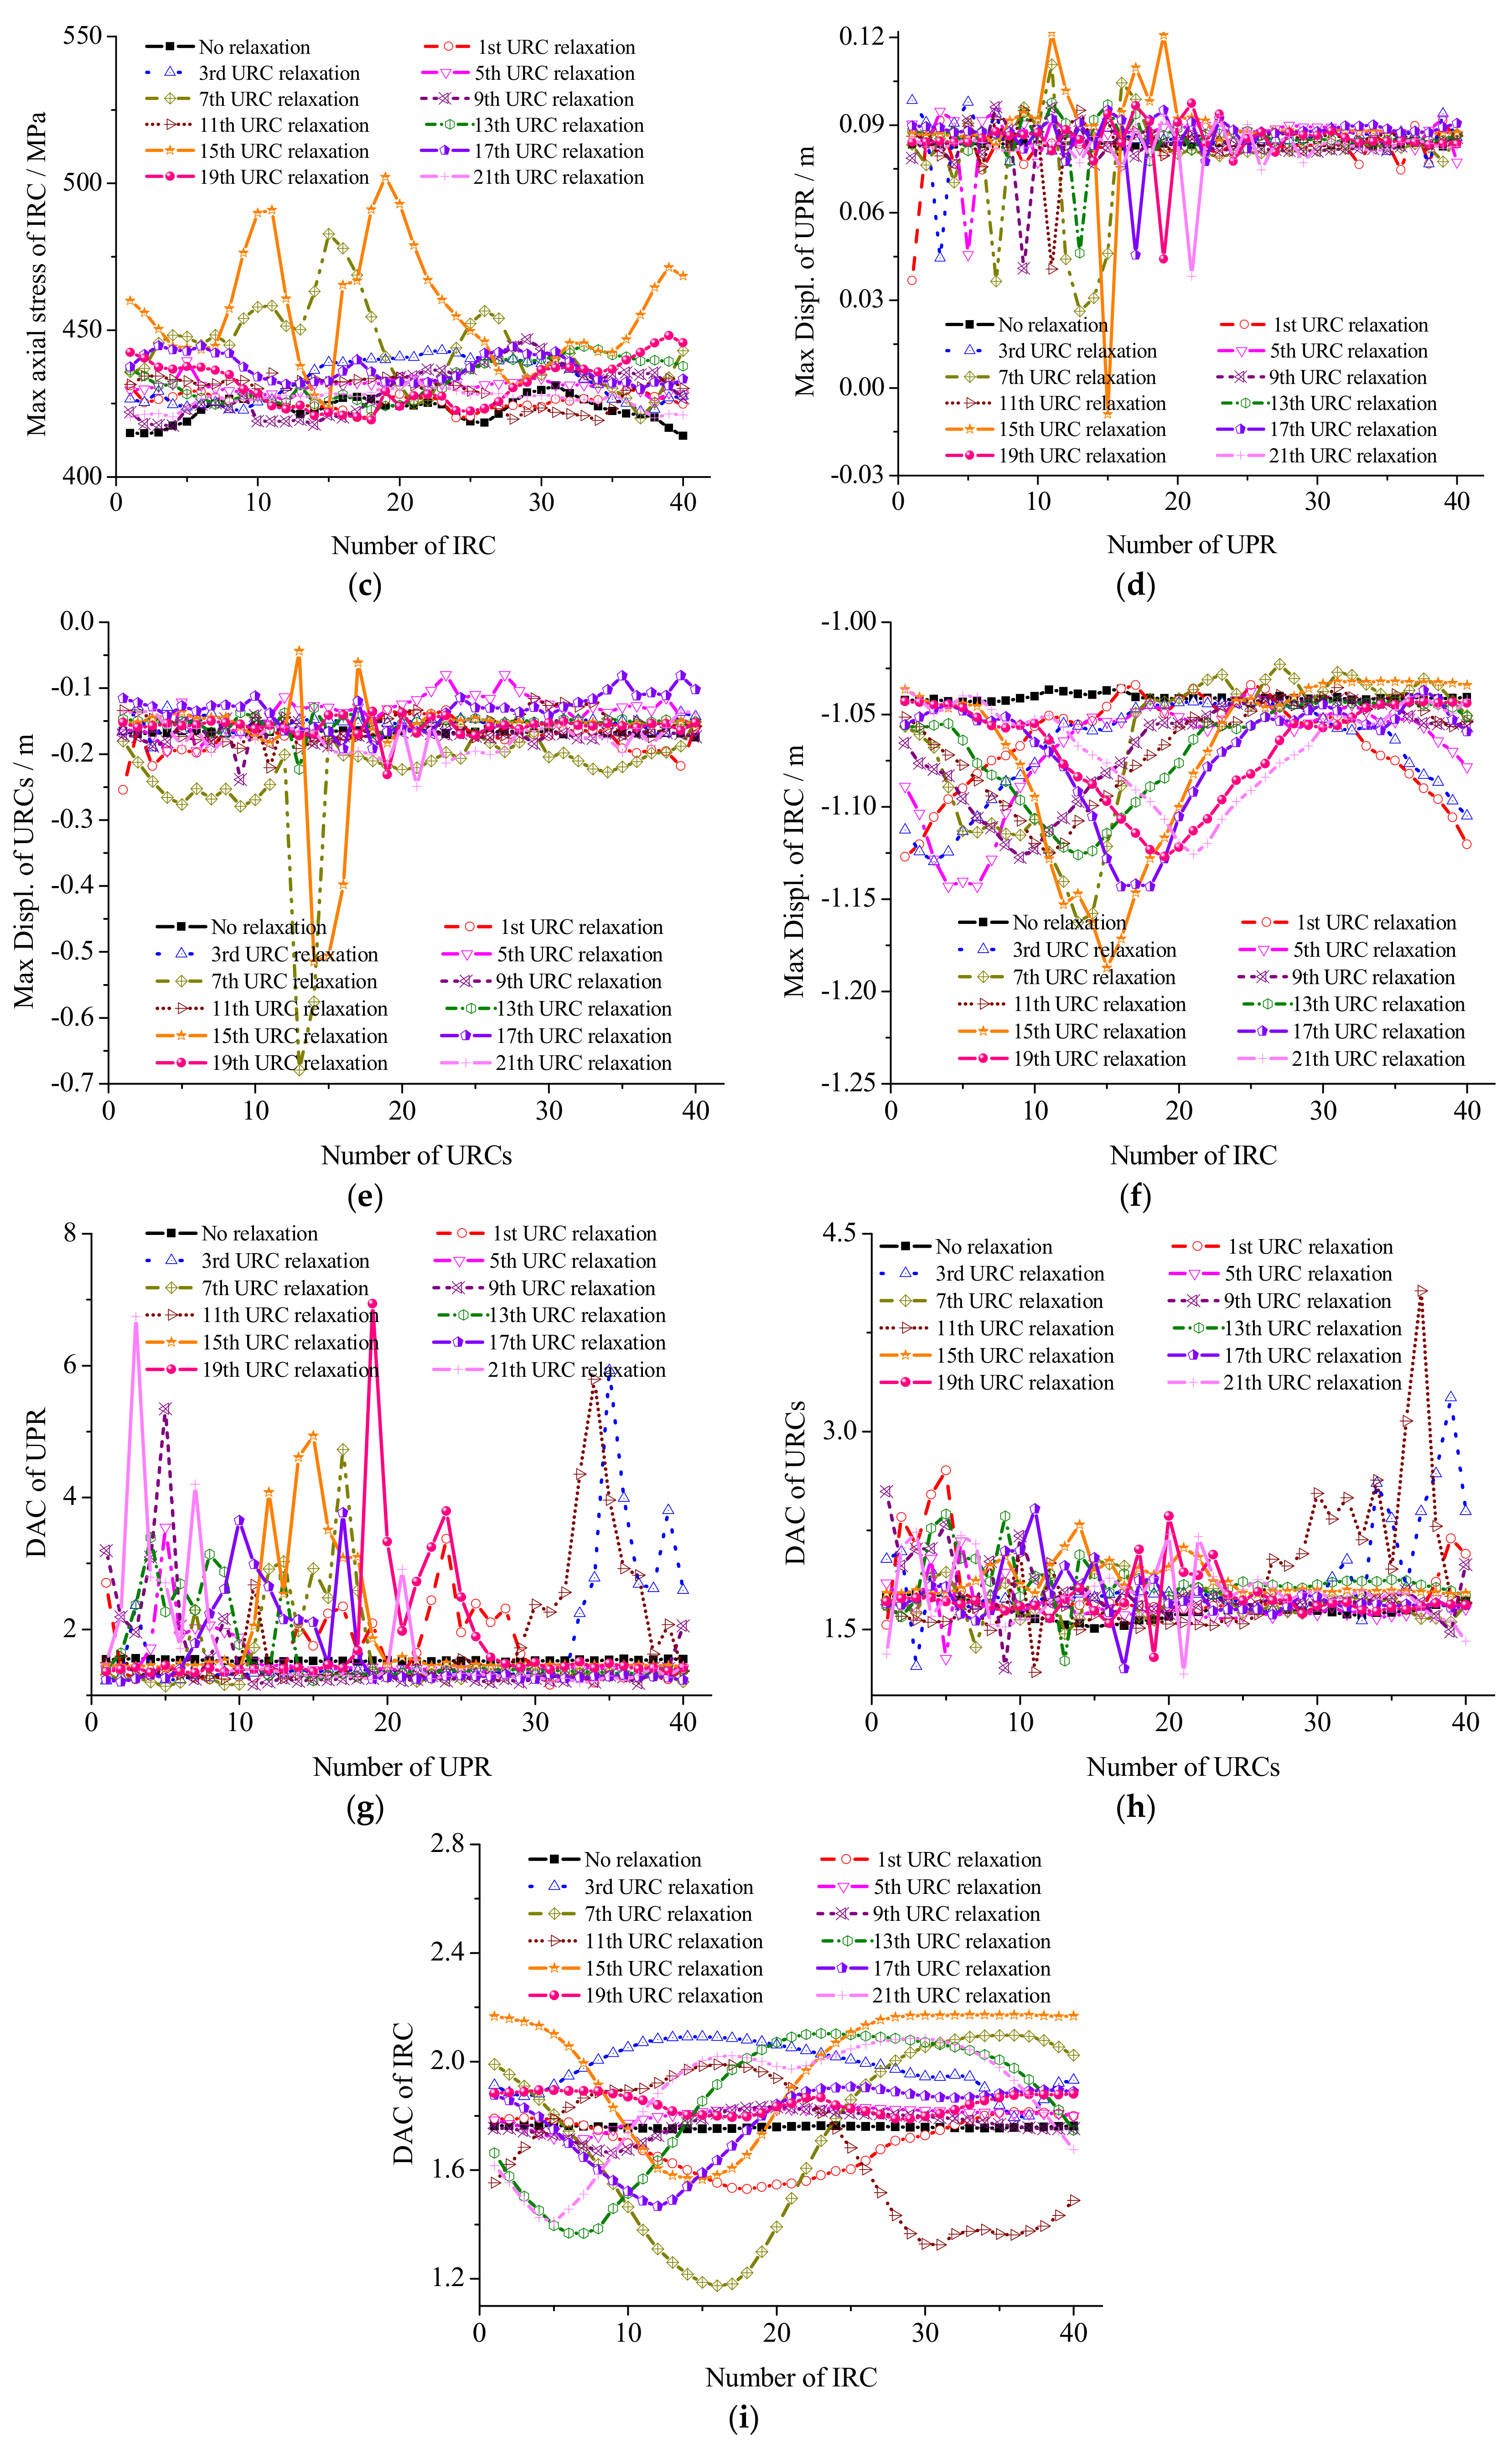
The dynamic responses of the structure should change because of the shift in the wind direction angle. In this study, the direction angle is fixed, as shown in Figure 5. The cable is relaxed in order at 1, 2 and 21 URC, which is equivalent to the wind angle changes from 180° to 0° (No. 1 URC relaxation corresponding to 180°, 9° for every URC). As a result of the structural symmetry, the response regarding the wind direction of 180° to 360° is the same as it is from 0° to 180°. The internal force of the URC is considered relaxation only at 3%. The maximum and the minimum values of deformation and the maximum and the minimum values of the internal force of the control nodes (as shown in Figure 2) are shown in Table 4 and Figure 10a–c. The distributions of the internal force and the displacement of the main bars are shown in Figure 11.
Figure 10 and Figure 11 and Table 4 show the greatest response distributions of the structure for different wind direction angles and the structural dynamic response under different relaxation locations. It can be seen that the structural response is different in the light of the wind direction angle changing and the position of the relaxation cable changing. An axial symmetrical distribution with the line that links the relaxation cable and the circle center as the axis of symmetry can be observed as well. The bar adjacent to the relaxation cable has a high response. The remaining parts have a close to the bar without relaxation. According to the largest value of the structure response, when the wind direction angle is in the ranges of 45° to 63° and 126° to 144°, the structure response is larger. The maximum compressive stress of the UPR appears in the 63° direction angle, which indicates that the 14th URC is relaxed. The maximum displacement appears at the 45° wind direction angle, where the URC16 is flabby. The minimum displacement appears in the 54° direction angle, which indicates that the URC15 is flabby. The maximum tensile stress of the URC appears in the 126° wind direction angle, which indicates that the URC7 is flabby. The stresses of the 126° and 63° wind direction angles are close, whereas the stress of the URC is 0, which indicates that it is completely relaxed. The maximum and the minimum displacements of the URC appear at the 63° wind direction angle. The maximum tensile stress for the IRC appears at the 63° wind direction angle, whereas the minimum tensile stress appears at the 135° wind direction angle, which indicates that the URC6 is relaxed. The maximum and the minimum displacements of the IRC appear at the 63° wind direction angle. According to the DAC of the structure, in addition to the individual case, the DAC of the component is larger when it is close to the relaxation cable and smaller when it is far from the relaxation cable. The DAC for each bar is high at 54° and 135°, and the former is greater than the latter. In these two areas, the structure is more sensitive to the wind load. Based on the coefficient of wind pressure distribution, which is determined through the wind tunnel test, the time history of wind load can be calculated by Equation (12). Therefore, to a certain extent, these results reflect the influence of the environment where the buildings are located on the wind-induced vibration suffered by the structure.
4. Analysis of Structure Amplification Factor
DAC of components adjacent to the relaxation cable increases to the maximum and gradually decreases along the sides to the middle component without relaxation. The DAC of the middle parts is close to the DAC of the corresponding component without relaxation. The DAC of a certain type of component is higher than the DAC of corresponding components without relaxation. Occasionally, a coefficient that is lesser than the corresponding value without relaxation also appears.
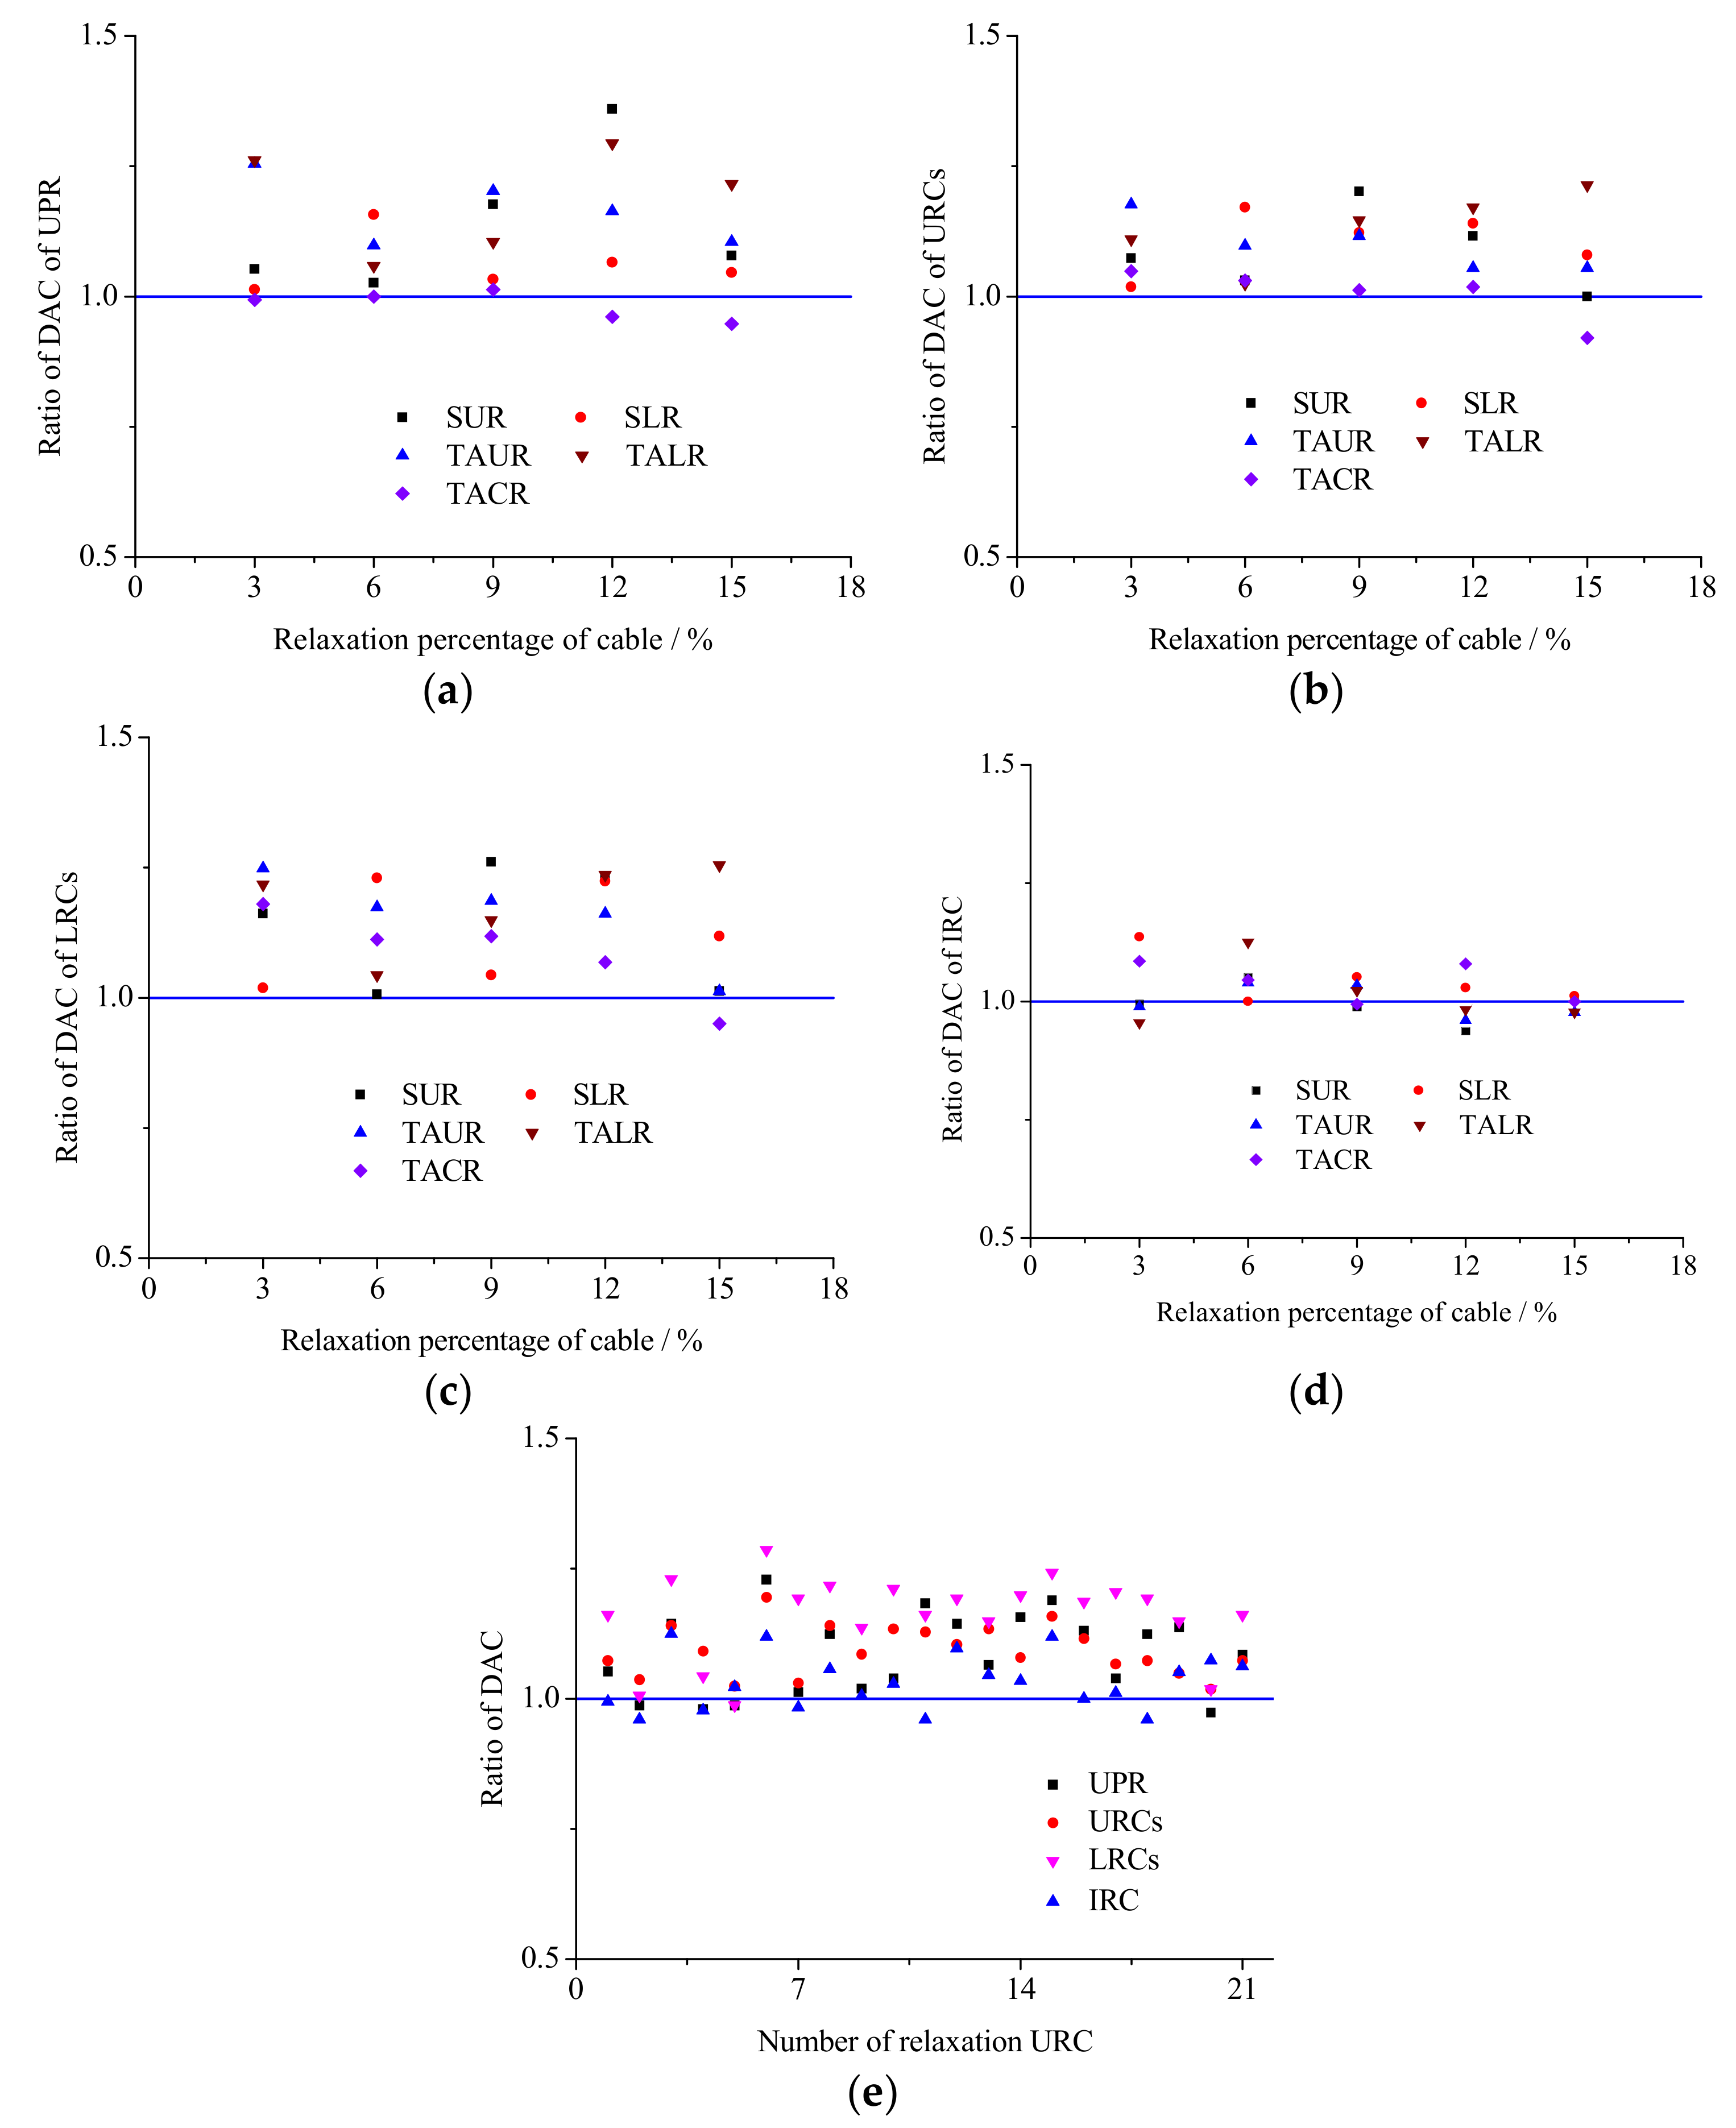
Figure 9 shows a comparison between the displacement amplification factors with cable relaxation and the corresponding value without relaxation. The figure shows that wind-induced vibration under-relaxation is higher than that in the intact structure. Therefore, during the design process, the coefficient of wind vibration of the rigid model based on the wind tunnel test should be small. According to the comparative analysis of the rigid model and the elastic model, determining the coefficient of the wind pressure distribution only through the rigid model is unsafe for the long-span flexible roof structure [27,28]. Therefore, the structure coefficient for dynamic magnification should be adjusted. The adjustment coefficient η of the stress relaxation of the structure is introduced. Equation (15) is revised as below:
The average ratios showed in Figure 12 are listed in Table 5. Figure 12a–d shows that, in addition to the IRC, the ratio of the magnification coefficient of three kinds of the bars is distributed uniformly. However, the relaxation degree and the relaxation positions have minor influences on the amplification coefficient. In actual design, the influence of these factors can be ignored by using the average. Figure 12e shows that although structural vibration is the largest at the 135° and 54° wind direction angles (6th and 15th URC relaxation, respectively), the gap between the overall magnification coefficient is not significant. Therefore, averages can be used to reflect the effects of relaxation degree and relaxation positions on wind-induced vibration. Table 5 shows that the effect of cable relaxation on the LRC of this structure is the highest, followed by that of the URC, UPR, and IRC. This result suggests that the value of η should be 1.1. Thus, Equation (16) can be rewritten as below:
5. Conclusions
- (1)
- Pulsating wind speed time series of 120 nodes are created by computer based on the harmonic synthesis method and the inverse Fourier transform method. This approach establishes the foundation for analyzing the dynamic response of the damaged structure under wind load.
- (2)
- The structural dynamic response caused by the wind and under different cable relaxations presents an axially symmetrical distribution that links the relaxation cable and the circle center. The bar connected to the relaxation cable has the greatest response. The response of the remaining bars gradually declines from the relaxation cables to both sides.
- (3)
- Based on the influence on the structure, the slack cable can be divided into two adjacent cables, two adjacent URCs, two adjacent LRCs, single URC, and single LRC. The structural response is close to the different relaxation degrees, but the structure’s response is the greatest when the relaxation reaches 6%.
- (4)
- Structural vibration amplitudes are the largest, at wind direction angles of 54° and 135°. The structure is sensitive to wind load in these two areas.
- (5)
- The dynamic magnification coefficient of the structure will not increase with the increase of the cable system relaxation degree. The pressure distribution coefficient and the wind vibration coefficient determined by wind tunnel test should be multiplied by the s stress relaxation adjustment coefficient η to prevent the dynamic effect of amplification on the structure. The prestressed relaxation causes such an effect on the uneven prestress distribution due to construction.
- (6)
- The internal force and the displacement of different components inside of the structure change significantly because of the slack cables. Such components have obvious differences with the internal force and the displacement distribution without relaxation. Thus, the damage to the structural damage can be determined by monitoring the change in the internal force and the displacement.
Author Contributions
Conceptualization, H.H. and W.Z.; methodology, Y.X. and K.Y.; software, M.G.; validation, H.H. and W.Z.; formal analysis, K.X. and K.Y.; investigation, H.H. and W.Z.; resources, M.G.; data curation, Y.X.; writing—original draft preparation, K.X.; writing—review and editing, W.Z. and K.X.; visualization, W.Z.; supervision, H.H. and W.Z.; project administration, H.H. and W.Z.; funding acquisition, H.H. and W.Z. All authors have read and agreed to the published version of the manuscript.
Funding
This work described in this paper was supported by the National Natural Science Foundation of China (No. 51778060) and (No. 51708035), the Natural Science Foundation of Shaanxi Province (No. 2020KW-067), the Natural Science Foundation of Jiangsu Province (No. BK20191441) and the Fundamental Research Funds for the Central Universities, CHD (No. 300102289401 and 300102288401).
Conflicts of Interest
The authors declare no conflict of interest.
References
- Gu, M.; Lu, H.F. Wind loads and wind-induced vibration of membrane structures: State of the art. J. Vib. Shock 2006, 25, 10003835. [Google Scholar]
- Gluck, M.; Breuer, M.; Durst, F.; Halfmann, A.; Rank, E. Computation of wind-induced vibrations of flexible shells and membranous structures. J. Fluids Struct. 2003, 17, 739–765. [Google Scholar] [CrossRef]
- Zhang, Z.H.; Tamura, Y. Wind Tunnel Test on Cable Dome of Geiger Type. J. Comput. Nonlin. Dyn. 2007, 2, 218–224. [Google Scholar] [CrossRef]
- Wei, D.M.; Shui, Y. Nonlinear wind-induced vibration response of cable-membrane structures. J. South China Univ. Technol. (Nat. Sci. Ed.) 2008, 36, 1–6. [Google Scholar]
- Yang, Q.S.; Wu, Y.; Zhu, W.L. Experimental study on the interaction between membrane structures and wind environment. Earthq. Eng. Eng. Vib. 2010, 9, 523–532. [Google Scholar] [CrossRef]
- Rojratsirikul, P.; Wang, Z.; Gursul, I. Effect of pre-strain and excess length on unsteady fluid-structure interactions of membrane airfoils. J. Fluid Struct. 2010, 26, 359–376. [Google Scholar] [CrossRef] [Green Version]
- Kim, J.Y.; Yu, E.; Kim, D.Y.; Tamura, Y. Long-term monitoring of wind-induced responses of a large-span roof structure. J. Wind Eng. Ind. Aerodyn. 2011, 99, 955–963. [Google Scholar] [CrossRef]
- Michalski, A.; Kermel, P.D.; Haug, E.; Löhner, R.; Wüchner, R.; Bletzinger, K.-U. Validation of the computational fluid–structure interaction simulation at real-scale tests of a flexible 29 m umbrella in natural wind flow. J. Wind Eng. Ind. Aerodyn. 2011, 99, 400–413. [Google Scholar] [CrossRef]
- Zhou, Y.; Li, Y.Q.; Shen, Z.Y.; Wang, L.; Tamura, Y. Numerical analysis of added mass for open flat membrane vibrating in still air using the boundary element method. J. Wind Eng. Ind. Aerodyn. 2014, 131, 100–111. [Google Scholar] [CrossRef]
- Zhao, C.; Zhang, X.G.; Lv, W.P. Computer modeling on wind histories with spatial correlativity. Spat. Struct. (Chin.) 1996, 2, 21–25. [Google Scholar]
- Frey, G.; Carmichael, B.; Kavanaugh, J.; Mahmoodi, S.N. Dynamic Model and Simulation of Flag Vibrations Modeled as a Membrane. In Proceedings of the 7th Annual Dynamic Systems and Control Conference, San Antonio, TX, USA, 22–24 October 2014; Volume 46209, p. V003T53A001. [Google Scholar] [CrossRef]
- Wu, Y.; Chen, Z.Q.; Sun, X.Y. Research on the wind-induced aero-elastic response of closed-type saddle-shaped tensioned membrane models. J. Zhejiang Univ. Sci. A 2015, 16, 656–668. [Google Scholar] [CrossRef] [Green Version]
- Wood, J.N.; Breuer, M.; De Nayer, G. Experimental studies on the instantaneous fluid-structure interaction of an air-inflated flexible membrane in a turbulent flow. J. Fluids Struct. 2018, 80, 405–440. [Google Scholar] [CrossRef] [Green Version]
- Dutta, S.; Ghosh, S.; Inamdar, M. Optimisation of tensile membrane structures under uncertain wind loads using PCE and kriging based metamodels. Struct. Multidiscip. Optim. 2018, 57, 1149–1161. [Google Scholar] [CrossRef]
- Hao, C.X.; Liu, X.D.; Qian, J.H.; Tang, R.W.; Hu, Q.W. Cable Stress testing of the cable-membrane of the main stadium of Foshan Century Lotus Stadium during construction. In Proceedings of the 7th National Academic Conference on Modern Engineering Structures, Hangzhou, China, 20 July 2007; pp. 441–446. [Google Scholar]
- Firm, W.E. Wind Tunnel Test of China Foshan Stadium under Quasi-Static and Dynamic Design Load (Chinese); Guangdong Industrial Press: Foshan, China, 2004. [Google Scholar]
- Ministry of Housing and Urban-Rural Development (MOHURD). Load Code for the Design of Building Structures (Chinese): GB 50009-2012; China Architecture & Building Press: Beijing, China, 2012.
- Han, D.J.; Zeng, X.W. Report of the form-finding, static analysis and wind-induced vibration of the tensioned cable-membrane structure of the century lotus sports center in Foshan. In Proceedings of the Sixth World Congress on Computational Mechanics in conjunction with the Second Asian-Pacific Congress on Computational Mechanics, Guangzhou, China, 22 July 2005; pp. 347–351. [Google Scholar]
- Simiu, E.; Scanlan, R.H. Wind Effects on Structures; John Wiley & Sons: New York, NY, USA, 1986. [Google Scholar]
- Deodatis, G. Simulation of ergodic multivariate stochastic processes. J. Eng. Mech. 1996, 122, 778–787. [Google Scholar] [CrossRef]
- Cao, Z.; Xue, S.D.; Wang, X.S.; Liu, Y.C. Selection of earthquake waves and values of damping ratio for space structures in the aseismic analysis. Spat. Struct. 2008, 14, 3–8. [Google Scholar]
- Luo, J.J.; Han, D.J. Wind-induced response analysis of a large–span cable-membrane roof. China Civ. Eng. J. (Chin.) 2009, 42, 15–21. [Google Scholar]
- Wang, J.W.; Sun, W.B.; Chen, H.X. Wind-induced dynamic analysis of ring–shape tensile cable membrane structure. Spat. Struct. (Chin.) 2010, 16, 67–71. [Google Scholar]
- Uematsu, Y.; Watanabe, K.; Sasaki, A.; Yamada, M.; Hongo, T. Wind-induced dynamic response and resultant load estimation of a circular flat roof. J. Wind Eng. Ind. Aerodyn. 1999, 83, 251–261. [Google Scholar] [CrossRef]
- Uematsu, Y.; Yamada, M.; Sasaki, A. Wind-induced dynamic response and resultant load estimation for a flat long-span roof. J. Wind Eng. Ind. Aerodyn. 1996, 65, 155–166. [Google Scholar] [CrossRef]
- Lu, F.; Lou, W.J.; Sun, B.N. Wind-induced dynamic response and wind load factor for long-span flat roof structures. Eng. Mech. (Chin. Ed.) 2002, 19, 52–57. [Google Scholar]
- Wu, Y.; Yang, Q.S.; Shen, S.Z. Wind tunnel tests on the aeroelastic effect of wind-induced vibration of tension structures. Eng. Mech. (Chin. Ed.) 2008, 25, 8–15. [Google Scholar]
- Yang, Q.S.; Liu, R.X. On aerodynamic stability of membrane structures. Int. J. Space Struct. 2005, 20, 181–188. [Google Scholar] [CrossRef]
Figure 1.
Aerial view of Foshan Century Lotus Sports Center (FCLSC).

Figure 2.
Model in the wind tunnel. (a) Bottom substructure model of FCLSC; (b) Integral structure model of FCLSC.
Figure 2.
Model in the wind tunnel. (a) Bottom substructure model of FCLSC; (b) Integral structure model of FCLSC.

Figure 3.
Wind flow diagram of the atmospheric boundary layer simulated in the wind tunnel. (a) V/Vref—z curve; (b) Tv—z curve.
Figure 3.
Wind flow diagram of the atmospheric boundary layer simulated in the wind tunnel. (a) V/Vref—z curve; (b) Tv—z curve.

Figure 4.
Position and wind direction of pressure test holes on the pavilion roof.

Figure 5.
Wind pressure distribution. (a) Wind pressure distribution of the symmetric wind; (b) Wind pressure distribution of the asymmetric wind.
Figure 5.
Wind pressure distribution. (a) Wind pressure distribution of the symmetric wind; (b) Wind pressure distribution of the asymmetric wind.

Figure 6.
Wind speed time history and power spectrum density. (a) Wind speed time history curves of 1, 41, 81 nodes; (b) Power spectrum density function calibration of node 1; (c) Power spectrum density function calibration of node 41; (d) Power spectrum density function calibration of node 81.
Figure 6.
Wind speed time history and power spectrum density. (a) Wind speed time history curves of 1, 41, 81 nodes; (b) Power spectrum density function calibration of node 1; (c) Power spectrum density function calibration of node 41; (d) Power spectrum density function calibration of node 81.


Figure 7.
Finite element model of FCLSC.

Figure 8.
Displacement time history curves of typical bars. (a) Displacement time history curves of Upper-Pressure Ring (UPR) 20; (b) Displacement time history curves of Upper-Pressure Ring (URC) 21; (c) Displacement time history curves of Lower Radial Cables (LRC) 20.
Figure 8.
Displacement time history curves of typical bars. (a) Displacement time history curves of Upper-Pressure Ring (UPR) 20; (b) Displacement time history curves of Upper-Pressure Ring (URC) 21; (c) Displacement time history curves of Lower Radial Cables (LRC) 20.


Figure 9.
Structural response distributions under different cable relaxation. (a)Axial stress of UPR; (b) Axial stress of Upper-Pressure Ring (URCs); (c) Axial stress of Inner Ring Cables (IRC); (d) Displ. of Z direction of UPR; (e) Displ. of Z direction of URCs direction of URCs; (f) displacement amplification coefficient (DAC) of IRC; (g) displacement amplification coefficient (DAC) of UPR; (h) DAC of URCs; (i) DAC of IRC.


Figure 10.
Greatest response distributions of the structure for different wind direction angles. (a) Axial stress VS. wind direction angle; (b) Displ. of Z direction VS. wind direction angle; (c) DAC VS. wind direction angle.
Figure 10.
Greatest response distributions of the structure for different wind direction angles. (a) Axial stress VS. wind direction angle; (b) Displ. of Z direction VS. wind direction angle; (c) DAC VS. wind direction angle.

Figure 11.
Response distributions of the structure for the different URC relaxations. (a) Axial stress of UPR; (b) Axial stress of URCs; (c) Axial stress of IRC (d) Displ. of Z direction of UPR; (e) Displ. of Z direction of URCs; (f) Displac. of Z direction of IRC; (g) DAC of UPR; (h) DAC of URCs; (i) DAC of IRC.


Figure 12.
Ratio of displacement amplification coefficient (DAC). (a) UPR; (b) URCs; (c) LRCs; (d) IRC; (e) Relaxation locations.
Figure 12.
Ratio of displacement amplification coefficient (DAC). (a) UPR; (b) URCs; (c) LRCs; (d) IRC; (e) Relaxation locations.


Table 1.
Calculation results of wind-induced vibration.
| Response of Bars | Load Condition | ||
|---|---|---|---|
| Symmetrical Wind | Asymmetrical Wind | ||
| Coefficient of dynamic amplification | Axial stress of URC | 1.42 | 1.49 |
| Displ. of URC | 1.64 | 1.60 | |
| Axial stress of LRCs | 1.51 | 1.68 | |
| Displ. of URC | 1.61 | 1.59 | |
| Axial stress of IRC | 1.49 | 1.64 | |
| Displ. of IRC | 1.76 | 1.97 | |
| Axial stress of UPR | 1.47 | 1.37 | |
| Displ. of UPR | 1.53 | 1.44 | |
| Axial stress of LPR | 1.42 | 1.39 | |
| Displ. of LPR | 1.46 | 1.37 | |
Table 2.
Structural dynamic response under different kinds of cable relaxation.
| Relaxation Conditions | Axial Stress of UPR [MPa] | Axial Stress of URCs [MPa] | Axial Stress of IRC [MPa] | Displ. of UPR [m] | Displ. of URC [m] | Displ. of IRC [m] | DAC of UPR | DAC of URC | DAC of IRC | ||||||
|---|---|---|---|---|---|---|---|---|---|---|---|---|---|---|---|
| Min | Max | Max | Min | Max | Min | Max | Min | Max | Min | Max | Min | ||||
| No relaxation | −139.82 | −138.87 | 423.22 | 391.07 | 431.14 | 413.96 | 0.085 | 0.083 | −0.175 | −0.164 | −1.044 | −1.036 | 1.53 | 1.64 | 1.76 |
| SUR | −140.44 | −130.23 | 464.82 | 262.01 | 431.03 | 420.17 | 0.092 | 0.037 | −0.254 | −0.134 | −1.127 | −1.034 | 1.61 | 1.76 | 1.75 |
| SLR | −143.11 | −136.27 | 423.79 | 369.98 | 444.55 | 425.33 | 0.090 | 0.081 | −0.178 | −0.116 | −1.044 | −0.967 | 1.55 | 1.67 | 2.00 |
| TAUR | −138.98 | −123.67 | 455.25 | 198.43 | 492.28 | 402.18 | 0.096 | 0.021 | −0.690 | −0.158 | −1.335 | −1.030 | 1.92 | 1.93 | 1.74 |
| TALR | −144.73 | −133.00 | 467.78 | 365.13 | 429.60 | 418.26 | 0.096 | 0.079 | −0.181 | −0.052 | −1.047 | −0.895 | 1.93 | 1.82 | 1.68 |
| TACR | −141.82 | −121.93 | 532.28 | 0.00 | 484.36 | 389.67 | 0.096 | 0.021 | −0.716 | −0.093 | −1.100 | −1.024 | 1.52 | 1.72 | 1.91 |
Note: The displacement of the components refers only to the displacement of Z direction in this table.
Table 3.
Structural dynamic response under different cable relaxation degrees.
| Relaxation Degrees | Axial Stress of UPR [MPa] | Axial Stress of URCs [MPa] | Axial Stress of IRC [MPa] | Displ. of UPR [m] | Displ. of URCs [m] | Displ. of IRC [m] | DAC of UPR | DAC of URCs | DAC of IRC | ||||||
|---|---|---|---|---|---|---|---|---|---|---|---|---|---|---|---|
| Min | Max | Max | Min | Max | Min | Max | Min | Max | Min | Max | Min | ||||
| No relaxation | −139.82 | −138.87 | 423.22 | 391.07 | 431.14 | 413.96 | 0.085 | 0.083 | −0.175 | −0.164 | −1.044 | −1.036 | 1.53 | 1.64 | 1.76 |
| 3% | −141.82 | −121.93 | 532.28 | 0.000 | 484.36 | 389.67 | 0.096 | 0.021 | −0.716 | −0.093 | −1.100 | −1.024 | 1.52 | 1.72 | 1.91 |
| 6% | −129.45 | −118.32 | 460.32 | 80.42 | 512.88 | 397.85 | 0.093 | 0.043 | −0.851 | −0.150 | −1.191 | −1.010 | 1.53 | 1.69 | 1.84 |
| 9% | −123.91 | −78.78 | 978.26 | 169.64 | 465.18 | 380.22 | 0.087 | −0.051 | −0.787 | −0.210 | −1.101 | −1.002 | 1.55 | 1.66 | 1.75 |
| 12% | −147.04 | −117.99 | 530.67 | 0.000 | 474.52 | 378.53 | 0.099 | 0.007 | −0.503 | −0.149 | −1.100 | −1.027 | 1.47 | 1.67 | 1.90 |
| 15% | −141.43 | −132.69 | 464.93 | 342.83 | 430.81 | 414.09 | 0.092 | 0.045 | −0.214 | −0.078 | −1.053 | −1.034 | 1.45 | 1.51 | 1.76 |
Table 4.
Structural dynamic response under different cable relaxation degrees.
| Number of Relaxation Cable | Axial Stress of UPR [MPa] | Axial Stress of URC [MPa] | Axial Stress of IRC [MPa] | Displ. of UPR [m] | Displ. of URC [m] | Displ. of IRC [m] | DAC of UPR | DAC of URC | DAC of IRC | ||||||
|---|---|---|---|---|---|---|---|---|---|---|---|---|---|---|---|
| Min | Max | Max | Min | Max | Min | Max | Min | Max | Min | Max | Min | ||||
| No relaxation | −139.82 | −138.87 | 423.22 | 391.07 | 431.14 | 413.96 | 0.085 | 0.083 | −0.175 | −0.164 | −1.044 | −1.036 | 1.53 | 1.64 | 1.76 |
| 1 | −140.44 | −130.23 | 464.82 | 262.01 | 431.03 | 420.17 | 0.092 | 0.037 | −0.254 | −0.134 | −1.127 | −1.034 | 1.61 | 1.76 | 1.75 |
| 2 | −141.56 | −135.90 | 437.68 | 246.57 | 445.14 | 421.95 | 0.098 | 0.044 | −0.198 | −0.133 | −1.130 | −1.043 | 1.51 | 1.70 | 1.69 |
| 3 | −142.70 | −137.15 | 443.92 | 217.11 | 443.02 | 422.29 | 0.098 | 0.045 | −0.190 | −0.128 | −1.130 | −1.043 | 1.75 | 1.87 | 1.98 |
| 4 | −142.03 | −134.03 | 429.35 | 268.85 | 441.06 | 416.48 | 0.097 | 0.040 | −0.217 | −0.121 | −1.118 | −1.042 | 1.5 | 1.79 | 1.72 |
| 5 | −143.05 | −130.52 | 443.03 | 298.75 | 439.59 | 425.61 | 0.095 | 0.046 | −0.195 | −0.079 | −1.143 | −1.038 | 1.51 | 1.68 | 1.80 |
| 6 | −148.71 | −113.56 | 434.50 | 236.93 | 469.23 | 386.09 | 0.105 | 0.014 | −0.450 | −0.112 | −1.123 | −1.039 | 1.88 | 1.96 | 1.97 |
| 7 | −145.44 | −119.77 | 479.44 | 307.60 | 482.75 | 419.97 | 0.111 | 0.026 | −0.151 | −0.679 | −1.163 | −1.023 | 1.55 | 1.69 | 1.73 |
| 8 | −140.44 | −132.32 | 445.08 | 278.42 | 431.15 | 420.54 | 0.095 | 0.039 | −0.238 | −0.129 | −1.121 | −1.039 | 1.72 | 1.87 | 1.86 |
| 9 | −140.74 | −134.29 | 429.62 | 281.73 | 446.85 | 417.49 | 0.096 | 0.041 | −0.239 | −0.141 | −1.127 | −1.042 | 1.56 | 1.78 | 1.77 |
| 10 | −140.69 | −133.45 | 442.00 | 274.99 | 445.49 | 416.58 | 0.096 | 0.040 | −0.235 | −0.144 | −1.127 | −1.042 | 1.59 | 1.86 | 1.81 |
| 11 | −141.87 | −133.09 | 429.12 | 249.35 | 435.37 | 419.29 | 0.095 | 0.041 | −0.221 | −0.115 | −1.125 | −1.035 | 1.81 | 1.85 | 1.69 |
| 12 | −142.55 | −137.34 | 438.87 | 244.13 | 444.81 | 422.46 | 0.097 | 0.046 | −0.227 | −0.130 | −1.127 | −1.043 | 1.75 | 1.81 | 1.93 |
| 13 | −142.69 | −137.42 | 438.61 | 244.01 | 444.45 | 422.82 | 0.098 | 0.046 | −0.223 | −0.130 | −1.126 | −1.043 | 1.63 | 1.86 | 1.84 |
| 14 | −171.53 | −112.67 | 471.00 | 0.00 | 576.38 | 410.98 | 0.148 | 0.052 | −1.165 | −0.035 | −1.301 | −1.015 | 1.71 | 1.77 | 1.82 |
| 15 | −160.92 | −127.32 | 445.09 | 210.46 | 502.13 | 423.29 | 0.122 | −0.009 | −0.515 | −0.044 | −1.187 | −1.032 | 1.82 | 1.90 | 1.97 |
| 16 | −159.00 | −134.92 | 461.59 | 223.41 | 477.94 | 414.56 | 0.257 | 0.009 | −0.338 | 0.336 | −1.107 | −1.035 | 1.73 | 1.83 | 1.76 |
| 17 | −143.10 | −131.07 | 440.86 | 286.25 | 444.66 | 429.95 | 0.095 | 0.046 | −0.192 | −0.081 | −1.143 | −1.037 | 1.59 | 1.75 | 1.78 |
| 18 | −142.07 | −134.16 | 433.47 | 269.95 | 435.98 | 420.46 | 0.097 | 0.042 | −0.206 | −0.120 | −1.120 | −1.041 | 1.72 | 1.76 | 1.69 |
| 19 | −141.58 | −136.14 | 426.96 | 284.40 | 448.15 | 419.41 | 0.098 | 0.044 | −0.231 | −0.136 | −1.127 | −1.043 | 1.74 | 1.72 | 1.85 |
| 20 | −142.49 | −136.91 | 427.86 | 243.89 | 446.08 | 420.84 | 0.098 | 0.045 | −0.228 | −0.134 | −1.131 | −1.043 | 1.49 | 1.67 | 1.89 |
| 21 | −140.36 | −131.63 | 443.63 | 269.70 | 434.24 | 420.15 | 0.093 | 0.038 | −0.249 | −0.132 | −1.126 | −1.036 | 1.66 | 1.76 | 1.87 |
Table 5.
Ratio of DAC.
| Components | Different Kinds of Cable Relaxation | Different Relaxation Location | ||
|---|---|---|---|---|
| Ratio of DAC of Bars | Ratio of DAC of Structure | Ratio of DAC of Bars | Ratio of DAC of Structure | |
| UPR | 1.107 | 1.087 | 1.086 | 1.093 |
| URC | 1.086 | 1.093 | ||
| LRC | 1.137 | 1.159 | ||
| IRC | 1.019 | 1.033 | ||
© 2020 by the authors. Licensee MDPI, Basel, Switzerland. This article is an open access article distributed under the terms and conditions of the Creative Commons Attribution (CC BY) license (http://creativecommons.org/licenses/by/4.0/).
Share and Cite
MDPI and ACS Style
Huang, H.; Xian, Y.; Zhang, W.; Guo, M.; Yang, K.; Xi, K. Analysis of Wind-Induced Vibration of a Spoke-Wise Cable–Membrane Structure. J. Mar. Sci. Eng. 2020, 8, 603. https://doi.org/10.3390/jmse8080603
AMA Style
Huang H, Xian Y, Zhang W, Guo M, Yang K, Xi K. Analysis of Wind-Induced Vibration of a Spoke-Wise Cable–Membrane Structure. Journal of Marine Science and Engineering. 2020; 8(8):603. https://doi.org/10.3390/jmse8080603
Chicago/Turabian StyleHuang, Hua, Yaoqiang Xian, Wei Zhang, Mengxue Guo, Kun Yang, and Kailin Xi. 2020. "Analysis of Wind-Induced Vibration of a Spoke-Wise Cable–Membrane Structure" Journal of Marine Science and Engineering 8, no. 8: 603. https://doi.org/10.3390/jmse8080603
Note that from the first issue of 2016, this journal uses article numbers instead of page numbers. See further details here.