
Clustered DNA Damage Patterns after Proton Therapy Beam Irradiation Using Plasmid DNA

 , , ,
, , ,  ,
,  , ,
, ,  and
and
Abstract
:1. Introduction
2. Results and Discussion
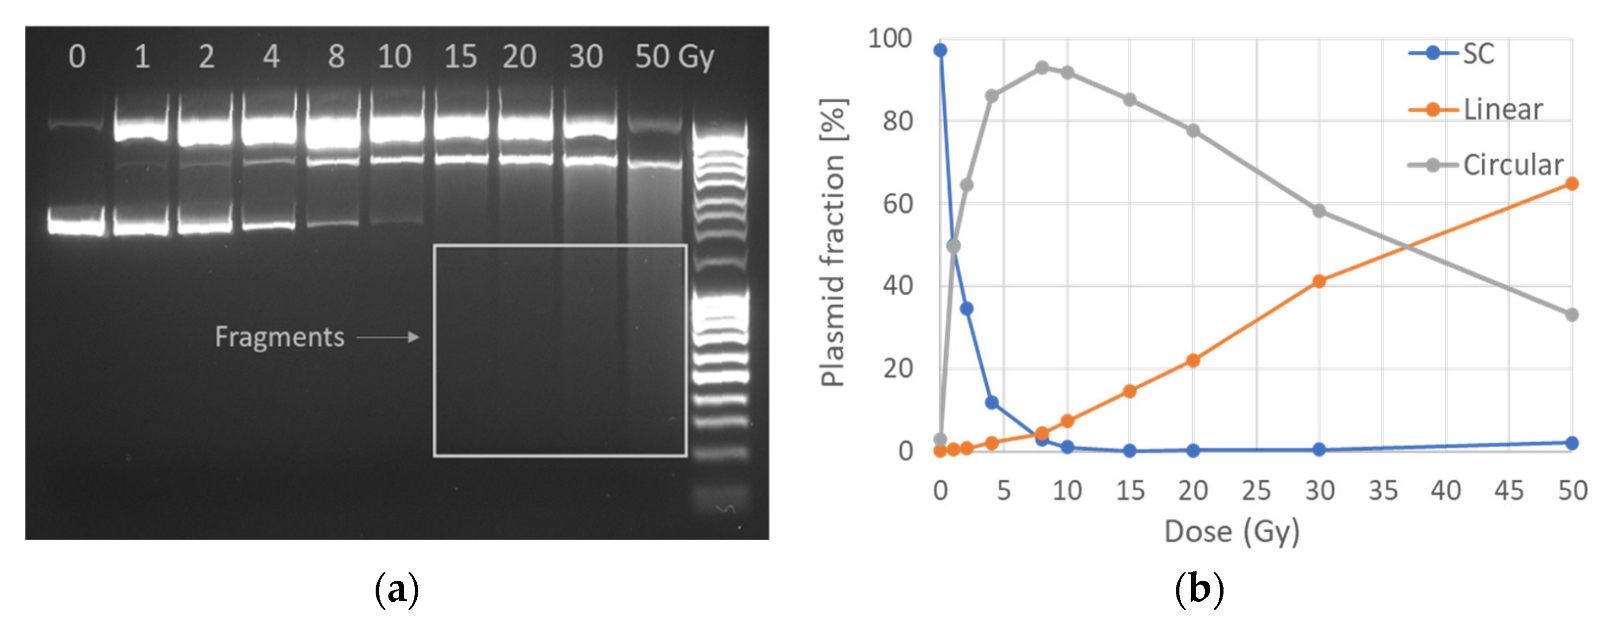
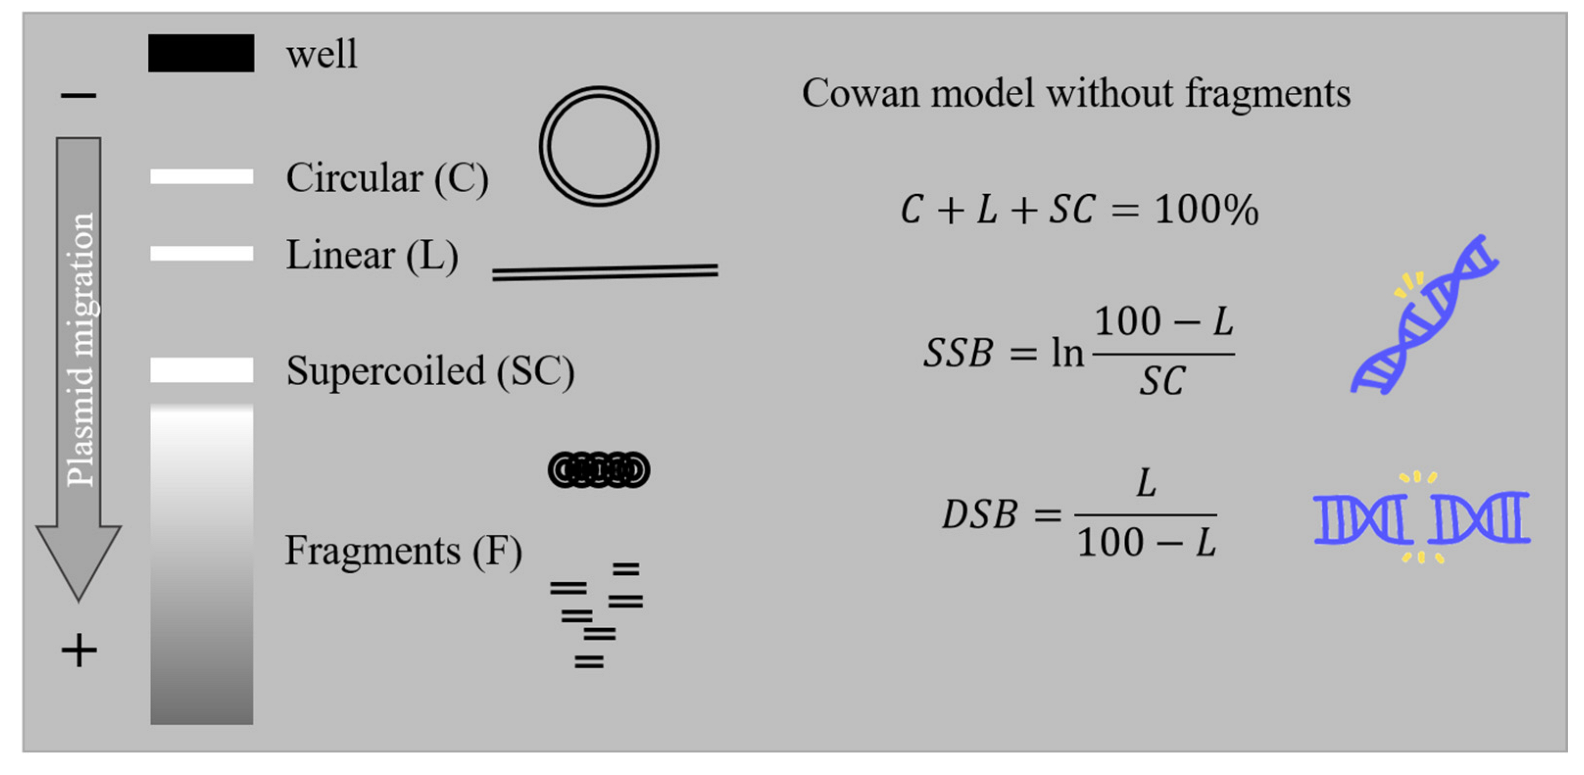
2.1. AGE
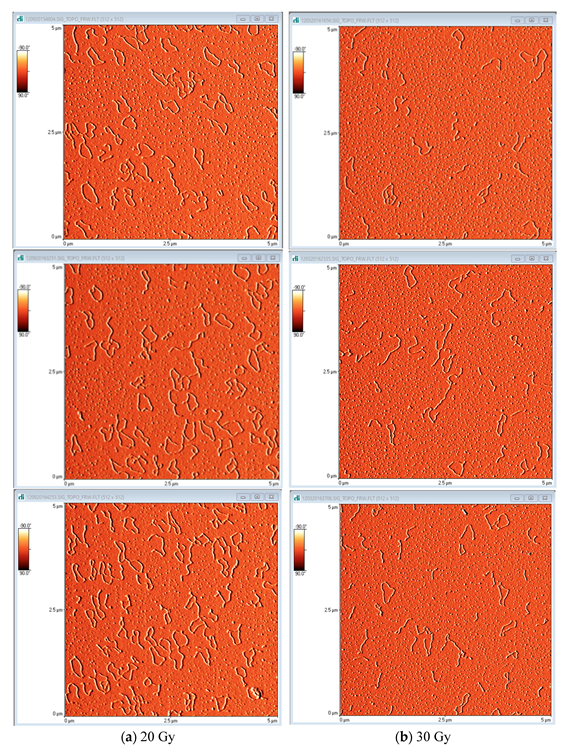
2.2. AFM
3. Materials and Methods
3.1. Sample Preparation
3.2. Irradiation and Dosimetry
3.2.1. Set-Up
3.2.2. Proton Irradiation
3.2.3. X-rays
3.3. Post-Irradiation Treatment—DNA Damage Detection
3.3.1. Agarose Gel Electrophoresis in Tris-Acetate-EDTA (TAE) Buffer
3.3.2. AFM Analysis
4. Conclusions
Author Contributions
Funding
Institutional Review Board Statement
Informed Consent Statement
Data Availability Statement
Conflicts of Interest
Appendix A

| Type Rad/Proton Energy (MeV) | LET (keV/μm) | Scavenger | Plasmid | Plasmid Concentration (ng/μL) | Scav. Capacity (s−1) | SSB Mbp−1 Gy−1 | Error | DSB Mbp−1Gy−1 | Error | Base Lesions Mbp−1 Gy−1 | Error | Non−DSB Clusters Mbp−1 Gy−1 | Error | |
|---|---|---|---|---|---|---|---|---|---|---|---|---|---|---|
| this study | X−rays | no scav (residual TRIS) | pBR322 in solution | 10 | 105 | 89.559 | 4.490 | 3.147 | 0.141 | 191.102 | 10.867 | 14.723 | 0.856 | |
| TRIS | 106 | 30.232 | 1.094 | 0.532 | 0.215 | 65.596 | 3.163 | 3.919 | 0.836 | |||||
| 107 | 4.551 | 0.746 | 0.103 | 0.010 | 18.656 | 3.415 | 0.631 | 0.036 | ||||||
| 108 | 1.135 | 0.300 | 0.108 | 0.077 | 4.654 | 1.005 | 0.263 | 0.026 | ||||||
| C3CA | 106 | 24.306 | 1.194 | 0.606 | 0.109 | 61.223 | 6.884 | 3.991 | −0.054 | |||||
| 107 | 4.921 | 0.108 | 0.117 | 0.011 | 9.562 | 0.111 | 0.726 | 0.037 | ||||||
| 108 | 1.370 | 0.054 | 0.121 | 0.077 | 2.139 | 0.133 | 0.137 | 0.032 | ||||||
| this study | p 198 MeV | 1 | no scav (residual TRIS) | pBR322 in solution | 10 | 105 | 101.101 | 16.868 | 1.914 | 0.247 | 275.852 | 114.295 | 10.908 | 1.778 |
| 1 | TRIS | 106 | 45.848 | 5.031 | 1.534 | 0.247 | 130.510 | 40.667 | 13.270 | 1.411 | ||||
| 1 | 107 | 11.609 | 4.668 | 0.092 | 0.047 | 30.405 | −0.222 | 0.426 | −0.015 | |||||
| 1 | 108 | 2.083 | 1.355 | 0.025 | 0.015 | 5.103 | 0.227 | 0.078 | −0.011 | |||||
| 1 | C3CA | 106 | 34.349 | 4.683 | 0.458 | 0.044 | 75.715 | 16.431 | 3.175 | −0.042 | ||||
| 1 | 107 | 9.434 | 1.499 | 0.163 | 0.022 | 32.678 | 8.270 | 0.658 | 0.023 | |||||
| 1 | 108 | 4.141 | 0.861 | 0.041 | 0.014 | 10.709 | 3.961 | 0.052 | −0.013 | |||||
| p 167−137 MeV | 4 | no scav (residual TRIS) | pBR322 in solution | 10 | 105 | 96.012 | 27.211 | 1.529 | 0.169 | 52.085 | 2.365 | 10.415 | 1.666 | |
| 4 | TRIS | 106 | 39.171 | 0.754 | 0.473 | 0.048 | 74.808 | 5.202 | 2.912 | 0.305 | ||||
| 4 | 107 | 12.888 | 2.234 | 0.096 | 0.035 | 25.294 | 4.359 | 0.509 | 0.039 | |||||
| 4 | 108 | 2.727 | 1.152 | 0.028 | 0.005 | 37.634 | 25.479 | 1.727 | 1.516 | |||||
| 4 | C3CA | 106 | 37.170 | 3.826 | 0.490 | 0.107 | 63.820 | −1.111 | 4.053 | 0.178 | ||||
| 4 | 107 | 9.928 | 2.765 | 0.125 | 0.009 | 18.926 | 0.070 | 0.642 | 0.003 | |||||
| 4 | 108 | 2.220 | 0.786 | 0.039 | 0.006 | 4.596 | 0.446 | 0.081 | 0.005 | |||||
| p 167−137 MeV | 9 | no scav (residual TRIS) | pBR322 in solution | 10 | 105 | 51.069 | 6.923 | 0.579 | 0.060 | 54.453 | 6.350 | 3.255 | 0.092 | |
| 9 | TRIS | 106 | 9.581 | 0.945 | 0.138 | 0.052 | 17.400 | 8.311 | 0.671 | 0.338 | ||||
| 9 | 107 | 2.274 | 0.235 | 0.032 | 0.001 | 3.745 | 1.864 | 0.106 | 0.085 | |||||
| 9 | 108 | 0.299 | 0.089 | 0.005 | 0.009 | 1.269 | 0.619 | 0.115 | 0.121 | |||||
| 9 | C3CA | 106 | 11.545 | 2.456 | 0.172 | 0.036 | 12.770 | 5.628 | 0.716 | 0.481 | ||||
| 9 | 107 | 3.085 | 0.691 | 0.055 | 0.004 | 4.010 | 1.940 | 0.157 | 1.495 | |||||
| 9 | 108 | 0.717 | 0.237 | 0.032 | 0.016 | 0.867 | 0.253 | 0.009 | 0.018 | |||||
| Pachnerová 2015 [32] | p 30 MeV | 1.9 | TE buffer | pBR322 in solution | 1.5 × 10³ | 113.760 | 17.064 | 3.990 | 113.090 | 14.580 | ||||
| C3CA | 6.8 × 10⁵ | 24.790 | 3.718 | 1.930 | 18.020 | 1.540 | ||||||||
| C3CA | 6.8 × 10⁶ | 9.170 | 1.376 | 0.890 | 13.320 | 0.410 | ||||||||
| C3CA | 6.8 × 10⁷ | 1.220 | 0.182 | 0.760 | 3.390 | 0.000 | ||||||||
| Sui 2013 [33] | p 15 MeV | 3.6 | TRIS−HCl | pUC19 in solution | 100 | 3 × 10⁸ | 9.950 | 0.790 | 0.064 | 0.009 | 16.560 | 1.400 | 0.100 | 0.016 |
| Leloup 2005 [34] | p 249 MeV | 0.39 | glycerol | pHAZE liquid film | 3.8 × 10⁶ | 18.850 | 3.900 | 0.338 | 0.039 | 1.495 | 0.260 | |||
| p 19.3 MeV | 2.7 | 3.8 × 10⁶ | 5.005 | 1.950 | 0.104 | 0.026 | 0.377 | 0.163 | ||||||
| p 1.03 MeV | 25.5 | 3.8 × 10⁶ | 1.690 | 0.260 | 0.163 | 0.020 | 0.533 | 0.130 | ||||||
| p 249 MeV | 0.39 | glycerol | 3.8 × 10⁸ | 0.917 | 0.195 | 0.029 | 0.006 | 0.176 | 0.026 | |||||
| p 19.3 MeV | 2.7 | 3.8 × 10⁸ | 0.397 | 0.091 | 0.011 | 0.004 | 0.037 | 0.020 | ||||||
| p 1.03 MeV | 25.5 | 3.8 × 10⁸ | 0.384 | 0.059 | 0.018 | 0.002 | 0.085 | 0.020 | ||||||
| Vyšín 2015 [50] | p 10 MeV | 6.39 | TE buffer | pBR322 dry | 30 | 0.009 | 0.007 | 0.003 | 0.001 | 0.082 | 0.001 | |||
| p 20 MeV | 3.64 | 0.053 | 0.000 | 0.001 | 0.001 | 0.088 | 0.006 | |||||||
| p 30 MeV | 2.61 | 0.044 | 0.006 | 0.001 | 0.000 | 0.088 | 0.004 | |||||||
| p 20 MeV | 3.1−6.95 | TE buffer | pBR322 liquid | 58.900 | 2.600 | 2.000 | 0.200 | 45.800 | 4.500 | |||||
| p 30 MeV | 1.96−2.34 | 39.700 | 8.200 | 1.500 | 0.800 | 45.900 | 3.900 | |||||||
| Ohsawa 2021 [51] | p 27.5 MeV | 2.3 | TE buffer | pBR322 in solution | 50 | 2.476 | 0.032 | 0.027 | 0.005 | |||||
| p 27.5 MeV FLASH | 2.3 | 2.016 | 0.156 | 0.025 | 0.004 | |||||||||
| Small 2021 [52] | e 100 MeV | no scav | pBR322 in solution | 15.420 | 0.860 | 0.350 | 0.020 | |||||||
| e 100 MeV FLASH | 20.310 | 0.200 | 0.370 | 0.030 | ||||||||||
| e 150 MeV | 17.630 | 0.570 | 0.350 | 0.030 | ||||||||||
| e 150 MeV FLASH | 18.740 | 0.520 | 0.370 | 0.040 | ||||||||||
| e 200 MeV | 20.190 | 0.560 | 0.380 | 0.020 | ||||||||||
| e 200 MeV FLASH | 21.220 | 0.380 | 0.380 | 0.020 | ||||||||||
| e 100 MeV | 0.22 | pBR322 dry | 69.810 | 8.720 | 3.660 | 0.430 | ||||||||
| e 150 MeV | 0.22 | 80.300 | 3.060 | 3.710 | 0.110 | |||||||||
| e 200 MeV | 0.23 | 50.270 | 4.190 | 3.830 | 0.450 | |||||||||
| Small 2019 [53] | 60−Co − 6 MeV | 0.19 | no scav | pBR322 | 7.940 | 0.140 | 0.970 | 0.100 | ||||||
| 60−Co − 10 MeV | 0.20 | 11.000 | 0.660 | 1.130 | 0.080 | |||||||||
| 60−Co − 15 MeV | 0.20 | 7.710 | 0.030 | 1.220 | 0.010 | |||||||||
| Pachnerová 2019 [28] | Carbon ions 400 MeV/u | 11 | TE buffer | pBR322 | 10 | 1.5 × 10³ | 128.600 | 1.900 | 4.800 | 0.400 | ||||
| Souici 2016 [54] | Ultra Soft X−rays 1.5 keV | TRIS | pBR322 | 5 | 1.5 × 10⁶ | 2.477 | 0.130 | 0.228 | 0.026 | |||||
| 1.5 × 10⁷ | 0.780 | 0.059 | ||||||||||||
| 1.5 × 10⁸ | 0.163 | 0.072 | ||||||||||||
| 10 | 1.5 × 10⁶ | 2.386 | 0.052 | 0.208 | 0.020 | |||||||||
| 1.5 × 10⁷ | 0.845 | 0.013 | ||||||||||||
| 1.5 × 10⁸ | 0.182 | 0.020 | ||||||||||||
| 50 | 1.5 × 10⁶ | 2.106 | 0.091 | 0.137 | 0.013 | |||||||||
| 1.5 × 10⁷ | 0.800 | 0.039 | ||||||||||||
| 1.5 × 10⁸ | 0.228 | 0.026 | ||||||||||||
| Shiina 2013 [55] | X−rays | TRIS | pUC18 in solution | 50 | 1 × 10⁶ | 5.720 | 0.111 | 9.035 | 0.481 | |||||
| 1.5 × 10⁷ | 1.105 | 0.029 | 1.430 | 0.092 | ||||||||||
| 3 × 10⁸ | 0.163 | 0.008 | 0.650 | 0.020 | ||||||||||
| 1 × 10¹⁰ | 0.124 | 0.010 | ||||||||||||
| C6+ 290 MeV | 13 | TRIS | pUC18 in solution | 50 | 1 × 10⁶ | 5.590 | 0.228 | 4.290 | 0.481 | |||||
| 1.5 × 10⁷ | 1.300 | 0.008 | 2.795 | 0.182 | ||||||||||
| 3 × 10⁸ | 0.325 | 0.013 | 1.300 | 0.059 | ||||||||||
| Ushigome 2012 [56] | He2+ | 2.2 | pUC18 hydrated films | 0.058 | 0.013 | 0.005 | 0.001 | 0.141 | 0.004 | |||||
| 6 | 0.064 | 0.012 | 0.004 | 0.001 | 0.169 | 0.007 | ||||||||
| C5+, C6+ | 13 | pUC18 hydrated films | 0.107 | 0.026 | 0.008 | 0.004 | 0.255 | 0.009 | ||||||
| 87 | 0.040 | 0.003 | 0.003 | 0.000 | 0.057 | 0.003 | ||||||||
| 122 | 0.037 | 0.003 | 0.004 | 0.000 | 0.074 | 0.004 | ||||||||
| 342 | 0.030 | 0.004 | 0.005 | 0.000 | 0.047 | 0.001 | ||||||||
| 507 | 0.033 | 0.003 | 0.005 | 0.001 | 0.061 | 0.000 | ||||||||
| Ne10+ | 31 | pUC18 hydrated films | 0.092 | 0.023 | 0.005 | 0.001 | 0.180 | 0.006 | ||||||
| 361 | 0.038 | 0.003 | 0.007 | 0.001 | 0.066 | 0.002 | ||||||||
| 491 | 0.031 | 0.001 | 0.007 | 0.001 | 0.067 | 0.002 | ||||||||
| 842 | 0.031 | 0.005 | 0.008 | 0.001 | 0.038 | 0.002 | ||||||||
| Urushibara 2008 [57] | gamma 60−Co | pUC18 | 0.047 | 0.003 | 0.005 | 0.000 | 0.138 | 0.014 | ||||||
| α He | 19 | pUC18 | 0.045 | 0.007 | 0.002 | 0.001 | 0.166 | 0.006 | ||||||
| α He | 63 | 0.047 | 0.001 | 0.005 | 0.001 | 0.085 | 0.006 | |||||||
| α He | 95 | 0.044 | 0.002 | 0.007 | 0.000 | 0.047 | 0.004 | |||||||
| α He | 121 | 0.031 | 0.003 | 0.003 | 0.001 | 0.040 | 0.003 | |||||||
| α He | 148 | 0.025 | 0.002 | 0.006 | 0.000 | 0.012 | 0.002 | |||||||
| Yokoya 2003 [57] | α Pu | 0.039 | 0.006 | 0.011 | 0.001 | 0.016 | 0.003 | |||||||
| Klimczak 1993 [58] | gamma 60−Co | pBR322 | 100 | 1.5 × 10⁶ | 26.00 | 0.26 | ||||||||
| 1.5 × 10⁷ | 5.85 | 0.07 | ||||||||||||
| 1.5 × 10⁸ | 1.30 | 0.02 |

References
- Nikitaki, Z.; Velalopoulou, A.; Zanni, V.; Tremi, I.; Havaki, S.; Kokkoris, M.; Gorgoulis, V.G.; Koumenis, C.; Georgakilas, A.G. Key biological mechanisms involved in high-LET radiation therapies with a focus on DNA damage and repair. Expert Rev. Mol. Med. 2022, 24, e15. [Google Scholar] [CrossRef] [PubMed]
- Ward, J.F. DNA Damage Produced by Ionizing Radiation in Mammalian Cells: Identities, Mechanisms of Formation, and Reparability. In Progress in Nucleic Acid Research and Molecular Biology; Cohn, W.E., Moldave, K., Eds.; Academic Press: New York, NY, USA, 1988; Volume 35, pp. 95–125. [Google Scholar]
- Ward, J.F. The complexity of DNA damage: Relevance to biological consequences. Int. J. Radiat. Biol. 1994, 66, 427–432. [Google Scholar] [CrossRef] [PubMed]
- Sage, E.; Harrison, L. Clustered DNA lesion repair in eukaryotes: Relevance to mutagenesis and cell survival. Mutat. Res. 2011, 711, 123–133. [Google Scholar] [CrossRef] [PubMed] [Green Version]
- Asaithamby, A.; Hu, B.; Chen, D.J. Unrepaired clustered DNA lesions induce chromosome breakage in human cells. Proc. Natl. Acad. Sci. USA 2011, 108, 8293–8298. [Google Scholar] [CrossRef] [Green Version]
- Mavragani, I.V.; Nikitaki, Z.; Kalospyros, S.A.; Georgakilas, A.G. Ionizing Radiation and Complex DNA Damage: From Prediction to Detection Challenges and Biological Significance. Cancers 2019, 11, 1789. [Google Scholar] [CrossRef] [Green Version]
- Schipler, A.; Mladenova, V.; Soni, A.; Nikolov, V.; Saha, J.; Mladenov, E.; Iliakis, G. Chromosome thripsis by DNA double strand break clusters causes enhanced cell lethality, chromosomal translocations and 53BP1-recruitment. Nucleic Acids Res. 2016, 44, 7673–7690. [Google Scholar] [CrossRef] [Green Version]
- Sutherland, B.M.; Bennett, P.V.; Sidorkina, O.; Laval, J. Clustered Damages and Total Lesions Induced in DNA by Ionizing Radiation: Oxidized Bases and Strand Breaks. Biochemistry 2000, 39, 8026–8031. [Google Scholar] [CrossRef]
- Hada, M.; Georgakilas, A.G. Formation of clustered DNA damage after high-LET irradiation: A review. J. Radiat. Res. 2008, 49, 203–210. [Google Scholar] [CrossRef]
- Fakir, H.; Sachs, R.K.; Stenerlöw, B.; Hofmann, W. Clusters of DNA double-strand breaks induced by different doses of nitrogen ions for various LETs: Experimental measurements and theoretical analyses. Radiat. Res. 2006, 166, 917–927. [Google Scholar] [CrossRef]
- Asaithamby, A.; Chen, D.J. Mechanism of cluster DNA damage repair in response to high-atomic number and energy particles radiation. Mutat. Res. 2011, 711, 87–99. [Google Scholar] [CrossRef]
- Lorat, Y.; Brunner, C.U.; Schanz, S.; Jakob, B.; Taucher-Scholz, G.; Rübe, C.E. Nanoscale analysis of clustered DNA damage after high-LET irradiation by quantitative electron microscopy—The heavy burden to repair. DNA Repair 2015, 28, 93–106. [Google Scholar] [CrossRef] [PubMed]
- Nikitaki, Z.; Nikolov, V.; Mavragani, I.V.; Mladenov, E.; Mangelis, A.; Laskaratou, D.A.; Fragkoulis, G.I.; Hellweg, C.E.; Martin, O.A.; Emfietzoglou, D.; et al. Measurement of complex DNA damage induction and repair in human cellular systems after exposure to ionizing radiations of varying linear energy transfer (LET). Free Radic. Res. 2016, 50, S64–S78. [Google Scholar] [CrossRef] [PubMed] [Green Version]
- Kalospyros, S.A.; Gika, V.; Nikitaki, Z.; Kalamara, A.; Kyriakou, I.; Emfietzoglou, D.; Kokkoris, M.; Georgakilas, A.G. Monte Carlo Simulation-Based Calculations of Complex DNA Damage for Incidents of Environmental Ionizing Radiation Exposure. Appl. Sci. 2021, 11, 8985. [Google Scholar] [CrossRef]
- Surdutovich, E.; Solov’yov, A.V. Multiscale approach to the physics of radiation damage with ions. Eur. Phys. J. D 2014, 68, 353. [Google Scholar] [CrossRef] [Green Version]
- Surdutovich, E.; Gallagher, D.C.; Solov’yov, A.V. Calculation of complex DNA damage induced by ions. Phys. Rev. E Stat. Nonlinear Soft Matter Phys. 2011, 84, 051918. [Google Scholar] [CrossRef] [PubMed] [Green Version]
- Ray, S.; Cekanaviciute, E.; Lima, I.P.; Sørensen, B.S.; Costes, S.V. Comparing Photon and Charged Particle Therapy Using DNA Damage Biomarkers. Int. J. Part. Ther. 2018, 5, 15–24. [Google Scholar] [CrossRef] [Green Version]
- Carter, R.J.; Nickson, C.M.; Thompson, J.M.; Kacperek, A.; Hill, M.A.; Parsons, J.L. Complex DNA Damage Induced by High Linear Energy Transfer Alpha-Particles and Protons Triggers a Specific Cellular DNA Damage Response. Int. J. Radiat. Oncol. Biol. Phys. 2018, 100, 776–784. [Google Scholar] [CrossRef] [Green Version]
- Chaudhary, P.; Marshall, T.I.; Currell, F.J.; Kacperek, A.; Schettino, G.; Prise, K.M. Variations in the Processing of DNA Double-Strand Breaks Along 60-MeV Therapeutic Proton Beams. Int. J. Radiat. Oncol. Biol. Phys. 2016, 95, 86–94. [Google Scholar] [CrossRef] [Green Version]
- Dizdaroglu, M.; Jaruga, P. Mechanisms of free radical-induced damage to DNA. Free Radic. Res. 2012, 46, 382–419. [Google Scholar] [CrossRef]
- Le Caër, S. Water Radiolysis: Influence of Oxide Surfaces on H2 Production under Ionizing Radiation. Water 2011, 3, 235–253. [Google Scholar] [CrossRef]
- Peddi, P.; Loftin, C.W.; Dickey, J.S.; Hair, J.M.; Burns, K.J.; Aziz, K.; Francisco, D.C.; Panayiotidis, M.I.; Sedelnikova, O.A.; Bonner, W.M.; et al. DNA-PKcs deficiency leads to persistence of oxidatively induced clustered DNA lesions in human tumor cells. Free Radic. Biol. Med. 2010, 48, 1435–1443. [Google Scholar] [CrossRef] [PubMed] [Green Version]
- LaVerne, J.A.; Pimblott, S.M. Yields of hydroxyl radical and hydrated electron scavenging reactions in aqueous solutions of biological interest. Radiat. Res. 1993, 135, 16–23. [Google Scholar] [CrossRef] [PubMed]
- Pang, D.; Thierry, A.R.; Dritschilo, A. DNA studies using atomic force microscopy: Capabilities for measurement of short DNA fragments. Front. Mol. Biosci. 2015, 2, 1. [Google Scholar] [CrossRef] [PubMed] [Green Version]
- Pyne, A.L.B.; Noy, A.; Main, K.H.S.; Velasco-Berrelleza, V.; Piperakis, M.M.; Mitchenall, L.A.; Cugliandolo, F.M.; Beton, J.G.; Stevenson, C.E.M.; Hoogenboom, B.W.; et al. Base-pair resolution analysis of the effect of supercoiling on DNA flexibility and major groove recognition by triplex-forming oligonucleotides. Nat. Commun. 2021, 12, 1053. [Google Scholar] [CrossRef] [PubMed]
- Melters, D.P.; Dalal, Y. Nano-Surveillance: Tracking Individual Molecules in a Sea of Chromatin. J. Mol. Biol. 2021, 433, 166720. [Google Scholar] [CrossRef]
- Küpeli Akkol, E.; Genç, Y.; Karpuz, B.; Sobarzo-Sánchez, E.; Capasso, R. Coumarins and Coumarin-Related Compounds in Pharmacotherapy of Cancer. Cancers 2020, 12, 1959. [Google Scholar] [CrossRef]
- Pachnerová Brabcová, K.; Sihver, L.; Ukraintsev, E.; Štěpán, V.; Davídková, M. HOW DETECTION OF PLASMID DNA FRAGMENTATION AFFECTS RADIATION STRAND BREAK YIELDS. Radiat. Prot. Dosim. 2019, 183, 89–92. [Google Scholar] [CrossRef]
- Pouget, J.P.; Frelon, S.; Ravanat, J.L.; Testard, I.; Odin, F.; Cadet, J. Formation of modified DNA bases in cells exposed either to gamma radiation or to high-LET particles. Radiat. Res. 2002, 157, 589–595. [Google Scholar] [CrossRef]
- Nikitaki, Z.; Hellweg, C.E.; Georgakilas, A.G.; Ravanat, J.-L. Stress-induced DNA damage biomarkers: Applications and limitations. Front. Chem. 2015, 3, 35. [Google Scholar] [CrossRef] [Green Version]
- Ravanat, J.L.; Breton, J.; Douki, T.; Gasparutto, D.; Grand, A.; Rachidi, W.; Sauvaigo, S. Radiation-mediated formation of complex damage to DNA: A chemical aspect overview. Br. J. Radiol. 2014, 87, 20130715. [Google Scholar] [CrossRef]
- Pachnerová Brabcová, K.; Štěpán, V.; Karamitros, M.; Karabín, M.; Dostálek, P.; Incerti, S.; Davídková, M.; Sihver, L. Contribution of indirect effects to clustered damage in DNA irradiated with protons. Radiat. Prot. Dosim. 2015, 166, 44–48. [Google Scholar] [CrossRef]
- Sui, L.; Wang, Y.; Wang, X.; Kong, F.; Liu, J.; Zhou, P. Clustered DNA damage induced by protons radiation in plasmid DNA. Chin. Sci. Bull. 2013, 58, 3217–3223. [Google Scholar] [CrossRef] [Green Version]
- Leloup, C.; Garty, G.; Assaf, G.; Cristovão, A.; Breskin, A.; Chechik, R.; Shchemelinin, S.; Paz-Elizur, T.; Livneh, Z.; Schulte, R.W.; et al. Evaluation of lesion clustering in irradiated plasmid DNA. Int. J. Radiat. Biol. 2005, 81, 41–54. [Google Scholar] [CrossRef] [PubMed]
- Chapman, J.D.; Reuvers, A.P.; Borsa, J.; Greenstock, C.L. Chemical Radioprotection and Radiosensitization of Mammalian Cells Growing in Vitro. Radiat. Res. 1973, 56, 291–306. [Google Scholar] [CrossRef]
- Roots, R.; Okada, S. Estimation of Life Times and Diffusion Distances of Radicals Involved in X-Ray-Induced DNA Strand Breaks or Killing of Mammalian Cells. Radiat. Res. 1975, 64, 306–320. [Google Scholar] [CrossRef]
- Dang, H.M.; van Goethem, M.J.; van der Graaf, E.R.; Brandenburg, S.; Hoekstra, R.; Schlathölter, T. Heavy ion induced damage to plasmid DNA: Plateau region vs. spread out Bragg-peak. Eur. Phys. J. D 2011, 63, 359–367. [Google Scholar] [CrossRef]
- Dang, H.M.; van Goethem, M.J.; van der Graaf, E.R.; Brandenburg, S.; Hoekstra, R.; Schlathölter, T. Plasmid DNA damage by heavy ions at spread-out Bragg peak energies. Eur. Phys. J. D 2010, 60, 51–58. [Google Scholar] [CrossRef]
- Vanderwaeren, L.; Dok, R.; Verstrepen, K.; Nuyts, S. Clinical Progress in Proton Radiotherapy: Biological Unknowns. Cancers 2021, 13, 604. [Google Scholar] [CrossRef]
- Paganetti, H. Relative biological effectiveness (RBE) values for proton beam therapy. Variations as a function of biological endpoint, dose, and linear energy transfer. Phys. Med. Biol. 2014, 59, R419–R472. [Google Scholar] [CrossRef]
- Yamashita, S.; Baldacchino, G.; Maeyama, T.; Taguchi, M.; Muroya, Y.; Lin, M.; Kimura, A.; Murakami, T.; Katsumura, Y. Mechanism of radiation-induced reactions in aqueous solution of coumarin-3-carboxylic acid: Effects of concentration, gas and additive on fluorescent product yield. Free Radic. Res. 2012, 46, 861–871. [Google Scholar] [CrossRef]
- Hicks, M.; Gebicki, J.M. Rate constants for reaction of hydroxyl radicals with Tris, Tricine and Hepes buffers. FEBS Lett. 1986, 199, 92–94. [Google Scholar] [CrossRef] [Green Version]
- Wéra, A.C.; Heuskin, A.C.; Riquier, H.; Michiels, C.; Lucas, S. Low-LET proton irradiation of A549 non-small cell lung adenocarcinoma cells: Dose response and RBE determination. Radiat. Res. 2013, 179, 273–281. [Google Scholar] [CrossRef] [PubMed]
- Sutherland, B.M.; Bennett, P.V.; Sidorkina, O.; Laval, J. Clustered DNA damages induced in isolated DNA and in human cells by low doses of ionizing radiation. Proc. Natl. Acad. Sci. USA 2000, 97, 103. [Google Scholar] [CrossRef] [PubMed] [Green Version]
- Cowan, R.; Collis, C.M.; Grigg, G.W. Breakage of double-stranded DNA due to single-stranded nicking. J. Theor. Biol. 1987, 127, 229–245. [Google Scholar] [CrossRef]
- Śmiałek, M.A. Early models of DNA damage formation. J. Phys. Conf. Ser. 2012, 373, 012013. [Google Scholar] [CrossRef] [Green Version]
- Bezanilla, M.; Manne, S.; Laney, D.E.; Lyubchenko, Y.L.; Hansma, H.G. Adsorption of DNA to Mica, Silylated Mica, and Minerals: Characterization by Atomic Force Microscopy. Langmuir 1995, 11, 655–659. [Google Scholar] [CrossRef]
- Pachnerová Brabcová, K.; Sihver, L.; Ukraintsev, E.; Štěpán, V.; Davídková, M. Length computation of irradiated plasmid DNA molecules. Biointerphases 2018, 13, 061005. [Google Scholar] [CrossRef]
- Obeidat, M.; McConnell, K.A.; Li, X.; Bui, B.; Stathakis, S.; Papanikolaou, N.; Rasmussen, K.; Ha, C.S.; Lee, S.E.; Shim, E.Y.; et al. DNA double-strand breaks as a method of radiation measurements for therapeutic beams. Med. Phys. 2018, 45, 3460–3465. [Google Scholar] [CrossRef]
- Vyšín, L.; Pachnerová Brabcová, K.; Štěpán, V.; Moretto-Capelle, P.; Bugler, B.; Legube, G.; Cafarelli, P.; Casta, R.; Champeaux, J.P.; Sence, M.; et al. Proton-induced direct and indirect damage of plasmid DNA. Radiat. Environ. Biophys. 2015, 54, 343–352. [Google Scholar] [CrossRef]
- Ohsawa, D.; Hiroyama, Y.; Kobayashi, A.; Kusumoto, T.; Kitamura, H.; Hojo, S.; Kodaira, S.; Konishi, T. DNA strand break induction of aqueous plasmid DNA exposed to 30 MeV protons at ultra-high dose rate. J. Radiat. Res. 2021, 63, 255–260. [Google Scholar] [CrossRef]
- Small, K.L.; Henthorn, N.T.; Angal-Kalinin, D.; Chadwick, A.L.; Santina, E.; Aitkenhead, A.; Kirkby, K.J.; Smith, R.J.; Surman, M.; Jones, J.; et al. Evaluating very high energy electron RBE from nanodosimetric pBR322 plasmid DNA damage. Sci. Rep. 2021, 11, 1–12. [Google Scholar] [CrossRef] [PubMed]
- Small, K.L.; Henthorn, N.T.; Angal-Kalinin, D.; Chadwick, A.; Edge, R.; Henthorn, N.T.; Jones, R.M.; Kirkby, K.; Merchant, M.J.; Morris, R.; et al. A Comparative Study of Biological Effects of Electrons and Co-60 Gamma Rays on pBR322 Plasmid DNA. In Proceedings of the IPAC2019, Melbourne, Australia, 19–24 May 2019; pp. 3533–3536. [Google Scholar]
- Souici, M.; Khalil, T.T.; Boulanouar, O.; Belafrites, A.; Mavon, C.; Fromm, M. DNA strand break dependence on Tris and arginine scavenger concentrations under ultra-soft X-ray irradiation: The contribution of secondary arginine radicals. Radiat. Environ. Biophys. 2016, 55, 215–228. [Google Scholar] [CrossRef] [PubMed]
- Shiina, T.; Watanabe, R.; Shiraishi, I.; Suzuki, M.; Sugaya, Y.; Fujii, K.; Yokoya, A. Induction of DNA damage, including abasic sites, in plasmid DNA by carbon ion and X-ray irradiation. Radiat. Environ. Biophys. 2013, 52, 99–112. [Google Scholar] [CrossRef] [PubMed]
- Ushigome, T.; Shikazono, N.; Fujii, K.; Watanabe, R.; Suzuki, M.; Tsuruoka, C.; Tauchi, H.; Yokoya, A. Yield of single- and double-strand breaks and nucleobase lesions in fully hydrated plasmid DNA films irradiated with high-LET charged particles. Radiat. Res. 2012, 177, 614–627. [Google Scholar] [CrossRef]
- Urushibara, A.; Shikazono, N.; O’Neill, P.; Fujii, K.; Wada, S.; Yokoya, A. LET dependence of the yield of single-, double-strand breaks and base lesions in fully hydrated plasmid DNA films by 4He(2+) ion irradiation. Int. J. Radiat. Biol. 2008, 84, 23–33. [Google Scholar] [CrossRef]
- Klimczak, U.; Ludwig, D.C.; Mark, F.; Rettberg, P.; Schulte-Frohlinde, D. Irradiation of plasmid and phage DNA in water-alcohol mixtures: Strand breaks and lethal damage as a function of scavenger concentration. Int. J. Radiat. Biol. 1993, 64, 497–510. [Google Scholar] [CrossRef]


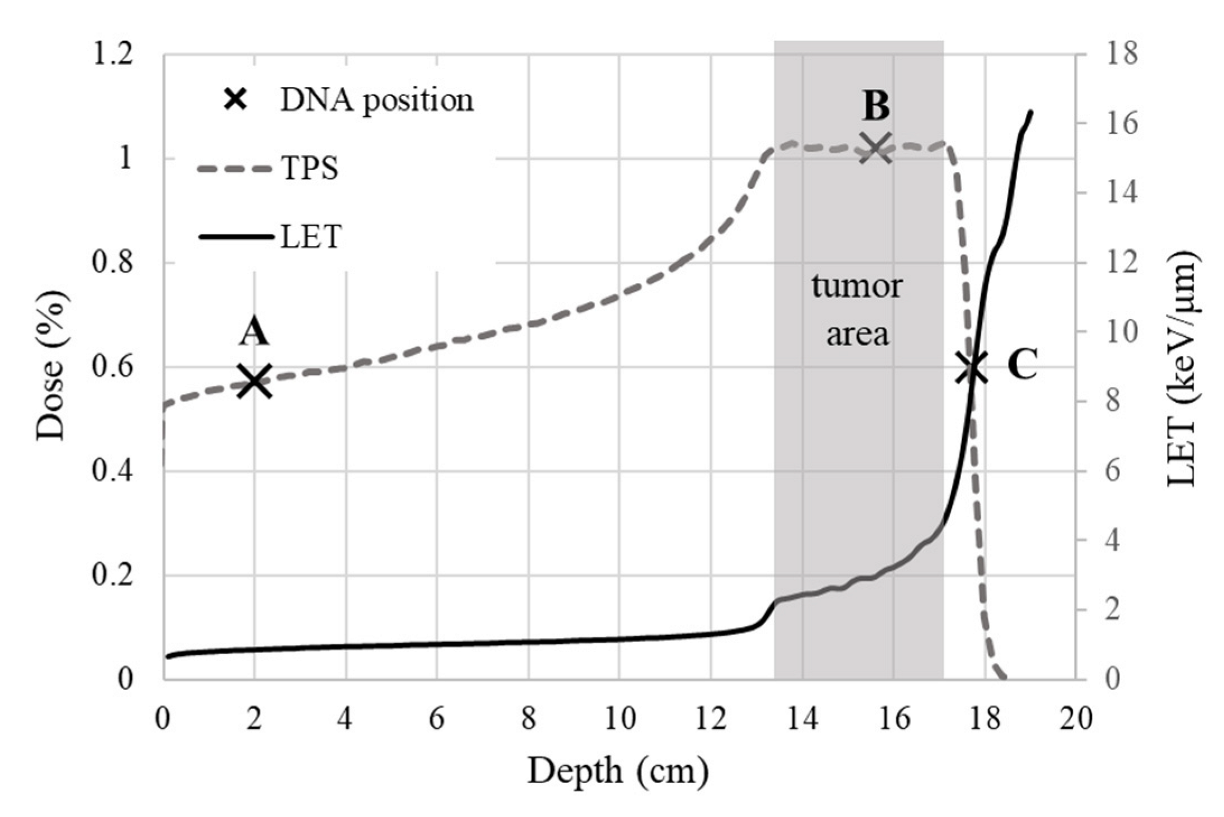
| Irradiation Position | Depth in PMMA (cm) | LET (keV/μm) | Energy Range (MeV) |
|---|---|---|---|
| A—beam entrance | 2 | 1 | 198 |
| B—plateau of SOBP | 15 | 3 | 137–167 |
| C—tail of SOBP | 16.8 | 9 | 137–167 |
Publisher’s Note: MDPI stays neutral with regard to jurisdictional claims in published maps and institutional affiliations. |
© 2022 by the authors. Licensee MDPI, Basel, Switzerland. This article is an open access article distributed under the terms and conditions of the Creative Commons Attribution (CC BY) license (https://creativecommons.org/licenses/by/4.0/).
Share and Cite
Souli, M.P.; Nikitaki, Z.; Puchalska, M.; Brabcová, K.P.; Spyratou, E.; Kote, P.; Efstathopoulos, E.P.; Hada, M.; Georgakilas, A.G.; Sihver, L. Clustered DNA Damage Patterns after Proton Therapy Beam Irradiation Using Plasmid DNA. Int. J. Mol. Sci. 2022, 23, 15606. https://doi.org/10.3390/ijms232415606
Souli MP, Nikitaki Z, Puchalska M, Brabcová KP, Spyratou E, Kote P, Efstathopoulos EP, Hada M, Georgakilas AG, Sihver L. Clustered DNA Damage Patterns after Proton Therapy Beam Irradiation Using Plasmid DNA. International Journal of Molecular Sciences. 2022; 23(24):15606. https://doi.org/10.3390/ijms232415606
Chicago/Turabian StyleSouli, Maria P., Zacharenia Nikitaki, Monika Puchalska, Kateřina Pachnerová Brabcová, Ellas Spyratou, Panagiotis Kote, Efstathios P. Efstathopoulos, Megumi Hada, Alexandros G. Georgakilas, and Lembit Sihver. 2022. "Clustered DNA Damage Patterns after Proton Therapy Beam Irradiation Using Plasmid DNA" International Journal of Molecular Sciences 23, no. 24: 15606. https://doi.org/10.3390/ijms232415606