Article

RBS, PIXE, Ion-Microbeam and SR-FTIR Analyses of Pottery Fragments from Azerbaijan

1
Dipartimento di Scienze Matematiche e Informatiche, Scienze Fisiche e Scienze della Terra, Università degli Studi di Messina, Viale Ferdinando Stagno d’Alcontres 31, 98166 S. Agata, Messina, Italy
2
Dipartimento di Scienze Chimiche, Biologiche, Farmaceutiche ed Ambientali, Università degli Studi di Messina, Viale Ferdinando Stagno d’Alcontres 31, 98166 S. Agata, Messina, Italy
3
Nuclear Physics Institute, ASCR, 25068 Rez, Czech Republic
4
Dipartimento di Biologia, Ecologia e Scienze della Terra, Università degli Studi della Calabria, Via Pietro Bucci, 87036 Arcavacata di Rende (CS), Italy
5
Elettra Sincrotrone Trieste, Strada Statale 14 km 163, 5 in AREA Science Park, 34149 Basovizza, Trieste, Italy
6
YOuth in COnservation of CUltural Heritage, YOCOCU, 00175 Rome, Italy
7
MIRAS Social Organization in Support of Studying of Cultural Heritage, AZ 1001 Baku, Azerbaijan
*
Author to whom correspondence should be addressed.
These authors contributed equally to this work.
Heritage 2019, 2(3), 1852-1873; https://doi.org/10.3390/heritage2030113
Submission received: 6 June 2019 / Revised: 1 July 2019 / Accepted: 8 July 2019 / Published: 10 July 2019
(This article belongs to the Section Cultural Heritage)

Abstract

:
The present work is aimed at the investigation of the ceramic bulk and pigmented glazed surfaces of ancient potteries dating back to XIX century A.D. and coming from the charming archeological site located in the Medieval Agsu town (Azerbaijan), a geographic area of special interest due to the ancient commercial routes between China, Asia Minor, and Europe. For the purpose of the study, complementary investigation tools have been exploited: non-destructive or micro-destructive investigation at elemental level by ion beam analysis (IBA) techniques, by using Rutherford Backscattering Spectrometry (RBS), Proton-Induced X-ray Emission (PIXE) spectroscopy and ion-microbeam analysis, and chemical characterization at microscopic level, by means of synchrotron radiation (SR) Fourier transform infrared (FTIR) microspectroscopy. The acquired information reveals useful for the identification of the provenance, the reconstruction of the firing technology, and finally, the identification of the pigment was used as a colorant of the glaze.

1. Introduction

Pottery represents the most abundant finds in the archaeological excavations and its appearance (vessel shape, style) is highly influenced by the cultural-social changes. Thus, the scientific investigation of ancient potteries, i.e., the analysis of their mineralogical, chemical, and physical properties, represents a first crucial step in order to achieve information on many aspects of the past including provenance, dating, trade, and technology [1,2,3]. Their study can therefore be useful in identifying specific cultural groups and their mutual influences are of great relevance from both restoration and conservation perspectives.
Nevertheless, the characterization of archaeological pottery is a rather difficult procedure due to the presence of a variety of minerals and to the complex features of the firing process [4,5]. Furthermore, decorated potteries are even more complex to be analyzed, because of the difficulty to isolate the glazed layer from the bulk paste [6]. In fact, in the brushwork, the pigment mixes with the matrix and the earthenware can absorb some dye substances. Furthermore, since glazes and ceramic bodies are in close contact, they react chemically and physically during the firing process. Therefore, chemical reactions of individual components take place, change the chemical composition, and if the firing process is long enough lead to the formation of interlayers on interfaces. In such cases, the use of multi-analytical techniques, preserving the integrity of the object as much as possible, has revealed successful in order to define raw materials and pigments used for the production of some representative pottery samples [7,8,9]. The gained information has allowed scientists to answer key questions related to the discrimination of the local products from the imported ones, as well as to the identification of workshops or production technologies.
The Medieval Agsu town is an Azerbaijan’s important archaeological site situated 4–5 km away in the South-East from the town of Agsu, at about 160 km west far from Baku, the capital of Azerbaijan. Since the ancient times it constituted a crossroad of commercial routes between China, Asia Minor and Europe. For this reason, the area is rich in different typologies of artefacts with various provenances, beyond the local ones, the production of which was testified since the Neolithic age [10]. In consideration of military-political factors, the town was repeatedly destroyed by internal and external enemies in the past. In spite of this, archaeological excavations [11], that began in 1983, brought to light artefacts as earthenware, coins and glazed potteries, indicative of a settlement with solid trade and cultural relations with other parts of the world, and showing features of a city circumscribed with fortified walls, a castle with round defensive towers, and other dwellings erected very close to each other with narrow streets, together with other wider central streets. From the excavations, the presence of specialized workshops in various spheres of metallurgy, as well as of dye-works, was revealed. In these regards, the systematic archaeometric investigation of Agsu artefacts is just at the beginning.
Documentation in literature is scarce, and only very recently a non-invasive or at least the micro-destructive multi-technique approach, involving a combination of complementary optical microscopy (OM), scanning electron microscopy—energy dispersive spectroscopy (SEM-EDS), X-ray diffraction (XRD), and prompt gamma activation analysis (PGAA), was applied at different length-scales on some representative glazed potteries taken from this site [7]. From the results, a grouping of the analyzed samples was attempted, based on petrographic and compositional features. In particular, samples belonging to Group 1 exhibited a ceramic body rich in quartz, plagioclase, feldspar and hematite, and a typical lead glaze, whereas samples belonging to Group 2 were characterized by a matrix essentially constituted by quartz and plagioclase, with a glaze also vitrified. The reader can refer to Ref. [7] for details. Nevertheless, the collected data were not sufficient to identify the provenance of the artifacts, neither to estimate relevant parameters, such as the maximum firing temperature, useful for reconstructing the manufacture technology. Therefore, further investigations supported by more accurate methods for determining elemental and molecular composition are needed.
Ion beam analysis (IBA), performed by a large (few mm2) or a micro (2–20 μm in diameter) proton beam as a probe, has been demonstrated to be the most appropriate technique to perform elemental characterization of samples of historical-artistic interest in a fast and non-invasive manner [12,13,14,15,16,17,18,19]. This is because the aforementioned technique uniquely combines excellent sensitivity and accuracy with a non-destructive and even non-invasive character. However, although IBA applies nuclear reaction and elastic recoil detection analyses for light elements, such as H, Li, B, etc., low quantities of these elements cannot be easily detected.
Similar techniques that use electrons and X-ray beams have, in some respects, lower performances than IBA, and often cannot adequately solve archaeological issues. In particular, the combination of proton particle Rutherford Backscattering Spectrometry (RBS) and Proton Induced X-ray Emission (PIXE) turns out to be complementary in many aspects. On one side, thanks to its sensitivity and mass resolution, medium, and heavy elements can be revealed by PIXE even in trace. On the other side, light elemental composition can be deduced by RBS spectral analysis. In particular, oxygen, carbon, and silicon can be detected because of their non-Rutherford backscattering cross sections for protons with energies above 2 MeV. Hence, the simultaneous application of these two methodologies allows for the measurement of almost all elements present in the pottery. In addition, when a micro-beam is employed, it is possible to map the material properties exploring an area of about 1 × 1 mm2.
Synchrotron radiation Fourier transform infrared (SR-FTIR) has been proved to be a powerful molecular spectroscopy technique for the characterization, other than that of the raw minerals constituting the bulk, of pigments, and binding media of painted materials [20]. It represents an advance over conventional FTIR spectroscopy since it guarantees a higher signal-to-noise ratio at diffraction-limited lateral resolution, thanks to the superior brightness of infrared synchrotron radiation (100 to 1000 times higher than conventional IR sources) [21,22]. Therefore, SR-FTIR results particularly suitable in the case of analysis of small and/or heterogeneous samples, such as ancient paintings as well as corrosion and alteration products, made by a mixture of organic and inorganic compounds distributed in a layered structure.
In the present study, IBA has been first of all applied to some of the previously investigated glazed pottery fragments coming from the Agsu site and dated back XIX century A.D. in order to deduce their almost total elemental composition, both in depth and at surface level. In fact, IBA techniques permit detection of the depth profile of analyzed elements through the control of the ion beam energy and of the known ion stopping powers in the irradiated matrix. By increasing the ion beam energy, it is possible to increase the ion range and the analysis depth; by decreasing the ion beam energy, the analysis is referred to the first surface layers.
In particular, the ceramic body and the decorated surface of the samples have been preliminary characterized at elemental scale by particle Rutherford Backscattering Spectrometry (RBS) and Proton Induced X-ray Emission (PIXE) spectroscopy. After that, the ion-microprobe has been used to obtain the micrometric elemental spatial distribution map of the representative samples.
Then, SR-FTIR analysis was performed on the same samples, in order to define, at the μm scale, raw materials, pigments, and binders used for the potteries production, so achieving crucial information in order to clarify technological features and preparation processes typical of the local population. Starting from them, the reproduction of similar materials in accordance with the ancient recipes, to be used in the restoration works, can be attempted.

2. Materials and Methods

We analyzed four pottery fragments (Figure 1), labelled as AZR3, AZR5, AZR7, and AZR1, taken in the medieval ruins of Agsu.
The shards probably come from domestic objects such as bowls, dishes or vessels. Based on the aforementioned preliminary archaeometric investigation [7], samples were selected as representative of Group 1 (AZR3, AZR5, and AZR7) and Group 2 (AZR1), as the variety and differences of colors found in the site are concerned.
Table 1 summarizes all the descriptive information of the analyzed samples.
Rutherford Backscattering Spectrometry (RBS) and Proton Induced X-ray Emission (PIXE) analyses were performed for all investigated samples on the external decorated convex side and on the back. Ion-microbeam analyses were performed in cross-section for AZR3, AZR5, and AZR7 fragments, and on the external glazed surface in the case of AZR1 shard.
RBS and PIXE investigations were carried out at the Nuclear Physics Institute in Rez (Czech Republic), using the 3 MeV Tandetron CANAM accelerator [23] to accelerate 3.1 MeV proton beams, collimated to 1.5 mm × 1.6 mm.
RBS was performed in high vacuum (10−6 mbar) with an acquisition time of 500 s. During each measurement, the ion current was maintained at ~6.0 nA. The backscattered H+ ions were monitored by an Ultra-Ortec PIPS silicon detector placed at a scattering angle of 170°, having 100% detection efficiency for the proton energy detection analysis. RBS spectra were fitted using the SIMNRA simulation code [24] and IBANDL database [25] for experimental nuclear reaction data, cross section type, and resonance parameters. The measured RBS spectra were available for quantitative elemental analysis, here reported in terms of atomic percentages, by assuming that each element exhibits a RBS yield whose intensity is proportional to the content of that element in the investigated thickness of the sample, and that the total RBS profile will contain the weighted sum of the single elements contributions. The minimum detection limit (MDL) was of the order of 0.1% in atomic composition.
The same vacuum chamber was employed for PIXE, using two low energy X-ray solid-state detectors, i.e., a silicon drift SDD detector (Amptek XR-100FASTSDD) and a germanium Ultra-LEGe detector (CANBERRA model GUL-0110P). The X-ray detection energy window was in the (0.5 ÷ 20) keV range. The used detectors were located at scattering angular positions of 135° (SDD) and of 150° (LEGe), respectively. The detectors energy resolution was ~122 eV for SDD and ~145 eV for LEGe, respectively, measured at the 5.9 keV Kα-line of Mn. A polyethylene filter ~115 µm thick (ρ = 0.98 g/cm3) was interposed in front of the Ultra-LEGe detector to stop the backscattered particles and to attenuate the low-energy X-rays (K-lines of Na, Al, Si, P, S, Cl, and K). This filter increases the detector sensitivity for the X-rays emitted from Ca, Ti, Mn and Fe. Both detectors were calibrated with a standard Al-Mg alloy from BAM with Ref. ERM-EB313. A DXP-XMap control and acquisition system for X-ray data mapping from company XIA LLC was used for measurements performed by using both detectors. The GeoPIXE software [24] was used for the analysis of the PIXE data, also taking into account various effects such as pile-up, escape peaks from Si and Ge, and secondary electron bremsstrahlung.
For each PIXE spectrum, the background was fitted to a SNIP algorithm. The peak tail and the full width at half maximum (FWHM) of the Mn Kα-line (5.9 keV) were considered as free parameters. The GeoPIXE software furnished the elemental mass concentration and the corresponding peak areas resulting from the major lines of all the detected elements, together with the minimum detection limit (MDL) of the order of ppm.
Ion-microbeam analyses were performed in vacuum chamber, the energy of the micrometric proton beam (2 μm in diameter) was 2.6 MeV, the spot size 3.1 μm2, and the beam current ~8 pA. Target was moved in the X-Y plane to achieve a maximum scanning area of 1 × 1 mm2 in size. The presented results were obtained by the PIXE investigation, using an electronic filter to select the characteristic peak of interest and mapping in false colors the X-ray emission from single elements coming from the scanning areas of interest of the investigated sample. Ion range, stopping powers, straggling, and energy losses were calculated using the SRIM simulation code [26].
SR FTIR absorbance data were collected at the Life Sciences branch of the Synchrotron Infrared Source for Spectroscopy and Imaging (SISSI) beamline in Elettra Sincrotrone Trieste [27]. The instrument consists of a Bruker VERTEX 70 FTIR spectrometer coupled with Hyperion 3000 Vis/IR microscope. Firstly, single-point analyses were performed on small powdered portion of the samples (about 2 mg). Grains of interest for the analysis were selected under a stereomicroscope, and transferred by a sharp needle into a DAC (Diamond Anvil Cell) compression cell, flatten and then measured in transmission mode using the MCT detector. The approach allowed us to improve the selectivity of the FTIR analysis with respect to conventional spectroscopy since we selected the material of interest by visual inspection (reduced background effect). Due to the micrometric size of the grains, a microscopic approach that guaranteed a good S/N ratio was mandatory. For each powder sample, we collected 15–20 spectra from representative spots, in the (650–4000) cm−1 range with a spectral resolution of 4 cm−1, an aperture size of 25 × 25 μm2, and averaging 256 scans per spectrum. Due to the complexity of the experimental FTIR profiles, the spectra were initially compared with those of standard minerals and/or pigments from databases [28,29] and literature [30] for a reliable assignment of the bands. Hence, spectral analysis included baseline removal and curve fitting through the PeakFitTM version 4.05 software (SPSS Inc., Chicago, IL, USA). The strategy adopted for the curve fitting procedure was to use well-defined Gaussian shape profiles, with all the parameters left free to vary upon iteration. The statistical parameters were used as a guide to ‘‘best-fit’’. While we are aware that the spectral decomposition procedures have no unique solution, we remark that the one we adopted here uses the minimum number of parameters and, at the same time, it furnishes extremely good fits to the data. The obtained results were in fact characterized by r2 ~ 0.9999. Furthermore, the choice of the components in the experimental spectra, with the assigned center-frequencies, was also suggested by the analysis of the second derivative profiles (data not shown) that showed minima approximately corresponding to the maxima of each band component.

3. Results and Discussion

3.1. RBS-PIXE Analysis
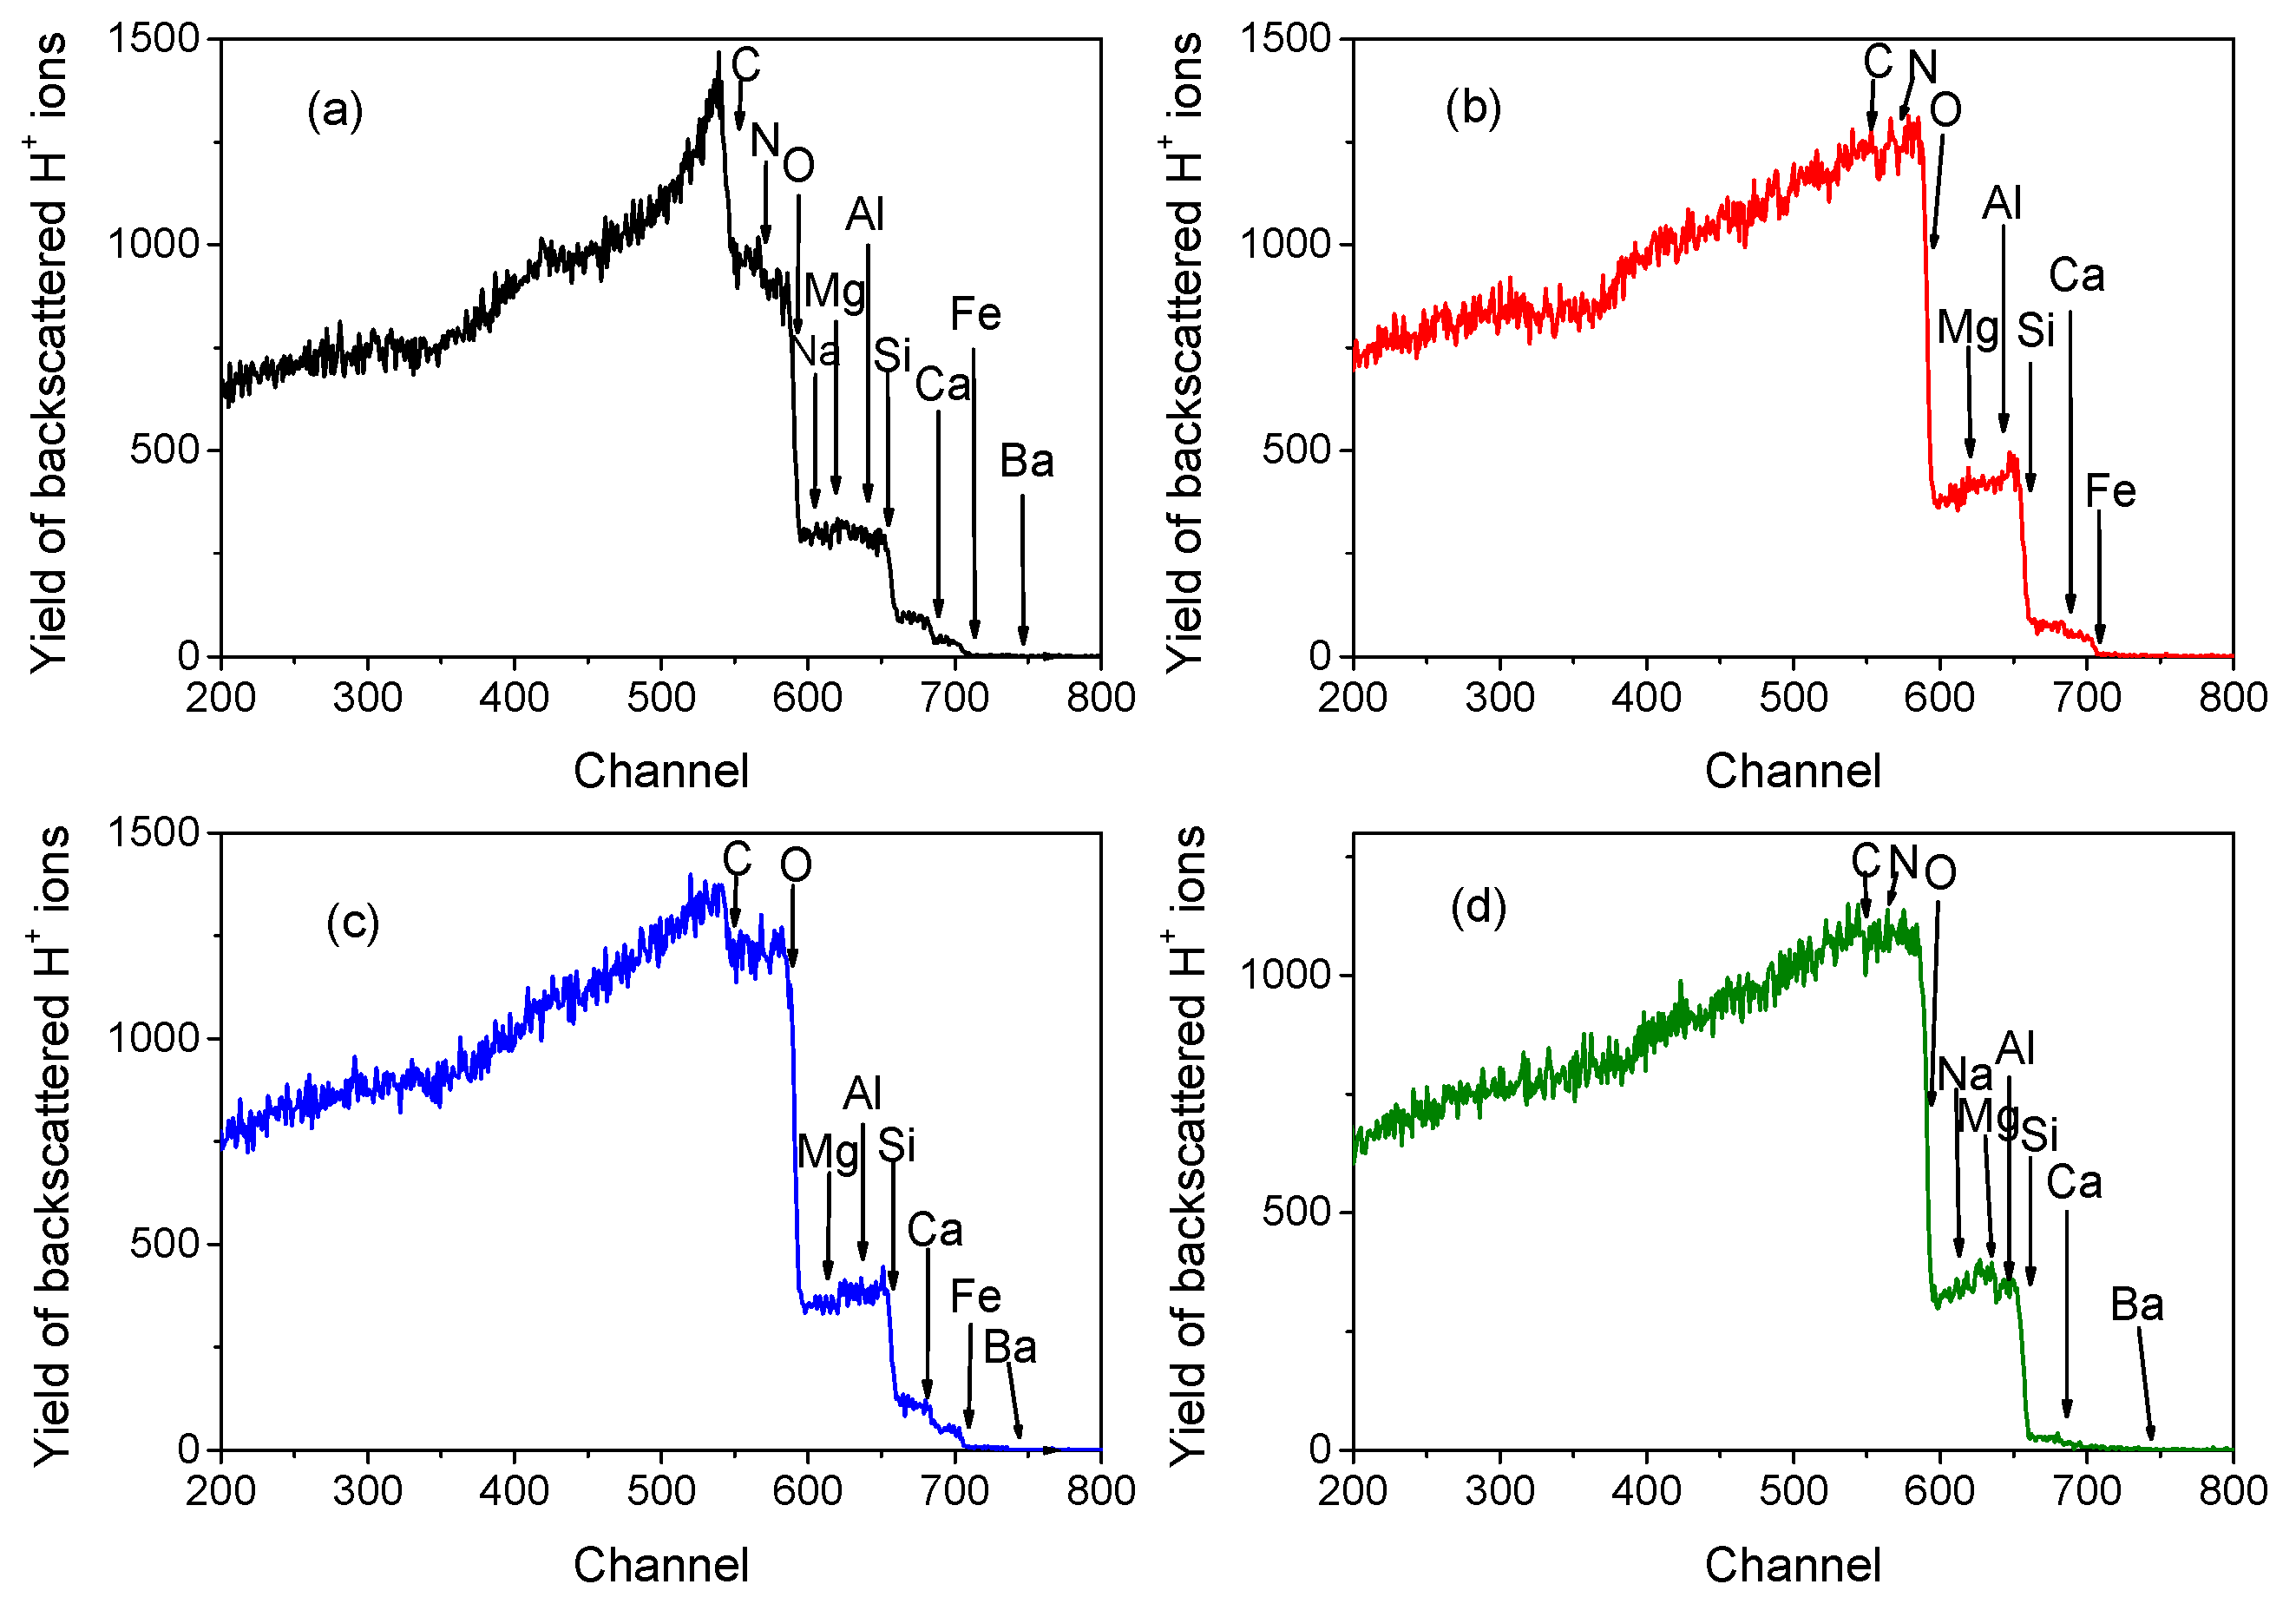
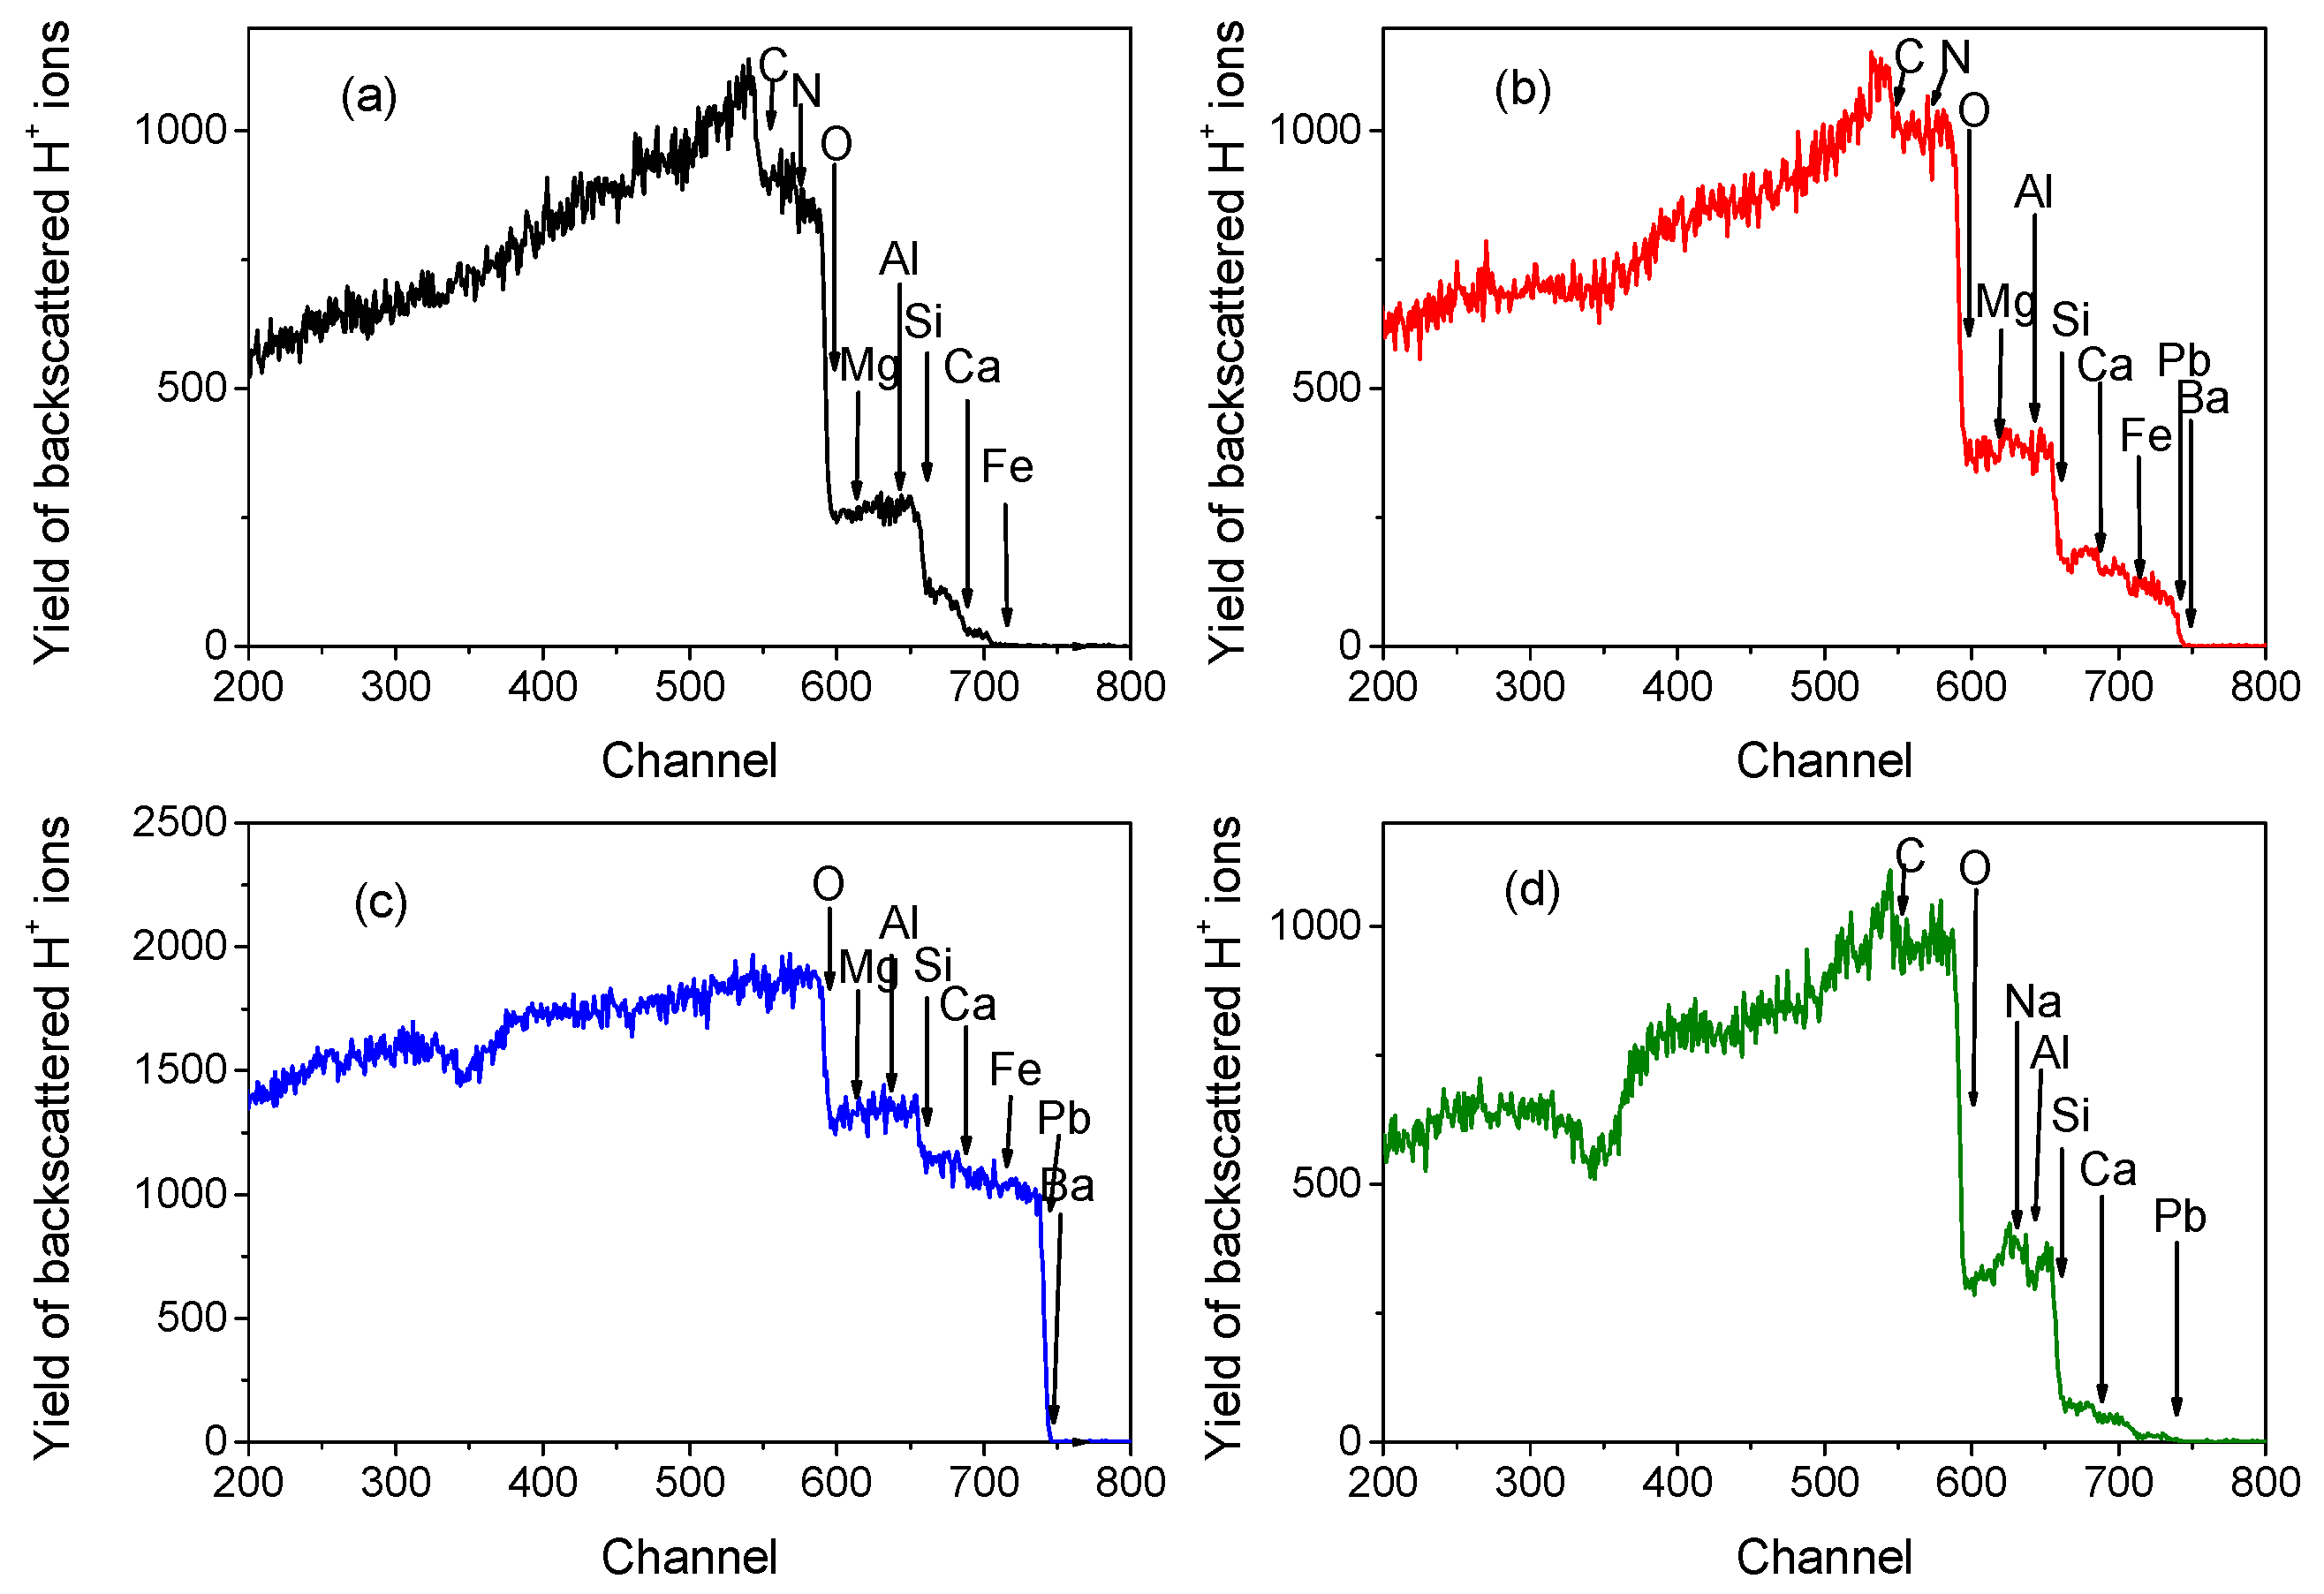
Figure 2 and 
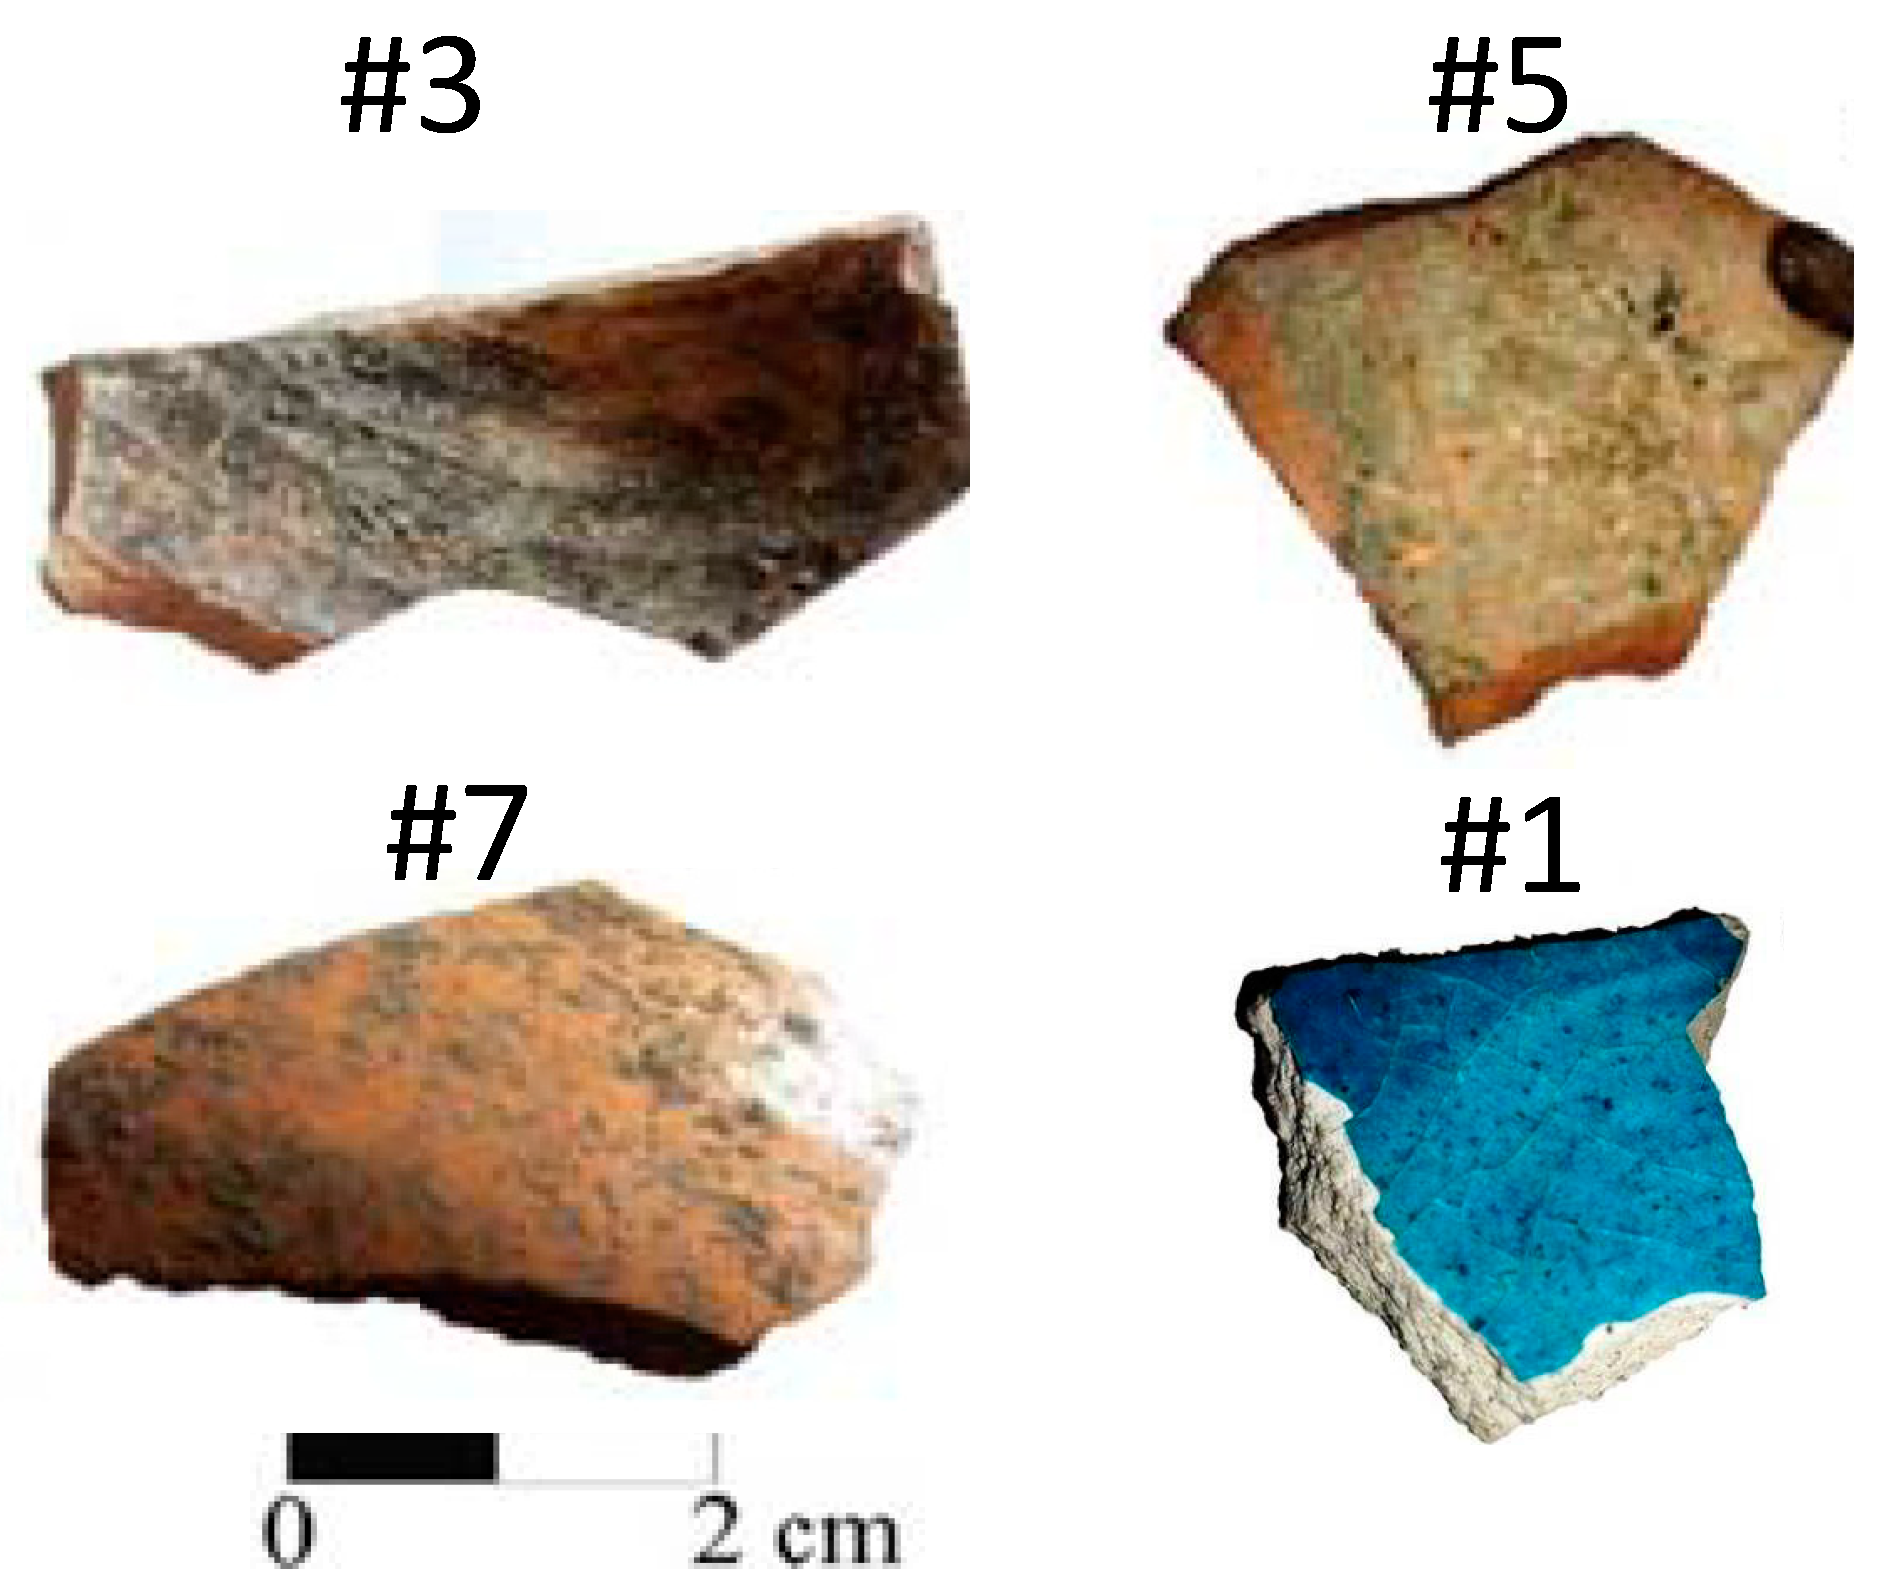
Figure 3 respectively report the RBS spectra of the unglazed back and external glazed surface of the analyzed AZR3, AZR5, AZR7, and AZR1 potsherds. Several steps can be seen in the RBS spectra, corresponding to the various detected elements.
Assuming the bulk matrix to be composed mainly by SiO2 in agreement with the literature [7], the RBS analysis refers to ~a 40–50 μm depth, being 100 μm the penetration depth of the used proton beam in a SiO2 matrix. Therefore, in the case of measurements performed on the external surface, the RBS signal will reasonably reflect the contribution coming from both the glaze and the ceramic body. Instead, the RBS data collected from the back-side of the samples will be informative for the elemental composition of the bulk and can be used for comparison.
The relative atomic concentrations of detected elements as obtained from the RBS analysis are summarized in Table 2 and Table 3.
Worth of notice, the use of the SIMNRA code for the best-fit of the spectra allowed us to put in evidence three light elements, i.e., C, N, and O. The O-element is bound to the other detected elements, giving rise to oxides such as SiO2, Al2O3, CaO, Na2O, MgO, PbO2, and Fe2O3, BaO.
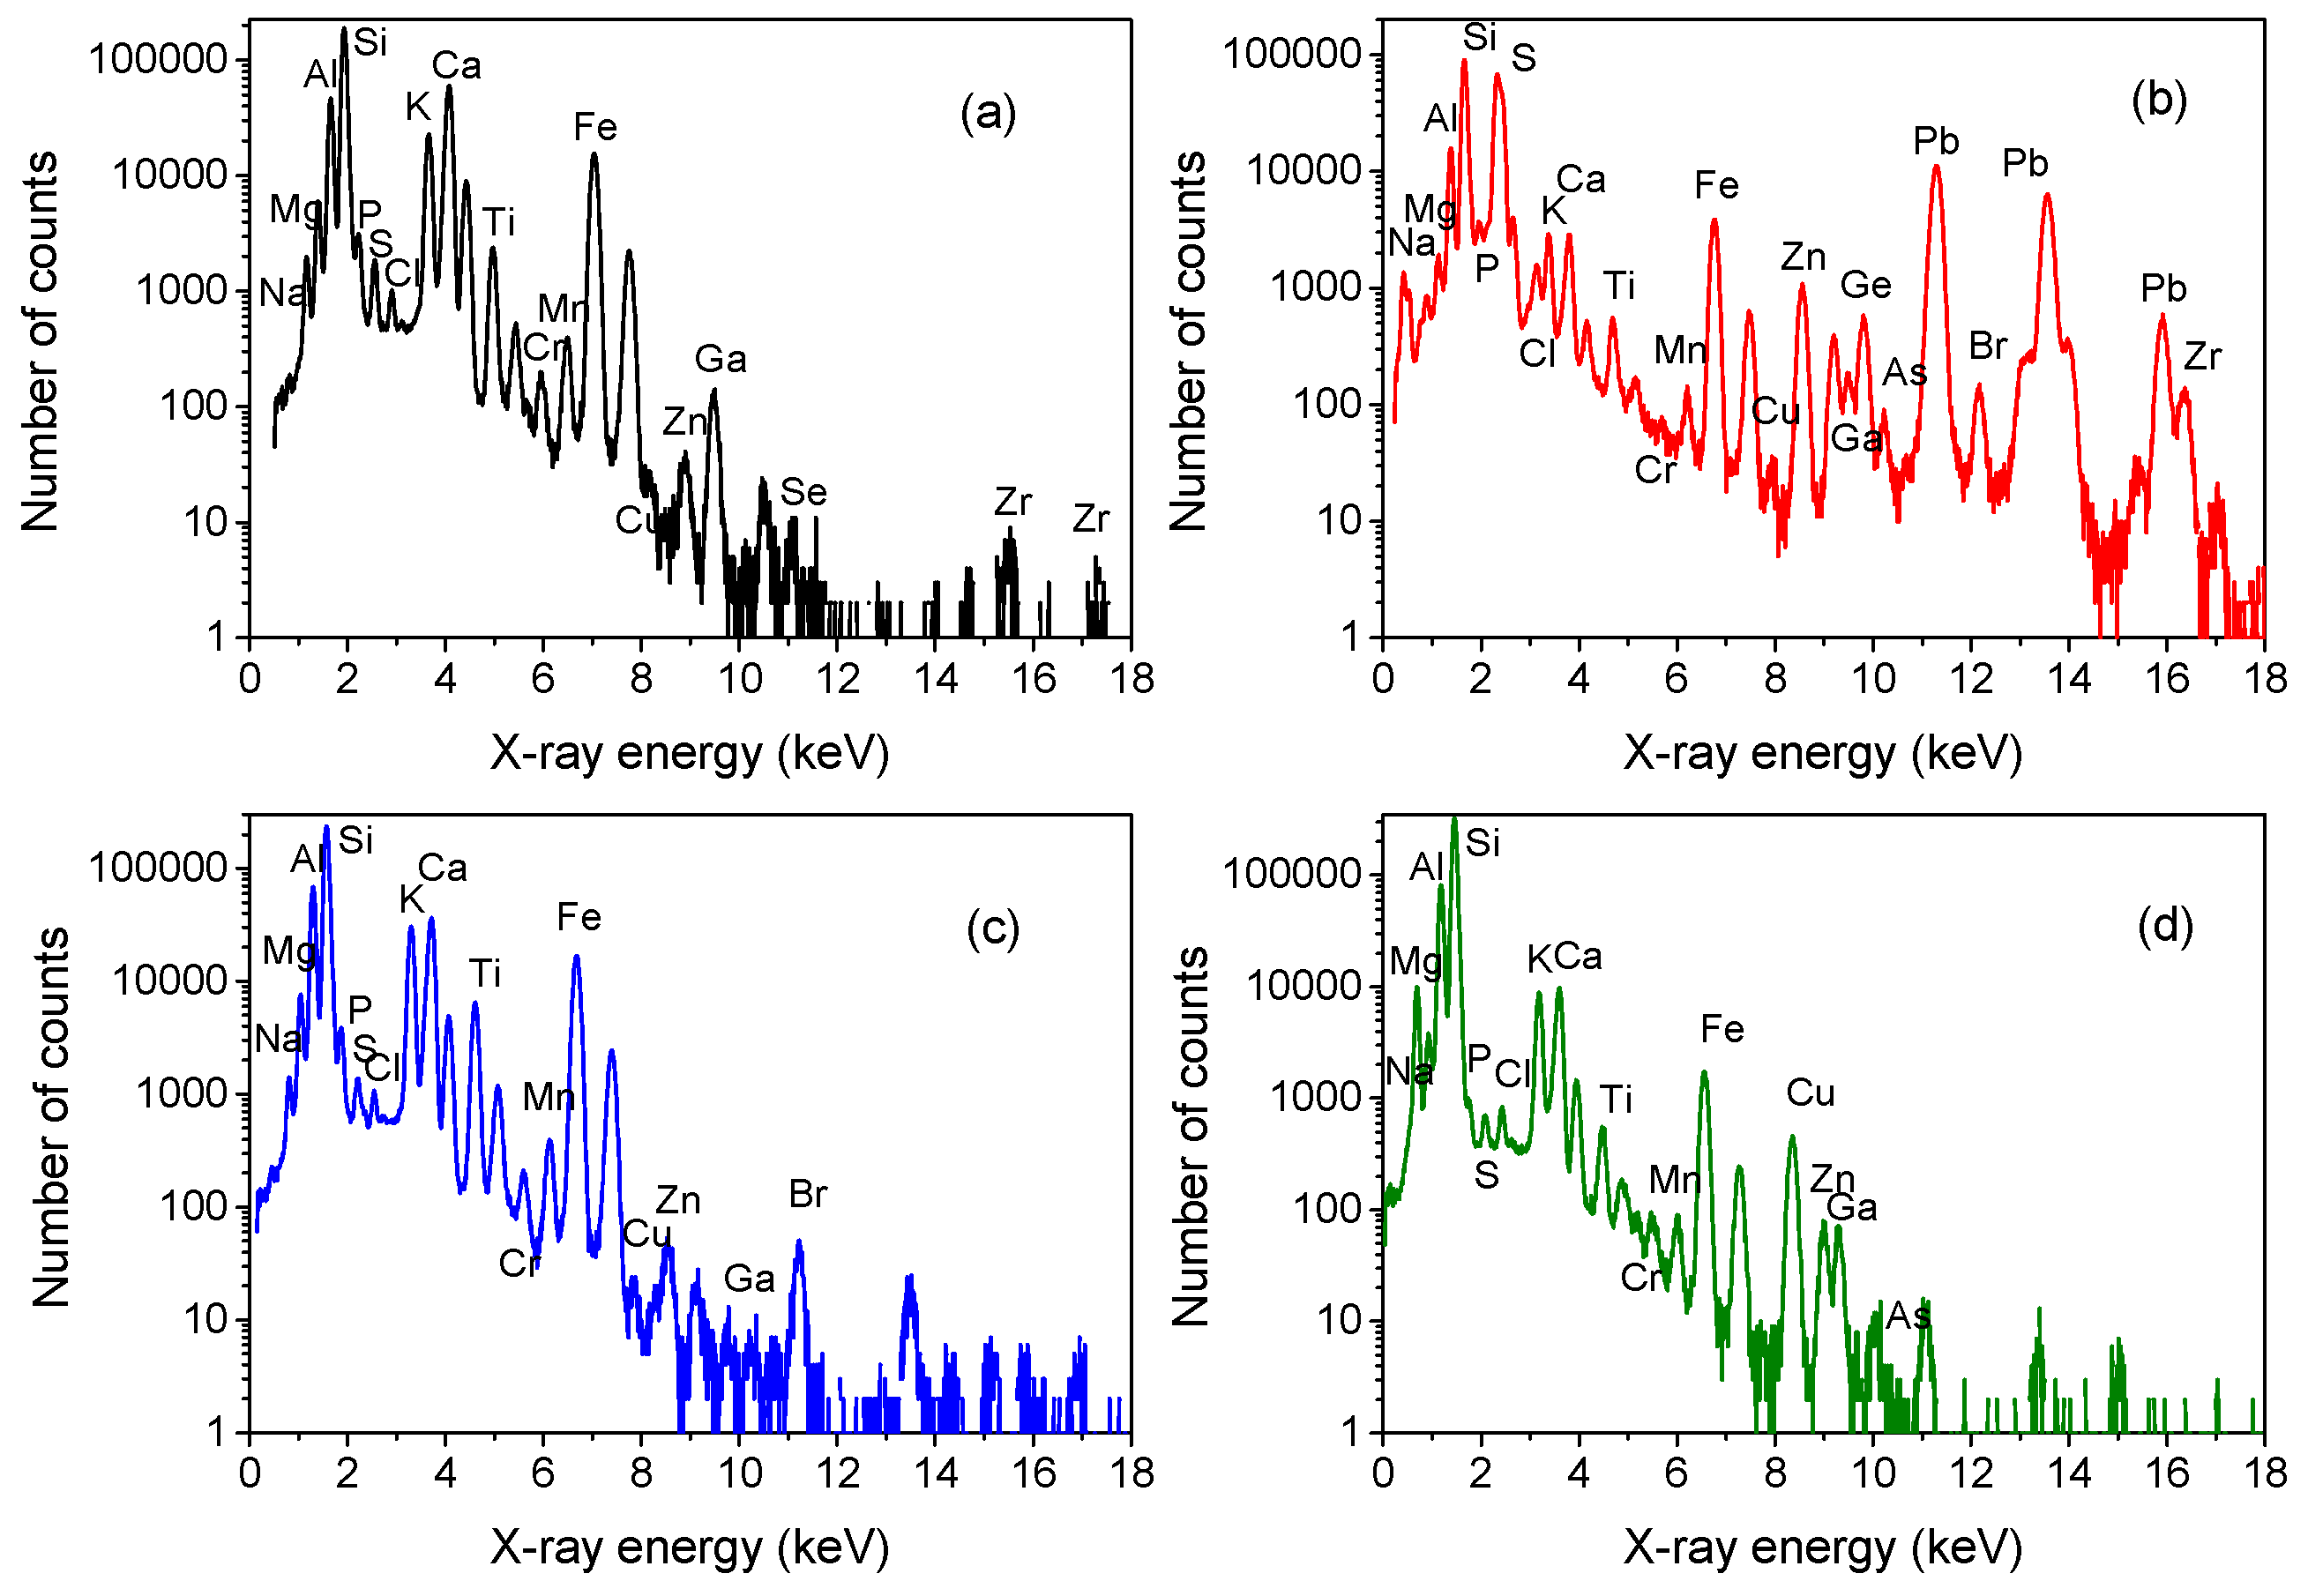
Regarding the PIXE analysis, the analyzed thicknesses are comparable to the RBS ones performed with the same ion beam probe. However, as already remarked, PIXE analysis has also allowed us to reveal elemental trace composition. Additionally, in this case, PIXE was applied to both the external glazed surface, in order to have information on the glaze/bulk composition, and to the unglazed back, in order to detect the bulk composition to be used for comparison.
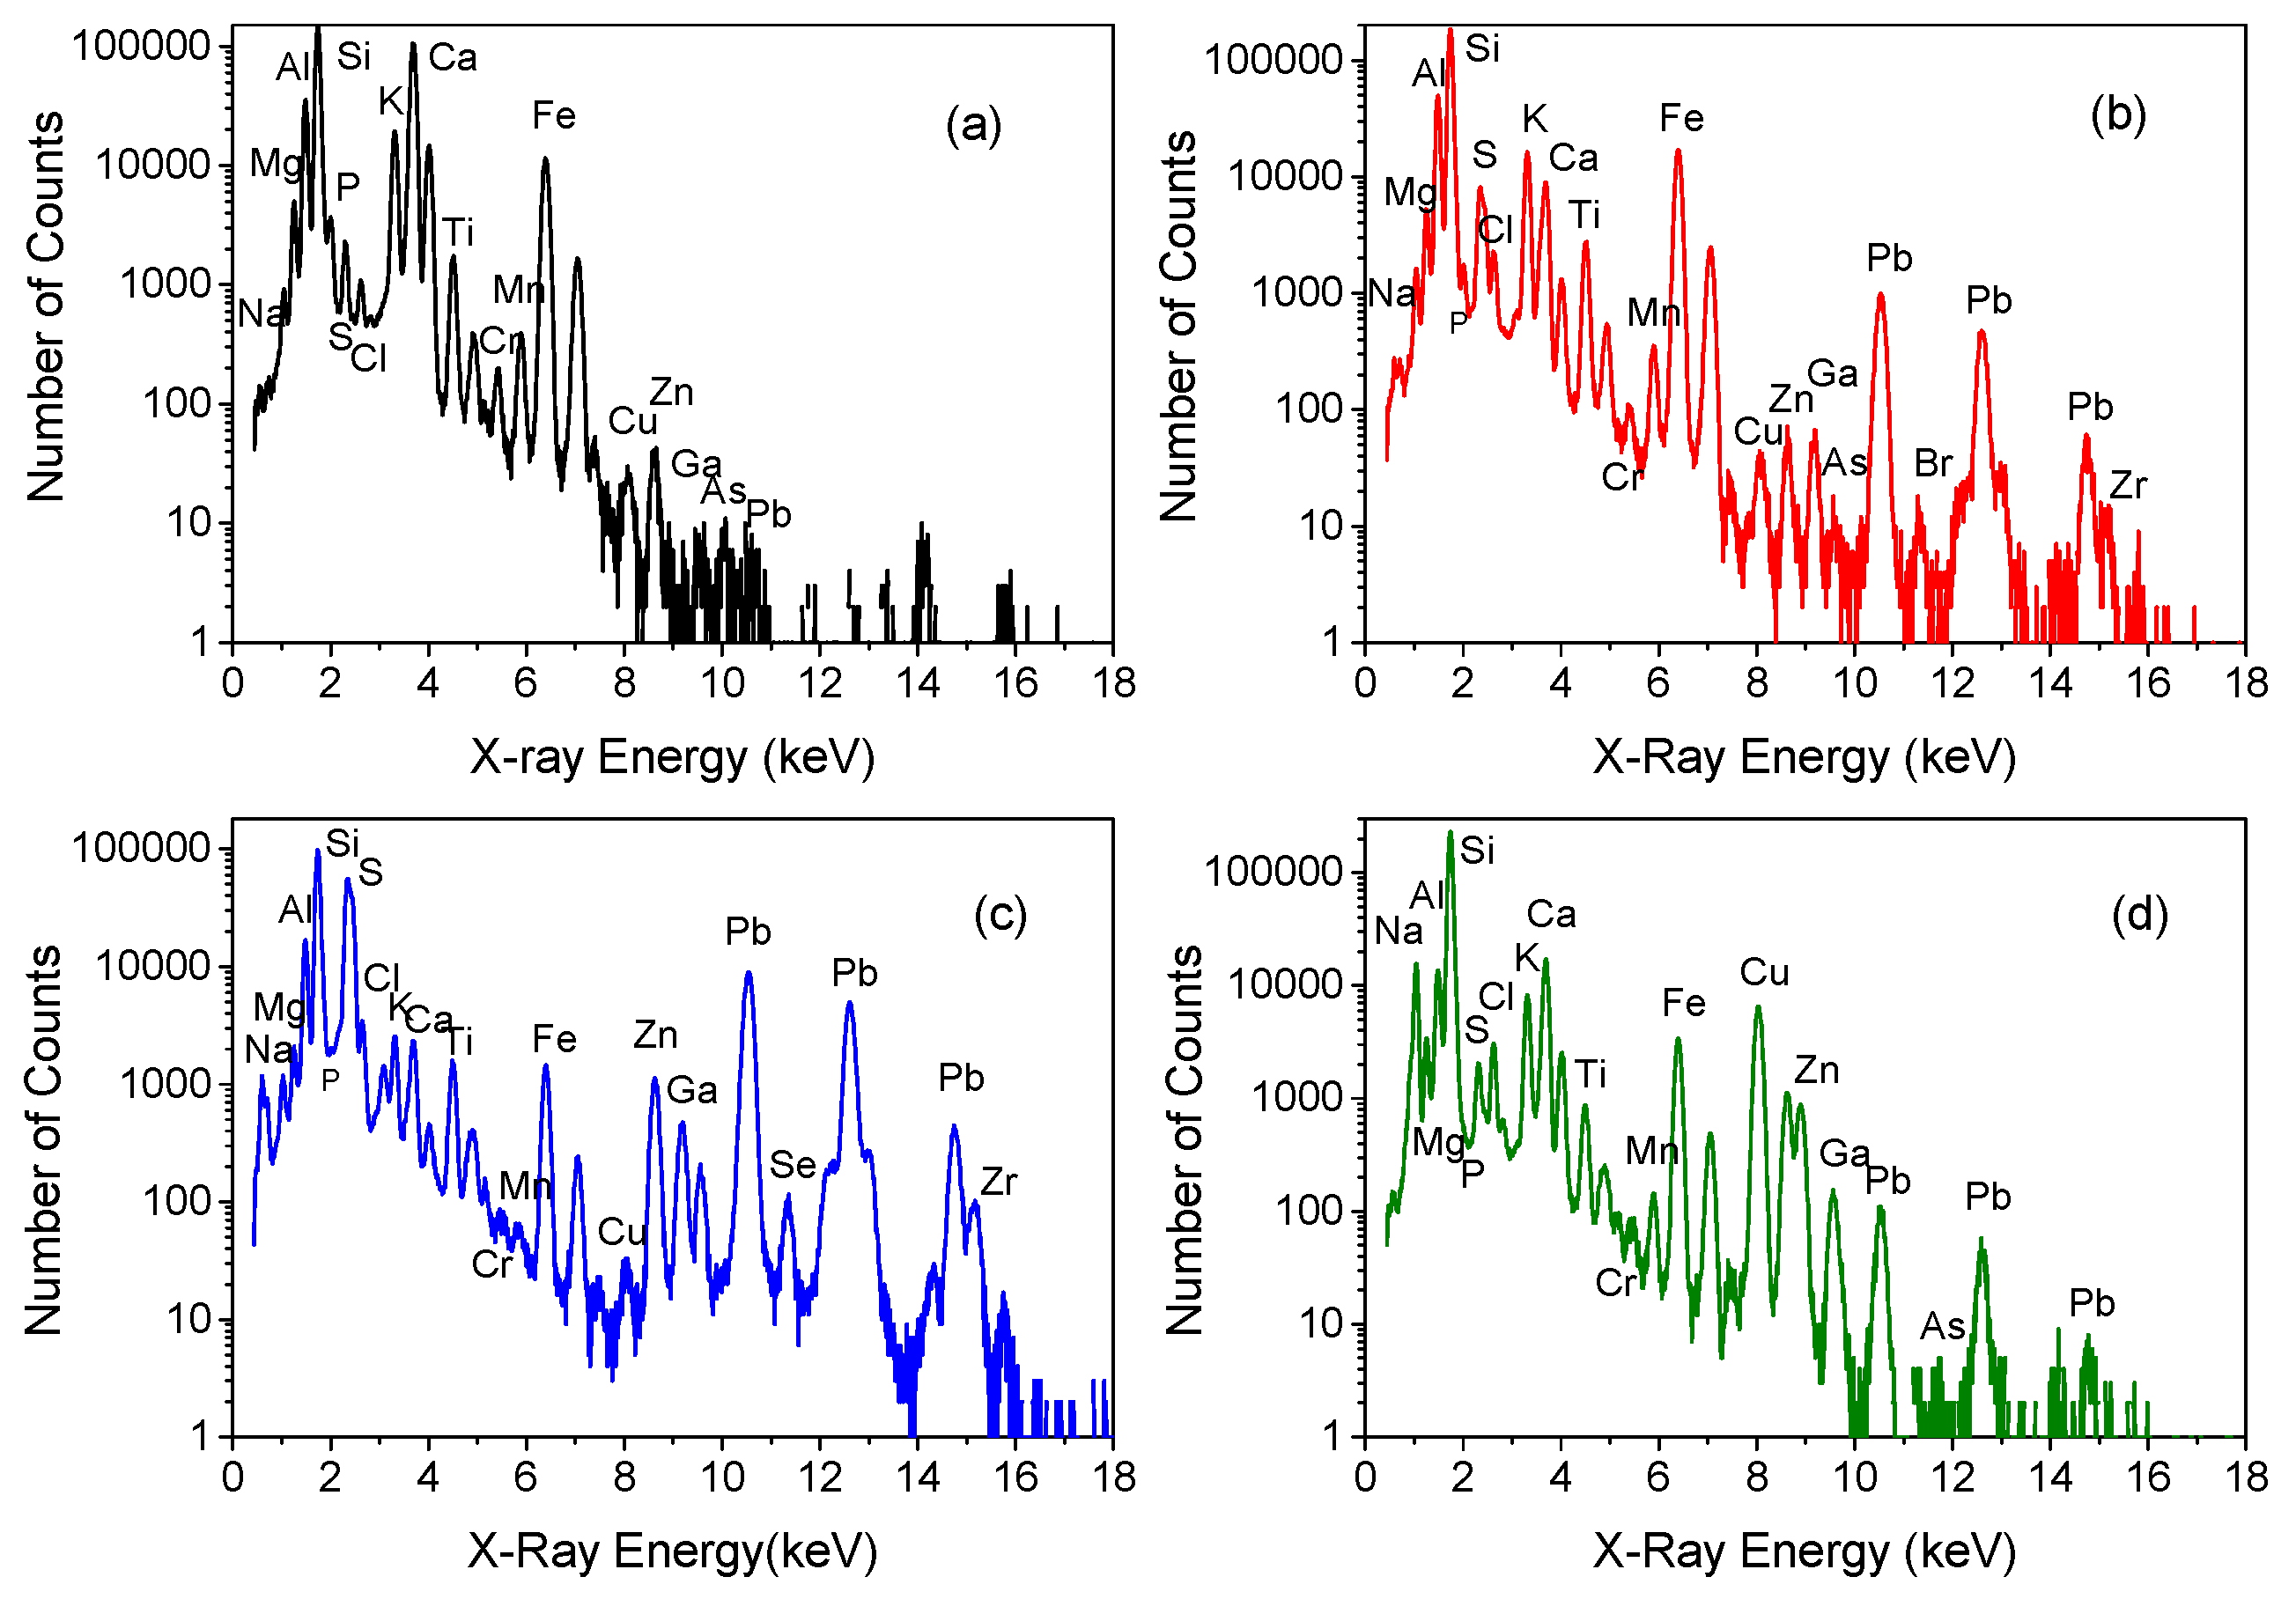
Figure 4 and Figure 5 report the PIXE spectra of the unglazed back and external glazed surface, respectively.
The relative weight concentrations of the major, minor and trace elements detected by PIXE in the unglazed back and external glazed surface of the analyzed AZR3, AZR5, AZR7, and AZR1 potsherds are reported in Table 4 and Table 5, respectively.
As a general result, a moderate homogeneity is observed in the elemental components of the potteries, which could suggest an elaborate elutriation, mixture, and processing in the pottery manufacture, corresponding to a high productivity level at that time.
In agreement with previous results [7], the composition of the ceramic body of all the investigated specimens indicates the use of raw materials based on alumina and silica. According to literature [31,32], alumina is considered the characteristic oxide testifying a Chinese provenance. In addition, the presence of calcium magnesium silicates (e.g., diopside, CaMgSi2O6) as neo-formation minerals, indicating a high firing temperature, is conceivable for samples, like ours, that present such minerals in their raw materials, as occurs for ancient Chinese pottery [33].
Based on the aforementioned considerations, a Chinese provenance is hypothesized for all the investigated fragments.
Interestingly, a high content of CaO is observed for AZR3 sample with respect to the other fragments, for which the amount of these elements is almost comparable. This excess can be associated with the presence of calcite (CaCO3) of secondary origin [7].
As far as external glazed surfaces are concerned, the results indicate, for samples AZR5 and AZR7, a glaze composition based on Pb- and Si-oxides [34,35], with iron-oxides responsible for the yellowish pigmented layers [35,36]. In the case of AZR3 shard, the dark coloration can be hypothesized to be due to iron oxides. The presence of such oxides, as reported in Reference [7], suggests that firing was carried out in an oxidizing atmosphere at temperature around 850 °C. The glazed surface could be of alkaline nature [37]. The glaze for AZR1 sample turns out to be Si- and Na-oxides rich, whereas Cu can be hypothesized as responsible for the blue pigment.
Finally, it is worth remarking that, contrary to PIXE, RBS has allowed, with fairly good accuracy, for the estimation of the content and the depth distribution of the metallic elements.

3.2. Ion-Microbeam Analysis

μ-PIXE elemental maps have allowed us to obtain the distribution of the major elements. 
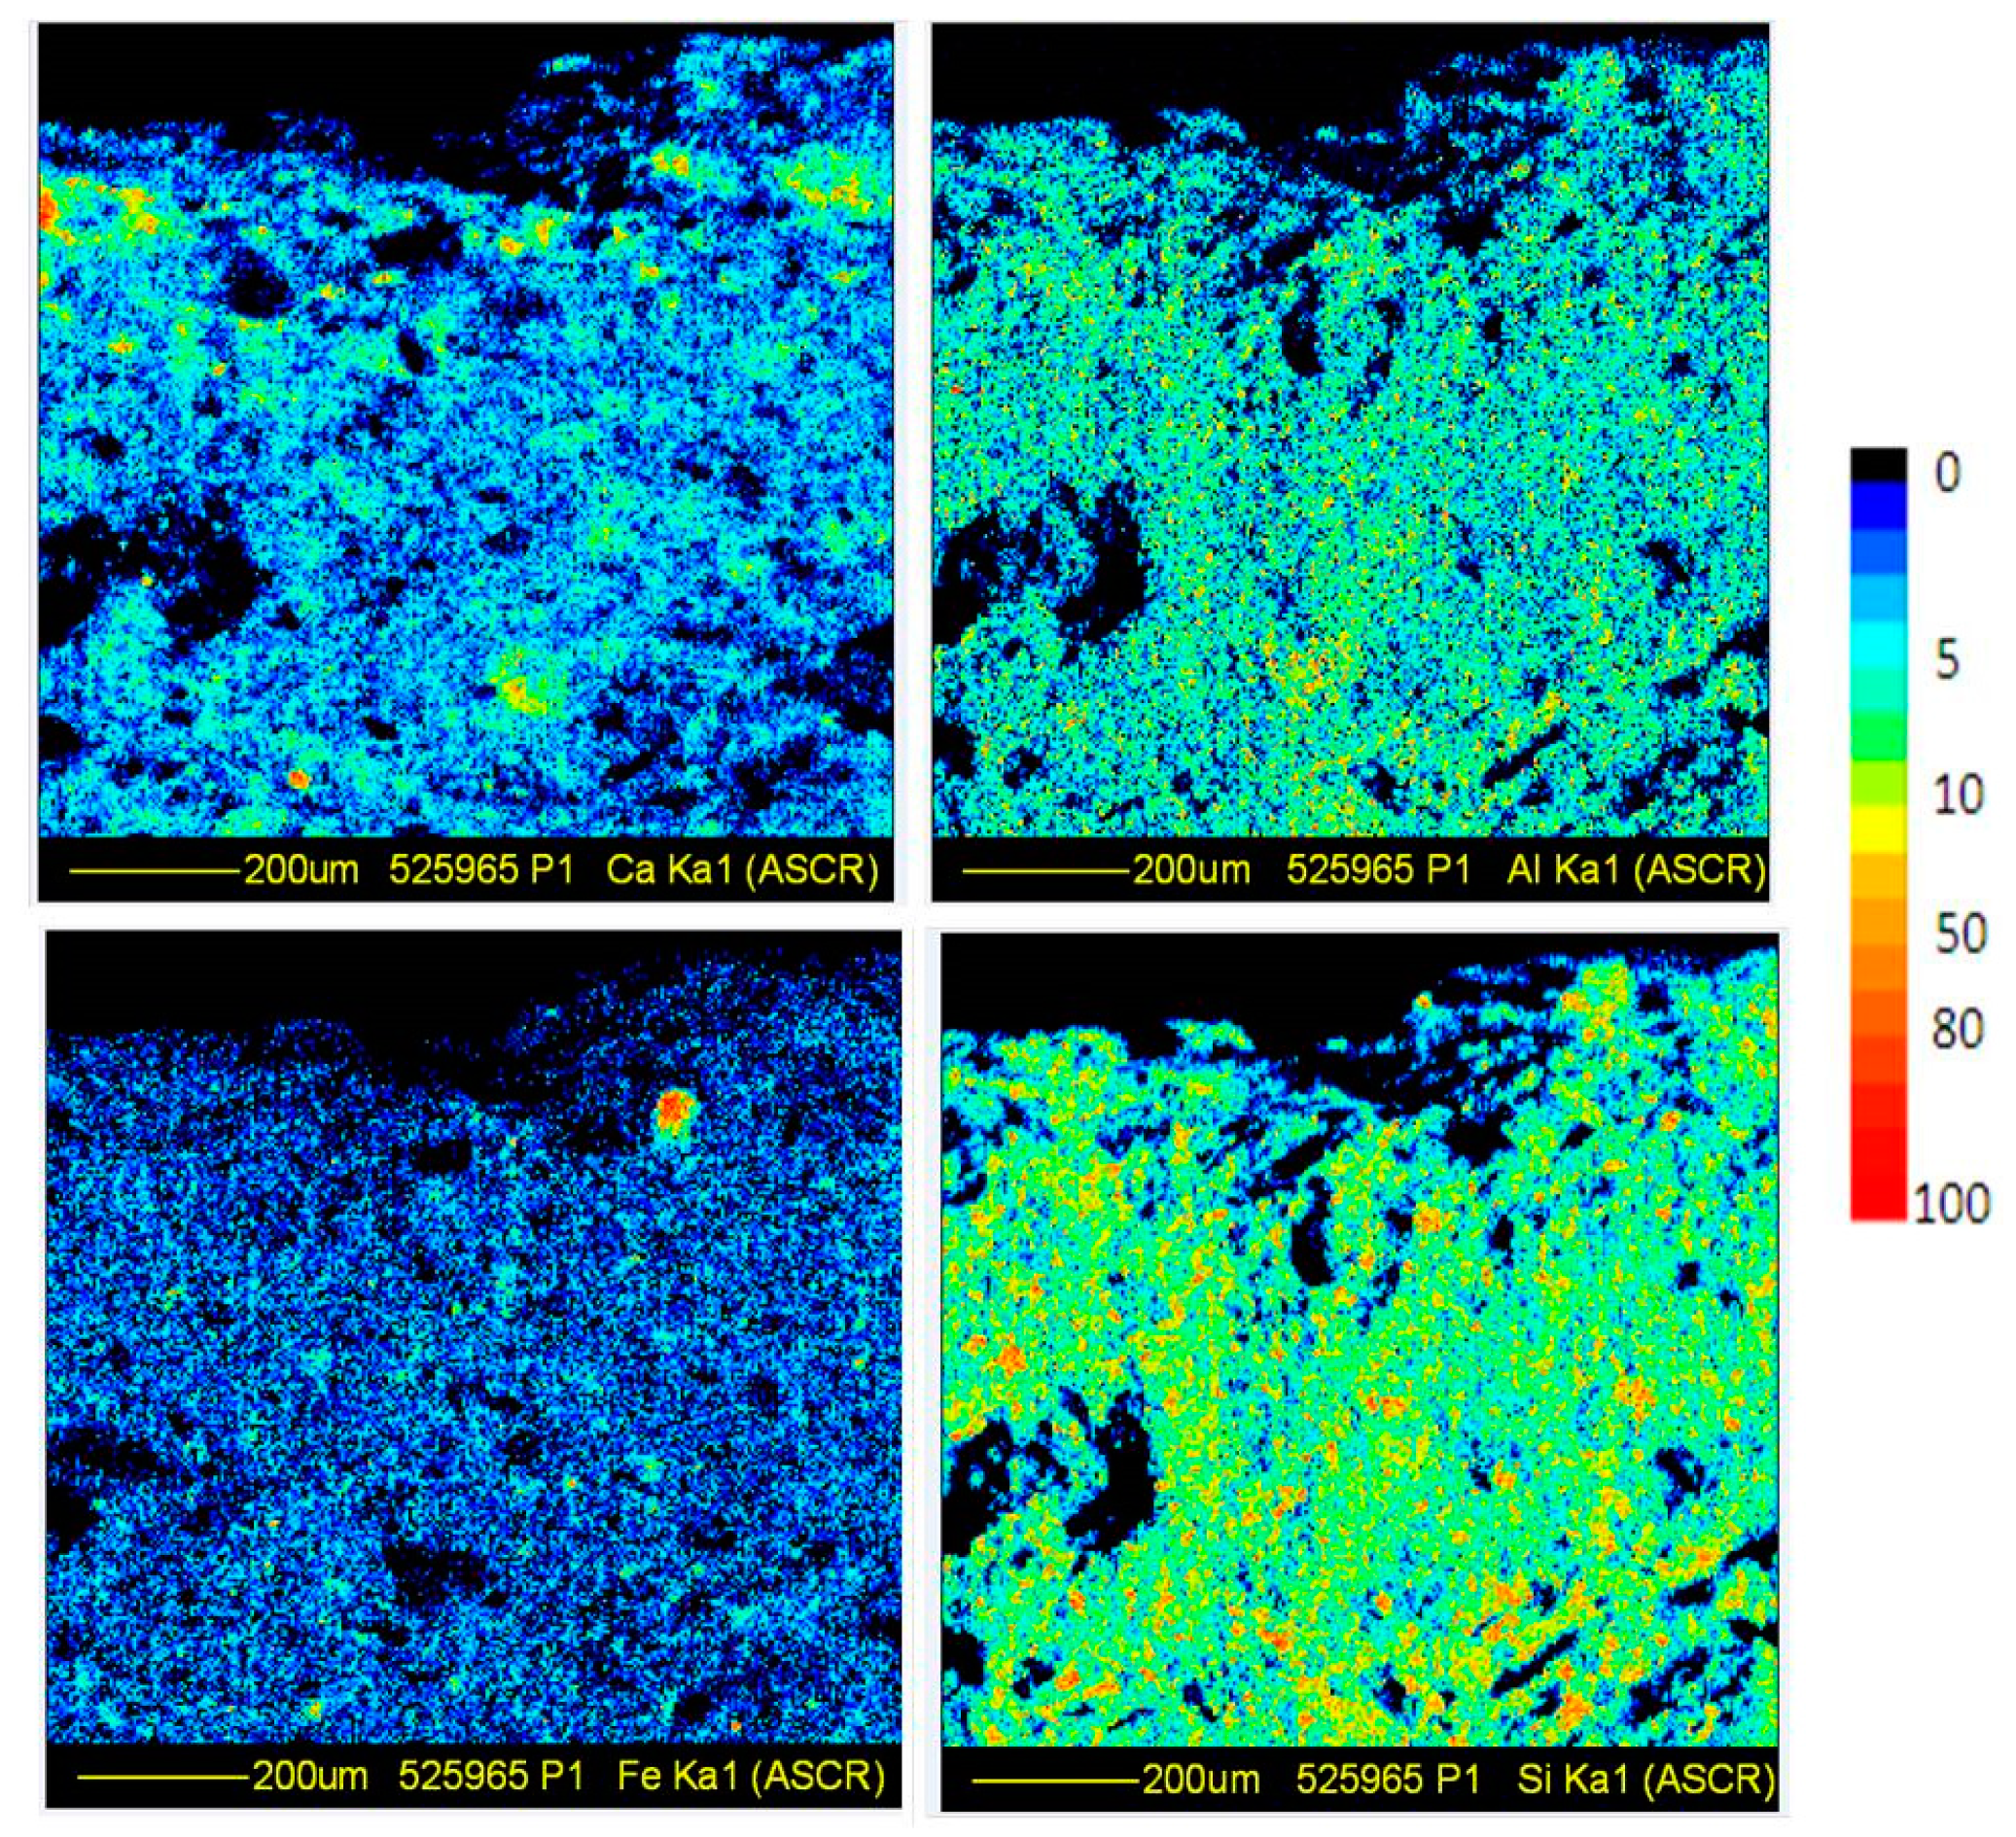
Figure 6 displays the micro-beam images of some elements (Ca, Al, Fe and Si) present in the cross-section close to the external glazed surface of AZR3 sample. Mesovoids are observed, with a size ranging from some hundred of μm down to tens of μm. The sample is highly damaged on the surface, with the dark glaze present only in some points, and presumably, responsible for the red spot observed in the Fe distribution map. Si and Al are widespread in the ceramic body, whereas Ca is visible in a low amount and appeared mainly concentrated on the surface, supporting the presence of calcite of secondary origin, as previously hypothesized [7]. Ti is present only in trace.
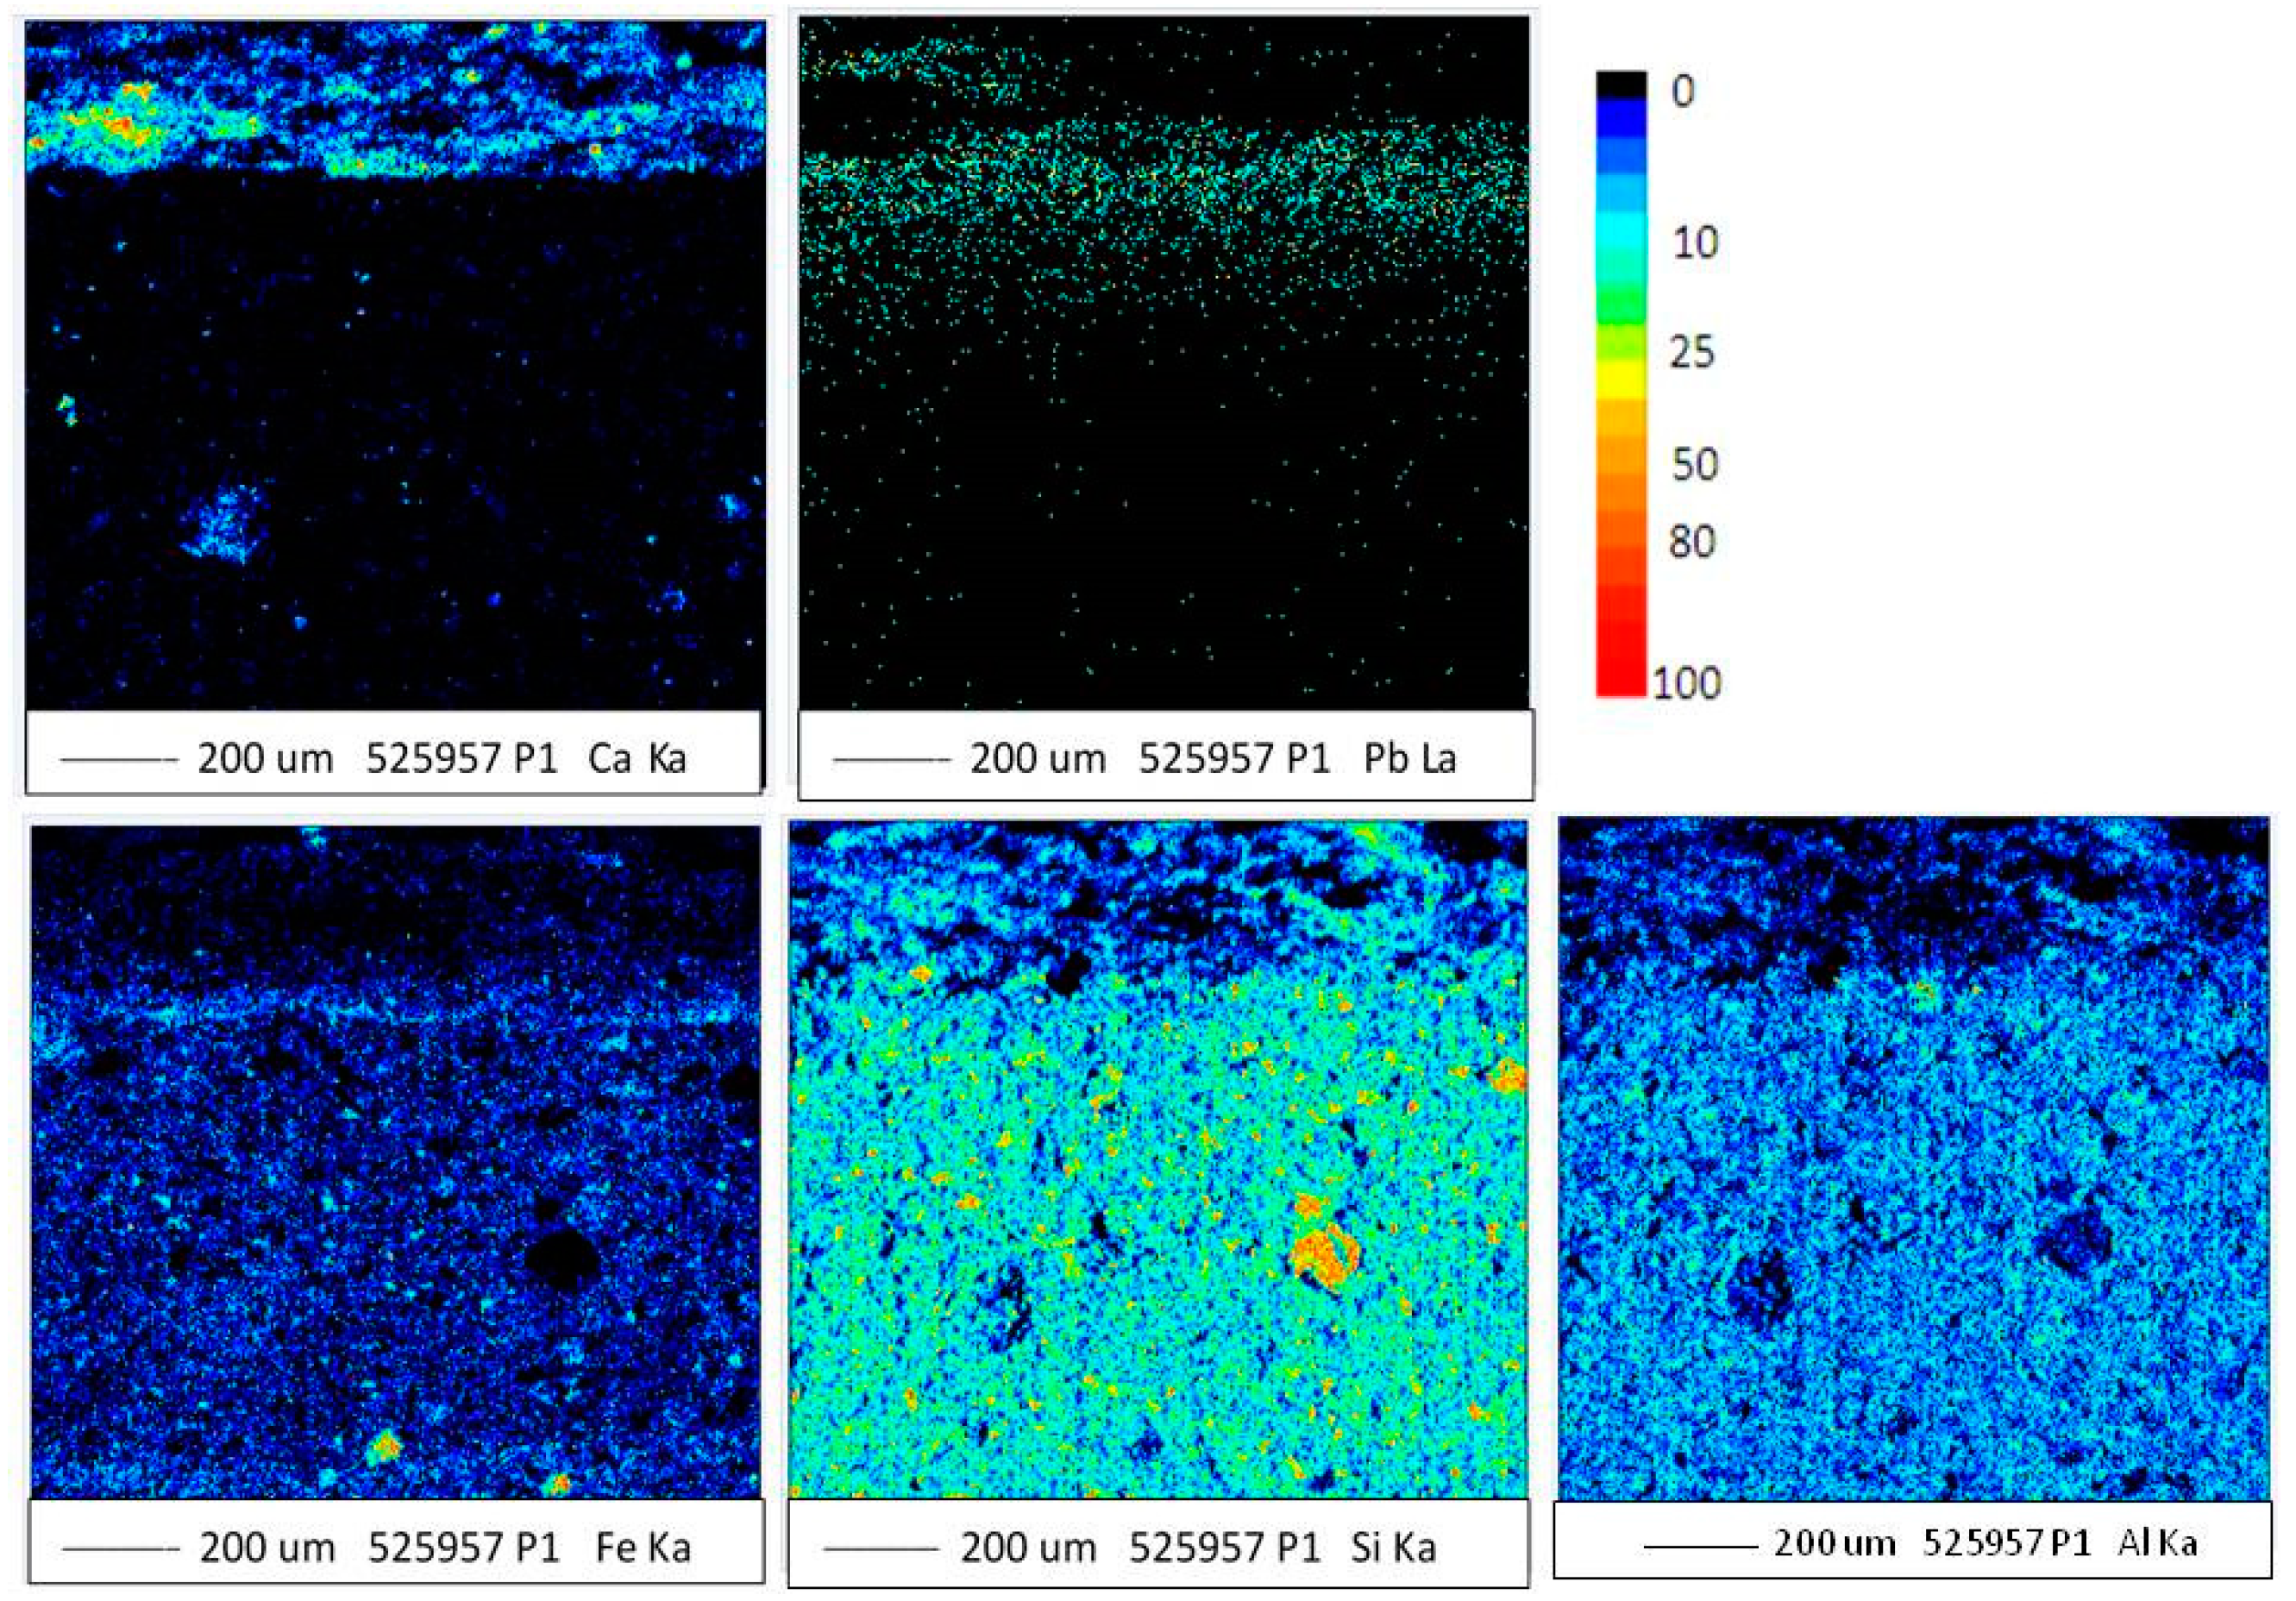
Figure 7 shows the Ca, Pb, Fe, Si, and Al μ-PIXE elemental maps of a 1 × 1 mm2 portion from the external glazed surface of AZR5 sample. A general inspection of the maps reveals evident changes in the distribution of all elements at ~200 μm below the surface, allowing us to identify two main zones that can be ascribed to the glaze (external) and the ceramic body (internal). Si appears to be the main element, widely spread in all the investigated area, with a major concentration in the ceramic body. Ca is detected in low amount, mainly concentrated on the external layer, whereas the opposite occurs for Al. Interestingly, as far as Fe is concerned, it appears concentrated on a thin layer marking the two different observed zones, furnishing an evidence of the yellowish pigmented layer underlying the glass. Below it, the distribution map of Pb evidences presence in some amount of this element down to –50 μm, and then the element tends to disappear. According to this, the existence of an engobe as an intermediate layer between glaze and ceramic body, hypothesized in previous measurements [7], is confirmed. In addition, Pb is not uniformly distributed on the glazed surface, testifying a not good conservation state.
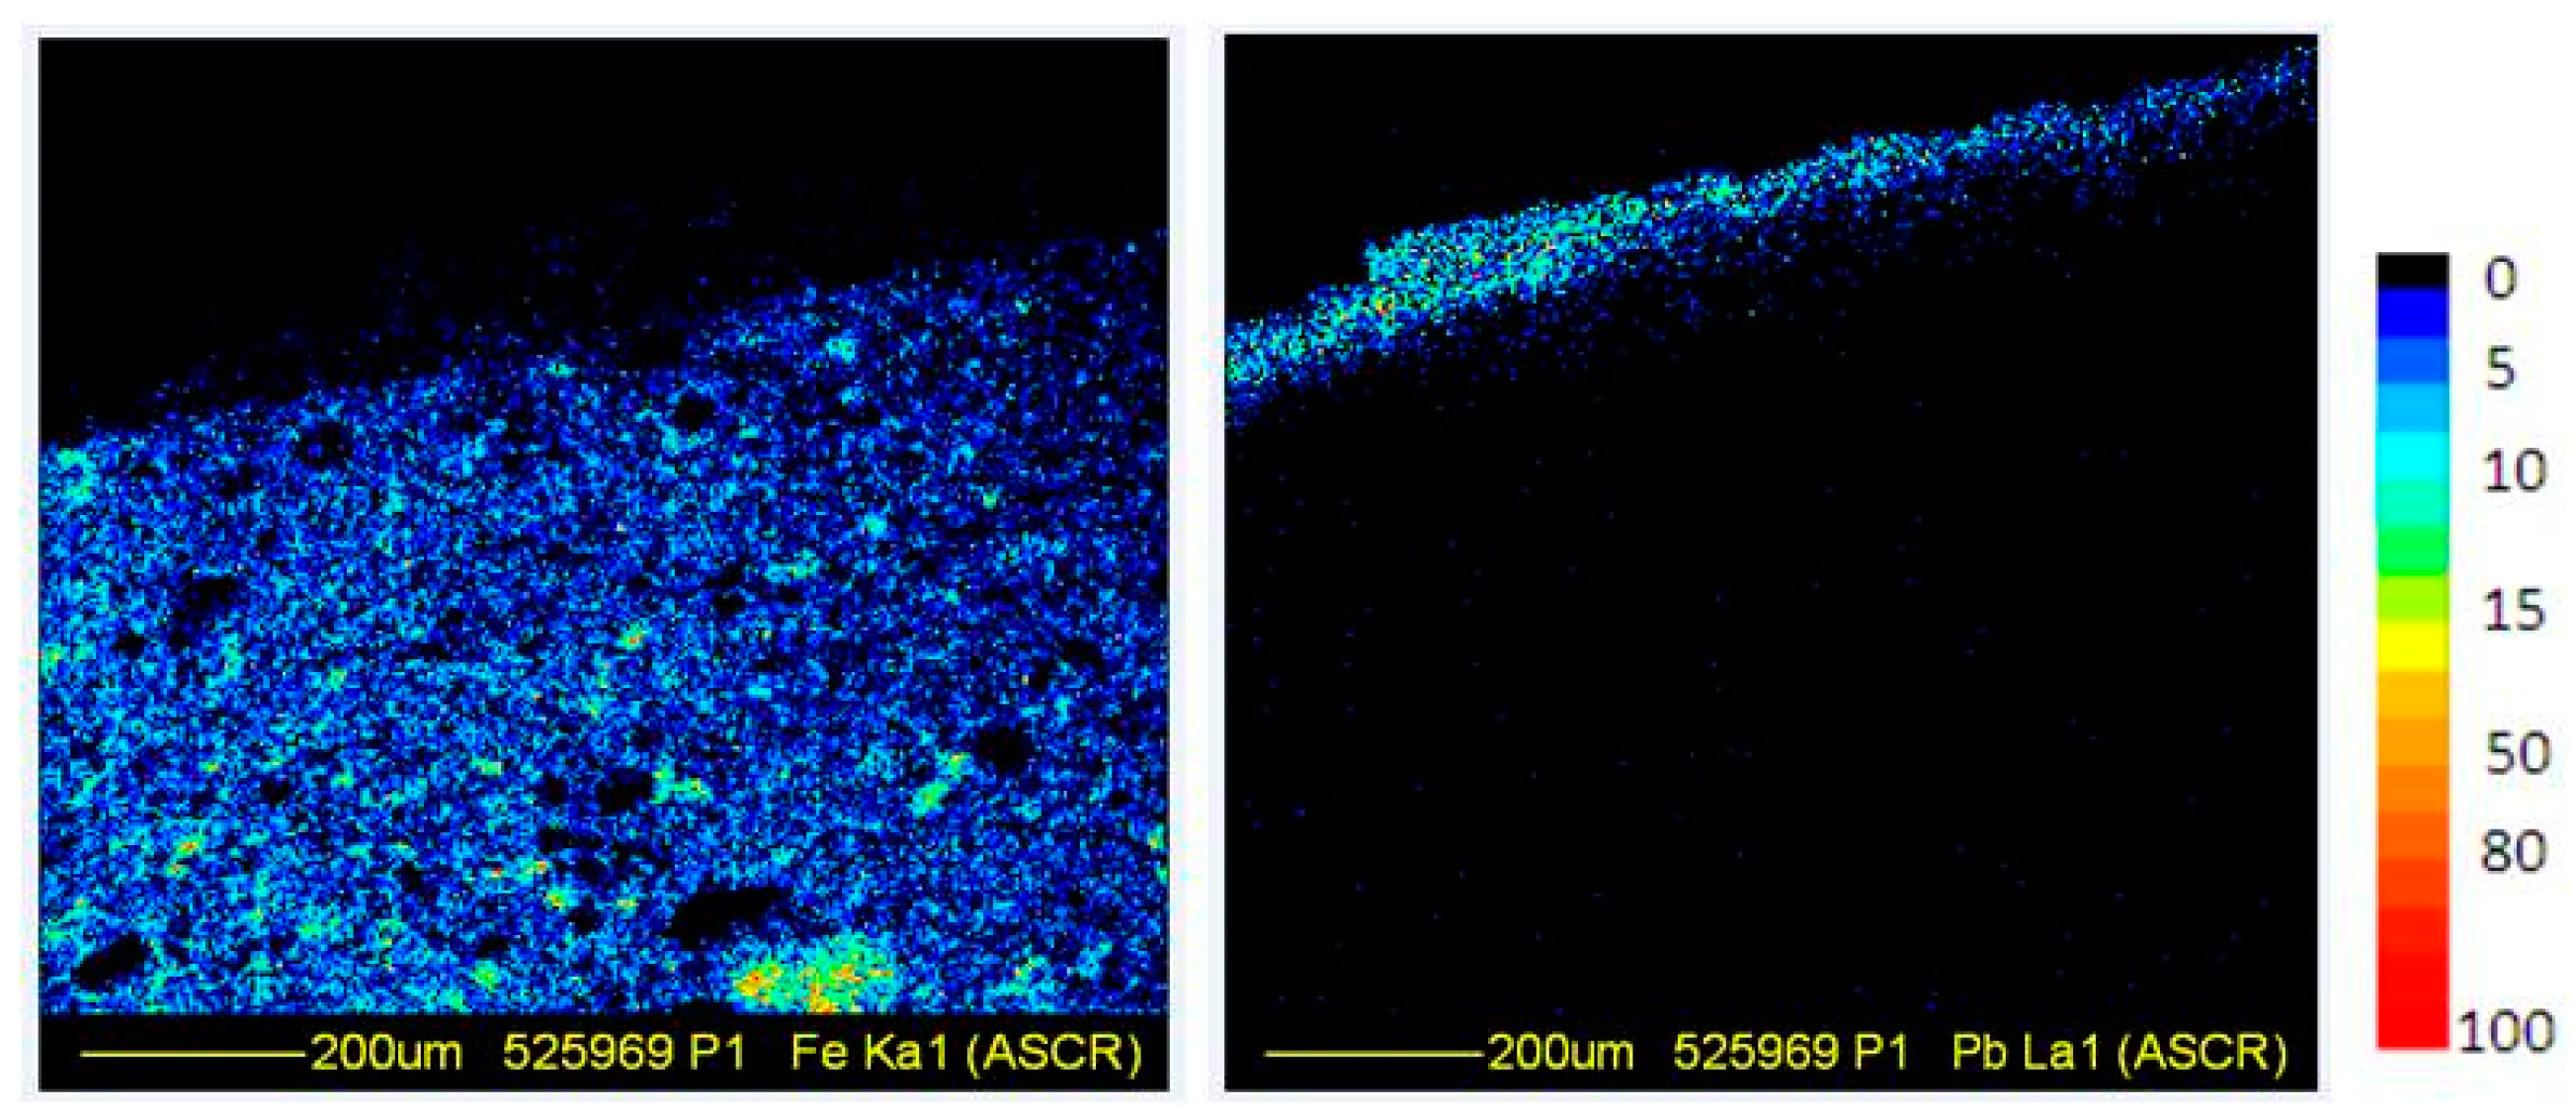
AZR 7 sample exhibits a uniform distribution of Si, Al, Ca and Mg-elements (data not shown). Worth of note appears, instead, the distribution gradients of some elements such as Fe and Pb observed in the cross-section close to the external glazed surface, reported in Figure 8. In particular, the surface layers show a significant Fe depletion, whereas Pb is detected in a very high amount.
As far as AZR1 sample is concerned, it is too small size avoided any cross section investigation, so the mapping was performed scanning a 1 × 1 mm2 area on the external glazed surface, including both the zones with and without pigment.
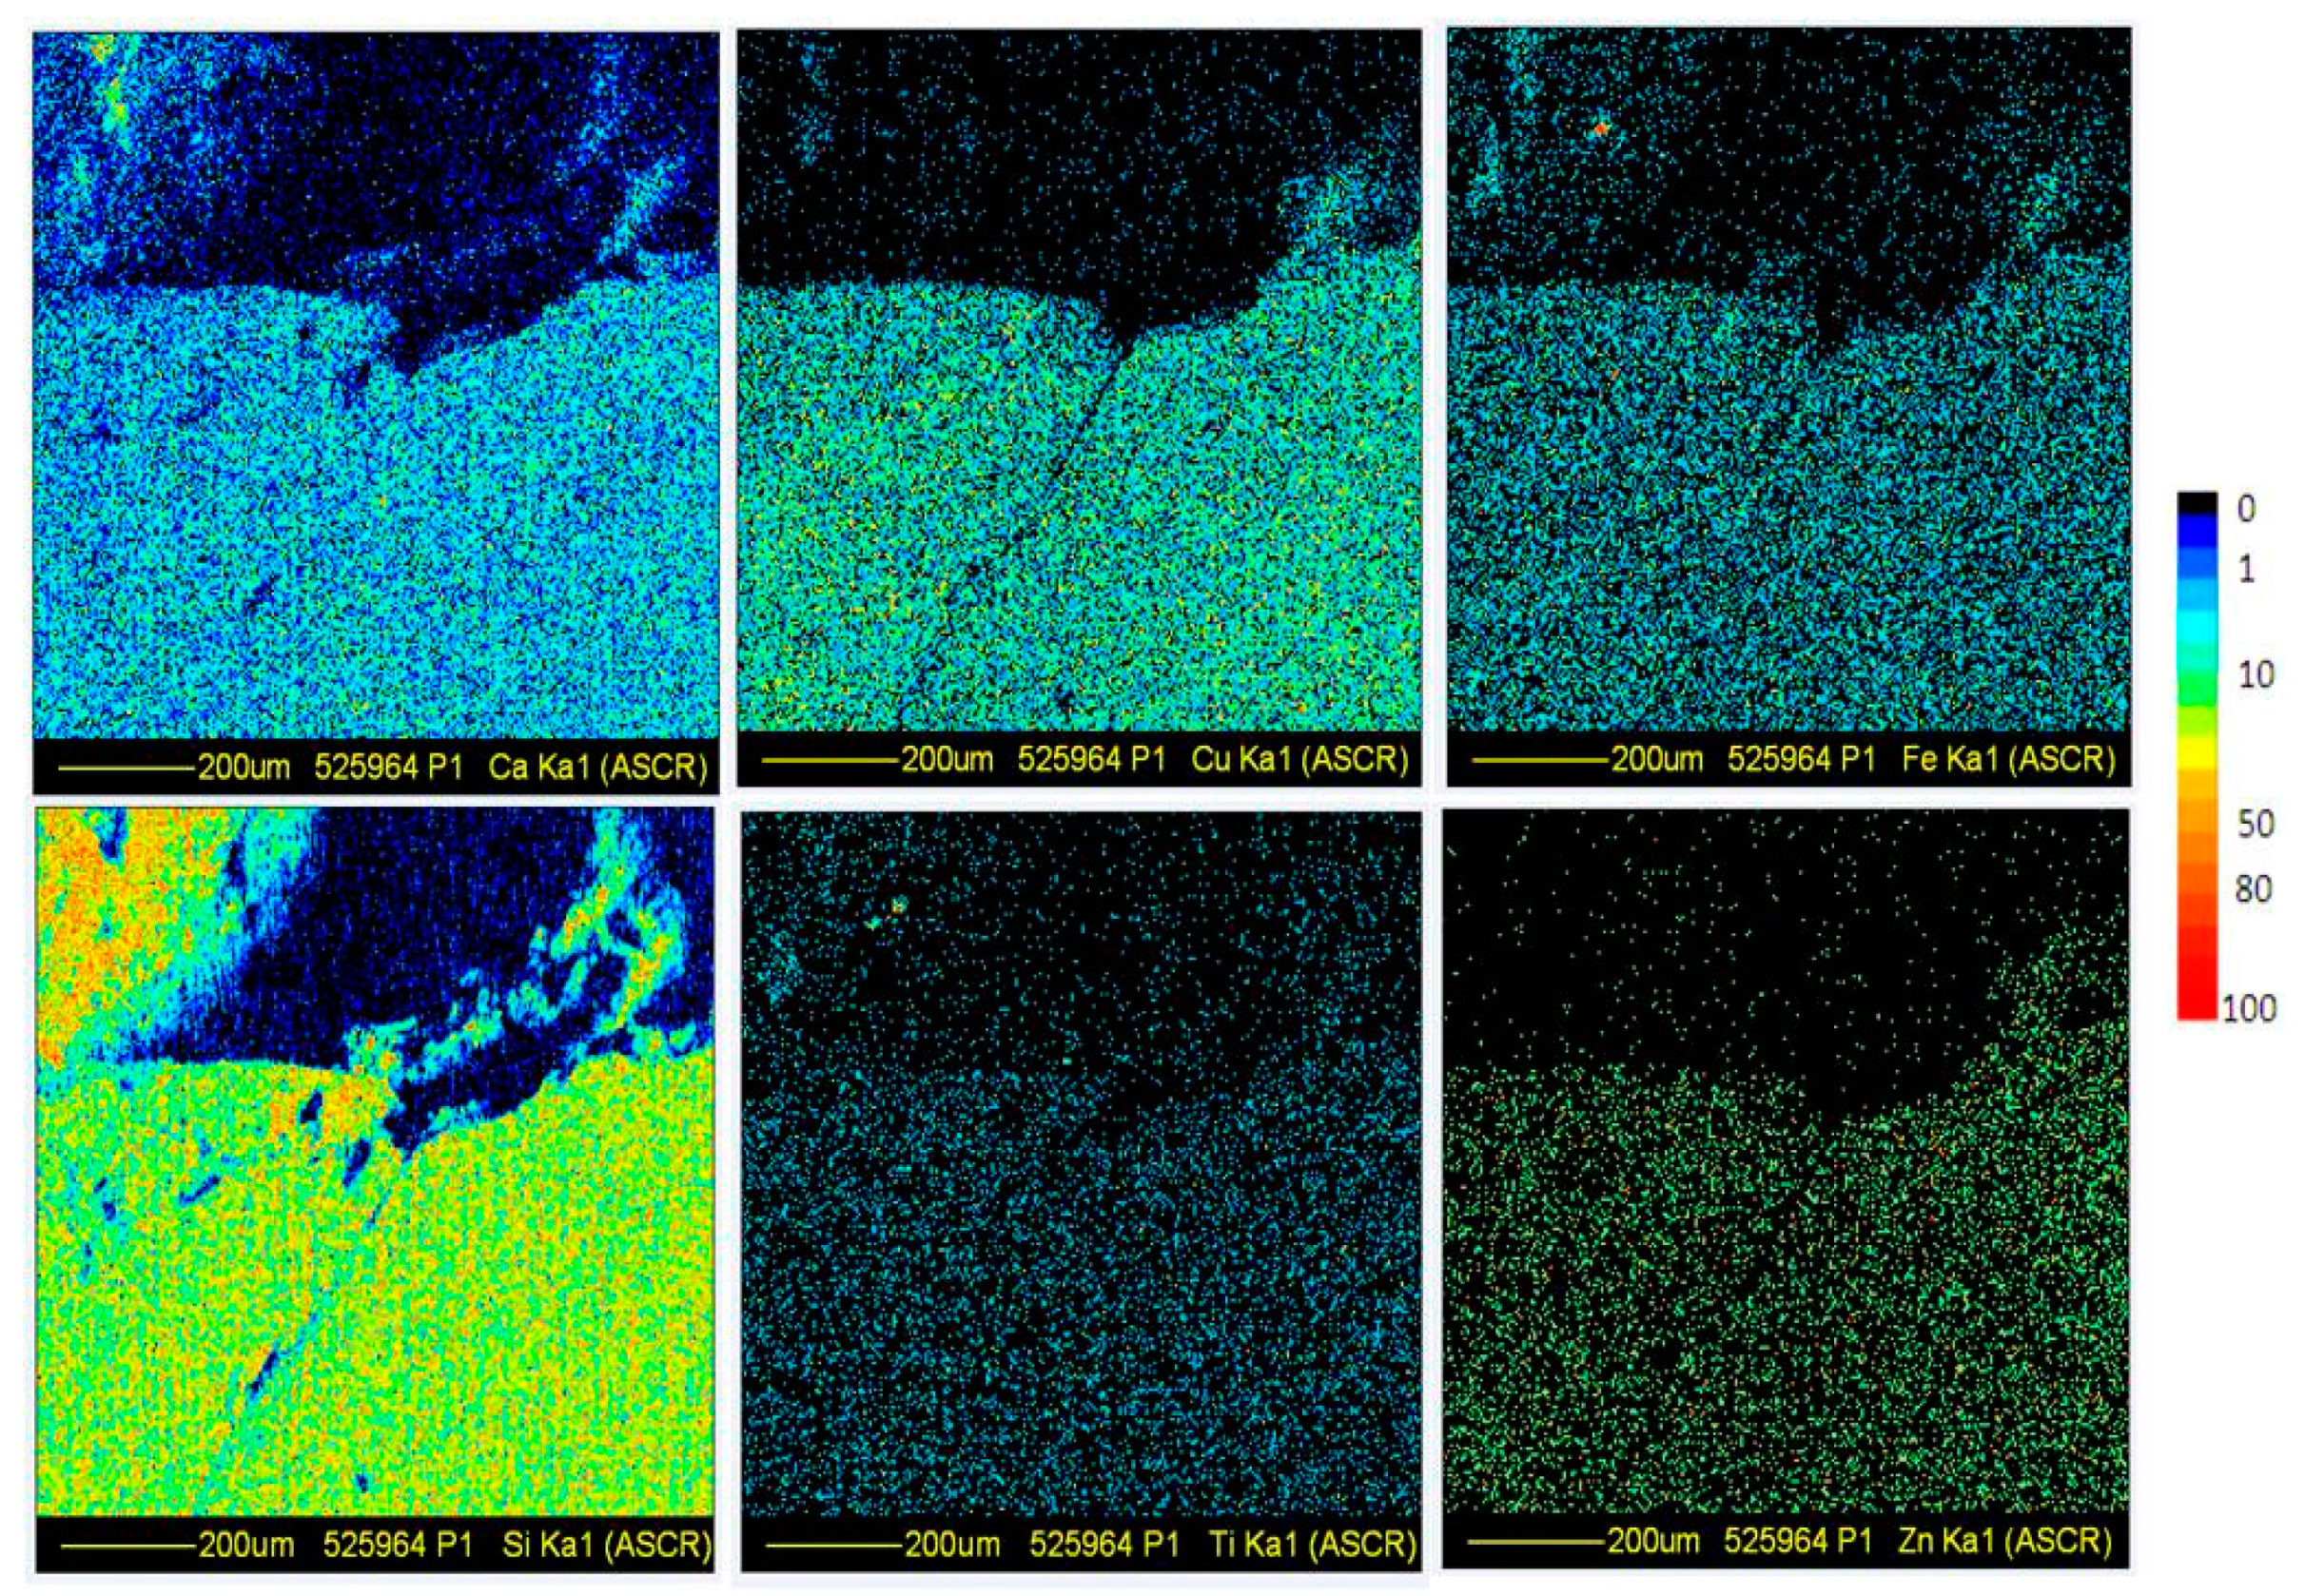
The obtained distributions for some of the main elements (Ca, Cu, Fe, Si, Ti, and Zn) are reported in Figure 9.
For all the detected elements, the distribution appears homogeneous, Si and Ca representing the main constituents of the glassy layer, Cu the main responsible of the blue coloration. TiO2 and ZnO could both have been used as opacifiers to tone down the classic shades in the case, for example, of dark blue [38].

3.3. SR-Based FTIR Spectroscopy Analysis

As already reported in Materials and Methods, the examination of small powdered portions of the samples by optical microscopy allowed distinguishing among grains from the bulk and from different pigmented surfaces. In both cases, the chemical characterization was performed by SR FTIR microscopy.
In the case of grains coming from the bulk, the analysis was aimed at the identification of current and neo-formation mineralogical phases in order to achieve information on the production process, in terms of raw materials and firing conditions.
As far as samples belonging to Group 1 are concerned, Figure 10 reports the photomicrographs, in white reflected light, of AZR3, AZR5, and AZR7 samples relative to the bulk area, after being pressed within the DAC, together with their corresponding average SR-FTIR micro-spectra.
The SR-FTIR spectra are rather similar, indicating a compositional homogeneity of these shards for what concerns the mineralogical phases. All spectra evidence a main peak at ~1087 cm−1, together with a shoulder at ~1162 cm−1, that can be ascribed to the presence of quartz (SiO2), together with another main peak at ~1047 cm−1, and a less intense one at ~1633 cm−1, and features at ~3450 cm−1, associated to montmorillonite ((Na,Ca)0,3(Al,Mg)2Si4O10(OH)2·n(H2O)). In addition, the characteristic band of calcite (CaCO3) at ~1445 cm−1 is observed in the spectra of AZR3 and AZR5 samples.
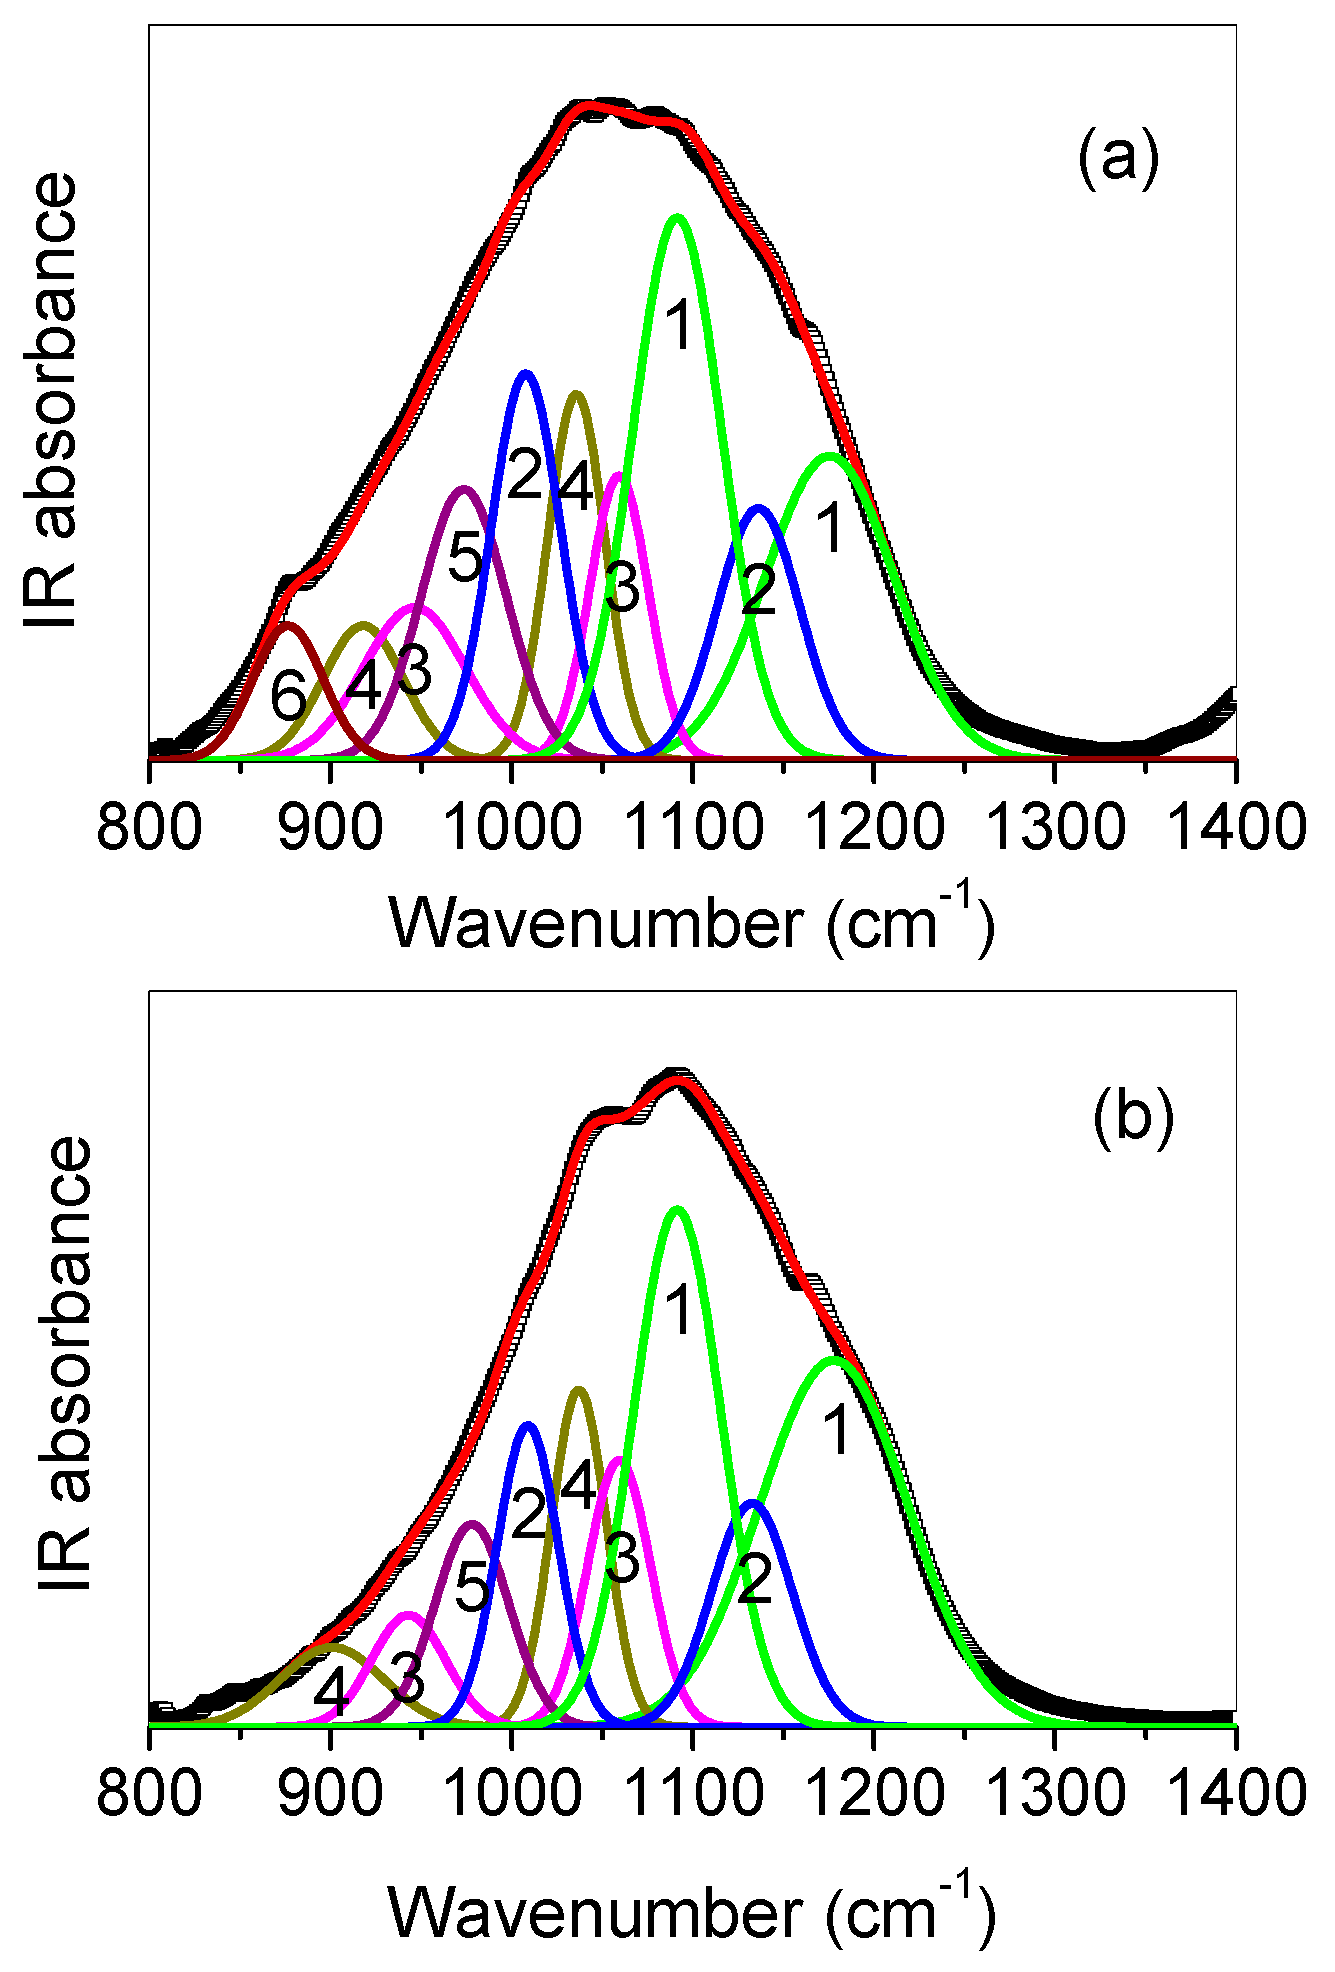
The high quality of our spectra has allowed for a quantitative analysis of the observed profiles, by means of deconvolution into symmetrical Gaussian profiles and curve-fitting. This is particularly helpful in the (800–1400) cm−1 spectral range, since, as has been already demonstrated [39], the complex broad band at ~1000 cm−1 contains several components that are fingerprint of the main mineralogical phases. The results of the best-fit procedure in the case of AZR3 and AZR7 shards are reported in Figure 11 as examples.
From the best-fit, other than quartz, montmorillonite and calcite (already mentioned), typical vibrational bands of oligoclase ((Ca,Na)(Al,Si)4O8, bands at ~1009 cm−1, ~1135 cm−1), diopside (CaMg(Si2O6), bands at ~944 cm−1, ~1059 cm−1), and anorthite (CaAl2Si2O8, band at ~975 cm−1) have been recognized.
Concerning AZR1 fragment, belonging to Group 2, 
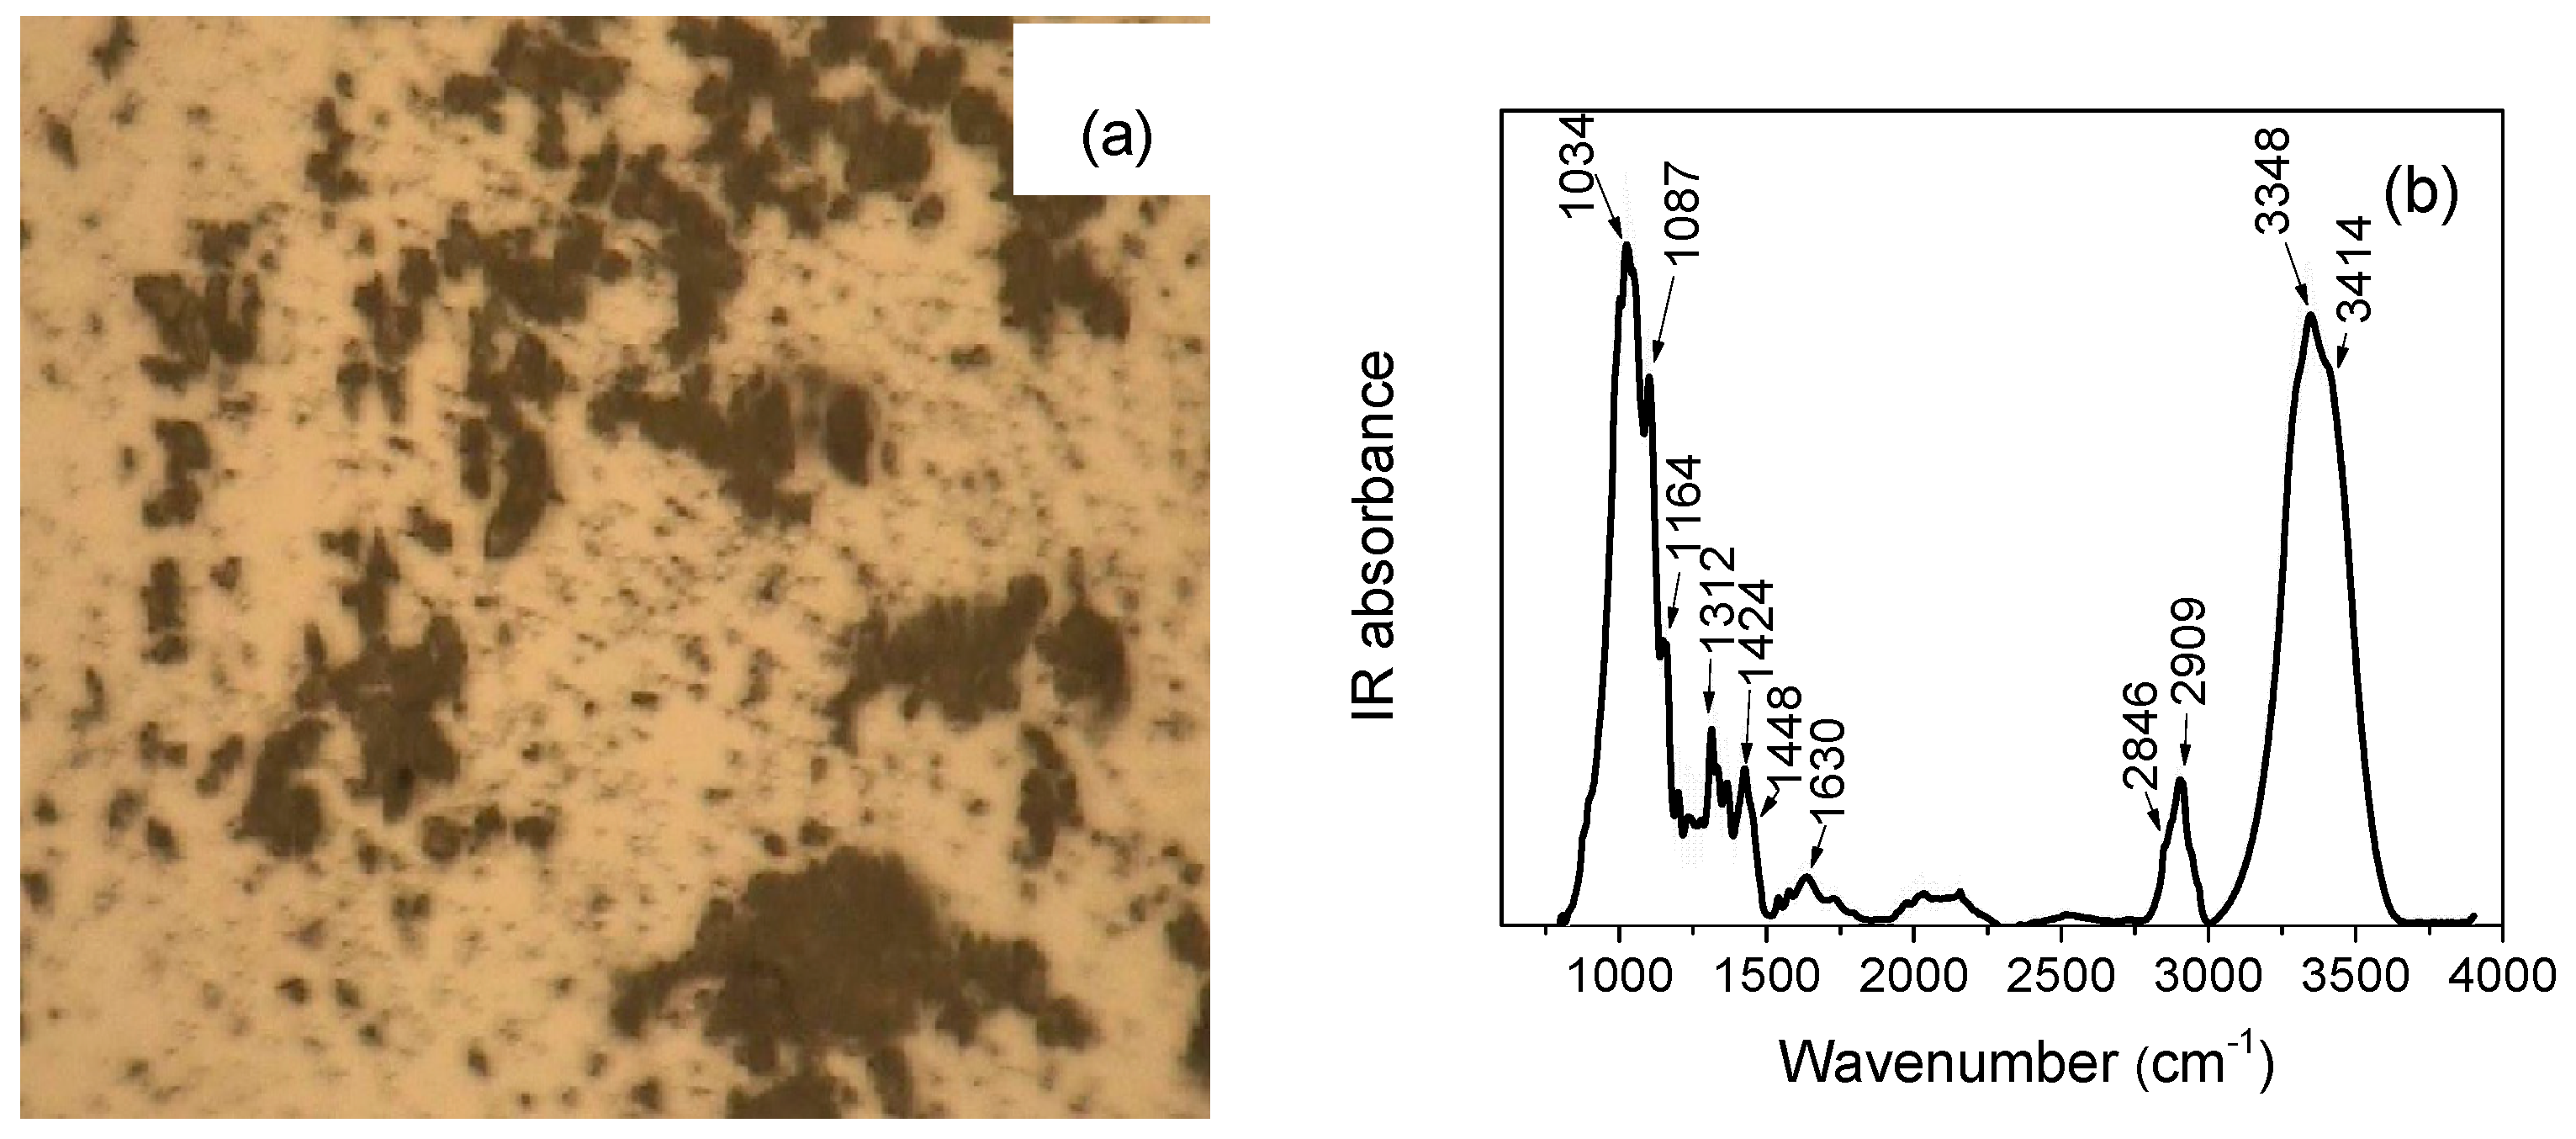
Figure 12a shows the photomicrograph of the sample, relative to the bulk area. The corresponding SR-FTIR micro-spectrum is reported in Figure 12b.
With regard to the mineralogical phases, a first examination of the spectrum has allowed us to clearly recognize the presence of montmorillonite, as indicated by the peaks at ~1034 cm−1, ~1630 cm−1, ~3348 cm−1, and ~3414 cm−1. In particular, the former two peaks are typically assigned to the hydration water molecules of this mineral. Looking further into the spectrum, we could postulate the presence of quartz by the peaks at ~1087 cm−1 and ~1164 cm−1. Metal carboxylates (νsym COO at ~1424 cm−1) and oxalates (νsym COO at ~1312 cm−1, respectively) peaks are also detected, that can derive from the degradation of some organic compound. About this, it is worth noting that the C-H stretching contributions that appear in the same spectrum at ~2846 cm−1 and ~2909 cm−1 support the presence of a proteinaceous material subjected to degradation processes [40]. Finally, the shoulder at ~1448 cm−1 is associated with the presence of calcite.
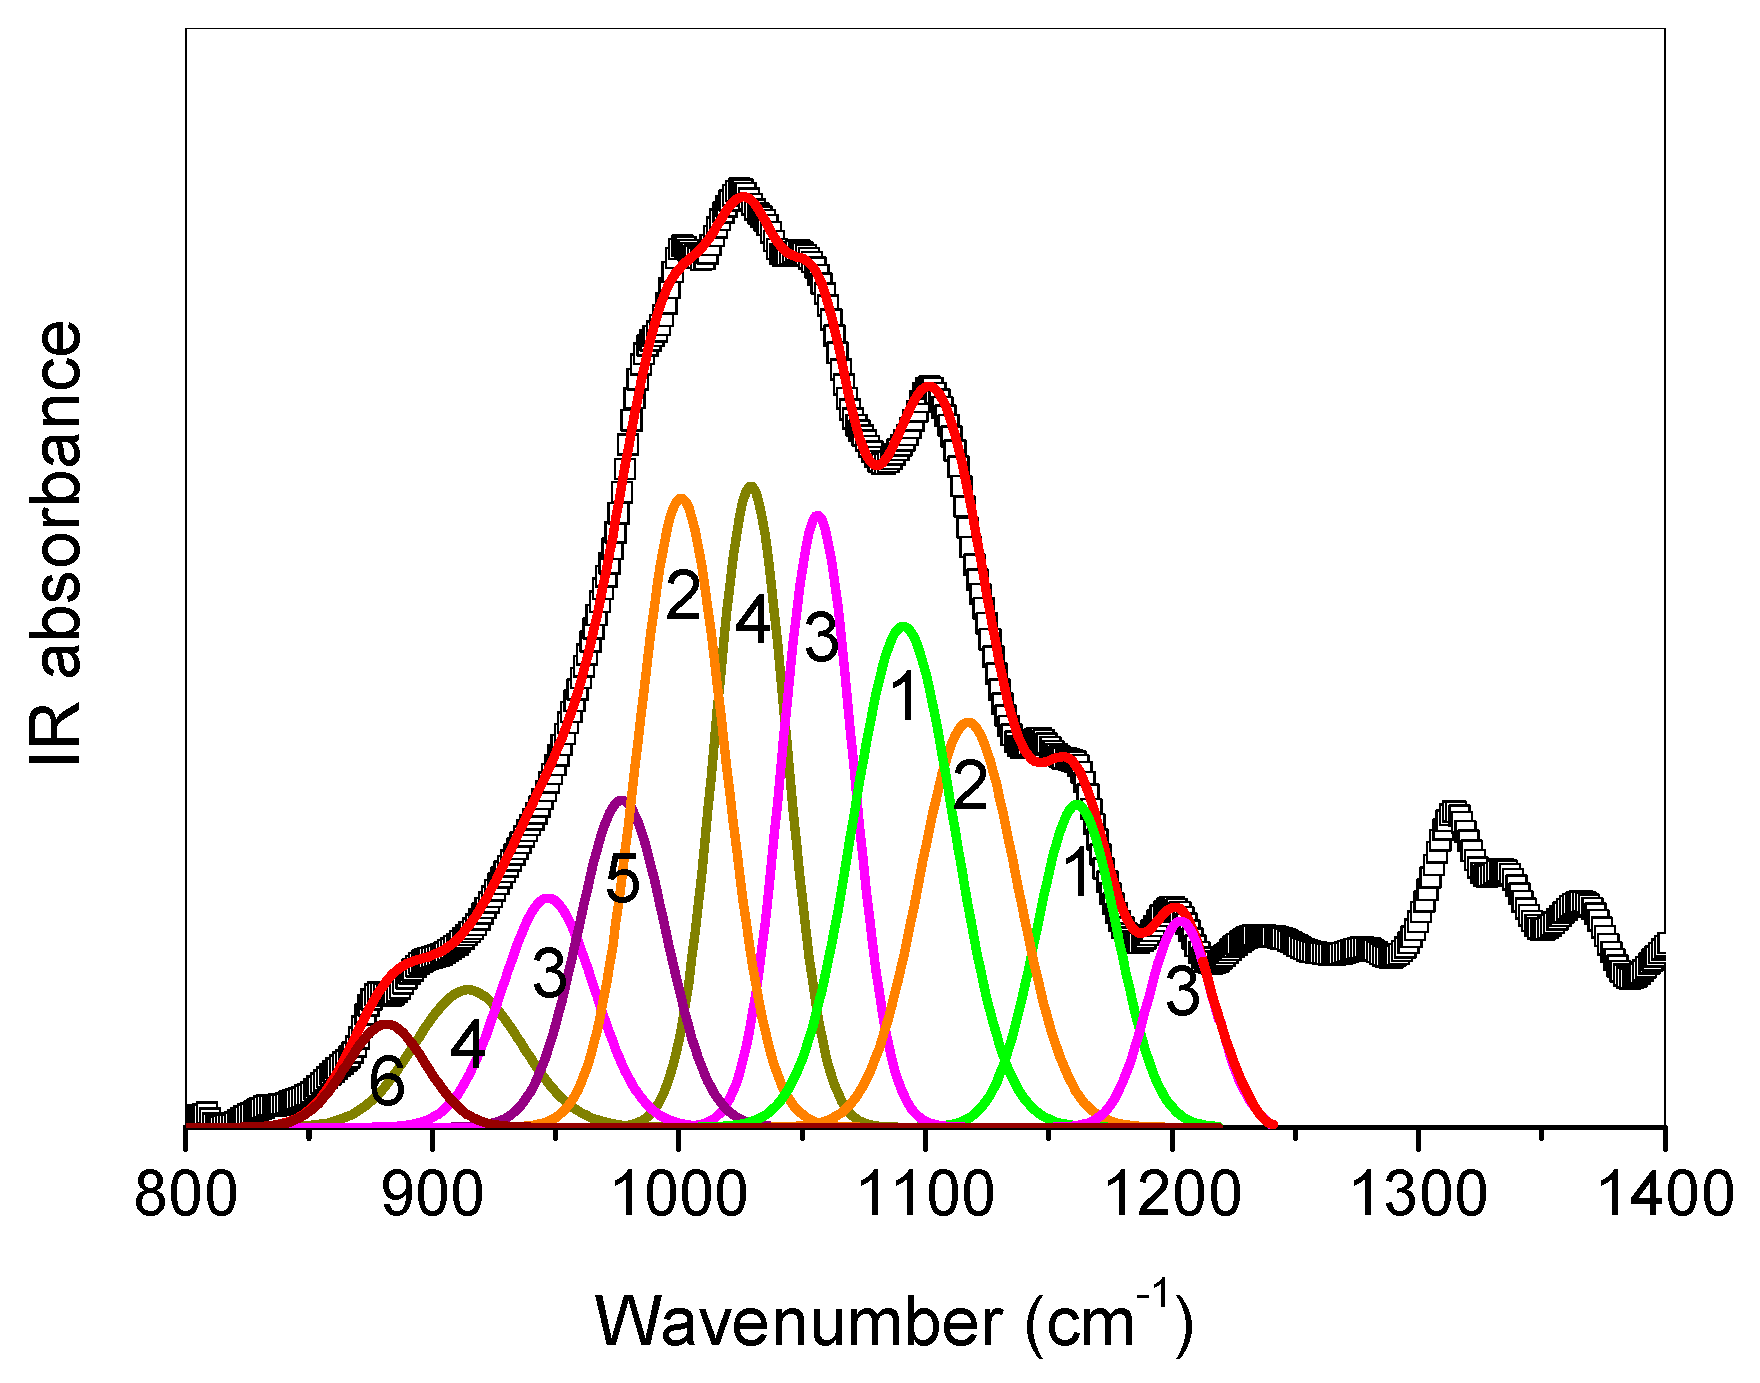
Deconvolution into symmetrical Gaussian profiles and curve-fitting of the (800–1250) cm−1 spectral range was performed, and the results of the best-fit procedure are reported in Figure 13.
Other than the aforementioned montmorillonite, quartz and calcite, also orthoclase (KAISi3O8, bands at ~1002 cm−1, ~1118 cm−1), diopside (bands at ~947 cm−1, ~1056 cm−1, ~1203 cm−1) and anorthite (band at ~978 cm−1) have been identified.
In Table 6, the qualitative mineralogical phase composition relative to the ceramic bulk of all the investigated shards is reported.
Diopside and anorthite are reported to be formed at (850–950) °C through the reaction between silica and carbonate materials [41]. Hence, their presence testifies a maximum firing temperature around these values, whereas quartz and feldspars can persist above 1000 °C [42]. This hypothesis is also supported by the absence of gehlenite, that, as is well known, tends to vanish at –900 °C, as well as of high-temperature neo-formation minerals. Going on, montmorillonite could be derived from the hydrolysis process occurring during the burial period of the findings [43]. Finally, as far as the presence of calcite revealed for AZR3, AZR5, and AZR1 samples is concerned, it is well known that at temperatures above (750–800) °C calcite dissociates in calcium oxide (CaO) and carbon dioxide (CO2). Its observation for these three samples, could then testify a firing process performed at low temperature, around (650–750) °C, or incomplete, probably due to an inhomogeneous heat distribution inside the kiln, that didn’t permit the completion of decomposition and formation reactions. Nevertheless, decarbonation of calcite may extend to (1000–1100) °C for calcite rich systems and/or in case of coarse mineral grains and rapid heating rate [44]. Again, calcite can probably be of secondary origin, in agreement with what observed for AZR3 fragment by PIXE and ion-microbeam analyses, due to conservation circumstances such as burial conditions in humid soil, because of the gradual interactions of hygroscopic lime (CaO)-moisture and calcium hydroxide [Ca(OH)2]-atmospheric CO2.
Hence, the whole observations suggest a firing temperature surely higher that 850 °C and in particular in the range (850–950) °C for all the investigated samples, despite the presence of calcite.
As far as the grains coming from the different pigmented surfaces are concerned, the analysis was aimed at the identification of pigmenting agents used for decoration.
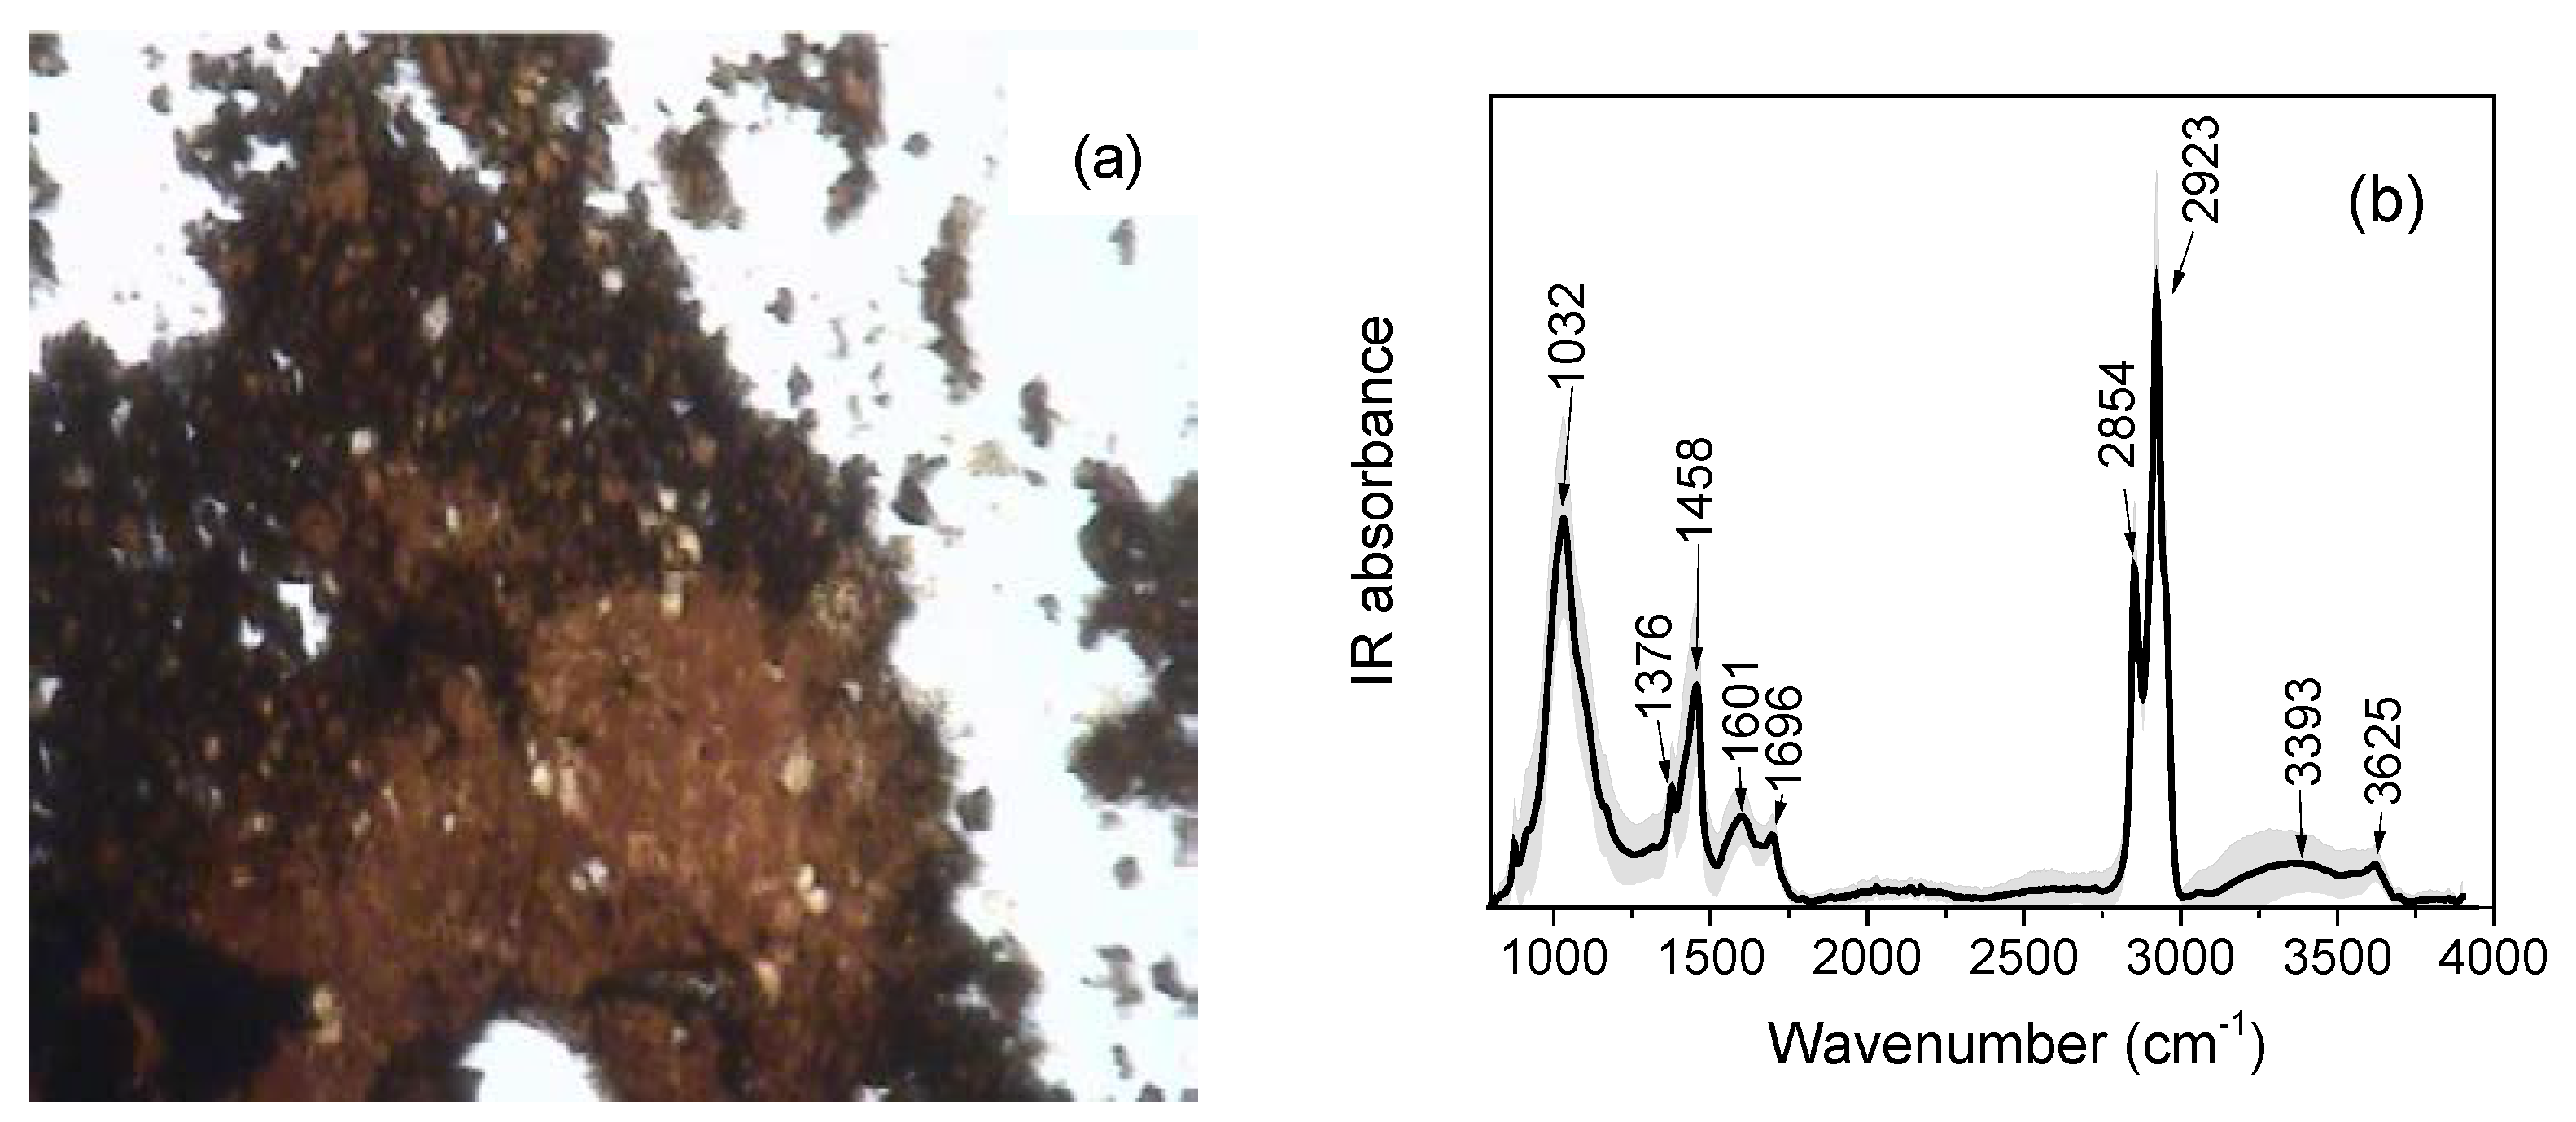
Figure 14 shows the photomicrograph, in white reflected light, of sample AZR3, relative to the black pigmented area, together with the corresponding average SR-FTIR spectrum.
The collected average absorption spectrum reveals several peaks, that, based on comparison with database and literature [29] could be attributed to burnt umber (features at ~1032 cm−1, ~1458 cm−1, ~3393 cm−1, and ~3625 cm−1), a deep brown color pigment obtained by heating raw umber, a natural clay pigment consisting of iron oxide, manganese oxide and aluminum oxide (Fe2O3 + MnO2 + nH2O + Si + AlO3), mixed with some organic binder that seems to be a fatty acid (features in the ~1300 ÷ 1700 cm−1 range, at ~2854 cm−1 and ~2923 cm−1).
As far as sample AZR5 is concerned, the average SR-FTIR spectrum collected (data not shown) on the dark yellow pigmented area unfortunately only gave evidence of a vitreous matrix, hindering the identification of the pigment.
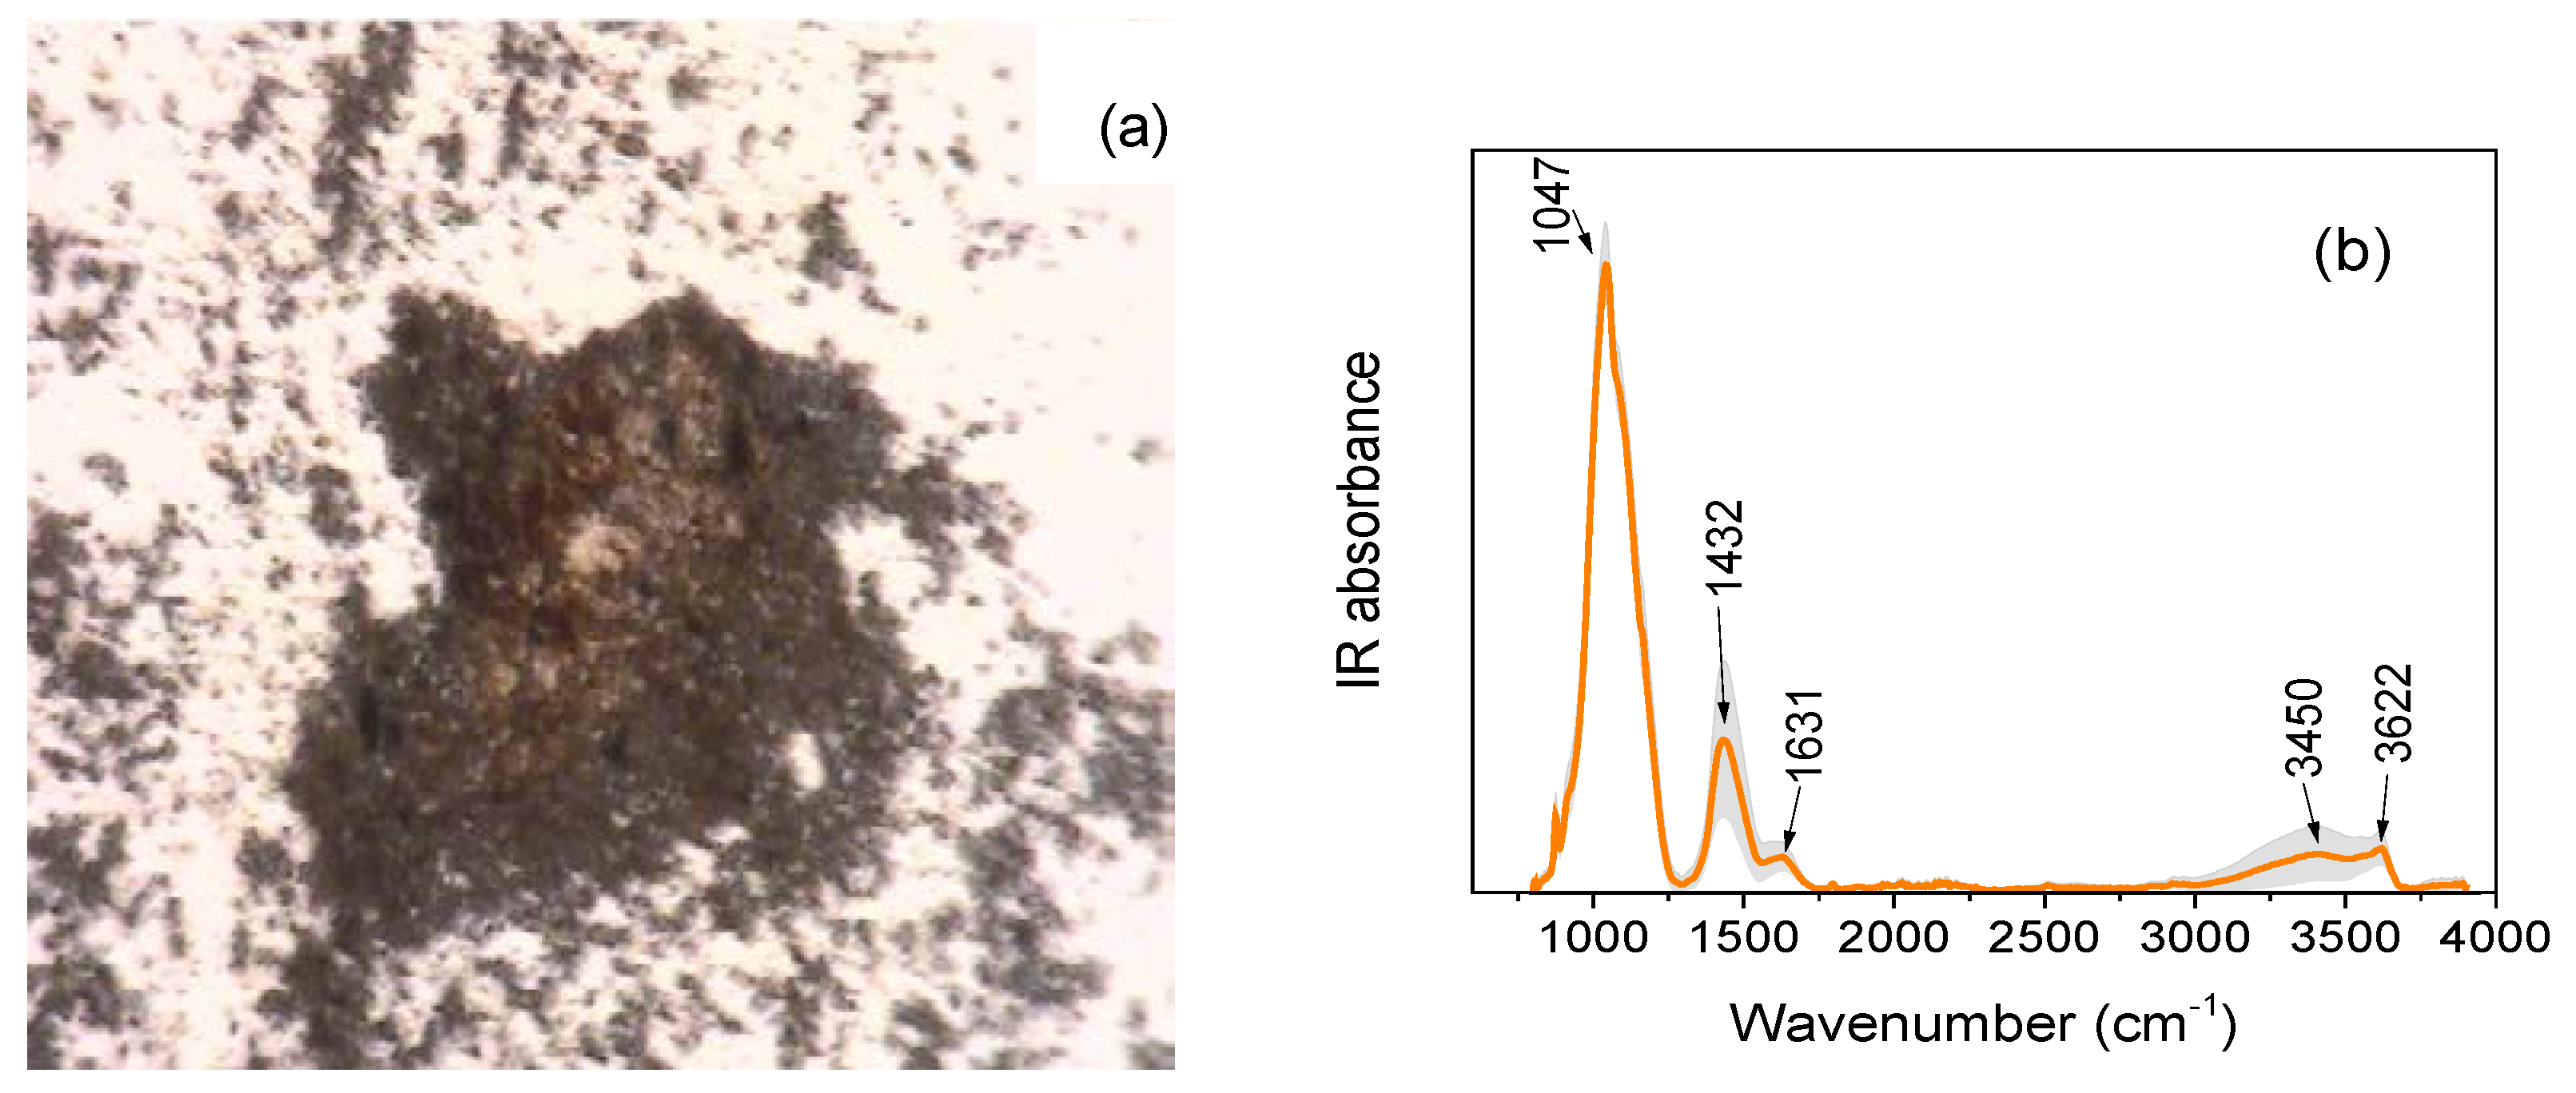
In Figure 15, we report the photomicrograph, in white reflected light, of sample AZR7, relative to the yellowish pigmented area, together with the corresponding SR-FTIR average spectrum.
Based on the literature [45], the collected SR-FTIR average spectrum can be mainly ascribed to limonite, a yellow earth pigment known since antiquity, composed of a mixture of various iron oxide and hydroxide minerals, the most common among them being goethite, α-FeOOH and lepidocrocite, and γ-FeOOH.
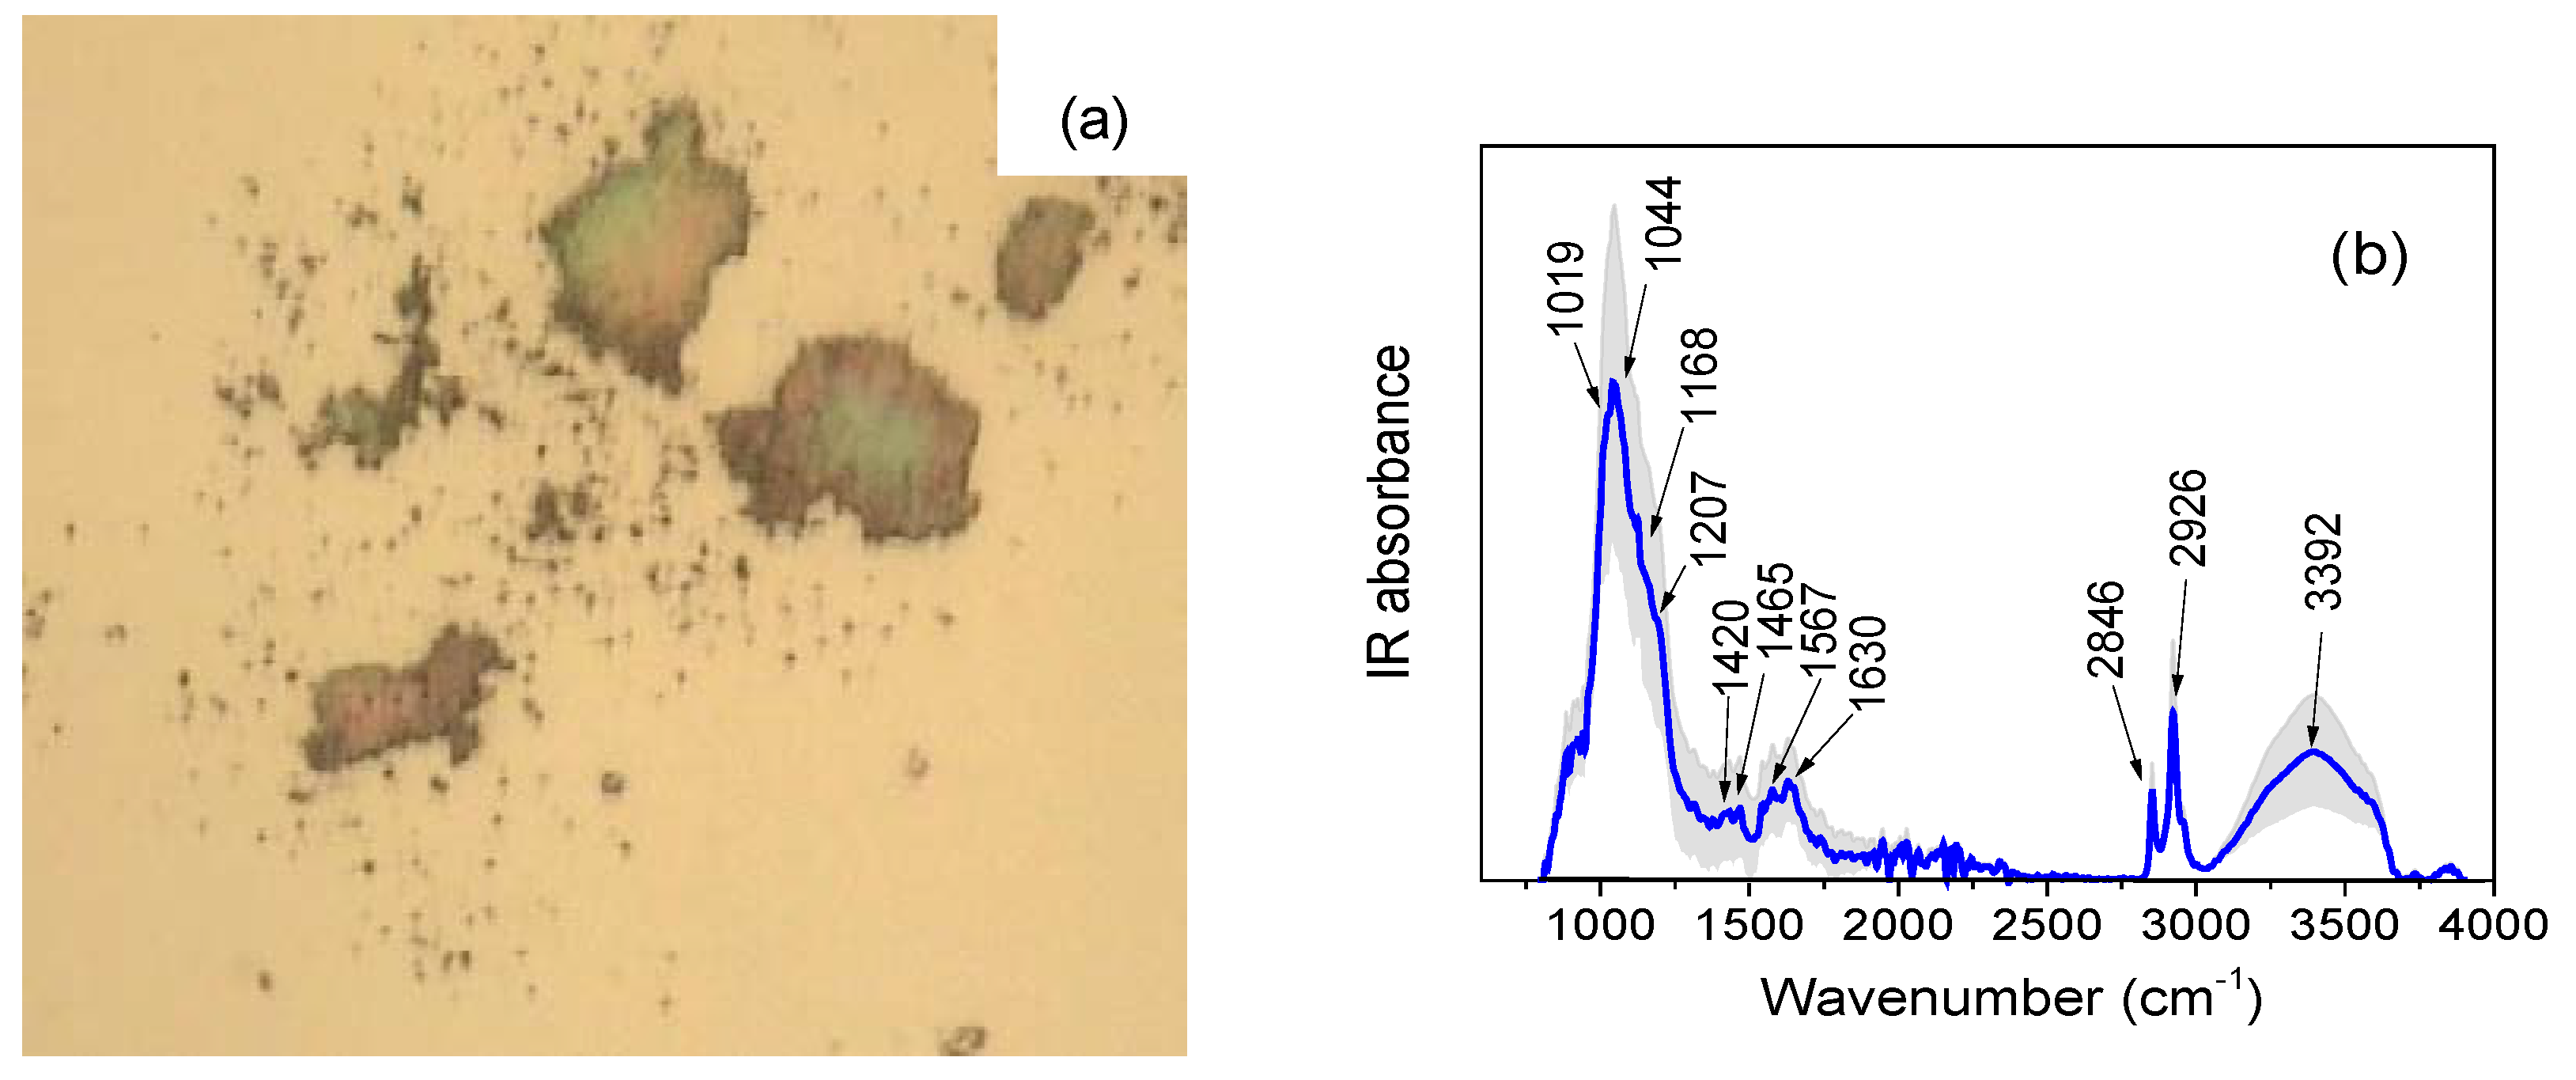
Figure 16a reports the photomicrograph of sample AZR1, relative to the blue pigmented area. The corresponding SR- FTIR average spectrum is reported in Figure 16b.
Once again, the comparison with database and literature [29] has allowed us to identify as pigmenting agent the cuprorivaite (CaCuSi4O10) mineral (features at ~1019 cm−1, ~1044 cm−1, ~1168 cm−1, and ~1207 cm−1). This pigment is a compound produced since the ancient Egypt time by means of a high temperature (>800 °C) synthesis starting from siliceous sand, a copper compound, calcium carbonate and sodium carbonate as a flux. It appears bounded together with some organic binders of proteinaceous origin (features in the ~1400 ÷ 1700 cm−1 range, at ~2846 cm−1, ~2926 cm−1, and ~3392 cm−1).
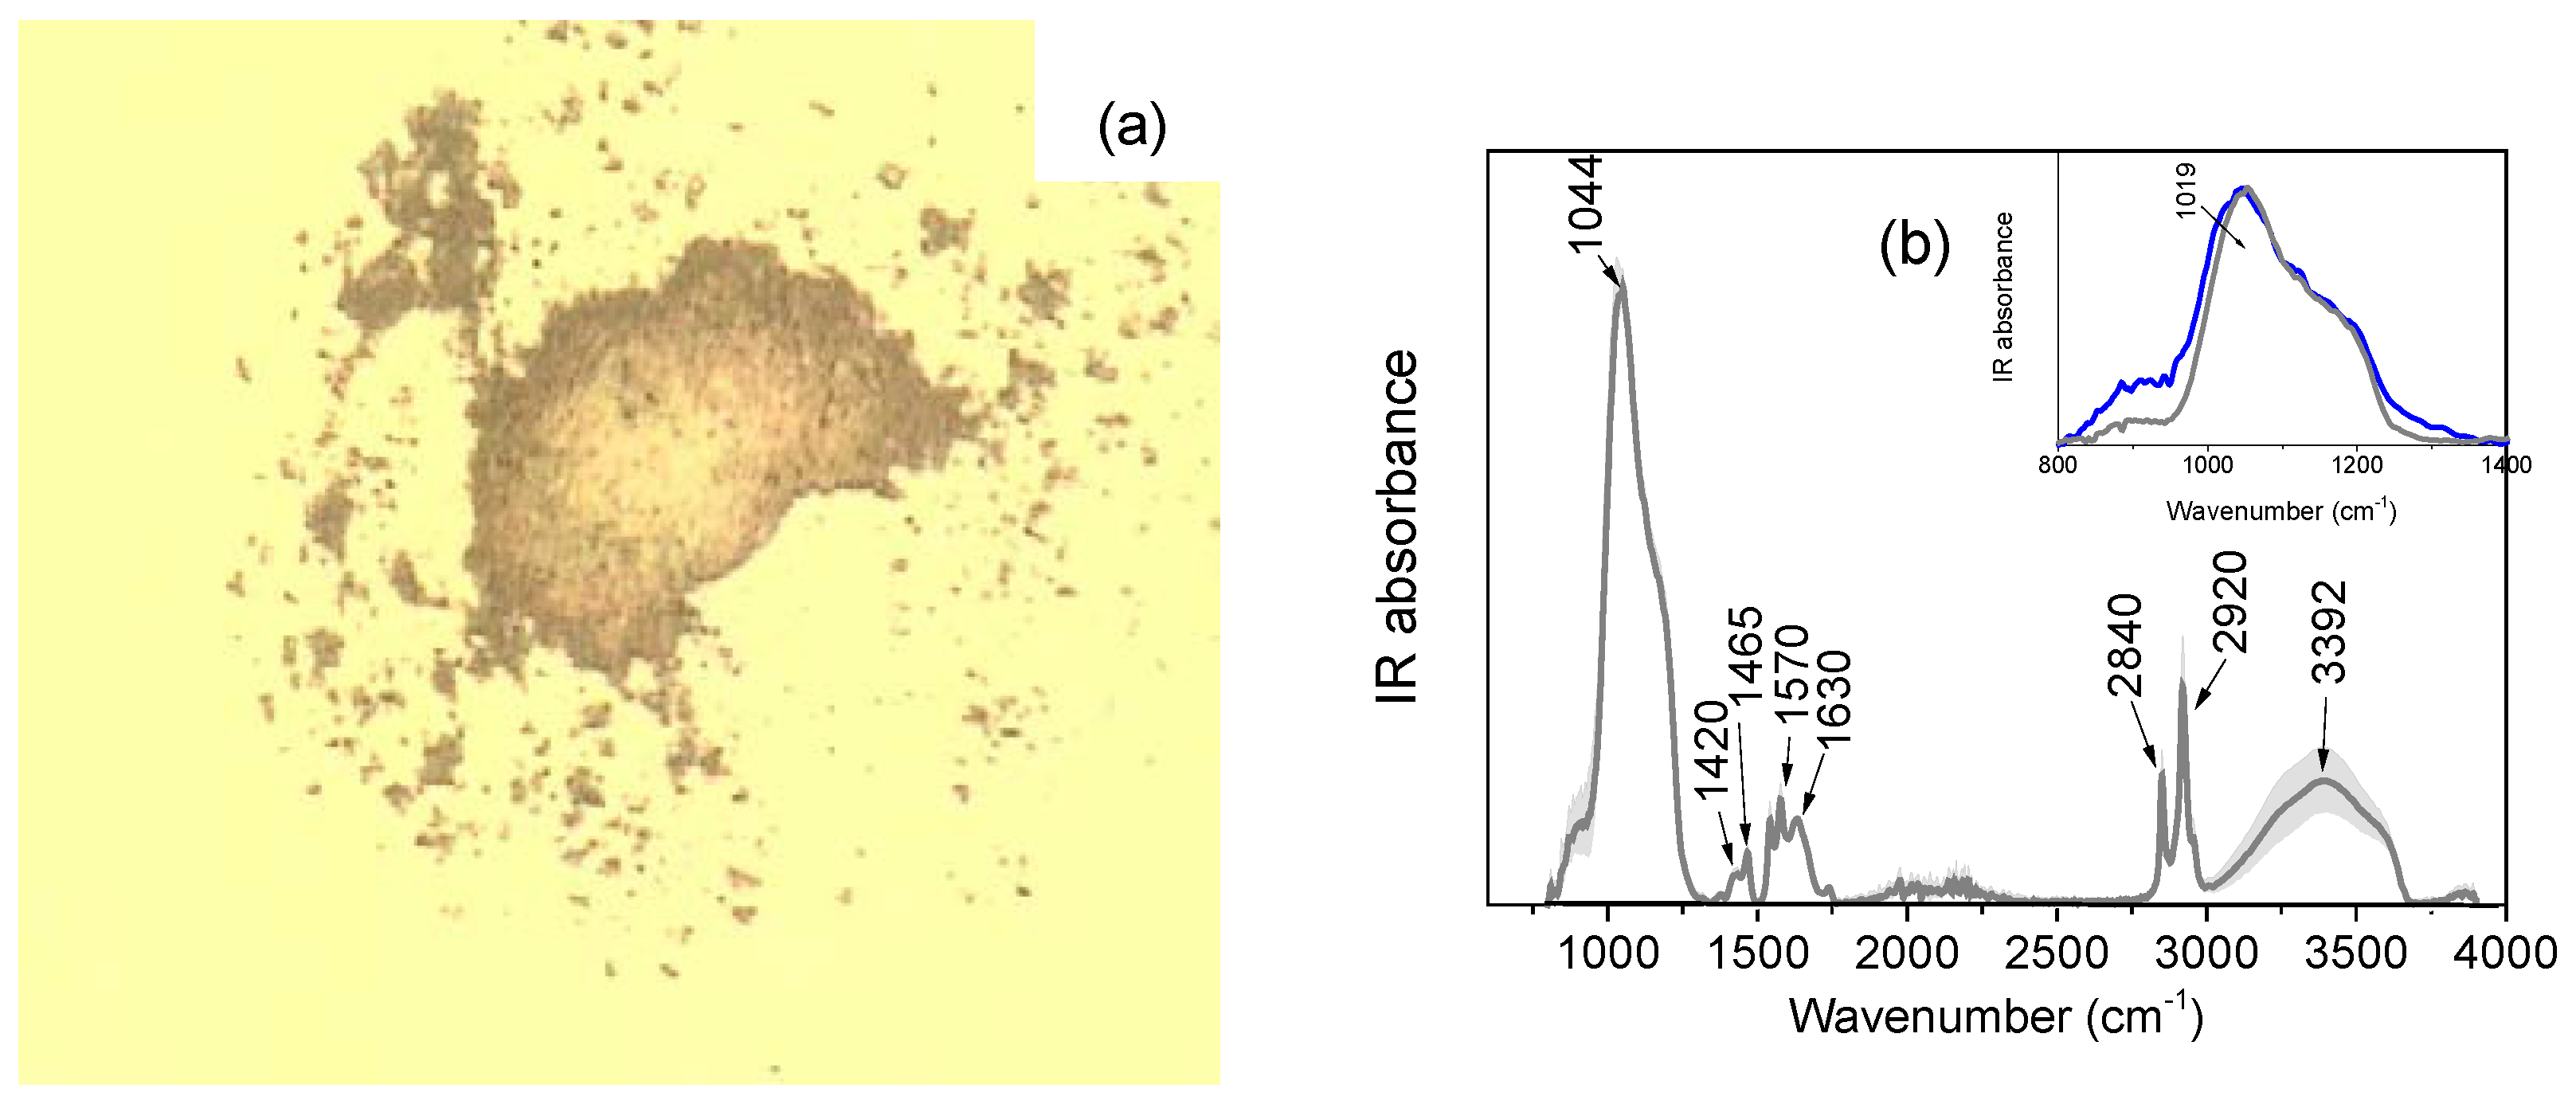
The photomicrograph relative to the area without pigment of sample AZR1 is shown in Figure 17a. The corresponding SR- FTIR average spectrum is reported in Figure 17b.
The composition of the area without pigment seems similar to the blue pigmented zone, but more homogeneous, as can be seen by the relatively low standard deviation. A more detailed comparison of the SR-FTIR spectra collected in the (800–1400) cm−1 wavenumber range in the blue pigmented area and in the area without pigment (see inset of Figure 17b) reveals, in this last case, the strong decreasing of the contribution at ~1019 cm−1 typical of cuprorivaite.

4. Conclusions

Selected pottery fragments dated back XIX century A.D. taken from the archaeological site of Agsu in Azerbaijan underwent non-invasive/micro-destructive investigations at elemental level by RBS, PIXE, ion-microbeam, and at microscopic level by SR-FTIR techniques.
By means of this combined methodological approach involving different spatial regimes, the identification of raw materials, pigments and binders used for the manufacture technology was achieved, together with their distribution in the shards, so obtaining crucial information in order to clarify technological features and preparation processes typical of the local population. In this sense, our work appears relevant for demonstrating the necessity of applying an archaeometric approach to increase the few available historical information.
From whole set of results, a Chinese provenance is hypothesized for all the investigated fragments, together with a maximum firing temperature around (850–950) °C.
As far as pigmenting agents used for the decoration are concerned, burnt umber, limonite, and cuprorivaite have been identified as responsible for the black, yellowish and blue colors, respectively, whereas the used binders have fatty acid and proteinaceous nature.
The obtained data appear a valid basis for future systematic studies in this area, almost unexplored from the archaeometric point of view.
In this sense, a future development of the research will deal with the application of the data related to major and trace elements in next studies in which geological clay samples will undergo the same analysis campaign to evaluate the local or different provenance of the raw materials.
It is finally worth remarking that the present work is one of the first attempts to validate SR-based FTIR technique as micro-destructive powerful tool for achieving a detailed compositional characterization of potteries of historical-artistic interest. It could be potentially applied to all those times in which conventional methods fall down for several reasons.

Author Contributions

Conceptualization, M.F.L.R.; methodology, L.T. and D.M.; validation, V.V., V.C., M.C., G.B., L.V., and M.R.; formal analysis, L.T., V.V., V.C., L.S., and M.C.; investigation, L.T., V.V., V.C., M.C., A.T., V.H., A.M., G.B., and L.V.; data curation, L.T., V.V., V.C., L.S., M.C., G.P., A.T., V.H., A.M., G.B., and L.V.; writing—original draft preparation, L.T., V.V., V.C., and L.S.; writing—review and editing, L.T. and D.M.; visualization, V.V., V.C., L.S., and M.R.; supervision, L.T., V.V., V.C., L.S., M.F.L.R. and D.M.; project administration, A.M. and F.K.; funding acquisition, L.T.

Funding

This work was supported by the “Research and Mobility” project of Messina University No. 74893496. IBA analysis has been realized at the CANAM (Center of Accelerators and Nuclear Analytical Methods) infrastructure LM 2015056 and has been supported by project GACR No. 16-05167S.

Acknowledgments

The authors acknowledge the CERIC-ERIC Consortium for the access to experimental facilities and financial support (beamtime number: 20147024).

Conflicts of Interest

The authors declare no conflict of interest.

References

  1. Bayazit, M.; Işık, I.; Issi, A.; Genç, E. Archaeometric investigation of the Late Chalcolithic-Early Bronze Age I and the 1st–2nd millennium BCE potteries from Kuriki-Turkey. Appl. Clay Sci. 2016, 126, 180–189. [Google Scholar] [CrossRef]
  2. Szilágyi, V.; Gyarmati, J.; Tóth, M.; Taubald, H.; Balla, M.; Kasztovszky, Z.; Szakmány, G. Petro-mineralogy and geochemistry as tools of provenance analysis on archaeological pottery: Study of Inka Period ceramics from Paria, Bolivia. J. South Am. Earth Sci. 2012, 36, 1–17. [Google Scholar] [CrossRef]
  3. Javanshah, Z. Chemical and mineralogical analysis for provenancing of the Bronze Age pottery from Shahr-I-Sokhta, South Eastern Iran. Sci. Cult. 2018, 4, 83–92. [Google Scholar]
  4. Aquilia, E.; Barone, G.; Crupi, V.; Longo, F.; Majolino, D.; Mazzoleni, P.; Venuti, V. Multi-technique characterization of ancient findings from Gela (Sicily, Italy). J. Anal. At. Spectrom. 2011, 26, 977–983. [Google Scholar] [CrossRef]
  5. Samanian, K.; Abbasi, Z.; Kaldareh Ismailzadeh, A. Archaeometrical study of the used materials in Qajar easel painting using XRD, XRF, PLM and FTIR techniques: A case study of “Egyptian Girl” tablout. Mediterr. Archaeol. Archaeom. 2013, 13, 159–179. [Google Scholar]
  6. Bardelli, F.; Barone, G.; Crupi, V.; Longo, F.; Majolino, D.; Mazzoleni, P.; Venuti, V. Combined non-destructive XRF and SR-XAS study of ar, chaeological artefacts. Anal. Bioanal. Chem. 2011, 399, 3147–3153. [Google Scholar] [CrossRef] [PubMed]
  7. Crupi, V.; Kasztovszky, Z.; Khalilli, F.; La Russa, M.F.; Macchia, A.; Majolino, D.; Rossi, B.; Rovella, N.; Ruffolo, S.A.; Venuti, V. Evaluation of complementary methodologies applied to a preliminary archaeometric study of glazed pottery from Agsu (Azerbaijan). Int. J. Conserv. Sci. 2016, 7, 901–912. [Google Scholar]
  8. Crupi, V.; Majolino, D.; Venuti, V.; Barone, B.; Mazzoleni, P.; Pezzino, A.; La Russa, M.F.; Ruffolo, S.A.; Bardelli, F. Non-destructive identification of green and yellow pigments: The case of some Sicilian Renaissance glazed pottery. Appl. Phys. A Mater Sci. Process. 2010, 100, 845–853. [Google Scholar] [CrossRef]
  9. Sedek, H. Multi-analytical approach for the study of glazed pottery from Al-Fustat, Egypt. Mediterr. Archaeol. Archaeom. 2016, 16, 65–71. [Google Scholar]
  10. Nishiaki, Y.; Guliyev, F.; Kadowaki, S. Chronological contexts of the earliest pottery neolithic in the South Caucasus: Radiocarbon dates for Göytepe and Hacı Elamxanlı Tepe, Azerbaijan. Am. J. Archaeol. 2015, 119, 279–294. [Google Scholar] [CrossRef]
  11. Jabiev, G.; Khalilli, F. Researches of the Agsu Archaeological Expedition in 2010—I Volume; Miras: Agsu, Azerbaijan, 2010. [Google Scholar]
  12. Ye, L.; Liu, M.T.; Huang, W.; Yang, S.; An, Z. PIXE/RBS studies of ancient pottery from Jinsha ruins site of Chengdu. Nucl. Phys. Rev. 2010, 27, 493–499. [Google Scholar]
  13. Zhang, Z.Q.; Cheng, H.S.; Xia, H.N.; Jiang, J.C.; Yang, F.J. Non-destructive analysis and appraisal of ancient Chinese porcelain by PIXE. Nucl. Instrum. Methods Phys. Res. Sect. B Beam Interact. Mater. Atoms 2002, 190, 488–491. [Google Scholar]
  14. Cheng, H.S.; Zhang, Z.Q.; Song, J.; Gao, M.H.; Zhu, D.; Lin, J.W.; Feng, S.L. PIXE study on ancient pottery from Chinese Shanghai area. Nucl. Instrum. Methods Phys. Res. Sect. B Beam Interact. Mater. Atoms 2006, 249, 601–603. [Google Scholar] [CrossRef]
  15. Torrisi, L.; Italiano, A.; Cutroneo, M.; Gentile, C.; Torrisi, A. Silver coins analyses by X-ray fluorescence methods. J. X-ray Sci. Technol. 2013, 21, 381–390. [Google Scholar]
  16. Cutroneo, M.; Havranek, V.; Torrisi, L.; Svecova, B. Ion Micro Beam, promising methods for interdisciplinary research. J. Instrum. 2016, 11, 1–9. [Google Scholar] [CrossRef]
  17. Macková, A.; Kučera, J.; Kameník, J.; Havránek, V.; Kranda, K. Ion and Neutron Beams Discover New Facts from History. Nucl. Phys. News 2017, 27, 12–17. [Google Scholar] [CrossRef] [Green Version]
  18. Sadek, H.; El Hady, A. Characteristics of ancient Egyptian glazed ceramic objects from Fatimid and Mamluk periods as revealed by ion beam analysis. In IOP Conference Series: Materials Science and Engineering, Proceedings of the International Conference on the Use of X-ray (and related) Techniques in Arts and Cultural Heritage (XTACH 11), Sharjah, United Arab Emirates, 7–8 December 2011; IOP Publishing: Bristol, UK, 2012; Volume 37, p. 012016. [Google Scholar]
  19. Bouquillon, A.; Castaing, J.; Salomon, J.; Zucchiatti, A.; Lucarelli, F.; Mando, P.A.; Prati, P.; Lanterna, G.; Vaccari, M.G. IBA techniques to study renaissance pottery techniques. Fundam. Appl. Asp. Mod. Phys. 2001, 9, 441–448. [Google Scholar]
  20. Salvadó, N.; Butí, S.; Tobin, M.J.; Pantos, E.; Prag, A.J.N.W.; Pradell, T. Advantages of the use of SR-FT-IR microspectroscopy: Application to cultural heritage. Anal. Chem. 2005, 77, 3444–3451. [Google Scholar] [CrossRef]
  21. Carr, G.L. High-resolution microspectroscopy and sub-nanosecond time-resolved spectroscopy with the synchrotron infrared source. Vib. Spectrosc. 1999, 19, 53–60. [Google Scholar] [CrossRef]
  22. Carr, G.L. Resolution limits for infrared microspectroscopy explored with synchrotron radiation. Rev. Sci. Instrum. 2001, 72, 1613–1619. [Google Scholar] [CrossRef]
  23. NIST-CANAM. Available online: http://www.ujf.cas.cz/cs/vyzkum-a-vyvoj/velke-vyzkumne-infrastruktury-a-centra/canam/about-the-project/ (accessed on 1 June 2019).
  24. Ryan, C.G.; Cousens, D.R.; Sie, S.H.; Griffin, W.L. Quantitative analysis of PIXE spectra in geosciences applications. Nucl. Instrum. Methods Phys. Res. Sect. B Beam Interact. Mater. Atoms 1990, 49, 271–276. [Google Scholar] [CrossRef]
  25. IBANDL. Available online: https://www-nds.iaea.org/ibandl/ (accessed on 1 June 2019).
  26. Ziegler, J. SRIM, The Stopping and Range of Ions in Materials. Available online: http://www.srim.org/ (accessed on 1 June 2019).
  27. Lupi, S.; Nucara, A.; Perucchi, A.; Calvani, P.; Ortolani, M.; Quaroni, L.; Kiskinova, M. Performance of SISSI, the infrared beamline of the ELETTRAstorage ring. JOSA B 2007, 24, 959–964. [Google Scholar] [CrossRef]
  28. Infrared and Raman Users Group Spectral Database; Price, B.A.; Pretzel, B. (Eds.) IRUG: Philadelphia, PA, USA, 2007; Volumes 1–2. [Google Scholar]
  29. Database of ATR-FT-IR Spectra of Various Materials. Available online: http://lisa.chem.ut.ee/IR_spectra/ (accessed on 1 June 2019).
  30. Barone, G.; Crupi, V.; Galli, S.; Majolino, D.; Migliardo, P.; Venuti, V. Spectroscopic investigation of Greek ceramic artefacts. J. Mol. Struct. 2003, 651–653, 449–458. [Google Scholar] [CrossRef]
  31. Cui, J.F.; Rehren, T.; Lei, Y.; Cheng, X.; Jiang, J.; Wu, X. Western technical traditions of pottery making in Tang Dynasty China: Chemical evidence from the Liquanfang Kiln site. Xi’an city. J. Archaeol. Sci. 2010, 37, 1502–1509. [Google Scholar] [CrossRef]
  32. Wu, J.; Hou, T.; Zhang, M.; Li, Q.; Wu, J.; Li, J.; Deng, Z. An analysis of the chemical composition, performance and structure of China Yixing Zisha pottery from 1573 A.D. to 1911 A.D. Ceram. Int. 2013, 39, 2589–2595. [Google Scholar] [CrossRef]
  33. Figueiredo, M.O.; Pereira da Silva, T.; Veiga, J.P. Ancient glazed ceramic tiles: A long-term study from the remediation of environmental impacts to the non-destructive characterization of materials. In Proceedings of the International Seminar on Conservation of Glazed Ceramic Tiles: Research and Practice, Lisbon, Portugal, 1 January 2009. [Google Scholar]
  34. Tite, M.S.; Freestone, I.; Mason, R.; Molera, J.; Vendrell-Saz, M.; Wood, N. Lead glazes in antiquity—Methods of production and reasons for use. Archaeometry 1998, 40, 241–260. [Google Scholar] [CrossRef]
  35. Özçatal, M.; Yaygıngöl, M.; İssib, A.; Kara, A.; Turan, S.; Okyar, F.; Pfeiffer Taş, Ş.; Nastova, I.; Grupče, O.; Minčeva-Šukarova, B. Characterization of lead glazed potteries from Smyrna (Izmir/Turkey) using multiple analytical techniques; Part I: Glaze and engobe. Ceram. Int. 2014, 40, 2143–2151. [Google Scholar] [CrossRef]
  36. Molera, J.; Pradell, T.; Salvadό, N.; Vendrell-Saz, M. Evidence of tin oxide recrystallization in opacified lead glazes. J. Am. Ceram. Soc. 1999, 82, 2871–2875. [Google Scholar] [CrossRef]
  37. Dejoie, C.; Sciau, P.; Li, W.; Noé, L.; Mehta, A.; Chen, K.; Luo, H.; Kunz, M.; Tamura, N.; Liu, Z. Learning from the past: Rare ε-Fe2O3 in the ancient black-glazed Jian (Tenmoku) wares. Sci. Rep. 2014, 4, 4941(1)–4941(9). [Google Scholar] [CrossRef]
  38. Barilaro, D.; Crupi, V.; Interdonato, S.; Majolino, D.; Venuti, V.; Barone, G.; La Russa, M.F.; Bardelli, F. Characterization of blue decorated Renaissance pottery fragments from Caltagirone (Sicily, Italy). Appl. Phys. A 2008, 92, 91–96. [Google Scholar] [CrossRef]
  39. Barilaro, D.; Barone, G.; Crupi, V.; Majolino, D.; Mazzoleni, P.; Tigano, G.; Venuti, V. FT-IR absorbance spectroscopy to study Sicilian “proto-majolica” pottery. Vib. Spectrosc. 2008, 48, 269–275. [Google Scholar] [CrossRef]
  40. Sotiropoulou, S.; Papliaka, Z.E.; Vaccari, L. Micro FTIR imaging for the investigation of deteriorated organic binders in wall painting stratigraphies of different techniques and periods. Microchem. J. 2016, 124, 559–567. [Google Scholar] [CrossRef]
  41. Issi, A. Estimation of ancient firing technique by the characterization of semi-fused Hellenistic potsherds from Harabebezikan/Turkey. Ceram. Int. 2012, 38, 2375–2380. [Google Scholar] [CrossRef]
  42. Iordanidis, A.; Garcia-Guinea, J.; Karamitrou-Mentessidi, G. Analytical study of ancient pottery from the archaeological site of Aiani, northern Greece. Mater. Charact. 2009, 60, 292–302. [Google Scholar] [CrossRef]
  43. Murray, H.H. Overview—Clay mineral application. Appl. Clay Sci. 1991, 5, 379–395. [Google Scholar] [CrossRef]
  44. Trindade, M.J.; Dias, M.I.; Coroado, J.; Rocha, F. Mineralogical transformations of calcareous rich clays with firing: A comparative study between calcite and dolomite rich clays from Algarve, Portugal. Appl. Clay Sci. 2009, 42, 345–355. [Google Scholar] [CrossRef]
  45. Jovanovski, G.; Makreski, P.; Kaitner, B.; Šoptrajanov, B. Minerals from Macedonia. X-ray powder diffraction vs. vibrational spectroscopy in mineral identification. Contributions Sec. Math. Tech. Sci. 2009, 30, 7–34. [Google Scholar] [CrossRef]
Figure 1. Photos of the analyzed fragments.
Heritage 02 00113 g001
Figure 2. RBS spectra of the unglazed back of the analyzed AZR3 (a), AZR5 (b), AZR7 (c), and AZR1 (d) potsherds.
Heritage 02 00113 g002
Figure 3. RBS spectra of the external glazed surface of the analyzed AZR3 (a), AZR5 (b), AZR7 (c), and AZR1 (d) potsherds.
Heritage 02 00113 g003
Figure 4. PIXE spectra of the unglazed back of the analyzed AZR3 (a), AZR5 (b), AZR7 (c), and AZR1 (d) potsherds. Each element is indicated only on the basis of its principal X-ray emission line.
Heritage 02 00113 g004
Figure 5. PIXE spectra of the external glazed surface of the analyzed AZR3 (a), AZR5 (b), AZR7 (c), and AZR1 (d) potsherds. Each element is indicated only on the basis of its principal X-ray emission line.
Heritage 02 00113 g005
Figure 6. μ-PIXE maps for Ca, Al, Fe and Si detected in the cross-section close to the external glazed surface of ARZ3 sample. Typical scale of the colors associated to the elemental concentrations is also shown.
Heritage 02 00113 g006
Figure 7. μ-PIXE maps for Ca, Pb, Fe, Si and Al detected in the cross-section close to the external glazed surface of ARZ5 sample. Typical scale of the colors associated to the elemental concentrations is also displayed.
Heritage 02 00113 g007
Figure 8. μ-PIXE maps for Fe and Pb detected in the cross-section close to the external glazed surface of the ARZ7 sample. Typical scale of the colors associated to the elemental concentrations is also shown.
Heritage 02 00113 g008
Figure 9. μ-PIXE maps for Ca, Cu, Fe, Si, Ti and Zn detected on the external glazed surface of ARZ1 sample. Typical scale of the colors associated to the elemental concentrations is also shown.
Heritage 02 00113 g009
Figure 10. Photomicrographs, in white reflected light, and SR-FTIR spectra (average ± standard deviation) relative to the bulk areas of sample AZR3 ((a,b), respectively), AZR5 ((c,d), respectively) and AZR7 ((e,f), respectively). Average spectra (black line) have been obtained averaging 30, 40 and 18 sampled points within the shown areas for AZR3, AZR5, and AZR7 samples, respectively. Standard deviation of the spectra is graphically represented as light grey shadowed areas.
Heritage 02 00113 g010
Figure 11. SR-FTIR average spectrum (open squares) taken from the bulk area of AZR3 (a) and AZR7 (b) samples, together with the theoretical best-fit (red line) and the deconvolution components (colored lines). 1: quartz, 2: oligoclase, 3: diopside, 4: montmorillonite, 5: anorthite, and 6: calcite.
Heritage 02 00113 g011
Figure 12. (a) Photomicrograph, in white reflected light, of sample AZR1, relative to the bulk area, after being pressed within the DAC. (b) SR-FTIR spectrum (average ± standard deviation) taken from the bulk area of sample AZR1. The average spectrum (black line) has been obtained averaging 8 sampled points within the area shown in (a). Standard deviation of the spectrum is graphically represented as a light grey shadowed area.
Heritage 02 00113 g012
Figure 13. SR-FTIR average spectrum taken from the bulk area of sample AZR1 (open squares), together with the theoretical best-fit (red line) and the deconvolution components (colored lines). 1: quartz, 2: orthoclase, 3: diopside, 4: montmorillonite, 5: anorthite, and 6: calcite.
Heritage 02 00113 g013
Figure 14. (a) Photomicrograph, in white reflected light, of sample AZR3, relative to the black pigmented area, after being pressed within the Diamond Anvil Cell. (b) SR-FTIR average spectrum (average ± standard deviation) taken from the black pigmented area of sample AZR3. The average spectrum (black line) has been obtained averaging about 100 sampled points within the area shown in (a). Standard deviation of the spectrum is graphically represented as a light grey shadowed area.
Heritage 02 00113 g014
Figure 15. (a) Photomicrograph, in white reflected light, of sample AZR7, relative to the yellowish pigmented area, after being pressed with the DAC device. (b) SR-FTIR spectrum (average ± standard deviation) taken from the yellowish pigmented area of sample AZR7. The average spectrum (orange line) has been obtained averaging 15 sampled points within the lighter area shown in (a). Standard deviation of the spectrum is graphically represented as a light grey shadowed area.
Heritage 02 00113 g015
Figure 16. (a) Photomicrograph, in white reflected light, of sample AZR1, relative to the blue pigmented area, after being pressed with the DAC device. (b) SR-FTIR spectrum (average ± standard deviation) taken from the blue pigmented area of sample AZR1. The average spectrum (blue line) has been obtained averaging 8 sampled points within the bluer areas shown in (a). Standard deviation of the spectrum is graphically represented as a light grey shadowed area.
Heritage 02 00113 g016
Figure 17. (a) Photomicrograph, in white reflected light, of sample AZR1, relative to the area without pigment, after being pressed with the DAC device. (b) SR-FTIR spectrum (average ± standard deviation) taken from the area without pigment of sample AZR1. The average spectrum (gray line) has been obtained averaging 13 sampled points within the whiter area shown in (a). Standard deviation of the spectrum is graphically represented as a light grey shadowed area. In the inset, a comparison of the SR-FTIR spectra collected in the 800–1400 cm−1 wavenumber range in the blue pigmented area (blue line) and in the area without pigment (grey line) is reported.
Heritage 02 00113 g017
Table 1. Investigated samples, typology and related description.
SampleTypologyDescription
AZR3Glazed potteryDark beige ceramic body, black glaze
AZR5Glazed potteryReddish ceramic body, dark yellow glaze
AZR7Glazed potteryReddish ceramic body, yellowish glaze
AZR1FaienceWhite ceramic body, light blue glaze
Table 2. Relative atomic concentrations of detected elements in the unglazed back of the analyzed AZR3, AZR5, AZR7, and AZR1 potsherds from RBS. Note: MDL = minimum detection limit.
SampleCNONaMgAlSiCaFeBaPb
Relative atomic concentration (%)AZR317.85.445.22.74.27.79.151.60.05MDL
AZR52.31.759MDL0.7719.31.22.3MDL0.02
AZR76.6MDL58.3MDL0.2514.54.50.050.10.02
AZR13.03.954.6945.816.51.2MDL0.10.01
Table 3. Relative atomic concentrations of detected elements in the external glazed surface of the analyzed AZR3, AZR5, AZR7 and AZR1 potsherds from RBS.
SampleCNONaMgAlSiCaFeBaPb
Relative atomic concentration (%)AZR311.312.142MDL5.79.89.87.81.030.03MDL
AZR54.38.249.5MDL8.21311.41.92.10.420.57
AZR7MDLMDL57.8MDL7.64.816.93.72.00.766.2
AZR16.7MDL58.39.0MDL0.3212.9MDLMDL0.06
Table 4. Relative weight concentrations of the major, minor (a) and trace (b) elements detected by PIXE in the unglazed back of the analyzed AZR3, AZR5, AZR7 and AZR1 potsherds.
(a)SampleNaMgAlSiPSClKCaTiFe
AZR30.711.269.2325.590.520.21797 ppm2.59.386.74.5
AZR50.330.382.4212.80.57.10.9740.30.41.61.5
AZR70.141.8516.747.00.550.150.8853.06.713.05.0
AZR14.541.0614.6948.071 ppm0.0860.711.21.341.30.5
(a)SampleCuZnGeBrZrPb
AZR314 ppm0.04MDLMDL450 ppmMDL
AZR527 ppm1.250.560.160.1320
AZR714 ppm0.025MDL0.025MDLMDL
AZR12.720.13MDLMDLMDLMDL
(b)SampleCrMnGaAsSe
AZR3257 ppm840 ppm830 ppmMDL456 ppm
AZR540 ppm210 ppm830 ppm150 ppmMDL
AZR775 ppm630 ppm80 ppmMDLMDL
AZR150 ppm190 ppm80 ppm78 ppmMDL
Table 5. Relative weight concentration of the major, minor (a) and trace (b) elements detected by PIXE in the external glazed surface of the analyzed AZR3, AZR5, AZR7 and AZR1 potsherds.
(a)SampleNaMgAlSiPSClKCaTiFe
AZR30.331.055.0220.70.580.3885 ppm2.513.44.83.44
AZR50.631.107.0325.80.230.71.72.041.086.75.05
AZR70.630.514.0920.00.463.51.30.380.334.80.92
AZR17.30.872.231.071 ppm0.252.61.22.42.11.01
(a)SampleCuZnGaPb
AZR3694 ppm0.0566 ppm71 ppm
AZR5513 ppm0.088660 ppm4.92
AZR7139 ppm1.010.00320.1
AZR15.430.80.0020.46
(b)SampleCrMnAsSeBrZr
AZR391 ppm841 ppm41 ppmMDLMDLMDL
AZR566 ppm766 ppm103 ppmMDL110 ppm88 ppm
AZR710 ppm37 ppmMDL698 ppmMDL635 ppm
AZR110 ppm243 ppm157 ppmMDLMDLMDL
Table 6. Mineralogical composition (relative abundances of phases were estimated on the basis of the area of the characteristic IR peaks) obtained by SR-FTIR for the ceramic body of all the investigated shards.
SampleMineral
QuartzOligoclaseOrthoclaseDiopsideMontmorilloniteAnorthiteCalcite
AZR3+++++++++
AZR5+++++++++
AZR7++++++++
AZR1++++++++++++

