
Variable-Temperature Non-Linear Optical Imaging Witnesses Change in Crystalline Rotor Dynamics at Phase Transition

1
Lab. MOLTECH-Anjou, UMR CNRS 6200, SFR MATRIX, Univ. Angers, F-49000 Angers, France
2
Institute of Organic Chemistry and Biochemistry, Academy of Sciences of the Czech Republic, Flemingovo nam. 2, 16600 Prague, Czech Republic
*
Author to whom correspondence should be addressed.
Crystals 2024, 14(3), 259; https://doi.org/10.3390/cryst14030259
Submission received: 19 December 2023
/
Revised: 23 February 2024
/
Accepted: 29 February 2024
/
Published: 6 March 2024
(This article belongs to the Special Issue Feature Papers in Crystals 2023)
Abstract
:We present a novel approach to second harmonic microscopy combining variable temperature and photon counting. This innovative method aims to generate Second Harmonic Generation (SHG) images by scanning the same area multiple times with short pixel dwell times and low excitation intensities, as illustrated by imaging the full extent of a single crystalline rod of (1,4-bis((4′-(iodoethynyl)phenyl) ethynyl) bicyclo[2.2.2]octane (BCO). Remarkably, this new technique records the change in SHG intensity that occurs along with the crystalline phase transition at 108 K, thereby showing great promise in exploring the intricate instabilities of rotator dynamics concealed within the phase diagrams of molecular machines. Notably, our findings reveal a sustained decrease in non-linear optical intensity as the temperature drops to 95 K, followed by a sharp increase in SHG intensity at approximately 108 K, in synchronicity with the phase transition reported earlier that involves an intricate set of concerted changes in rotor dynamics.
1. Introduction
In the exciting field of molecular machines, amphidynamic crystals [1,2] have been the subject of much study since the award of the Nobel Prize in Chemistry in 2016 [3,4]. The exploration of the energy of activation, amplitude of motion, and frequency associated with dynamic processes within the crystal lattice can be achieved with several methods over a wider spectrum of frequencies, including dielectric spectroscopy [5], single crystal X-ray diffraction and solid-state nuclear magnetic resonance (NMR) techniques, as well as T1 spin–-lattice relaxation [6].
In the optical field, the use of intense laser pulses reveals non-linear effects such as second harmonic generation. This non-linear response is a popular tool for testing crystal symmetry. Typically, centrosymmetrical materials do not show an SHG response. Zyss et al. [7] showed in the 90s that multipolar media can, nevertheless, generate SHG signals. Few years ago, we reported that centrosymmetric crystals formed by the rod-like molecule bis((4-(4-pyridyl)ethynyl)bicyclo[2.2.2]oct-1-yl)buta-1,3-diyne, (1, depicted in Figure 1a), containing two 1,4-bis(ethynyl)bicyclo[2.2.2]octane (BCO) chiral rotators linked by a diyne fragment, exhibited strong second harmonic generation (SHG) activity [8], despite the absence of a mandatory requirement for space-inversion symmetry in this non-linear optical process [9]. This unique behavior arises from the torsional interconversion of the three blades, referred to as conformational mutations (Figure 1b). These mutations disrupt space-inversion symmetry, creating sequences of mutamers in a dynamic equilibrium within domains at a mesoscopic scale comparable to the wavelength of light used [8].
The phase transition of amphidynamic crystals with temperature has been experimentally characterized using various methods like Raman Spectroscopy [10]. For some materials like ferroelectrics, the reflected SHG technique, possibly coupled with Brillouin Scattering [11], can be used to study the dynamics in the phase transition [12]. Recently, a phase transition near 300 K on molecular rotators was demonstrated using huge SHG signal in bulk materials [13]. The phase transition can generate symmetry changes such that the material becomes an SHG switch, with complete signal extinction [14,15].
Some optical coherence imaging methods provide informative tomography or microscopic images with respect to the temperature fluctuations of materials with a good resolution factor [16]. In parallel, the SHG microscopy technique, based on the high-speed laser scanning of a sample to obtain a transmission or reflection image, has been widely used to characterize biological media without labeling [17]. However, this technique is also an elegant way of mapping the non-linear properties of materials, as a function of temperature or polarization [18].
In this study, we aimed to leverage the distinctive property of conformational mutations of BCO to investigate the non-linear optical response concerning temperature in a single crystal of (1,4-Bis((4′-(iodoethynyl)phenyl) ethynyl)bicyclo[2,2,2]octane (2, depicted in Figure 1c), a rod-like molecule with BCO moving parts. Prior knowledge indicate that below a phase transition at 108 K, X-ray and solid-state nuclear magnetic resonance data, along with calculations of rotational barriers, unveil a change in surroundings and dynamics among the four contributing rotors affecting the 1H spin–lattice relaxation rates [19] (see Figure 1d).
![Crystals 14 00259 g001]()
Figure 1.
(a) Molecular unit of bis((4-(4-pyridyl)ethynyl)bicyclo[2.2.2]oct-1-yl)buta-1,3-diyne (1); (b) chiral rotators 1,4-bis(ethynyl)bicyclo[2.2.2]octane (BCO). The origin of the second harmonic generation response in every mesoscopic collection of mutating chiral BCO rotators investigated so far lies in the dynamic equilibrium between these two conformations that breaks space-inversion symmetry [8], (c) Molecular unit of 1,4-bis((4′-(iodoethynyl)phenyl) ethynyl) bicyclo[2.2.2]octane (2). (d) Self-assembled molecular units of (2), iodine-bonded 2D pattern of interaction [19].

Our objectives were threefold: firstly, to document the SHG intensity as the temperature decreases, anticipating a gradual reduction in mesoscopic domains due to slower Brownian rotators, thereby weakening the SHG signal accordingly; secondly, to observe any changes in SHG intensity associated with the change in rotor dynamics across the phase transition [20,21,22,23]; and thirdly, to demonstrate the practical utility of photon-counting non-linear optical microscopy to reveal hidden dynamics instabilities within complex phase diagrams.
SHG microscopy stands as a widely employed method for rapidly, reliably, and highly sensitively measuring the hyperpolarizability of materials. Numerous studies have documented sudden bursts of SHG intensity attributed to the loss of space-inversion symmetry during phase transitions in crystalline samples. However, these experiments have typically focused on powders [24,25,26,27] or involved spot measurements on crystals [12,28]. In this context, we present a novel technique that enables the simultaneous tracking of the SHG response evolution for an entire single crystal as the temperature decreases. This method involves capturing successive images through a scanning system coupled to a detector utilizing ultrafast photon counting. An additional advantage of this approach is the generation of cartography depicting the non-linear response.
2. Materials and Methods
Experiments in photon-counting second harmonic generation (PC-SHG) microscopy (Figure 2a) were conducted employing a pulsed Ti:Sapphire femtosecond laser (Tsunami, Spectra-Physics, Inc., Milpitas, CA, USA) tuned to 800 nm and powered by a 10 W solid-state laser (Millenia, Spectra-Physics, Inc., Milpitas, CA, USA). The laser pulse duration in the microscope’s focal plane is approximately 100 fs. With a repetition rate of 80 MHz (dead time = 12.5 ns), corresponding to a temporal filling rate of 1:125,000, the laser operates intermittently to achieve high peak powers and concentrate spatial and temporal photons effectively on the crystalline sample, maintaining an average power of only 1 W.
To prevent reflection in the laser cavity, a Faraday isolator (IO-3-780-HP, Thorlabs Inc., 43 Sparta Ave Newton, NJ, USA) is employed, and an electrically driven high-speed Pockels cell (350-80LA, Conoptics, Danbury, CT, USA) serves as an intensity modulator. The incident beam’s polarization is controlled with an achromatic half-wave plate (700–1000 nm, Edmund Optics, York, UK) situated on a motorized rotating stage linked to a universal controller (PR50 and XPS, Micro-Controle Spectra-Physics S.A., Beaune la Rolande, France). A microscope slide cover is positioned at a 45° angle to the laser beam’s propagation axis, redirecting the reflected beam to a power meter.
Fast scanning of the sample is facilitated by two galvanometric mirrors driven by a two-axis driver (6210H and MicroMax, Cambridge Technology Inc., Bedford, MA, USA). Voltage control is achieved through an analog card at a maximum rate of 1 MHz, encoded on 12-bit dynamics (NI PCI-6711, National Instrument, Austin, TX, USA). Monitoring the scanned surface and spatial resolution in the microscope objective’s focal plane is performed using another analog output of the PCI-6711, with the external reference acting as a voltage gauge.
To attain diffraction-limited images for each pixel, a telescope is used to fill the pupil of the objective lens mounted on a commercial inverted microscope (IX71, Olympus, Tokyo, Japan). For the variable-temperature experiments, an LTS 420 cell (Linkam Scientific Instruments Ltd., Salfords, UK) placed between the focusing lens and the condenser was utilized, operating in transmission mode with two quartz plates. The single crystal to be analyzed (Figure 2c) is held on a microscope slide inside a small chamber within the plate. Cryogenic liquid nitrogen cooling (LNP95, Linkam Scientific Instruments Ltd., Salfords, UK) provides temperature ramps with linearly changing cooling rates up to 100 K . Temperature control is managed using LinkSys32 V2.4.3 software. The cell, mounted on a motorized positioning stage (XYZ 562-ULTRALIGN and three actuators TRA12CC, Micro-Controle Spectra-Physics S.A., Beaune la Rolande, France), maintains the sample in the microscope objective’s focal plane during movement, employing a compensation technique described in other articles [29,30].
The transmitted beam undergoes collection by a condenser and is subsequently directed towards the detection chain in transmission. The selection of the SHG signal involves two sequential filters: an 808 nm-centered Notch filter (NF808-34, Thorlabs Inc., Newton, NJ, USA) to absorb the excitation beam, followed by a 400 nm-centered bandpass filter (FBH400-40, Thorlabs Inc., Newton, NJ, USA). The transmitted SHG beam is then directed onto a high-speed photomultiplier (H7422P-40, Hamamatsu, Hamamatsu City, Japan) with a rise time of 1 ns. The digitized signal in the form of TTL pulses is routed to a photon counting module (C9744, Hamamatsu, Hamamatsu City, Japan) with a counting frequency of up to 10 MHz. This module is linked to a 32-bit counter on a high-speed PCI card (PCI-6602, National Instrument, Austin, TX, USA). The counting timing synchronizes with the electronic control signal of the scan mirrors through a specific high-speed RTSI (National Instrument, Austin, TX, USA) bus connected directly via a cable between the two PCI cards. The entire experiment was orchestrated and controlled using a Labview™ program developed in-house.
For substantial nonlinear optical (NLO) responses, delivering a single photon per excitation pulse proves sufficient to generate highly contrasted images. Obtaining an image within the modest dynamic range available for this crystal (as low as 3 to 4 bits) would necessitate laser excitation at peak intensity and a pixel dwell time of several tens of microseconds. However, due to the potential damage threshold of most samples under such high excitation intensities, a novel approach is employed. This approach involves constructing an SHG image by scanning the same area multiple times with lower pixel dwell times and reduced excitation intensities, enabling the recording of the response’s temperature-dependent evolution over extended periods (typically > 1 h). The final SHG image is generated by accumulating the values recorded for each scan, as individual discrete images lack usable information. In instances where the darkest images acquire only 50 counts (corresponding to 50 detected SHG photons) in a 100 × 100 pixels image, combining 100 successive scanned images produces a meaningful image. With a pixel dwell time of 5 s, representing excitation with 400 laser pulses for each pixel and only 50 counts in one scan, the probability of detecting an SHG photon in one pixel within the crystal for the darkest image is merely 1/80,000 for each laser pulse. This SHG microscope showcases a substantial enhancement in sensitivity compared to other commonly employed techniques [31].
3. Results
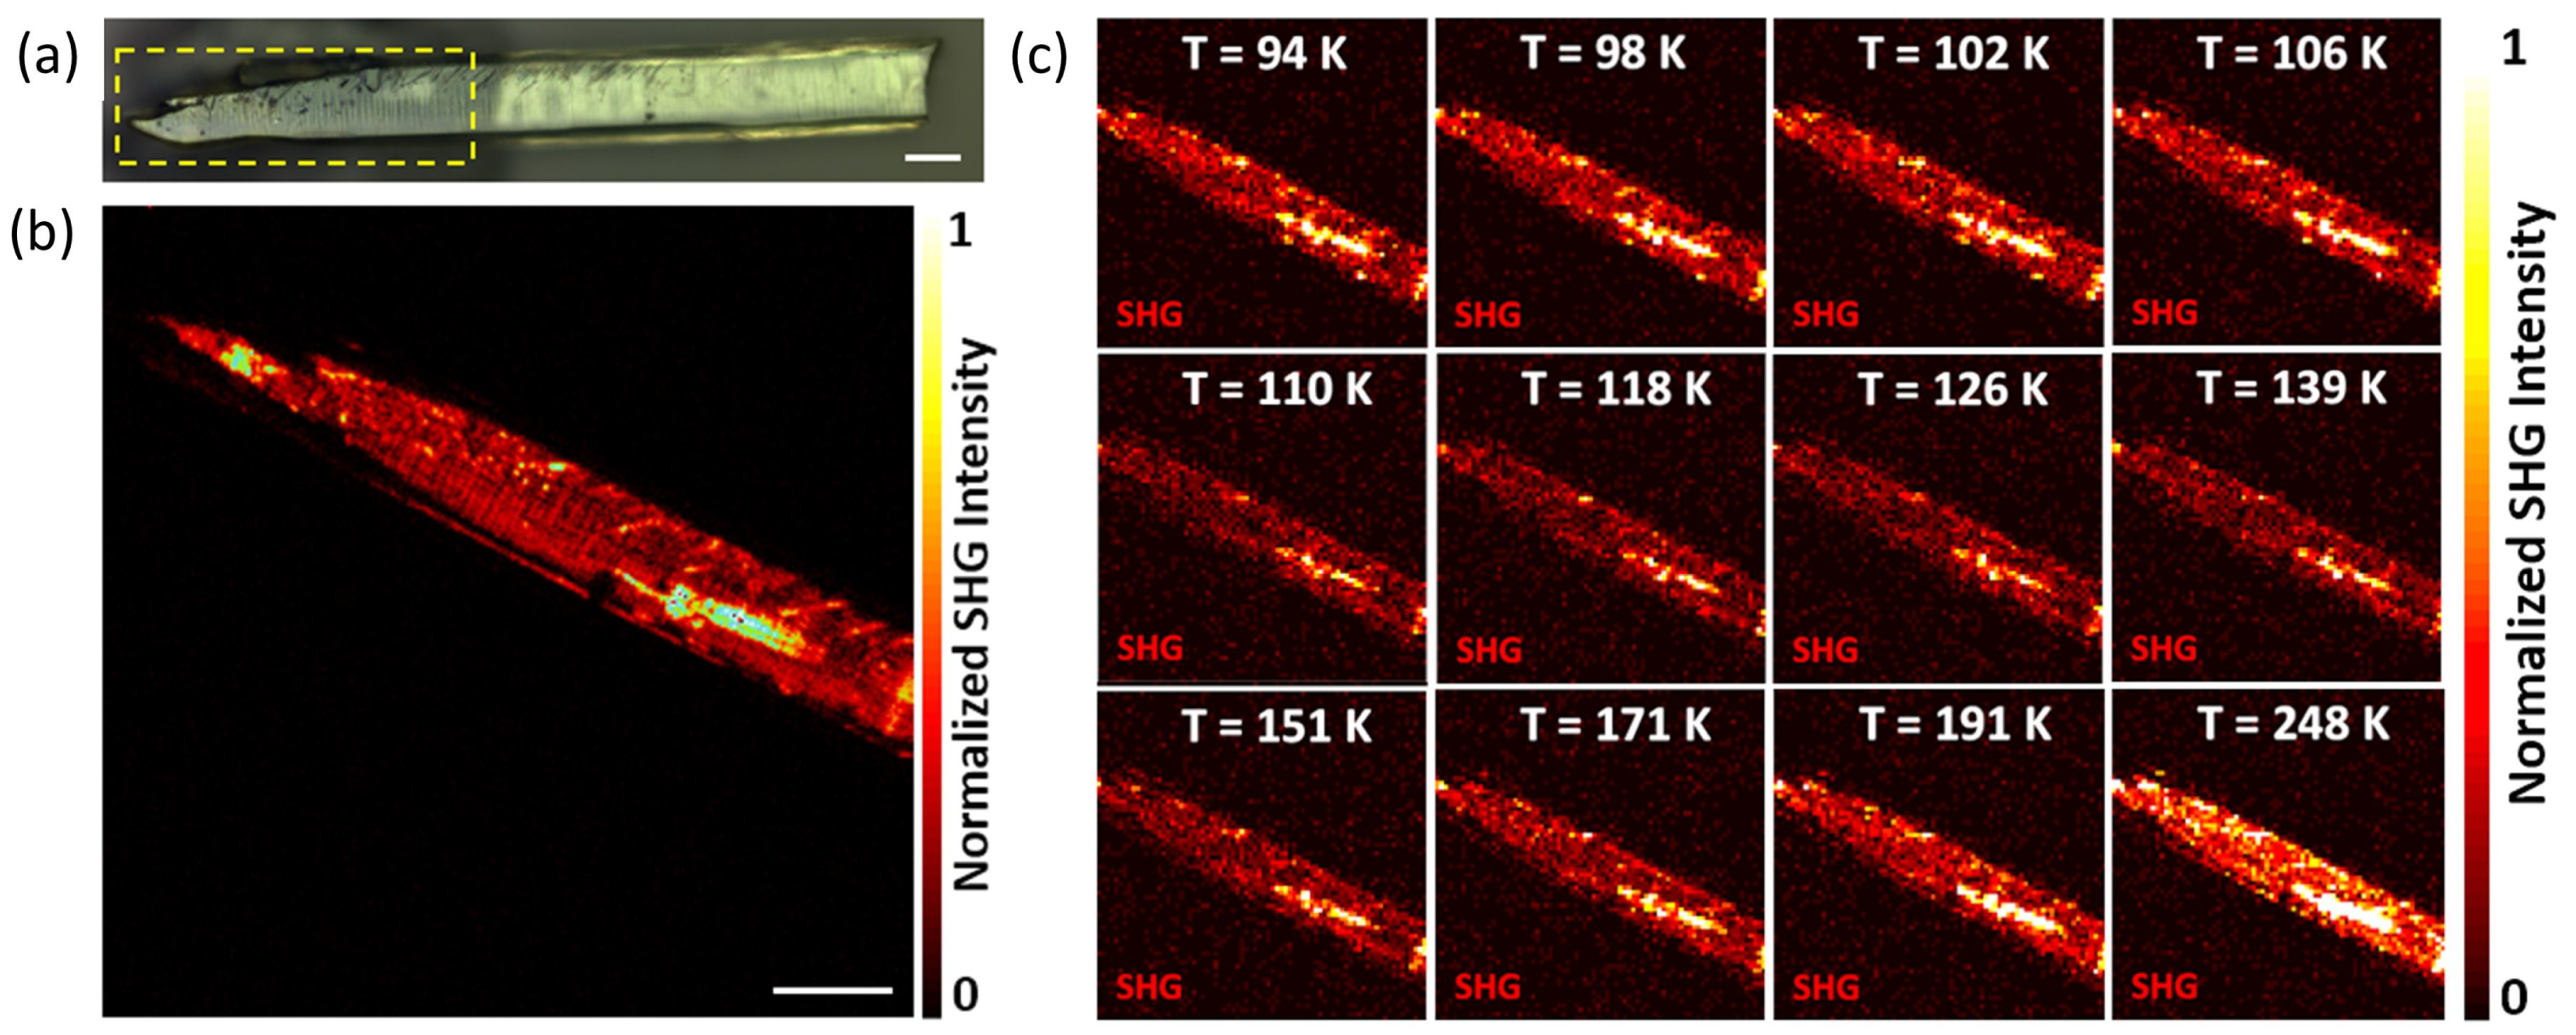
Figure 3a displays a brightfield microscope view of the needle-like single crystal, measuring 1.5 mm in length and approximately 0.1 mm in width. In Figure 3b, the high-resolution SHG response of a selected area of the crystal at room temperature is presented. SHG images were captured over a temperature range of 300 K to 90 K. Due to the use of transmitted signals in SHG measurements, artifacts become prevalent at lower temperatures. For instance, variations in temperature occur on each side of the quartz windows during cooling, and condensation may impact SHG intensity at around 220 K. To mitigate this, nitrogen gas is blown on both outer sides. Additionally, a beta barium borate (BBO) crystal is introduced on the laser path before the microscope to generate a “false” yet minimal SHG signal. This ensures that the transmitted image of the UV-excited crystal remains constant throughout the cooling cycle, preventing condensation. Furthermore, certain metallic parts of the cell contract at low temperatures, causing the crystal to gradually and regularly shift from its original position in the image. Digital processing, involving the tracking of singular points of the crystal based on the intercorrelation between two images, is used to reposition the crystal back to its original location in the picture.
In these experiments, the laser wavelength was set to 800 nm, and the SHG signal was detected at 400 nm. The laser’s mean power was maintained at a mere 107 W. The sample was cooled at a rate of 2 K per minute, capturing a 100 × 100 pixels SHG image every 0.45 K (4.4 images per minute). The scan duration was 50 ms, the dwell time was 5 s, and 100 scans were performed for each image. The final SHG image was acquired in approximately 6 s. The cooling period lasted 90 min, as did the subsequent heating cycle back to ambient temperature. A series of SHG images (Figure 3c) extracted from a video recorded during a cooling cycle illustrate the diminishing SHG intensity with decreasing temperature. We observed a pronounced increase in SHG intensity at approximately 108 K. Aggregating and normalizing the laser intensity for each image revealed a notable surge toward higher SHG intensities, as depicted in Figure 4. This abrupt change in SHG response at the phase transition is emphasized in Figure 4, showing where images were acquired at intervals of 0.16 K within a narrow temperature range around 100 K. The phase transition is clearly pinpointed at 108 K through variable-temperature, photon-counting second harmonic generation microscopy.
4. Discussion
The main result obtained from the recording of the evolution of the SHG microscopy response of the crystal obtained through successive scans as a function of temperature clearly shows that the second harmonic signal decreases significantly when temperature decreases. This decline is attributed to the reduced frequency of Brownian motion as the temperature decreases, resulting in fewer mutations and causing the proportion of relevant mesoscopic volume without space-inversion symmetry to gradually decrease, consequently lowering the SHG intensity. This observation is significant and counterintuitive, as opposed to SHG-active materials without moving parts, where SHG intensity typically fades away with increasing temperature [32,33,34]. This outcome is also noteworthy, as it independently demonstrates that the SHG activity of crystalline chiral rotors with conformational mutations is a unique property associated with the molecular degrees of freedom of the moving parts.
The second important result is that a phase transition can be revealed by a strong variation in the crystal response on the low-temperature SHG image around 108 K. This variation is attributed to the change in structure during the phase transition, from half a molecule to three and a half molecules in the asymmetric unit ([19]). In this system, a singular activated relaxation process with a barrier of 429 K (0.85 kcal/mol) transforms, at around 105 K, into a set of four activated processes with distinct activation barriers: 188 K or 0.37 kcal/mol, 360 K or 0.72 kcal/mol, 486 K or 0.97 kcal/mol, and 651 K or 1.29 kcal/mol. Thus, the evolution of the SHG microscopy signal provides a complementary yet novel method to illustrate the phase transition. Most importantly, variable-temperature non-linear optical imaging demonstrates that at the phase transition, the symmetry of the crystal lattice and, consequently, that of the cavity symmetry breaking is linked to the movement of these rotors [35].
In summary, this work shows the exploration of the acquisitions of a set of temperature-dependent images with a custom-designed laser scanning SHG microscope equipped with photon counting detection in a transmitted beam through temperature-controlled crystals. We demonstrate its application to an amphidynamic single crystal. The analysis produces comprehensive information on the dynamics of rotators in the main molecule and provides complementary information about phase transitions. Even if the nonlinear response of a material is very small, let alone if the variations are small, the technique presented in this work, based on multiple scans of a thermally controlled crystal coupled with ultra-sensitive detection, makes it possible to obtain a three-dimensional representation of the nonlinear response. There are, of course, the two spatial dimensions, but the third dimension can be temperature (as shown here, but it can also be laser frequency or polarization, for example). This approach is, therefore, highly versatile.
Author Contributions
Conceptualization: D.G. and P.B.; project administration: D.G. and P.B.; experimental realization: G.B. and C.M.; data curation: D.G.; software: D.G.; writing—original draft: D.G.; writing—review and editing: all authors. All authors have read and agreed to the published version of the manuscript.
Funding
The authors express gratitude for the support provided by CNRS, the University of Angers, and the Region des Pays de la Loire for the MOVAMOL Grant. G. B. thanks CNRS for the Ph.D. grants.
Data Availability Statement
The original contributions presented in the study are included in the article, further inquiries can be directed to the corresponding author.
Conflicts of Interest
The authors declare no conflicts of interest.
References
- Liepuoniute, I.; Jellen, M.J.; Garcia-Garibay, M.A. Correlated motion and mechanical gearing in amphidynamic crystalline molecular machines. Chem. Sci. 2020, 11, 12994–13007. [Google Scholar] [CrossRef]
- Garcia-Garibay, M.A. Crystalline molecular machines: Encoding supramolecular dynamics into molecular structure. Proc. Natl. Acad. Sci. USA 2005, 102, 10771–10776. [Google Scholar] [CrossRef] [PubMed]
- Koumura, N.; Zijlstra, R.W.J.; van Delden, R.A.; Harada, N.; Feringa, B.L. Light-driven monodirectional molecular rotor. Nature 1999, 401, 152–155. [Google Scholar] [CrossRef] [PubMed]
- Mondal, A.; Toyoda, R.; Costil, R.; Feringa, B.L. Chemically Driven Rotatory Molecular Machines. Angew. Chem. Int. Ed. 2022, 61, e202206631. [Google Scholar] [CrossRef] [PubMed]
- Liu, Z.; Wang, Y.; Garcia-Garibay, M.A. Rotational Dynamics of an Amphidynamic Zirconium Metal–Organic Framework Determined by Dielectric Spectroscopy. J. Phys. Chem. Lett. 2021, 12, 5644–5648. [Google Scholar] [CrossRef]
- Catalano, L.; Naumov, P. Exploiting rotational motion in molecular crystals. CrystEngComm 2018, 20, 5872–5883. [Google Scholar] [CrossRef]
- Zyss, J.; Ledoux, I. Nonlinear optics in multipolar media: Theory and experiments. Chem. Rev. 1994, 94, 77–105. [Google Scholar] [CrossRef]
- Lemouchi, C.; Iliopoulos, K.; Zorina, L.; Simonov, S.; Wzietek, P.; Cauchy, T.; Rodríguez-Fortea, A.; Canadell, E.; Kaleta, J.; Michl, J.; et al. Crystalline Arrays of Pairs of Molecular Rotors: Correlated Motion, Rotational Barriers, and Space-Inversion Symmetry Breaking Due to Conformational Mutations. J. Am. Chem. Soc. 2013, 135, 9366–9376. [Google Scholar] [CrossRef]
- Carriles, R.; Sheetz, K.E.; Hoover, E.E.; Squier, J.A.; Barzda, V. Simultaneous multifocal, multiphoton, photon counting microscopy. Opt. Express 2008, 16, 10364–10371. [Google Scholar] [CrossRef]
- Asher, M.; Bardini, M.; Catalano, L.; Jouclas, R.; Schweicher, G.; Liu, J.; Korobko, R.; Cohen, A.; Geerts, Y.; Beljonne, D.; et al. Mechanistic View on the Order–Disorder Phase Transition in Amphidynamic Crystals. J. Phys. Chem. Lett. 2023, 14, 1570–1577. [Google Scholar] [CrossRef]
- Pugachev, A.M. Manifestation of Local Asymmetric Regions in Centrosymmetric Phase of Ferroelectric Crystals in Brillouin Scattering and Second Optical Harmonic Generation. Crystallogr. Rep. 2023, 68, 797–801. [Google Scholar] [CrossRef]
- Wang, J.; Jin, K.; Yao, H.; Gu, J.; Xu, X.; Ge, C.; Wang, C.; He, M.; Yang, G. Temperature-dependent phase transition in barium titanate crystals probed by second harmonic generation. Appl. Phys. Lett. 2018, 112, 102904. [Google Scholar] [CrossRef]
- Lun, M.M.; Su, C.Y.; Jia, Q.Q.; Zhang, Z.X.; Li, J.; Lu, H.F.; Zhang, Y.; Fu, D.W. Remarkable enhancement of optical and electric properties by temperature-controlled solid-phase molecular motion. Inorg. Chem. Front. 2023, 10, 5026–5034. [Google Scholar] [CrossRef]
- Gao, Y.F.; Zhang, Z.X.; Zhang, T.; Su, C.Y.; Zhang, W.Y.; Fu, D.W. Regulated molecular rotor in phase transition materials with switchable dielectric and SHG effect. Mater. Chem. Front. 2020, 4, 3003–3012. [Google Scholar] [CrossRef]
- Peng, Z.; Wang, P.; Wei, Z.; Guo, W.; Zhang, H.; Cai, H. Antimony Bromide Organic–Inorganic Hybrid Compound with a Long-Chain Diamine Showing Switchable Phase Transition and Second-Harmonic Generation Properties. Inorg. Chem. 2024, 63, 184–190. [Google Scholar] [CrossRef] [PubMed]
- Seong, D.; Han, S.; Jeon, D.; Kim, Y.; Wijesinghe, R.E.; Ravichandran, N.K.; Lee, J.; Lee, J.; Kim, P.; Lee, D.E.; et al. Dynamic Compensation of Path Length Difference in Optical Coherence Tomography by an Automatic Temperature Control System of Optical Fiber. IEEE Access 2020, 8, 77501–77510. [Google Scholar] [CrossRef]
- Brasselet, S. Polarization-resolved nonlinear microscopy: Application to structural molecular and biological imaging. Adv. Opt. Photon. 2011, 3, 205. [Google Scholar] [CrossRef]
- Li, W.; Ma, Y.; Feng, T.; Du, Z.; Liu, Y.; Kalinin, S.V.; Li, J.F.; Li, Q. Delineating complex ferroelectric domain structures via second harmonic generation spectral imaging. J. Mater. 2023, 9, 395–402. [Google Scholar] [CrossRef]
- Simonov, S.; Zorina, L.; Wzietek, P.; Rodríguez-Fortea, A.; Canadell, E.; Mézière, C.; Bastien, G.; Lemouchi, C.; Garcia-Garibay, M.A.; Batail, P. Static Modulation Wave of Arrays of Halogen Interactions Transduced to a Hierarchy of Nanoscale Change Stimuli of Crystalline Rotors Dynamics. Nano Lett. 2018, 18, 3780–3784. [Google Scholar] [CrossRef]
- Vogelsberg, C.S.; Garcia-Garibay, M.A. Crystalline molecular machines: Function, phase order, dimensionality, and composition. Chem. Soc. Rev. 2012, 41, 1892–1910. [Google Scholar] [CrossRef]
- Lemouchi, C.; Yamamoto, H.M.; Kato, R.; Simonov, S.; Zorina, L.; Rodríguez-Fortea, A.; Canadell, E.; Wzietek, P.; Iliopoulos, K.; Gindre, D.; et al. Reversible Control of Crystalline Rotors by Squeezing Their Hydrogen Bond Cloud Across a Halogen Bond-Mediated Phase Transition. Cryst. Growth Des. 2014, 14, 3375–3383. [Google Scholar] [CrossRef]
- Abendroth, J.M.; Bushuyev, O.S.; Weiss, P.S.; Barrett, C.J. Controlling Motion at the Nanoscale: Rise of the Molecular Machines. ACS Nano 2015, 9, 7746–7768. [Google Scholar] [CrossRef]
- Erbas-Cakmak, S.; Leigh, D.A.; McTernan, C.T.; Nussbaumer, A.L. Artificial Molecular Machines. Chem. Rev. 2015, 115, 10081–10206. [Google Scholar] [CrossRef] [PubMed]
- Mei, G.Q.; Zhang, H.Y.; Liao, W.Q. A symmetry breaking phase transition-triggered high-temperature solid-state quadratic nonlinear optical switch coupled with a switchable dielectric constant in an organic–inorganic hybrid compound. Chem. Commun. 2016, 52, 11135–11138. [Google Scholar] [CrossRef] [PubMed]
- Liu, Y.L.; Wu, D.H.; Wang, Z.; Zhang, Y. Switchings of dielectric constant, second harmonic generation and polarization in a polar hybrid cyanometallate crystal. New J. Chem. 2017, 41, 3211–3216. [Google Scholar] [CrossRef]
- Sun, Z.; Luo, J.; Zhang, S.; Ji, C.; Zhou, L.; Li, S.; Deng, F.; Hong, M. Solid-State Reversible Quadratic Nonlinear Optical Molecular Switch with an Exceptionally Large Contrast. Adv. Mater. 2013, 25, 4159–4163. [Google Scholar] [CrossRef] [PubMed]
- Zhao, S.; Yang, X.; Yang, Y.; Kuang, X.; Lu, F.; Shan, P.; Sun, Z.; Lin, Z.; Hong, M.; Luo, J. Non-Centrosymmetric RbNaMgP2O7 with Unprecedented Thermo-Induced Enhancement of Second Harmonic Generation. J. Am. Chem. Soc. 2018, 140, 1592–1595. [Google Scholar] [CrossRef] [PubMed]
- Mishina, E.D.; Misuryaev, T.V.; Sherstyuk, N.E.; Lemanov, V.V.; Morozov, A.I.; Sigov, A.S.; Rasing, T. Observation of a Near-Surface Structural Phase Transition in SrTiO3 by Optical Second Harmonic Generation. Phys. Rev. Lett. 2000, 85, 3664–3667. [Google Scholar] [CrossRef]
- Gindre, D.; Iliopoulos, K.; Krupka, O.; Champigny, E.; Morille, Y.; Sallé, M. Image storage in coumarin-based copolymer thin films by photoinduced dimerization. Opt. Lett. 2013, 38, 4636–4639. [Google Scholar] [CrossRef] [PubMed]
- Gindre, D.; Ka, I.; Boeglin, A.; Fort, A.; Dorkenoo, K.D. Image storage through gray-scale encoding of second harmonic signals in azo-dye copolymers. Appl. Phys. Lett. 2007, 90, 094103. [Google Scholar] [CrossRef]
- Carriles, R.; Schafer, D.N.; Sheetz, K.E.; Field, J.J.; Cisek, R.; Barzda, V.; Sylvester, A.W.; Squier, J.A. Invited Review Article: Imaging techniques for harmonic and multiphoton absorption fluorescence microscopy. Rev. Sci. Instrum. 2009, 80, 081101. [Google Scholar] [CrossRef] [PubMed]
- Abulikemu, A.; Kainuma, Y.; An, T.; Hase, M. Temperature-dependent second-harmonic generation from color centers in diamond. Opt. Lett. 2022, 47, 1693–1696. [Google Scholar] [CrossRef] [PubMed]
- Xiong, R.G. The temperature-dependent domains, SHG effect and piezoelectric coefficient of TGS. Chin. Chem. Lett. 2013, 24, 681–684. [Google Scholar] [CrossRef]
- Kim, S.W.; Deng, Z.; Li, M.; Sen Gupta, A.; Akamatsu, H.; Gopalan, V.; Greenblatt, M. PbMn(IV)TeO6: A New Noncentrosymmetric Layered Honeycomb Magnetic Oxide. Inorg. Chem. 2016, 55, 1333–1338. [Google Scholar] [CrossRef]
- Colin-Molina, A.; Karothu, D.P.; Jellen, M.J.; Toscano, R.A.; Garcia-Garibay, M.A.; Naumov, P.; Rodríguez-Molina, B. Thermosalient Amphidynamic Molecular Machines: Motion at the Molecular and Macroscopic Scales. Matter 2019, 1, 1033–1046. [Google Scholar] [CrossRef]
Figure 2.
(a) Experimental setup for photon-counting SHG microscopy measurement. (b) Schematic of the temperature cell. (c) Section of temperature cell with crystal.
Figure 2.
(a) Experimental setup for photon-counting SHG microscopy measurement. (b) Schematic of the temperature cell. (c) Section of temperature cell with crystal.

Figure 3.
(a) Optical image of the crystal. (b) A 400 × 400 pixels SHG image of the crystal area corresponding to the yellow dashed line fragment in (a). The scale bar is 100 m. (c) Evolution of SHG response for selected temperatures. The intensity of SHG increases from 95 K to 107 K and then experiences a sharp decrease near 108 K before rising again on the return cycle back up to ambient temperature.

Figure 4.
Temperature dependence of the SHG response of a single crystal. The blue curve corresponds to cooling to 95 K and the red curve represent the evolution during heating back up to ambient temperature. The black curve represents the mean of both signals. Inset: Temperature dependence of the SHG response of the crystal around 108 K with a higher resolution. For this experiment, SHG images were acquired every 0.16 K.

Disclaimer/Publisher’s Note: The statements, opinions and data contained in all publications are solely those of the individual author(s) and contributor(s) and not of MDPI and/or the editor(s). MDPI and/or the editor(s) disclaim responsibility for any injury to people or property resulting from any ideas, methods, instructions or products referred to in the content. |
© 2024 by the authors. Licensee MDPI, Basel, Switzerland. This article is an open access article distributed under the terms and conditions of the Creative Commons Attribution (CC BY) license (https://creativecommons.org/licenses/by/4.0/).
Share and Cite
MDPI and ACS Style
Bastien, G.; Mézière, C.; Batail, P.; Gindre, D. Variable-Temperature Non-Linear Optical Imaging Witnesses Change in Crystalline Rotor Dynamics at Phase Transition. Crystals 2024, 14, 259. https://doi.org/10.3390/cryst14030259
AMA Style
Bastien G, Mézière C, Batail P, Gindre D. Variable-Temperature Non-Linear Optical Imaging Witnesses Change in Crystalline Rotor Dynamics at Phase Transition. Crystals. 2024; 14(3):259. https://doi.org/10.3390/cryst14030259
Chicago/Turabian StyleBastien, Guillaume, Cécile Mézière, Patrick Batail, and Denis Gindre. 2024. "Variable-Temperature Non-Linear Optical Imaging Witnesses Change in Crystalline Rotor Dynamics at Phase Transition" Crystals 14, no. 3: 259. https://doi.org/10.3390/cryst14030259
Note that from the first issue of 2016, this journal uses article numbers instead of page numbers. See further details here.