
Decision Tree-Supported Analysis of Gallium Arsenide Growth Using the LEC Method

1
Leibniz-Institut für Kristallzüchtung, Max-Born-Str. 2, 12489 Berlin, Germany
2
Leibniz Institute for Catalysis, Albert-Einstein-Str. 29A, 18069 Rostock, Germany
3
Institute of Computer Science, Pod Vodárenskou Věží 2, 18207 Prague, Czech Republic
*
Author to whom correspondence should be addressed.
Crystals 2023, 13(12), 1659; https://doi.org/10.3390/cryst13121659
Submission received: 17 November 2023
/
Revised: 28 November 2023
/
Accepted: 29 November 2023
/
Published: 2 December 2023
(This article belongs to the Special Issue Emerging Low-Dimensional Materials II)
Abstract
:In this study, an axisymmetric Czochralski furnace model for the LEC growth of gallium arsenide is presented. We produced 88 datasets through computational fluid dynamics simulations. Among the many parameters that affect crystal growth, a total of 13 input parameters were selected, including the geometry and material parameters of the hot zone (crucible, heaters, radiation shield, and crystal), as well as the process parameters (such as pulling and rotation rates, heating power, etc.). Voronkov criteria (v/Gn), interface deflection, and the average interface temperature gradient were selected as the output parameters. We carried out a correlation analysis between the variables and used decision trees to study the impact of the 13 input variables on the output variables. The results indicated that in the growth of gallium arsenide, the main factor affecting interface deflection and the average interface thermal gradients is the crucible rotation rate. For v/Gn, it is the pulling rate.
1. Introduction
Gallium arsenide (GaAs) is an important semiconductor material with a wide range of applications and unique performance characteristics [1,2,3]. It possesses high electron mobility, enabling outstanding performance in high-frequency electronic devices and opto-electronic devices. Its wide bandgap allows GaAs devices to operate at high temperatures and provides low-noise characteristics. The combination of wide bandgap and high mobility gives GaAs an advantage in high-frequency wireless communication (4G, 5G, and 6G), autonomous driving, as a radar transmitter, and in LIDAR systems [4,5,6,7,8]. An analysis of the GaAs and related equipment market up to 2025 shows that the application of GaAs single crystals will shift from mobile phones to opto-electronics, requiring more raw materials [9].
The current mainstream industrial growth methods for GaAs single crystals are the liquid-encapsulated Czochralski (LEC), vertical Bridgman (VB), and vertical gradient freeze (VGF) methods [10]. The LEC process has the ability to grow longer and larger diameter crystals, with control over the carbon content in the crystals and good semi-insulating properties. The main cause of dislocations in large GaAs crystals is the stress induced by thermal gradients during crystal growth [11,12,13]. Liquid encapsulants can effectively reduce the loss of arsenic, making the Czochralski method applicable to the growth of GaAs [14]. Due to the tendency of GaAs to decompose at high temperatures, achieving the growth of high-purity single crystals requires solving significant technical challenges. The Czochralski technique is only useful for materials with relatively low vapor pressures, and it is difficult to use the basic Czochralski method for materials that are nonvolatile but have one component with a relatively high vapor pressure [15,16]. For instance, III-V compound melts, such as gallium phosphide (GaP), GaAs, indium phosphide (InP), and indium arsenide (InAs), require the control of high vapor pressure to prevent volatile elements from leaving the melt below their respective melting points. This necessitates the operation of equipment under high-temperature and high-pressure conditions, along with the requirement of a high level of sealing. These equipment requirements led to the development of liquid encapsulation technology [15,17]. By covering the surface of the melt and crystals with an appropriate liquid (e.g., B2O3) and maintaining a high arsenic vapor pressure in the furnace, the decomposition and volatilization of GaAs can be inhibited. The grown crystals typically have a diameter of 3–4 inches. During the growth process, the rotation rate of the seed and crucible ranges from 0 to 20 rpm, and for crystals smaller than 3 inches, the growth rate is less than 10 mm/h [18].
Efforts have consistently been made to refine the growth process to increase the quality of the crystal. Research into furnace and process design has primarily concentrated on refining the shape of solid-liquid interfaces by adjusting the rotation of crystals and crucibles [19,20]. It has also aimed at augmenting the growth rates through the development of enhanced insulation devices and furnace geometries [21,22]. Additionally, efforts have been made to influence the interface shapes through the fine-tuning of heater positioning [23]. Furthermore, controlling gas flow rates during the Czochralski silicon growth process has been explored to affect overall heat transfer and melt flow [24]. Additionally, factors such as pulling rate, crucible shape, and the volume of the melt also exert influence on crystal growth [25,26].
In recent years, the advancement of artificial intelligence has led to the utilization of machine learning techniques for the enhancement of crystal growth processes. Specifically, artificial neural networks (ANNs) have found application in the optimization of crystal growth, e.g., as documented in references [27,28,29,30,31]. Additionally, decision trees (DTs) and random forests have been employed for the analysis of multi-parameter crystal growth [32,33,34]. It is worth noting that while artificial neural networks exhibit excellent fitting capabilities, their effectiveness is contingent upon the availability of substantial training data. Conversely, the DT algorithm exhibits resilience to noisy data and outliers.
In this study, we conducted a comprehensive correlation analysis involving 13 furnace geometry and process variables. We then employed DTs to explore their influence on interface deflection, the average temperature gradient at the interface, and the Voronkov criteria (v/G) in the context of Cz-GaAs growth. Our analysis was based on a dataset comprising 88 numerical instances generated through CFD simulations.
2. Models and Methodology
2.1. Machine Learning Model
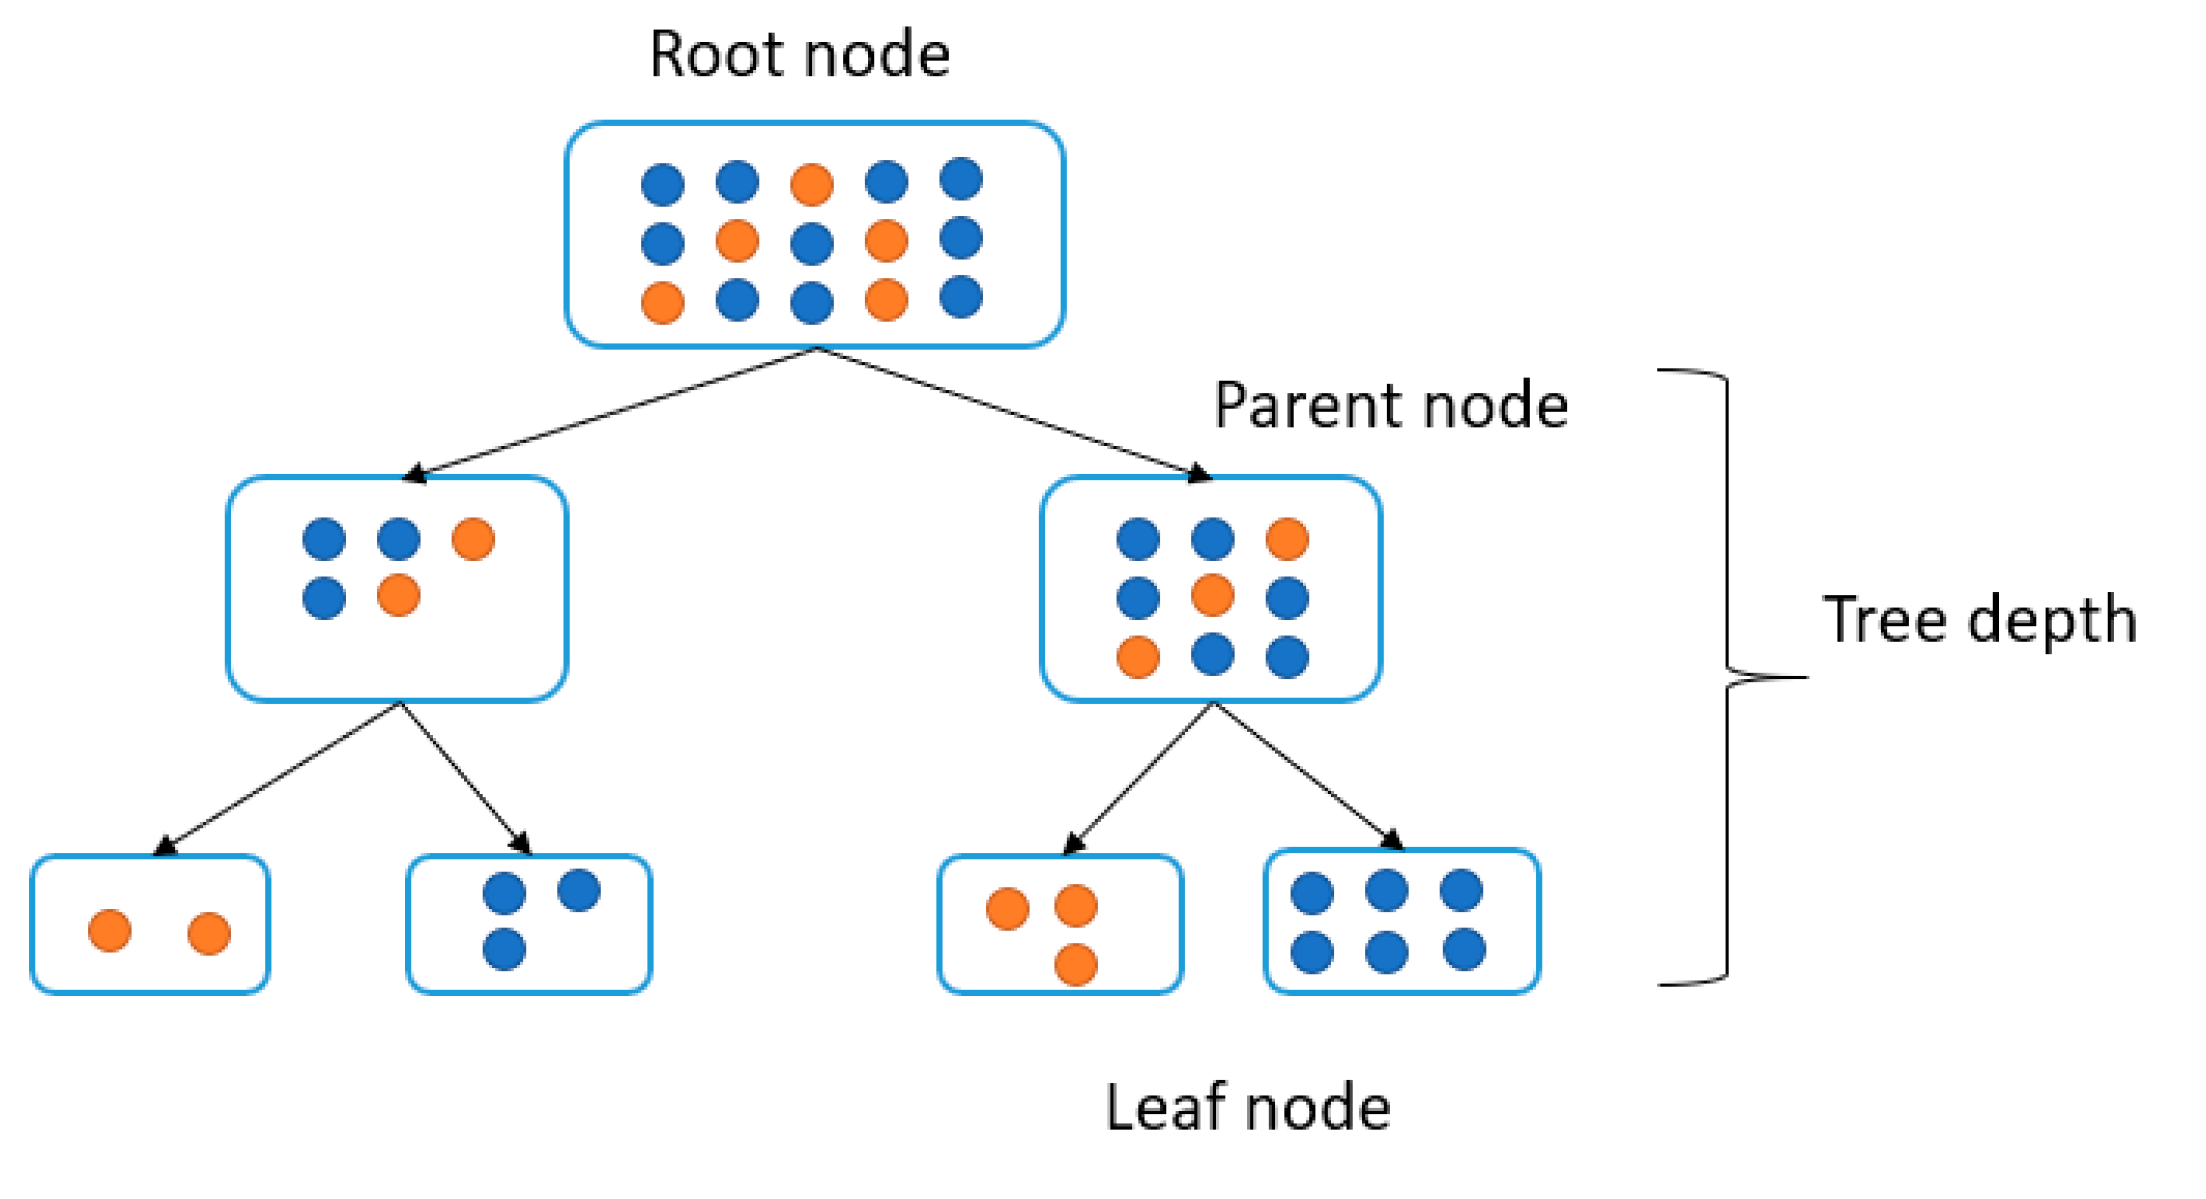
The DT is a nonparametric supervised learning technique employed when addressing classification and regression tasks. This model can be visualized in the form of a tree graph, and the construction of a DT typically encompasses three key phases: feature selection, DT generation, and DT pruning.
In the DT generation phase, the process commences with the creation of the root node, wherein all training data points are initially placed. The DT proceeds to determine an optimal feature value partitioning point, guided by minimizing loss functions such as the squared error in the case of regression and the Gini coefficient or information gain in the case of classification. This partitioning effectively divides the training dataset into subsets based on this selected feature. In this specific study, we opt for the minimum mean square error (MSE) as the criterion for partitioning, as represented by Equation (1):
where Ns represents the total number of input data within the node, and and denote the actual values of the input data on node i or j, respectively. Furthermore, and correspond to the estimated value in the split node.
This procedure is iteratively applied to subsequent nodes, making this a recursive procedure [35]. The outcome is the generation of a tree graph akin to the one depicted in Figure 1.
The DT algorithm is capable of quantifying the significance of features, which essentially measures their influence on prediction outcomes. The higher the importance of the feature, the more pronounced its effect on the predictions. Conversely, lower feature importance signifies a reduced impact on the prediction results. The obtained results facilitate feature prioritization and sorting.
The splitting relies on the calculation of the sum of squared errors (SSE) relative to the means of the values in the two subsets, S1 and S2, which ultimately defines the split [36].
Among all the potential splits of the dataset S above the branch, the split , resulting in the lowest sum of squared errors was selected:
2.2. Correlation Coefficients
2.2.1. Pearson Correlation Coefficient
The Pearson correlation coefficient is an indicator of the strength of linear correlation between two random variables, with its values ranging from −1 to 1. A value of “r” closer to 1 indicates a stronger positive linear relationship between the variables. Conversely, a value closer to −1 signifies a stronger negative linear relationship. When the two variables are independent, then .
In the equation, r is the correlation coefficient, and are two variable values, and n is the number of sample individuals.
2.2.2. Spearman Correlation Coefficient
The Spearman correlation coefficient also referred to as the rank correlation coefficient, is used to assess whether two variables exhibit a general monotonic relationship. It is computed as follows:
where is the mean of x rankings, is the mean of y rankings, is the x ranking, is the y ranking, and n is the number of data pairs.
A positive value indicates concordant dependence, while a negative value for 1 indicates a discordant dependence; the limits of the range [−1, 1] of its possible values correspond to complete dependence. In contrast to the Pearson correlation coefficient, the Spearman correlation coefficient is applicable to assessing nonlinear monotonic relationships. However, for the Spearman coefficient, it is also true that the independence of both variables implies .2.2.3 for the Kendall correlation coefficient.
The Kendall correlation coefficient, τ, assesses the difference between the probabilities that both random variables are concordant and discordant. It is computed as follows:
where P represents the number of concordant pairs. Similar to the Spearman correlation coefficients, it is also applicable to nonlinear relationships but is particularly useful when dealing with ties. Like the Pearson and Spearman coefficient, it ranges between −1 and 1. The meaning of the zero, positive, negative, and limit values is the same as for the Spearman correlation coefficient.
2.3. CFD Modelling
Computational fluid dynamics (CFDs) is a conventional numerical tool employed to solve the governing partial differential equations describing transport phenomena during the crystal growth process. It aids in comprehending the crucial process steps and factors influencing crystal growth. The primary challenge of this approach lies in the computational expense, high cost, and time-consuming nature of CFD simulations, coupled with a limited generalization capability.
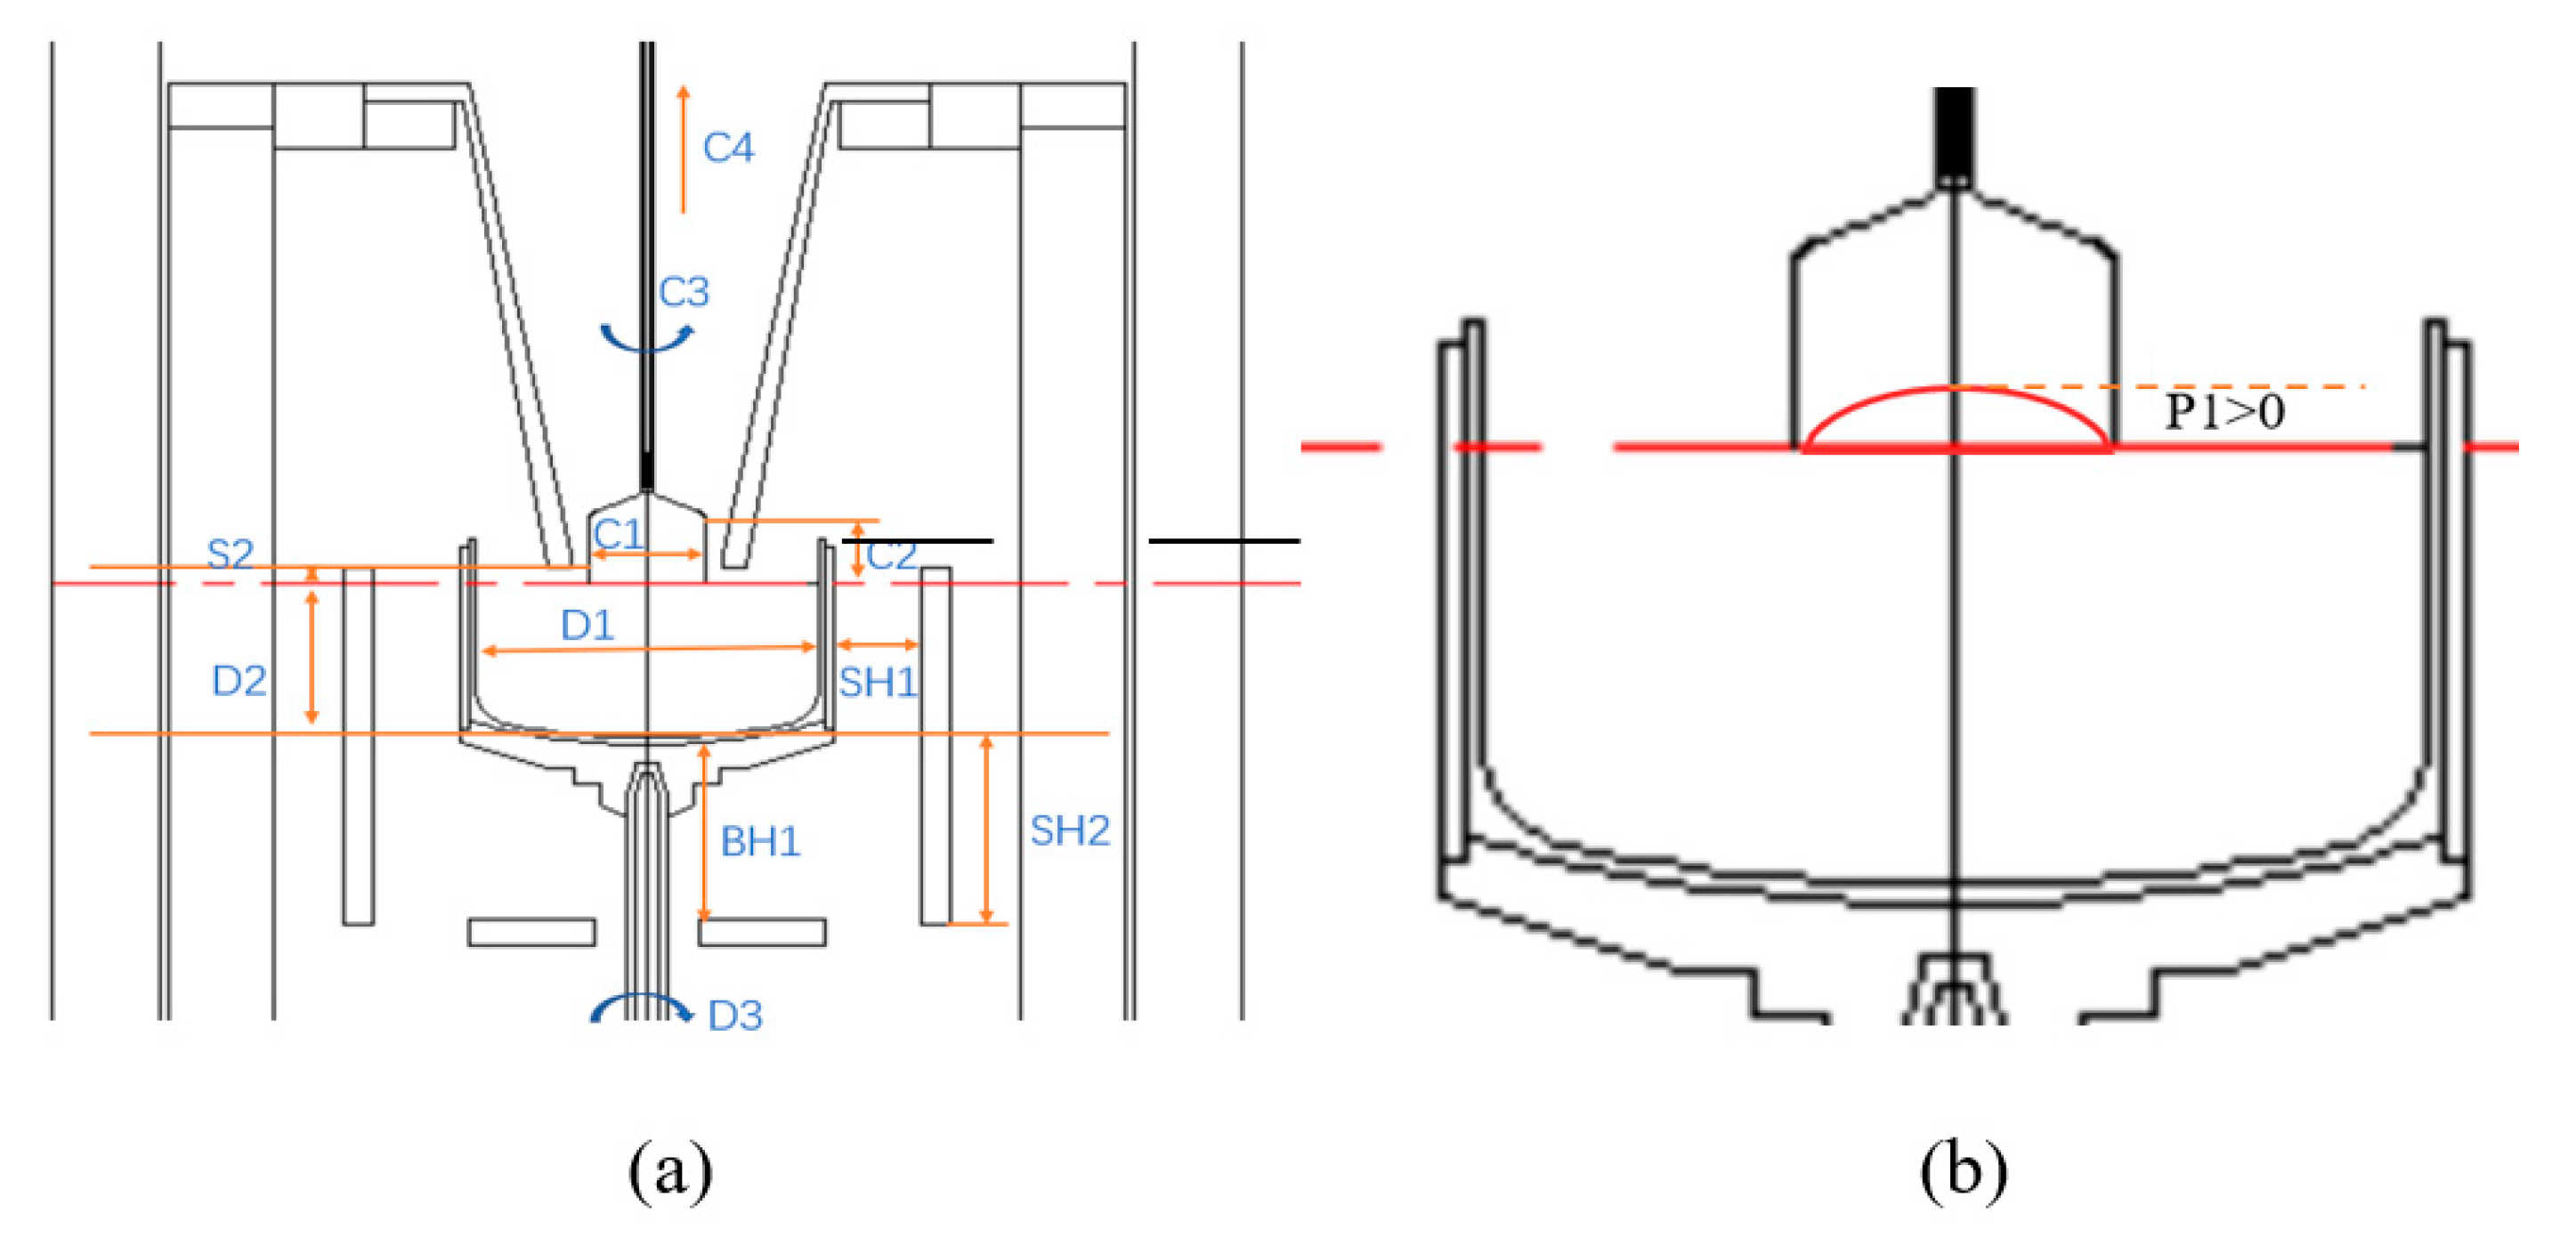
The CFD model for LEC-GaAs growth encompasses several physical processes, including buoyancy-driven convection, forced convection stemming from crystal and crucible rotation, phase transition, thermal radiation, and heat transfer between fluid and solid phases. The CFD simulations were conducted using CGSim software. The axisymmetric model encompasses various parts, such as the crucible, graphite heaters, radiation screen, melt, B2O3 encapsulant, and crystal. A comprehensive illustration of the geometrical and process parameters is presented in Figure 2. Furthermore, the primary material properties utilized in this study are detailed in Table 1.
Among the 13 input variables, there are 7 geometry parameters, 1 material property that is associated with the radiation screen, and 5 parameters related to the crystal growth process. Notably, the radiation screens come in three variations, sharing the same shape but employing different materials: quartz, ceramics, or graphite.
In order to ensure a diverse array of combinations, we initiated our virtual experimentation using a “design of experiments” (DoE) approach. While the geometric parameters were manipulated across three levels, the process parameters were subjected to denser sampling. It is essential to mention that all models utilized an identical GaAs charge. Nevertheless, due to the constraints related to mass and spatial considerations, we excluded some impractical combinations. The range of values for the process parameters can be found in Table 2.
For the output parameters, we focused on three key metrics: interface deflection, average interface temperature gradient, and the Voronkov criteria (v/G). Interface deflection was chosen as the primary indicator of crystal quality due to its well-established correlation with thermal stress-induced crystal dislocation development.
In addition to interface deflection, we incorporated the average interface temperature gradient and v/G as supplementary measures of crystal quality. These choices were driven by the specific considerations related to our study given below.
The unstable growth interface in GaAs produced by LEC often results in the formation of twins and polycrystals [37]. This instability, coupled with the low thermal conductivity and opacity of the B2O3 encapsulant, leads to significant nonlinearity in temperature near the liquid-encapsulant boundary, causing substantial temperature gradients within the crystal. Thermal gradient-induced stress plays a pivotal role in the formation of dislocations in GaAs crystals [12].
Pertinently, research by Rudolph [38] identified the presence of dislocation clusters around gallium impurities in GaAs crystals grown via LEC. These gallium impurities migrate through the melt to reach the interface, where they are continually captured during the crystal’s growth. The propagation behavior of these gallium impurities, captured by the advancing interface, is intrinsically linked to v/Gn [39]. A growth rate below a critical threshold can result in GaAs material devoid of impurities.
As such, we have chosen to include interface deflection, average interface temperature gradient, and v/Gn as the output parameters for the machine learning training dataset. Subsequently, we harnessed DT algorithms to generate regression models that establish relationships between these geometric and process parameters and our target parameters. All algorithms were implemented in Python for this purpose.
Formularbeginn
3. Results and Discussion
The CFD results provided 88 data records in the form of 16-dimensional vectors, each with 13 inputs and 3 outputs. Having more data is advantageous for constructing a more robust and accurate DT model. No strict rule exists for the minimum data points, but DT emphasis lies on data interpretability over prediction accuracy. In this context, the available 88 data records are deemed sufficient for the intended goal.
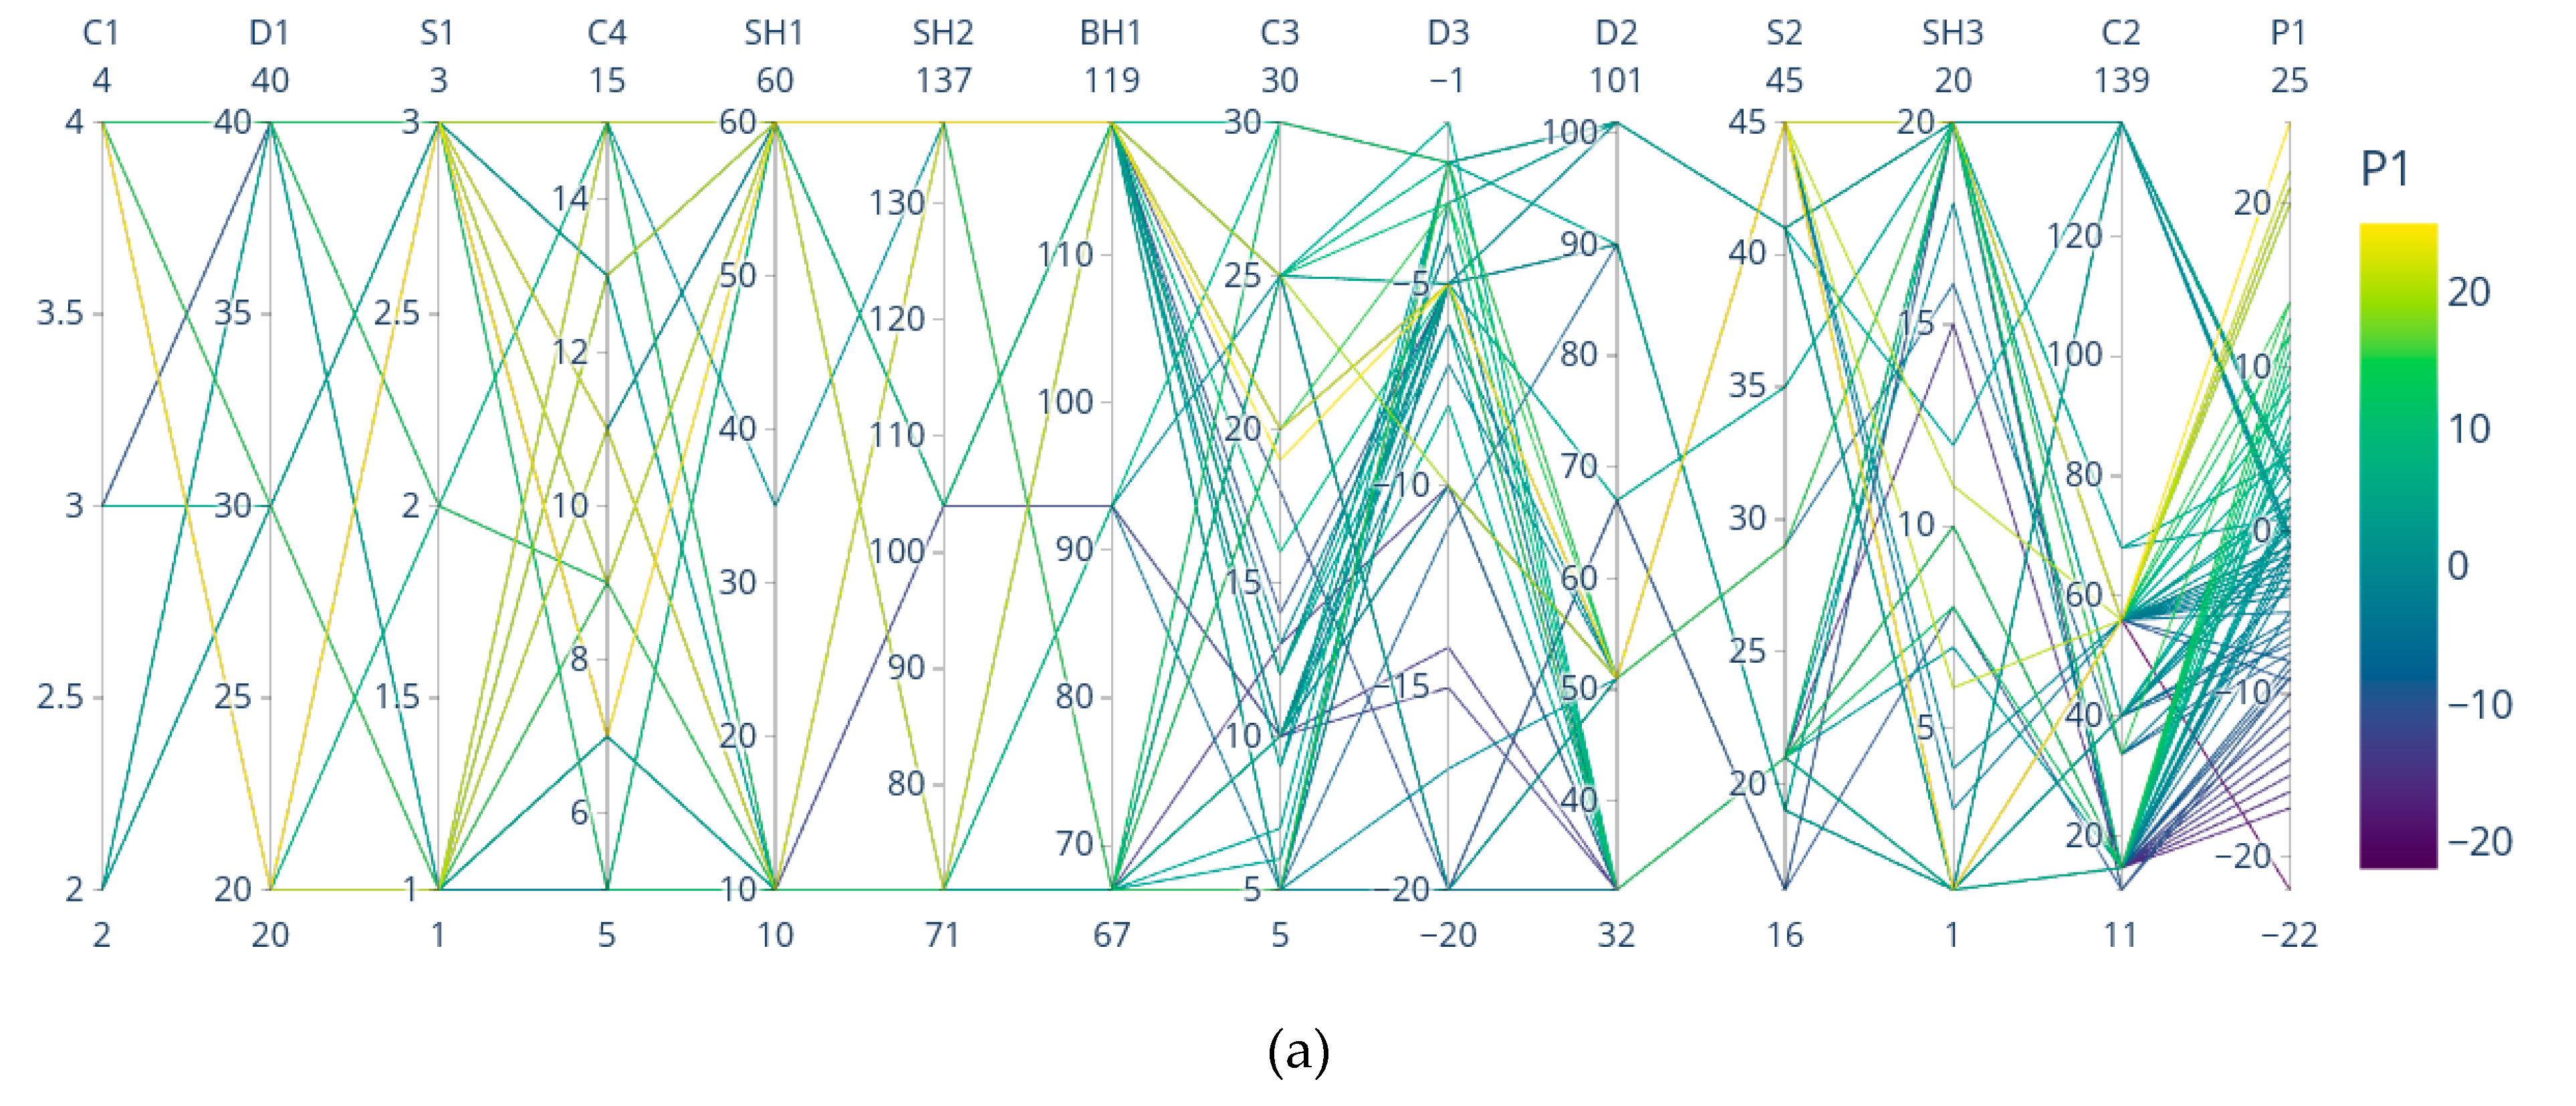
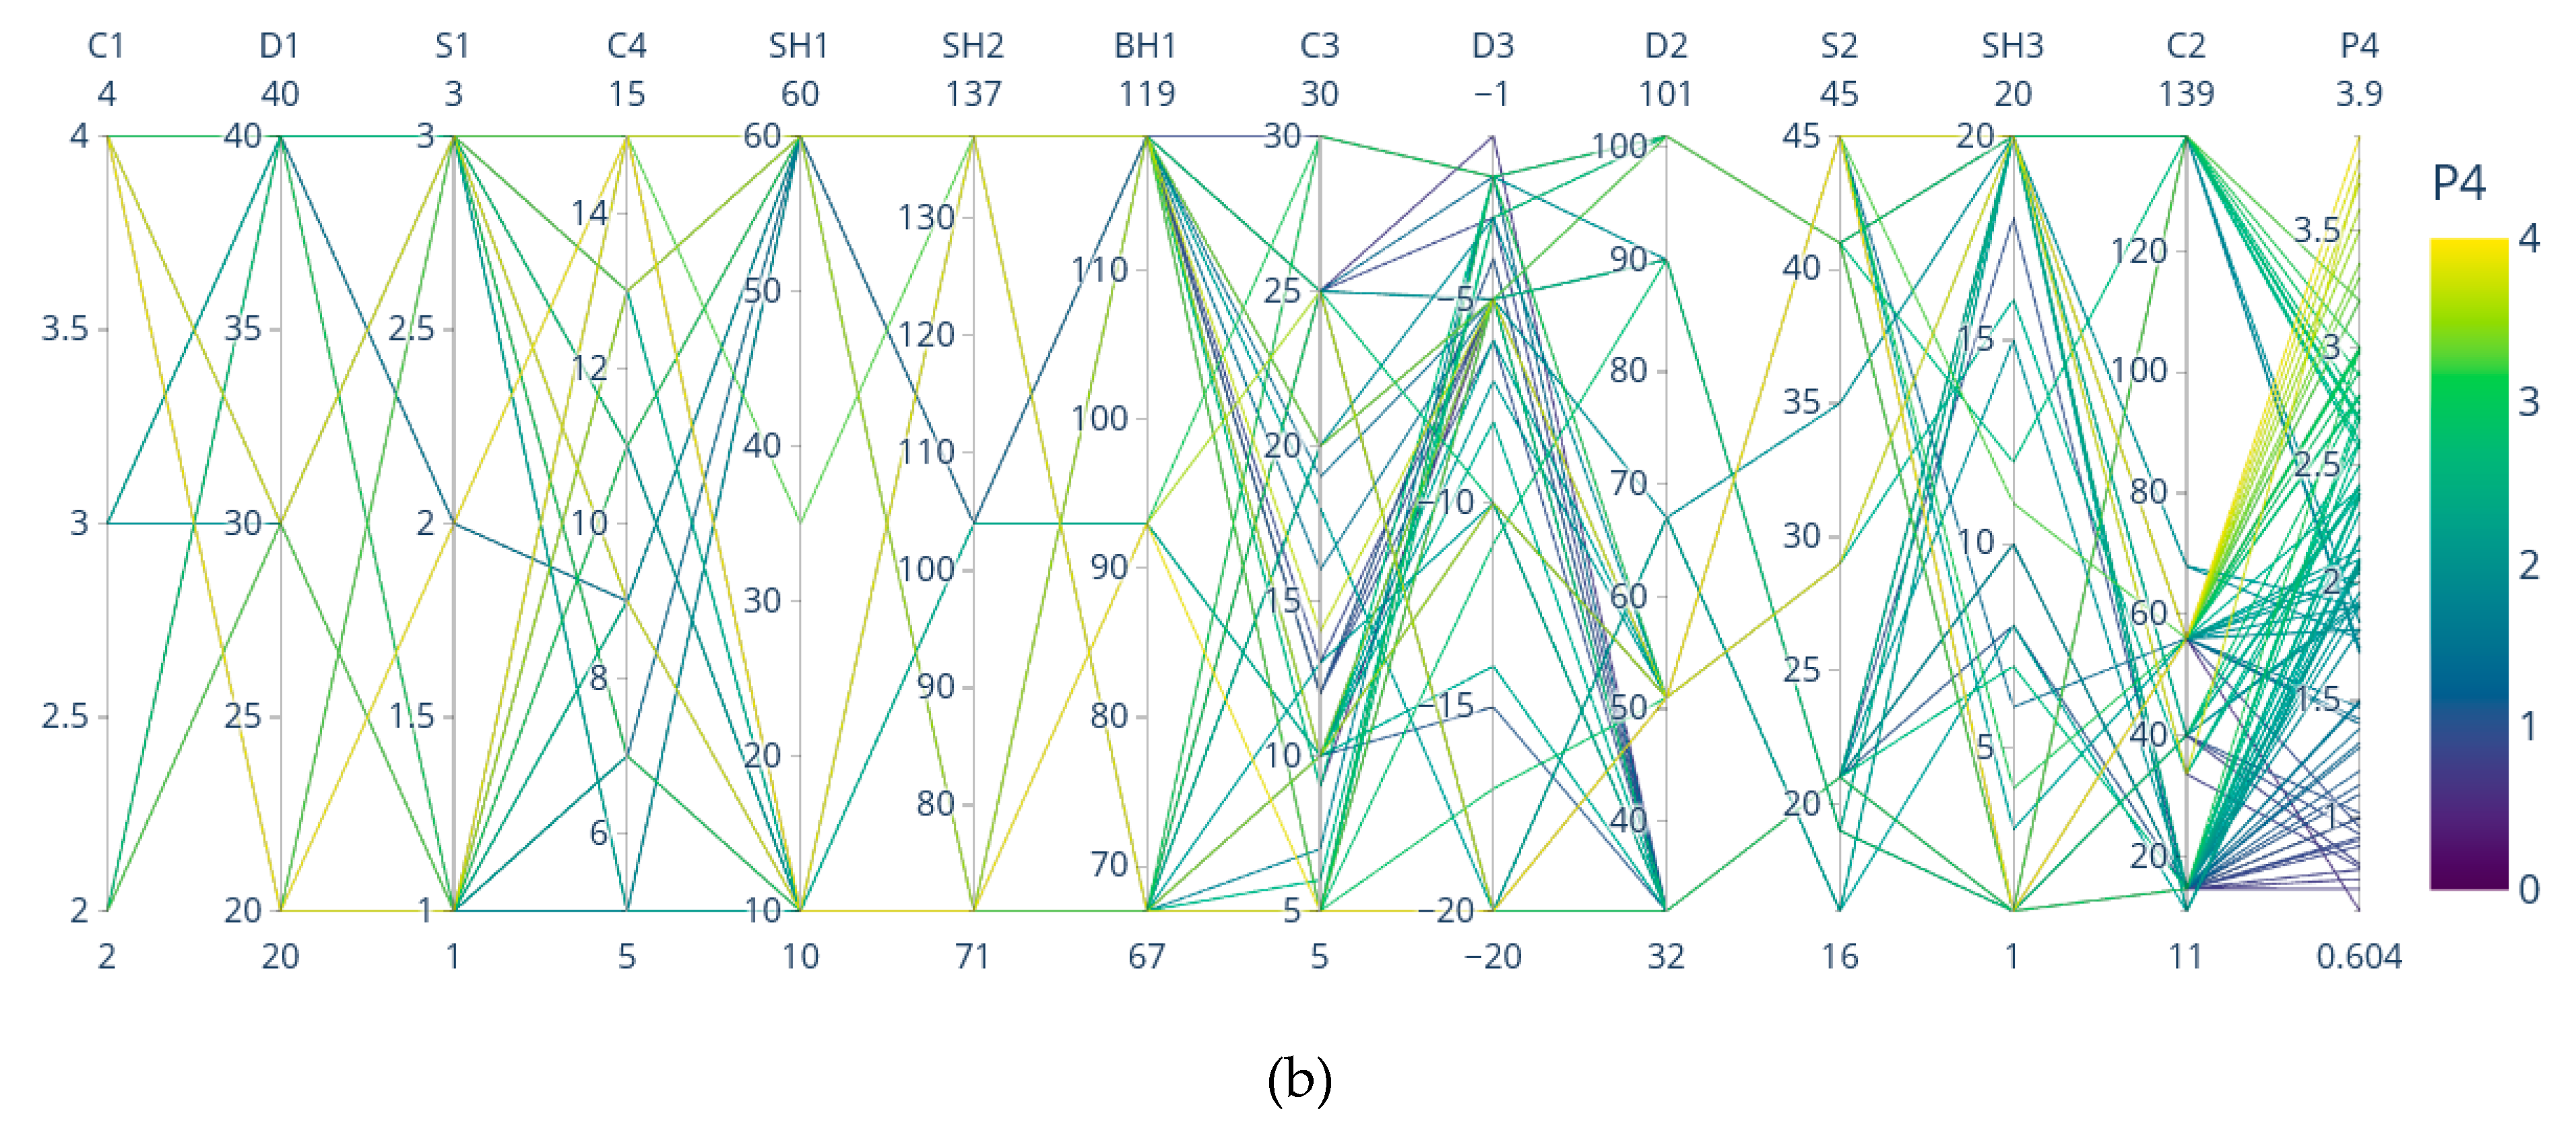
The data are presented in parallel co-ordinates in Figure 3, with the legend color corresponding to the value of one selected output parameter. Specifically, in Figure 3a,b, the line colors correspond to the values of interface deflection (P1) and v/Gn (P4), respectively. Figure 3a reveals that lines sharing the same color tend to cluster around labels D3 and C3. Furthermore, there is a noticeable separation between the different colors. This observation underscores the strong influence of the crucible rotation rate (D3) and crystal rotation rate (C3) on interface deflection (P1). In contrast, Figure 3b does not reveal any discernible labels that can be effectively used for classification.
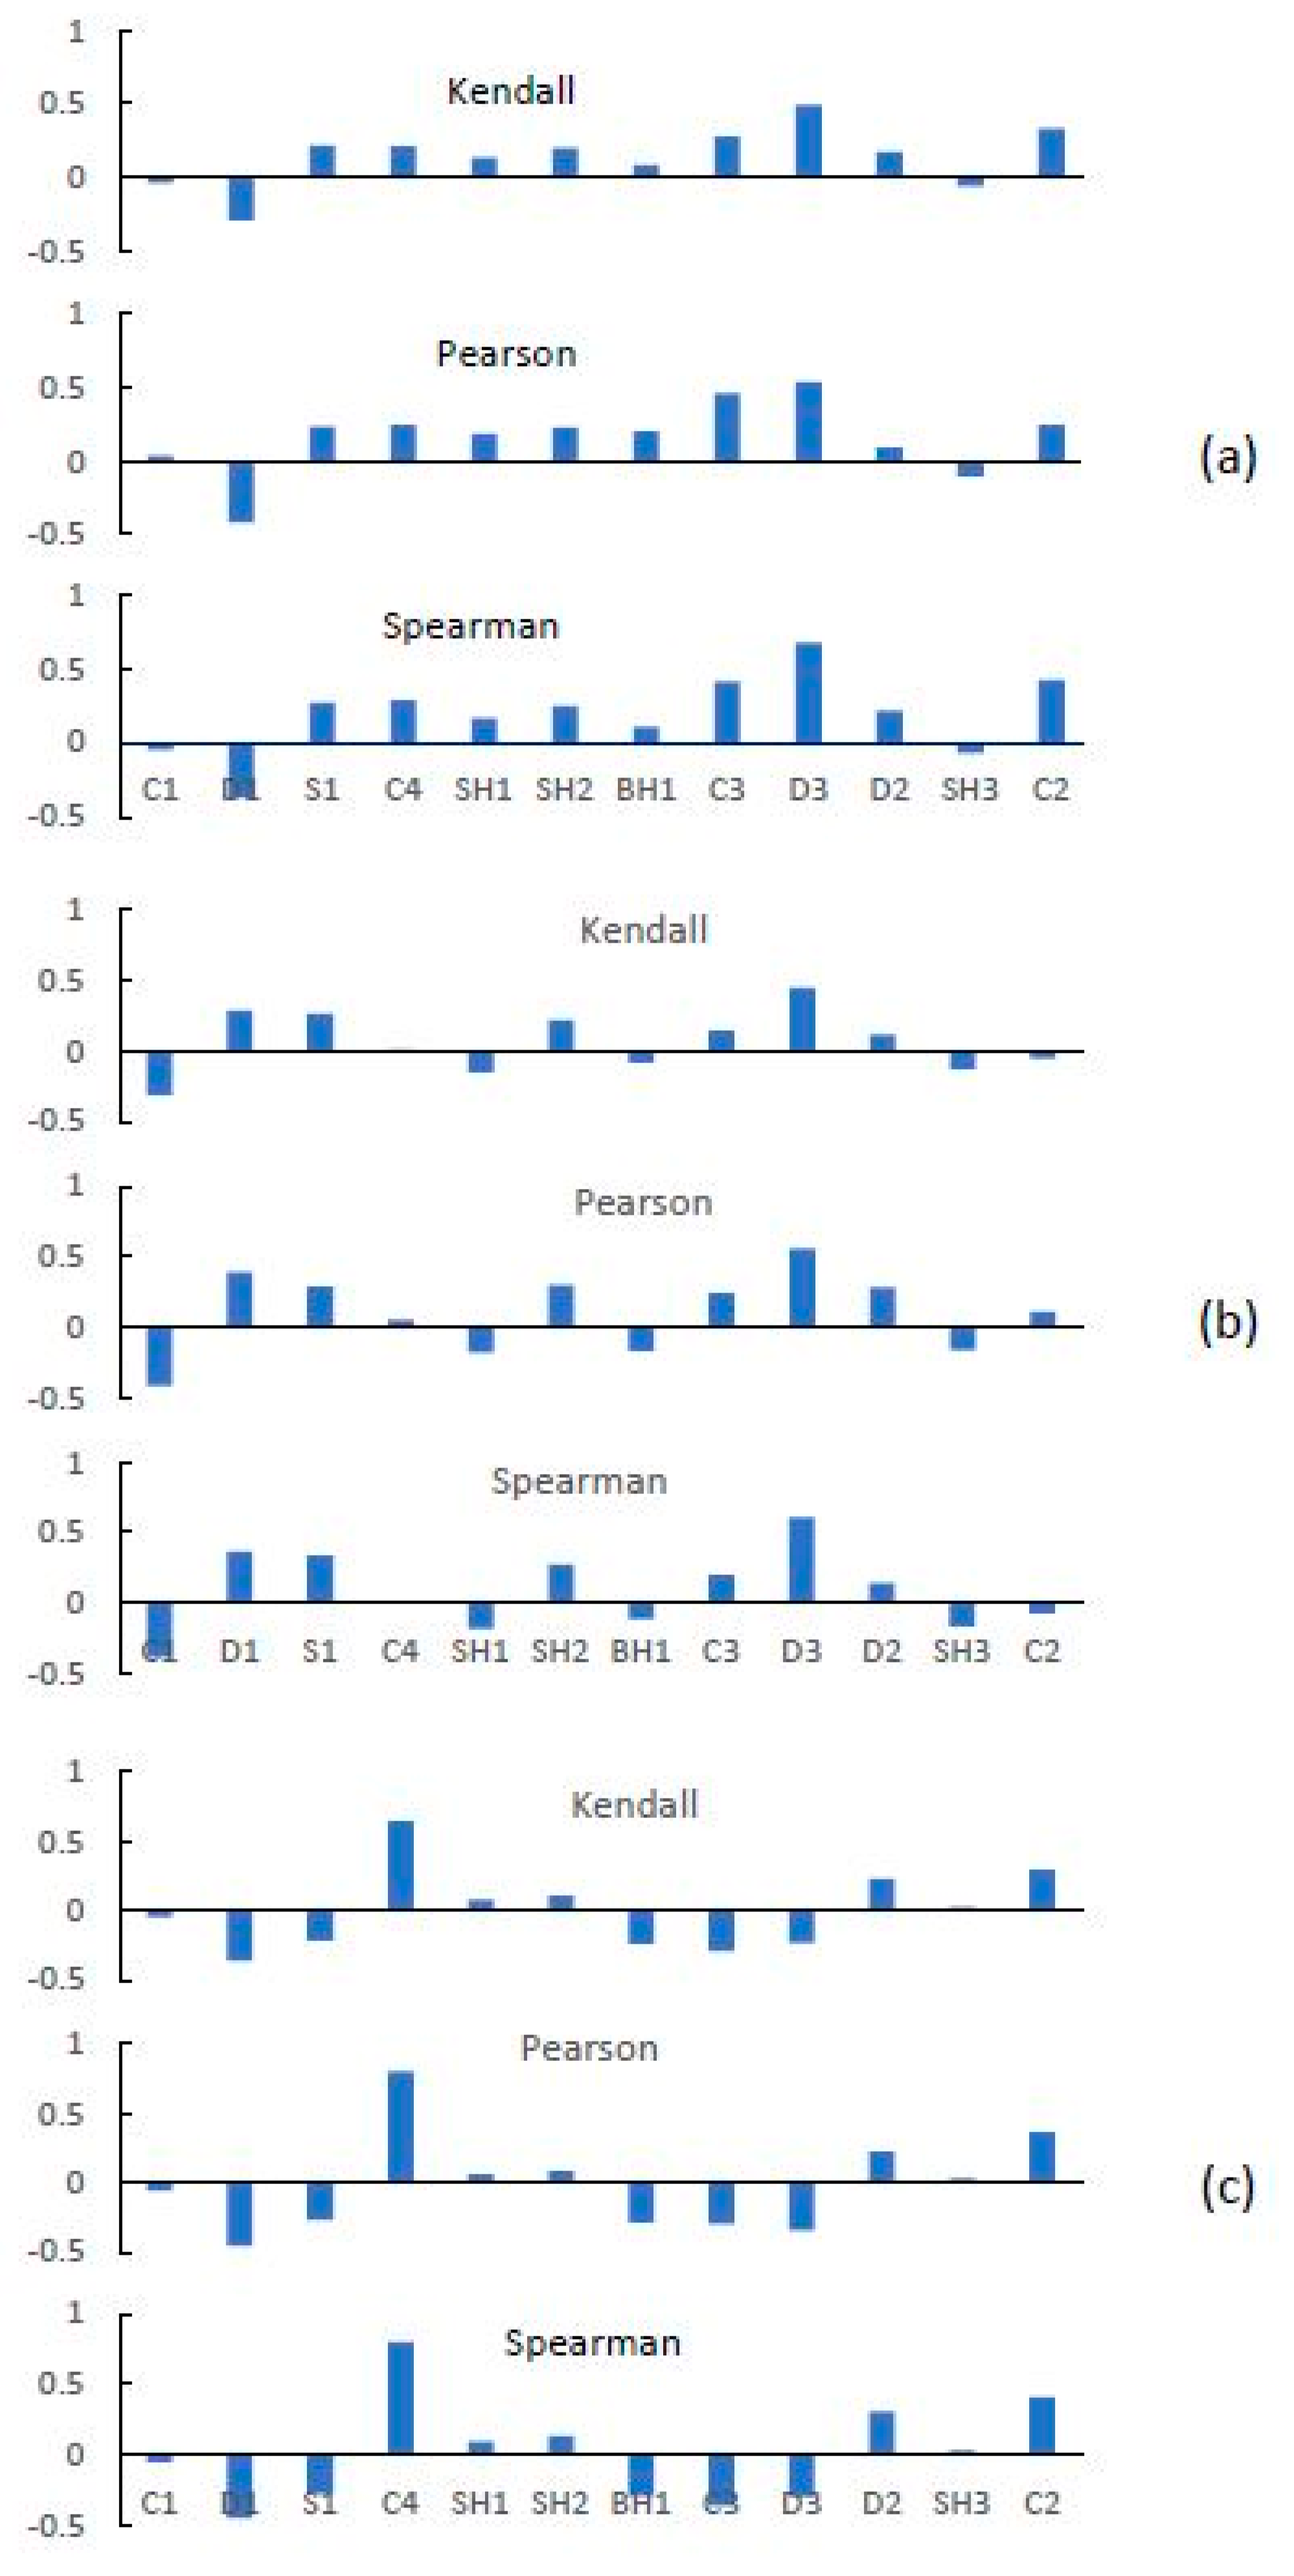
Figure 4 illustrates the resulting correlation coefficients between all input and output parameters. In the realm of crystal growth, ensuring optimal crystal quality is of paramount importance. In this study, we have identified three key output variables: interface deflection (P1), the average interface temperature gradient (P3), and v/Gn (P4). From Figure 4, it can be clearly seen that, according to all measures, the most positive correlation with interface deflection (P1) is the crucible rotation rate (D3), followed by the crystal length C2 and the crystal speed C3. The most negative correlation was obtained with crucible size D1. The heater and radiation screen have little effect on interface deflection. Similarly, for the average interface temperature gradient (P3), the crucible rotation rate (D3) also exhibits the strongest positive correlation, above 0.6, followed by crucible diameter (D1). Crystal diameter (C1) has the most negative correlation with P3. However, the crystal rotation rate has little effect on P3. In contrast, the most significant positive correlation with v/Gn (P4) is attributed to the pulling rate (C4), boasting a coefficient of 0.8.
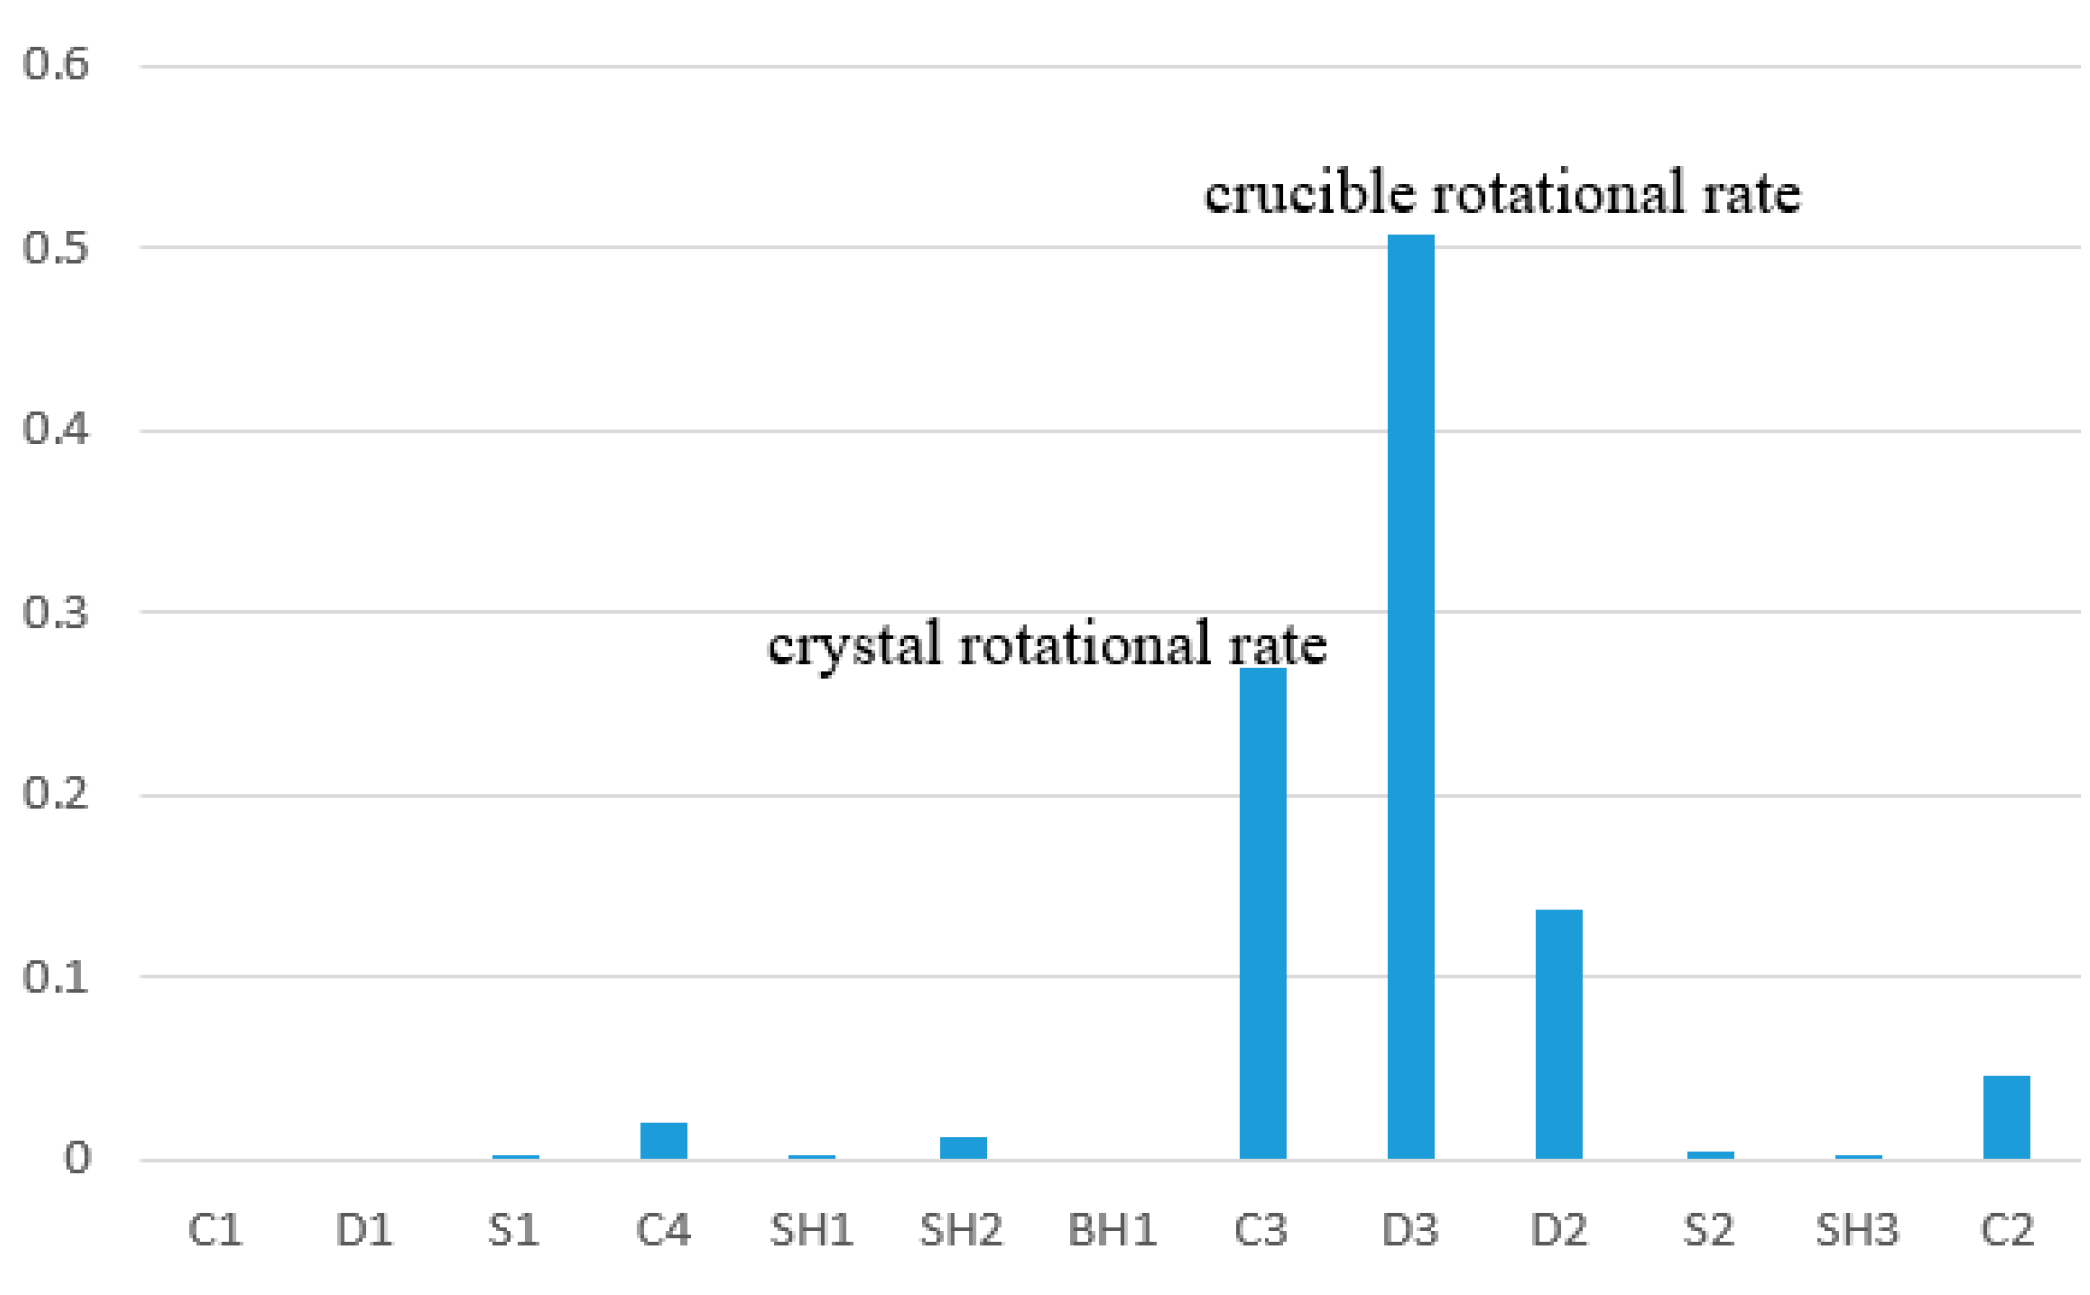
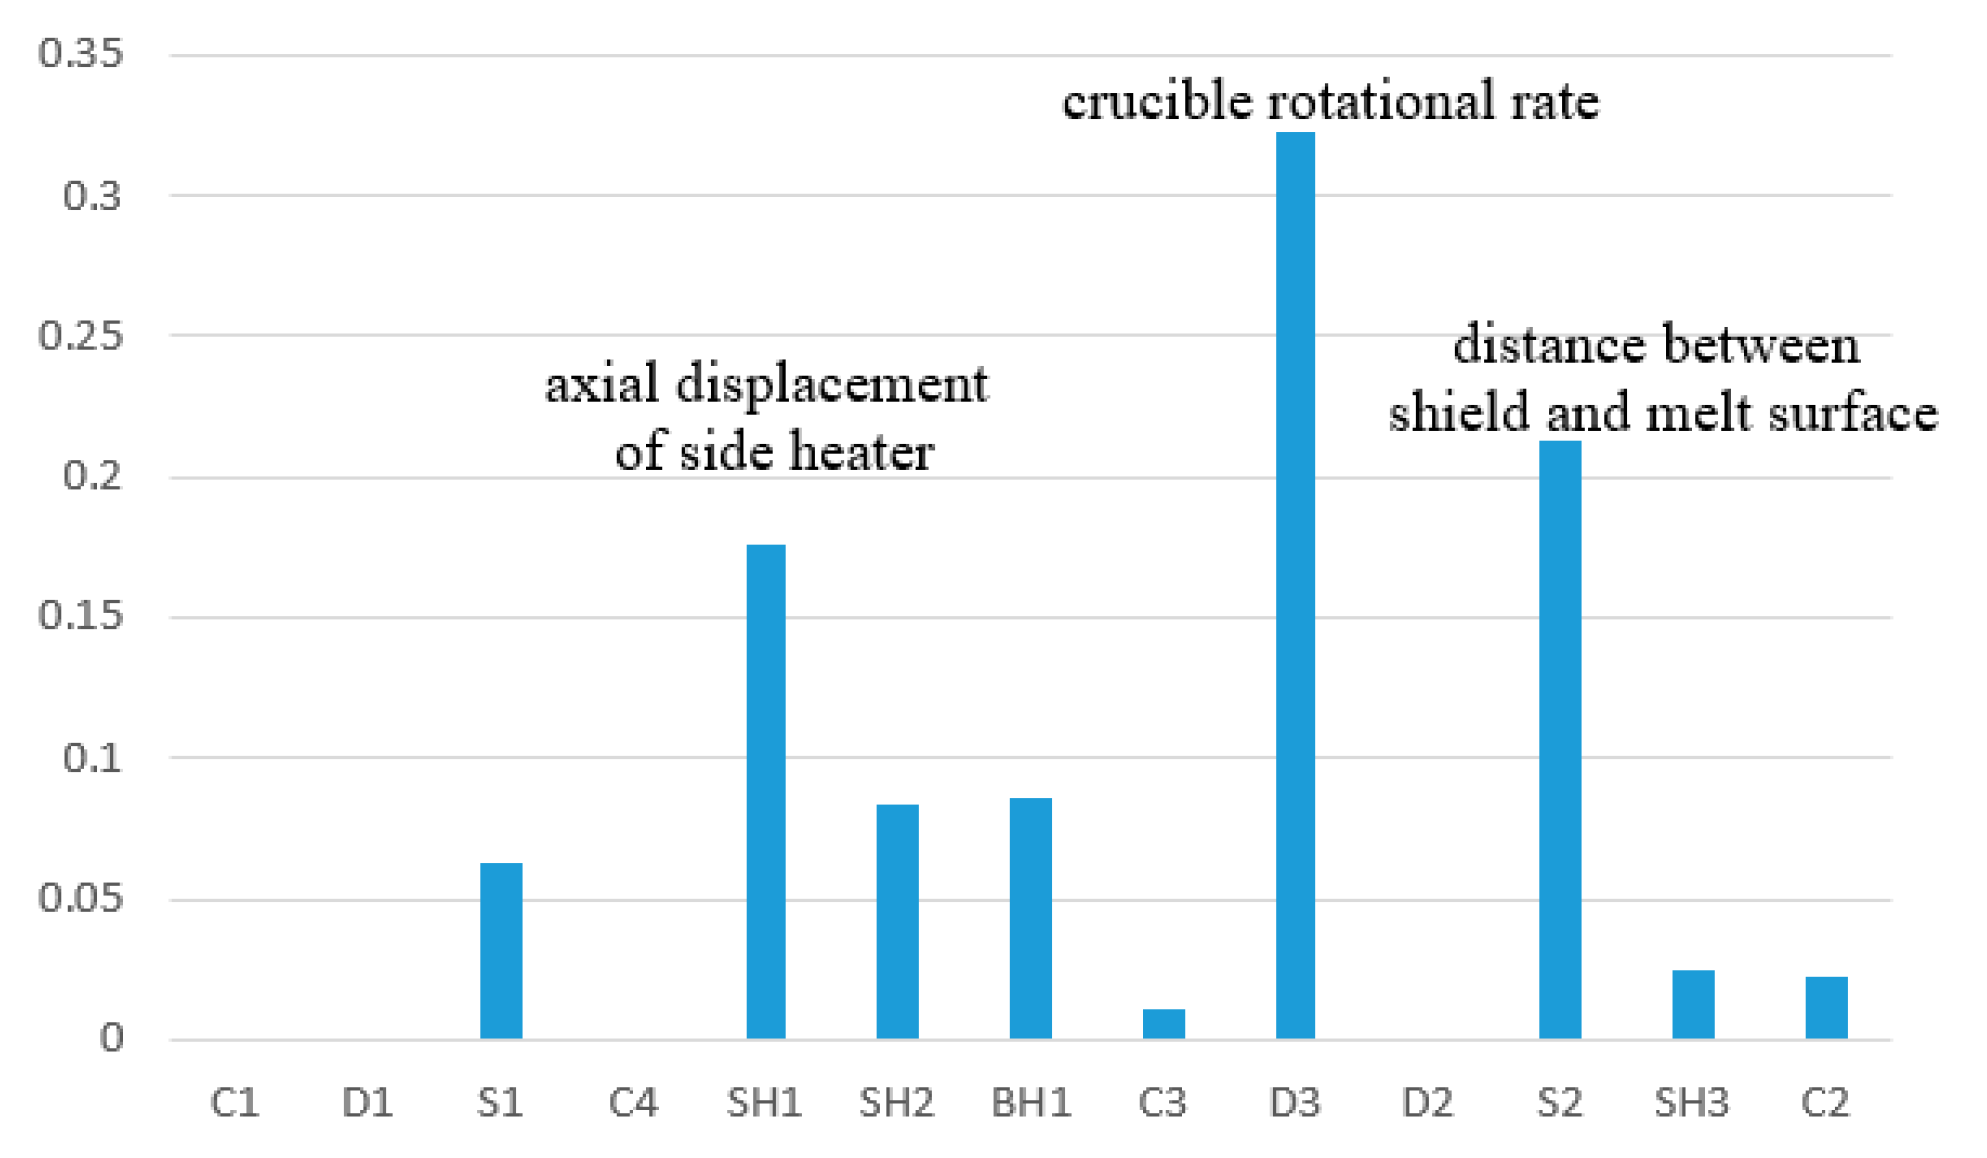
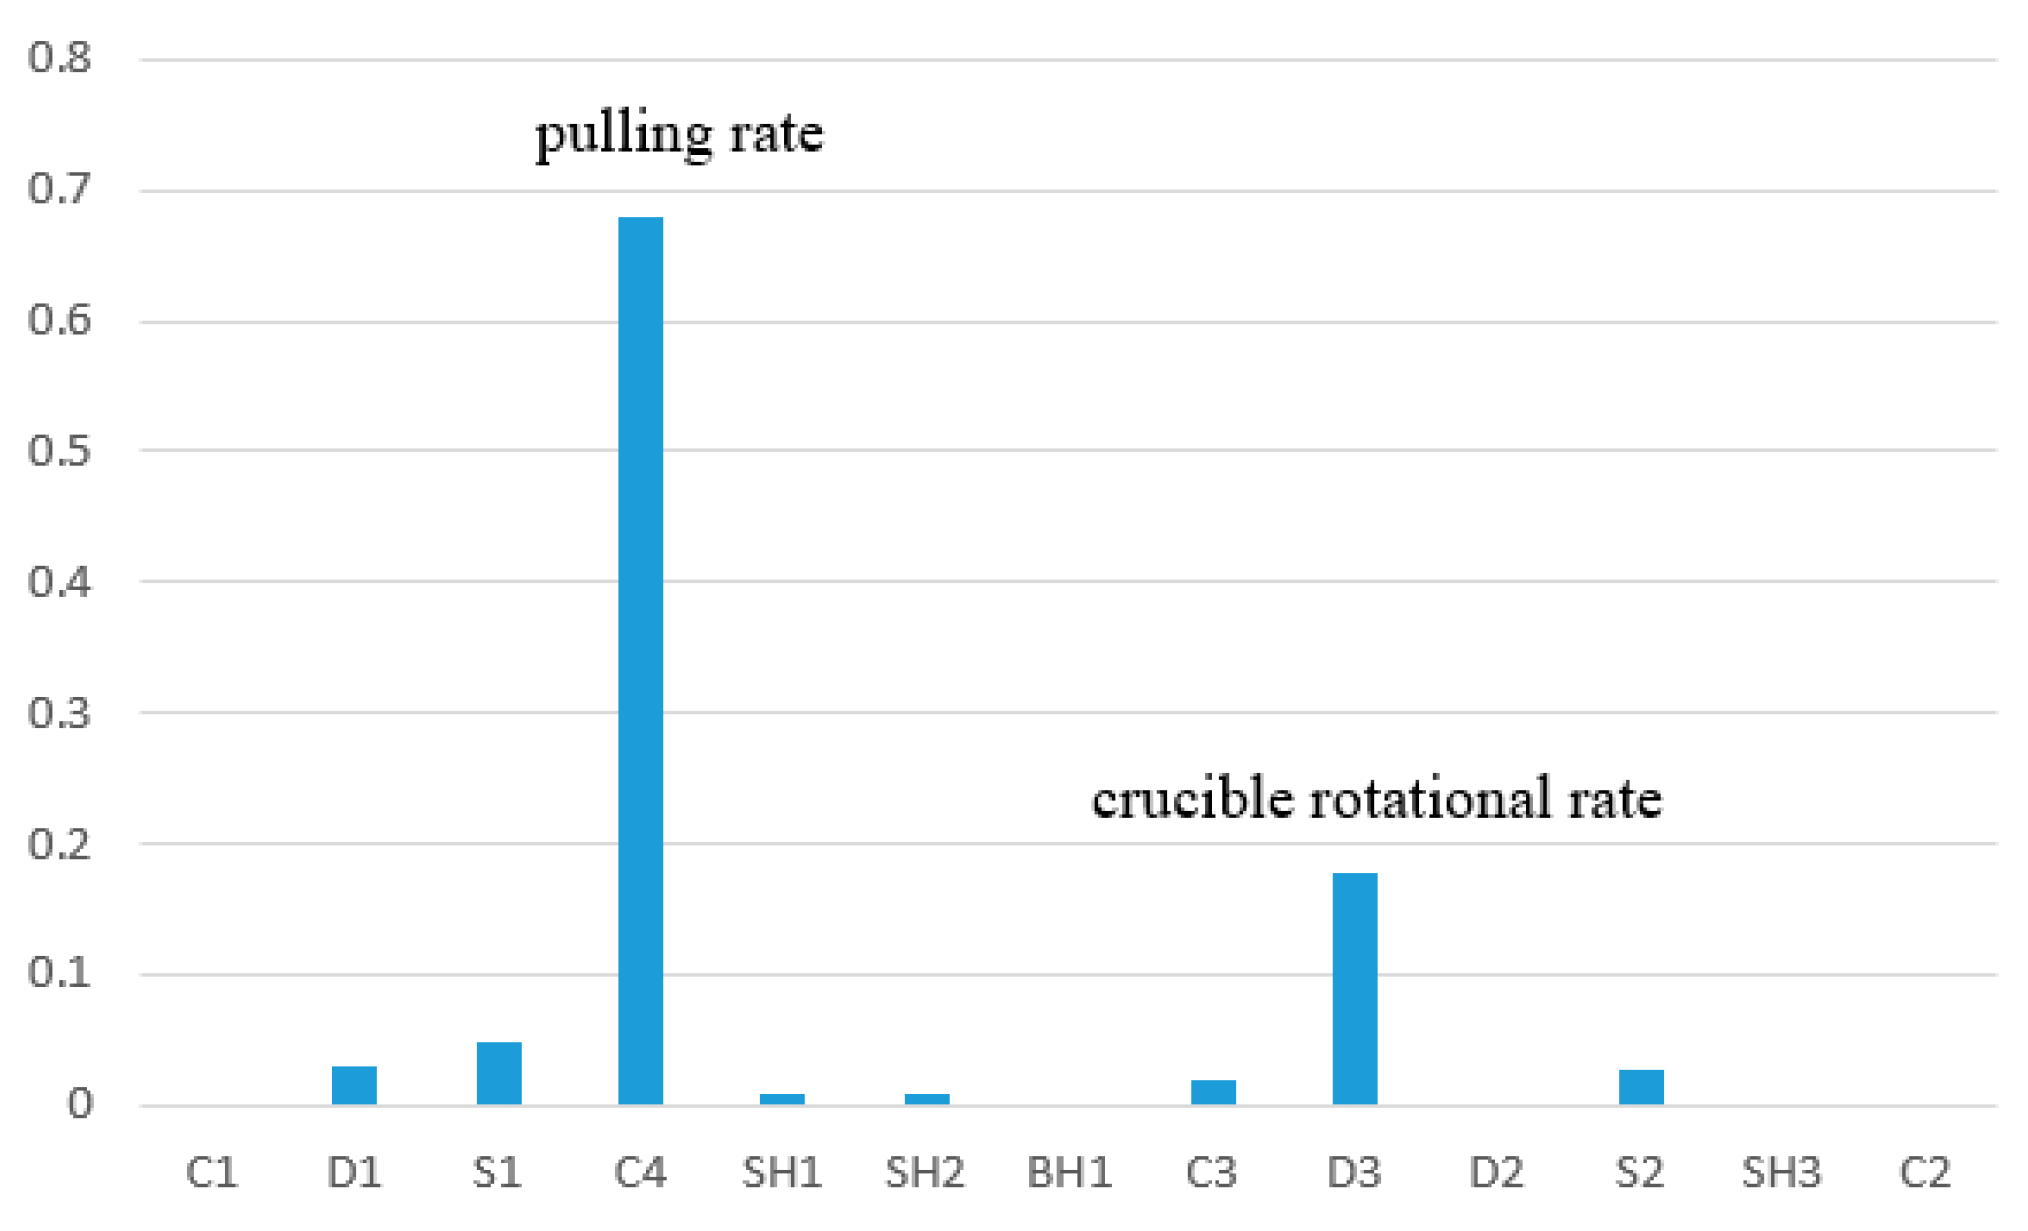
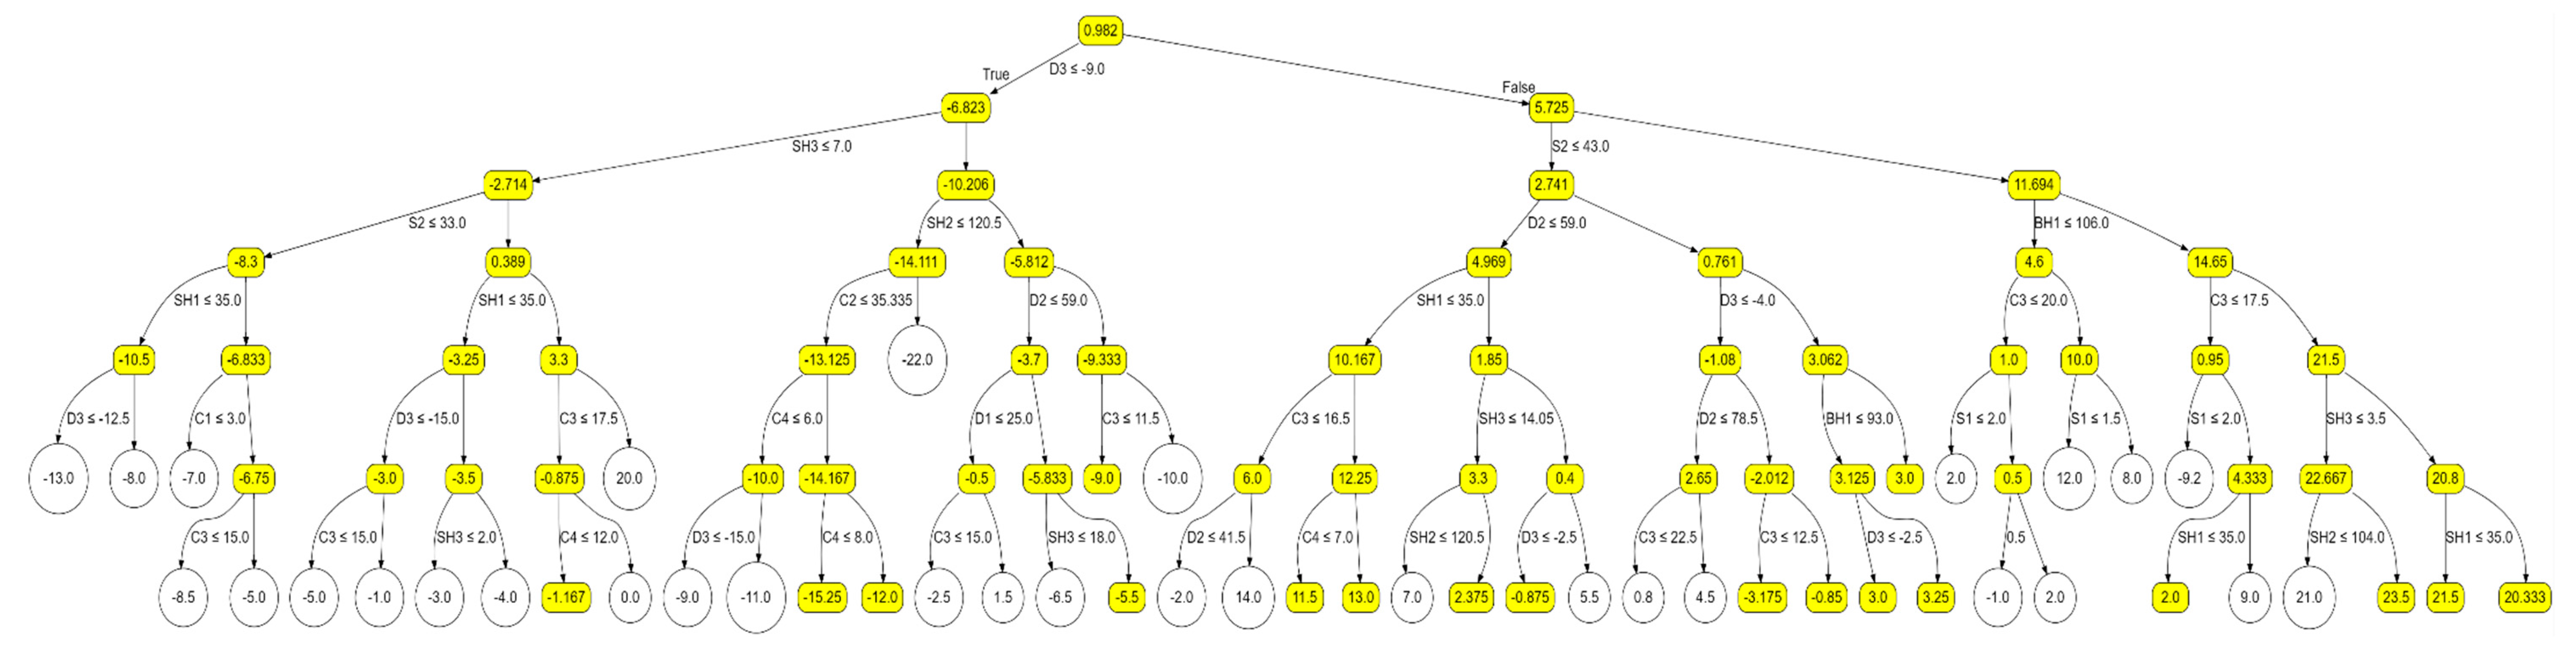
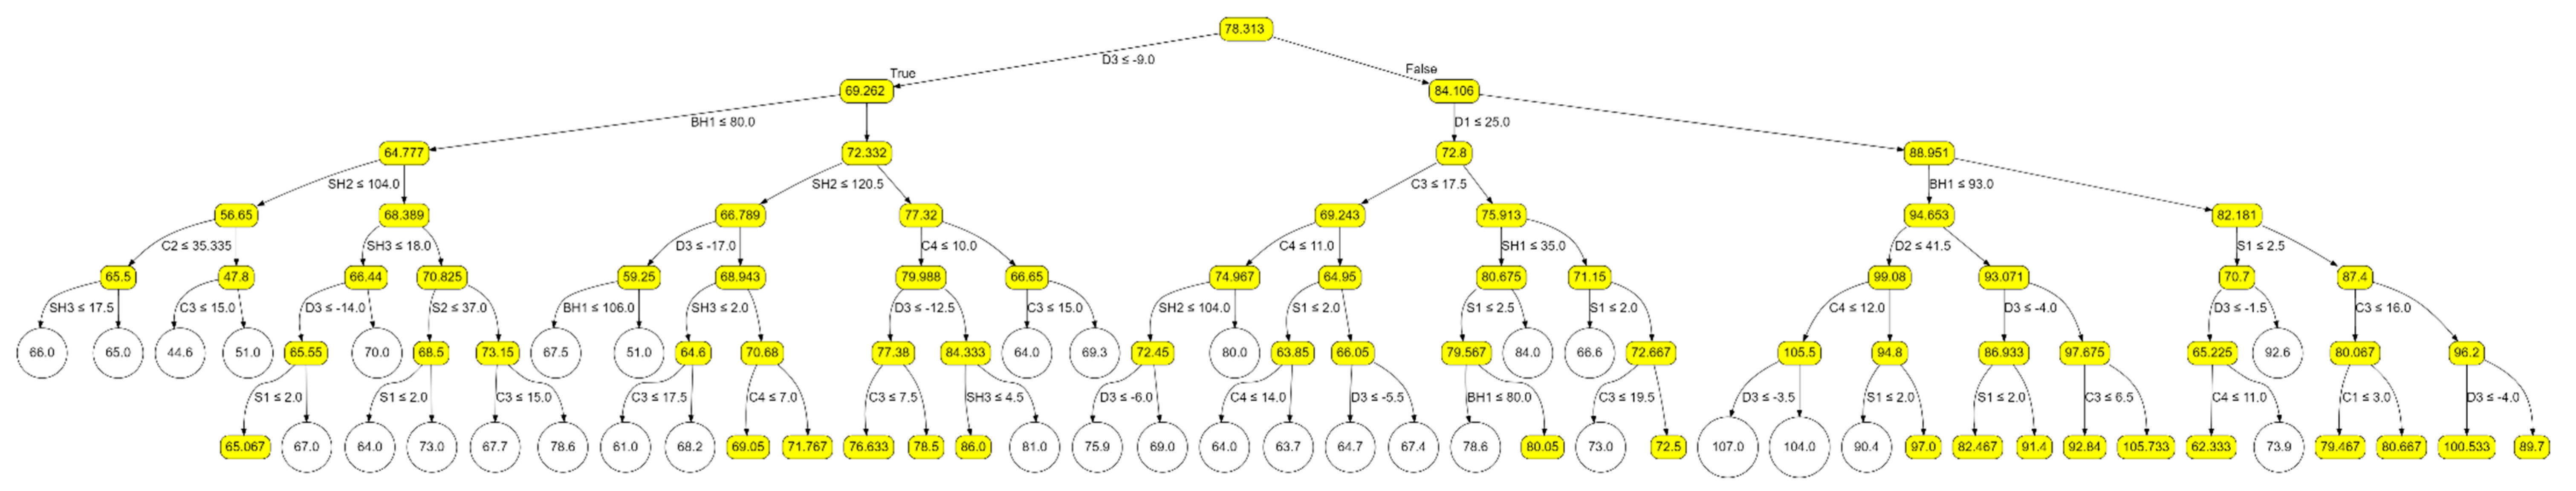
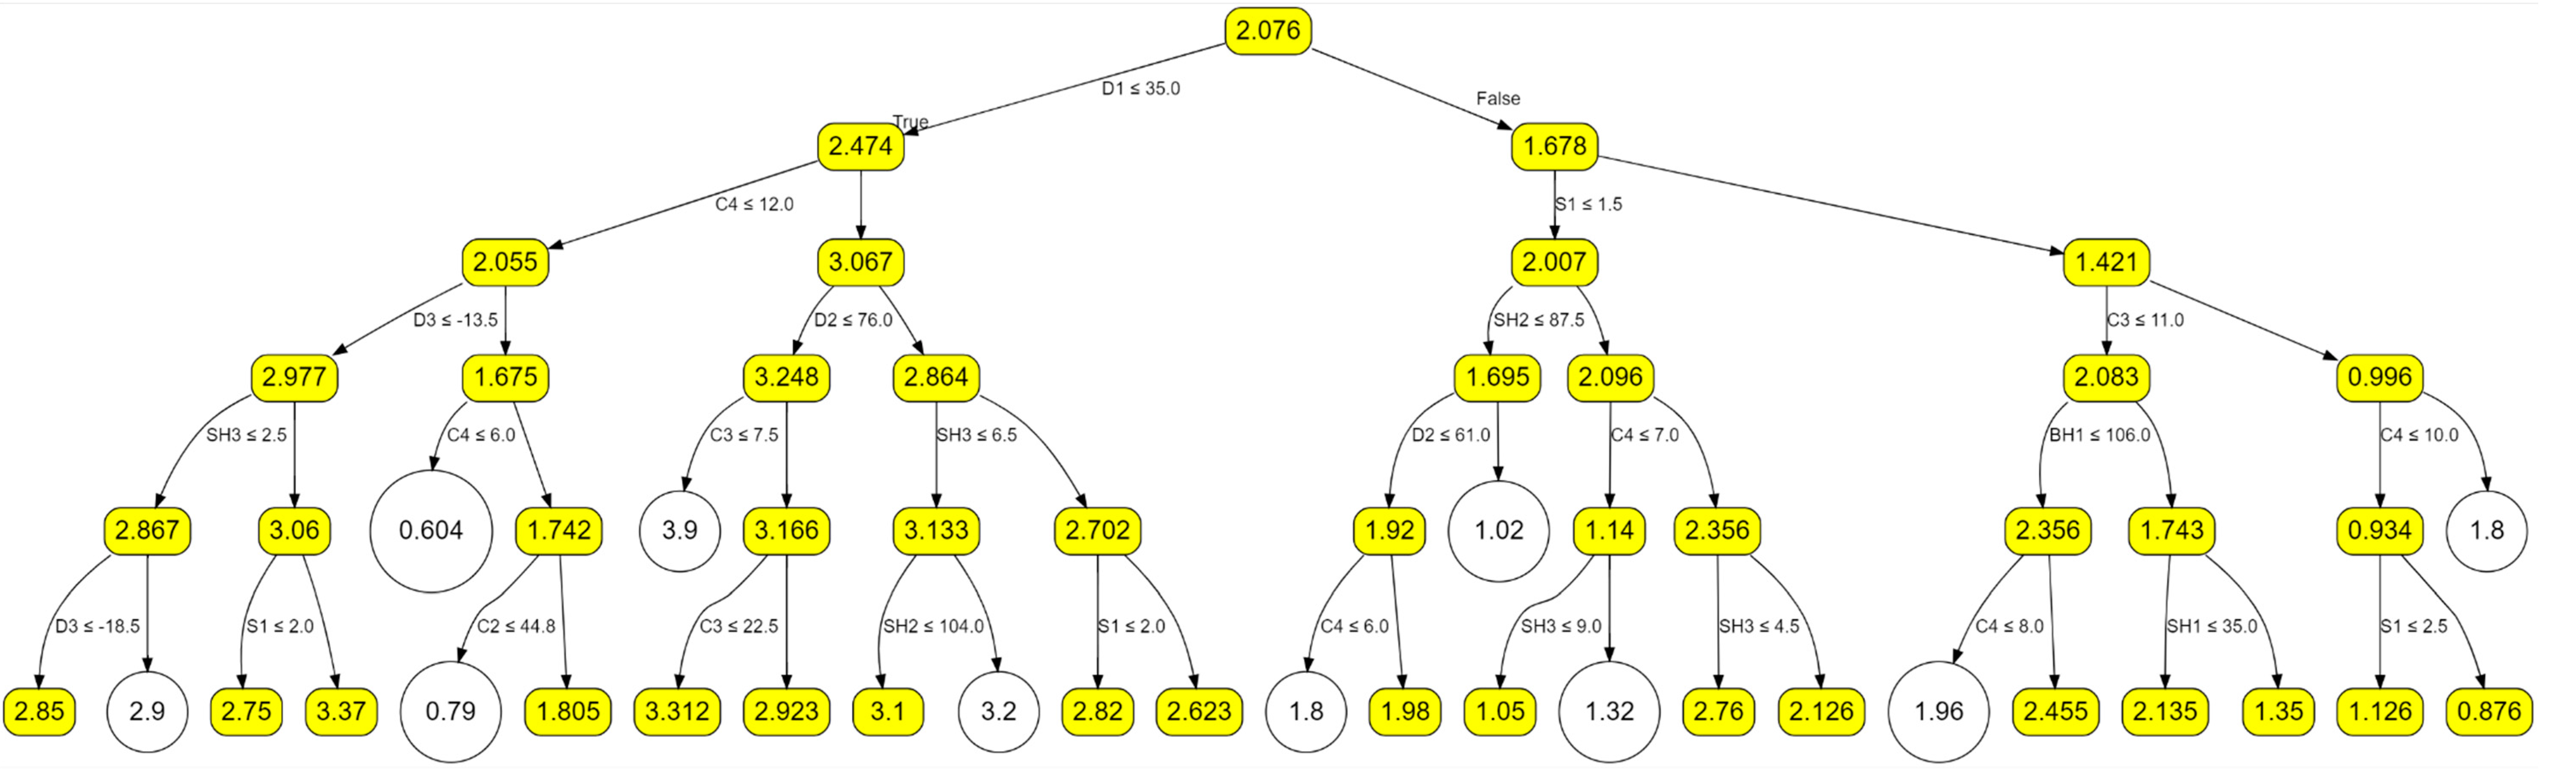
We performed a comprehensive analysis of the importance of process variables concerning each of the three target variables individually by means of DTs. The results of this analysis are presented in Figure 5, Figure 6 and Figure 7. For interface deflection (P1), the primary influencing factors are the crucible rotation rate (D3) at 50% and the crystal rotation rate (C3) at 27%. In the case of v/Gn (P4), the most influential factor is the pulling rate (C4), accounting for a substantial 68% of the relative importance. As for the average interface temperature gradient (P3), the primary influencing factors, ranked from highest to lowest importance, are the crucible rotation rate (D3) at 32%, the distance between the radiation screen and the liquid surface (S2) at 21%, and the axial displacement of the side heater (SH1) at 18%.
A regression tree is a commonly used machine learning model for analyzing continuous variable values. In order to enhance the generalization capability of a decision tree, ensuring better adaptation to unseen data, pruning is employed. Pruning involves the removal of certain branches (subtrees) from the tree to reduce the model’s complexity. Two key parameters in tree modeling, namely “max_ Features” and “max_ Depth”, play pivotal roles in controlling the complexity of the decision tree model. The “max_ Depth,” parameter regulates the maximum depth of the decision tree. Setting “max_ Depth “ too low may result in the tree failing to capture intricate data relationships, whereas setting it excessively high can lead to overfitting. The “max_ Features” is a parameter used to control the set each node chooses features from. It is a hyperparameter employed to limit the quantity of features, aiming to prevent overfitting.
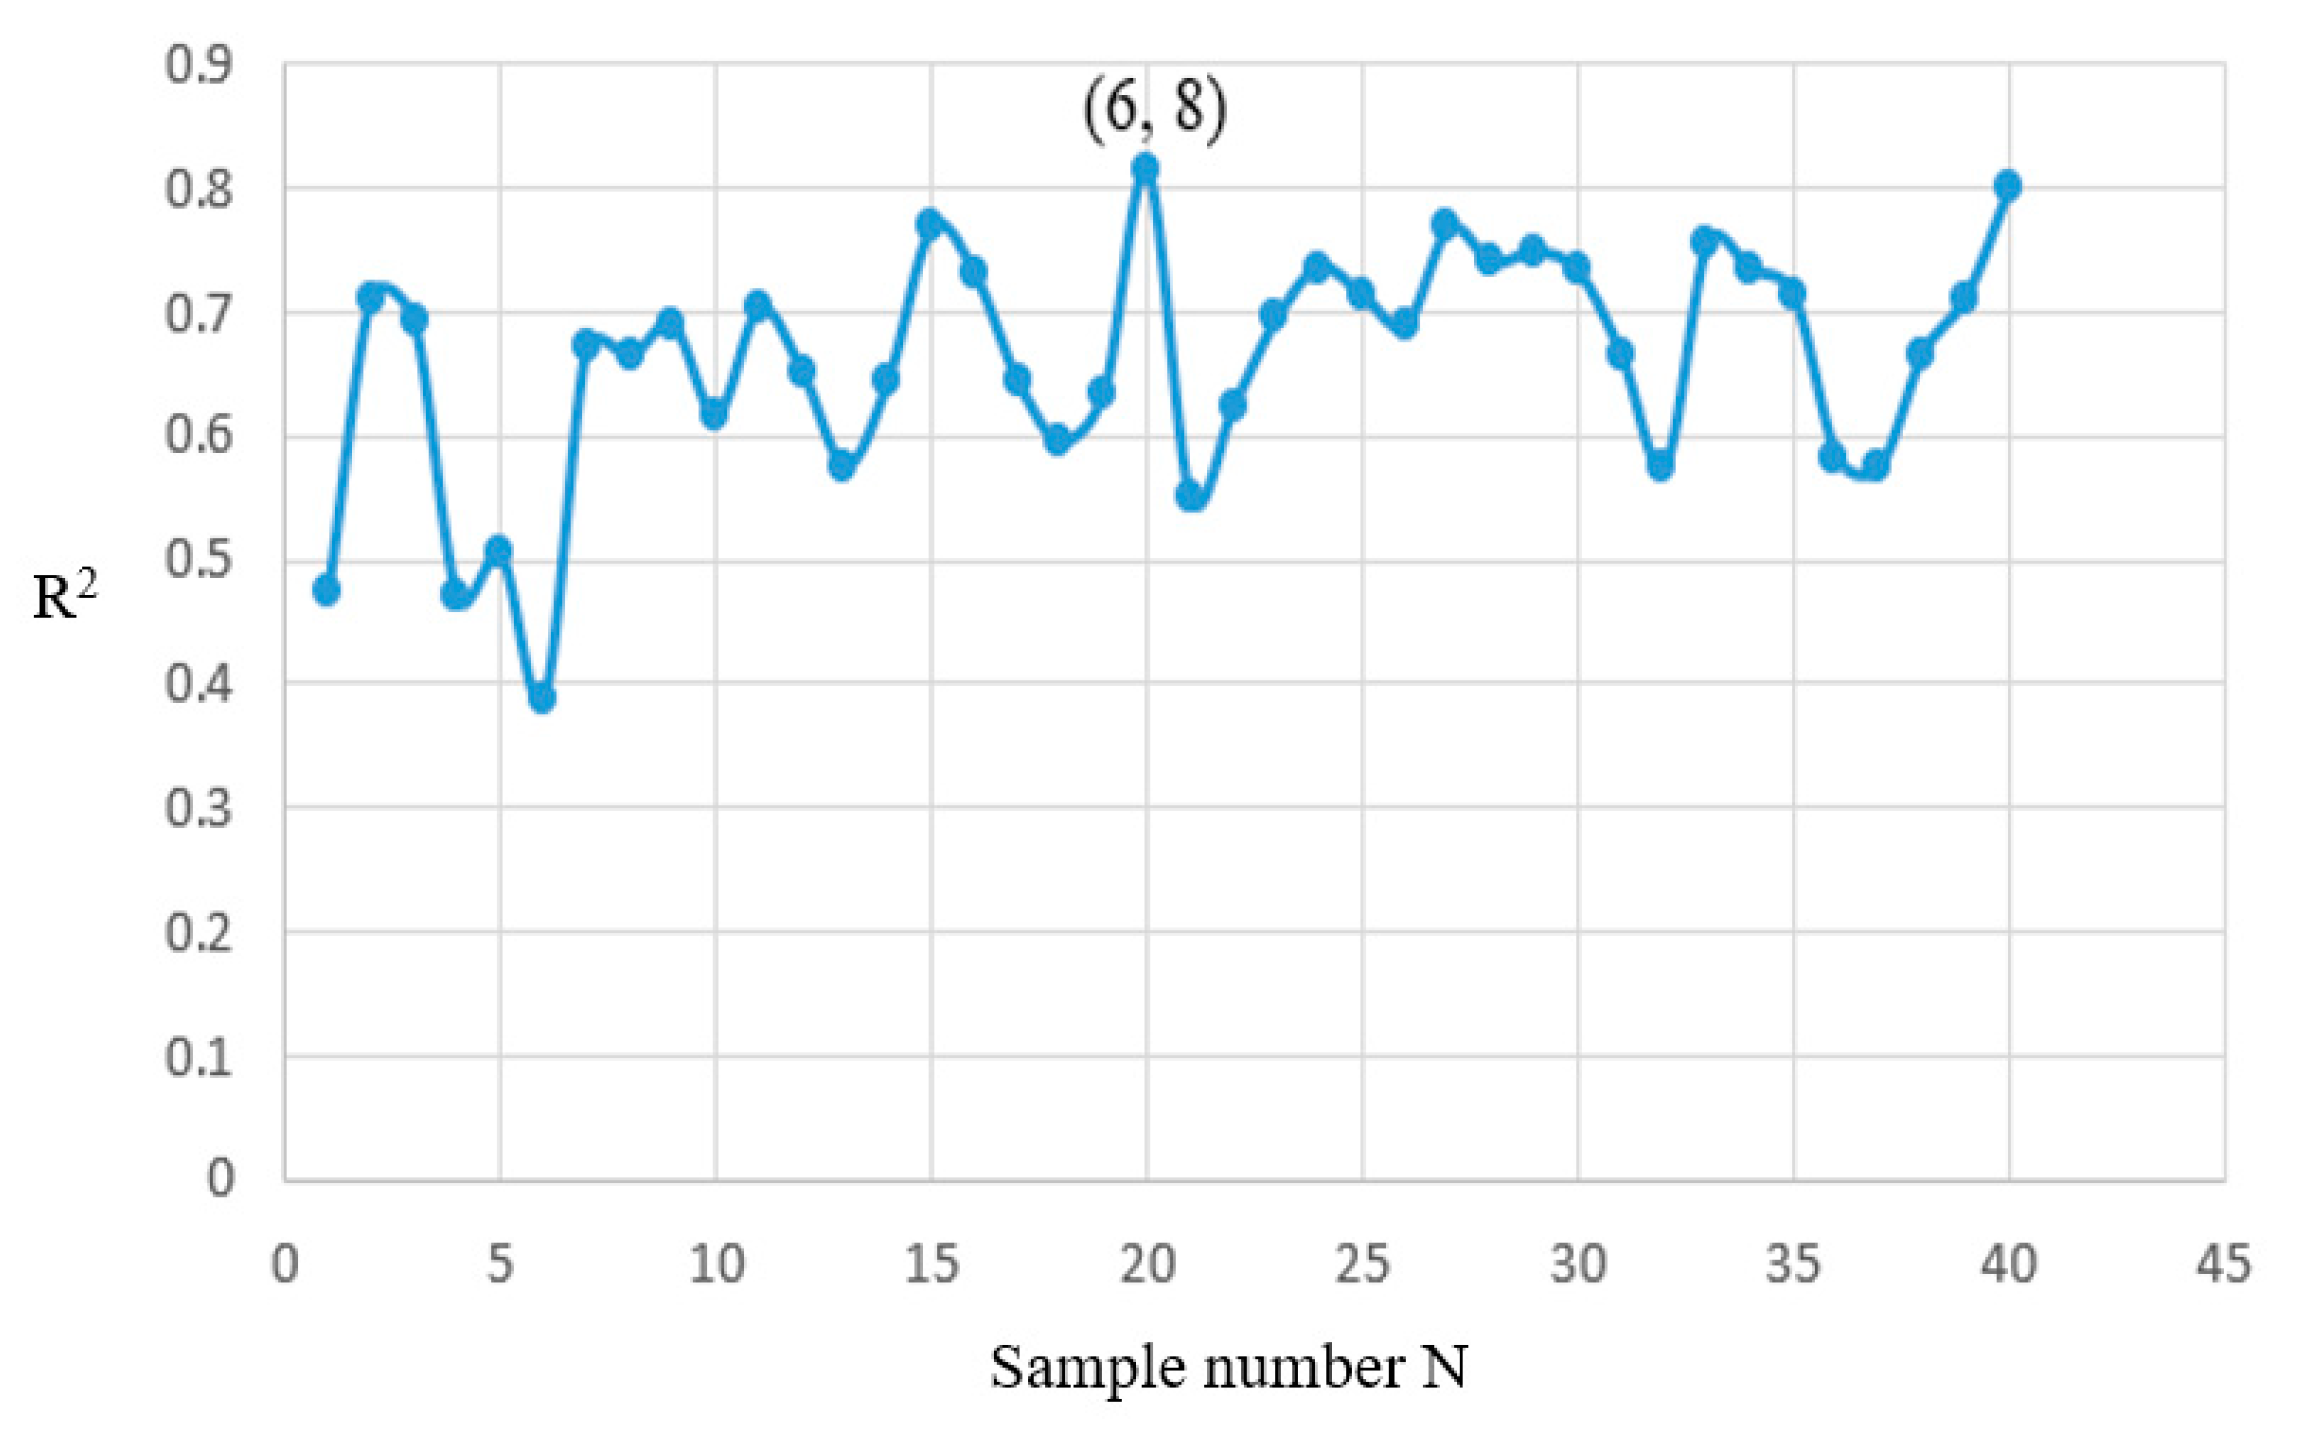
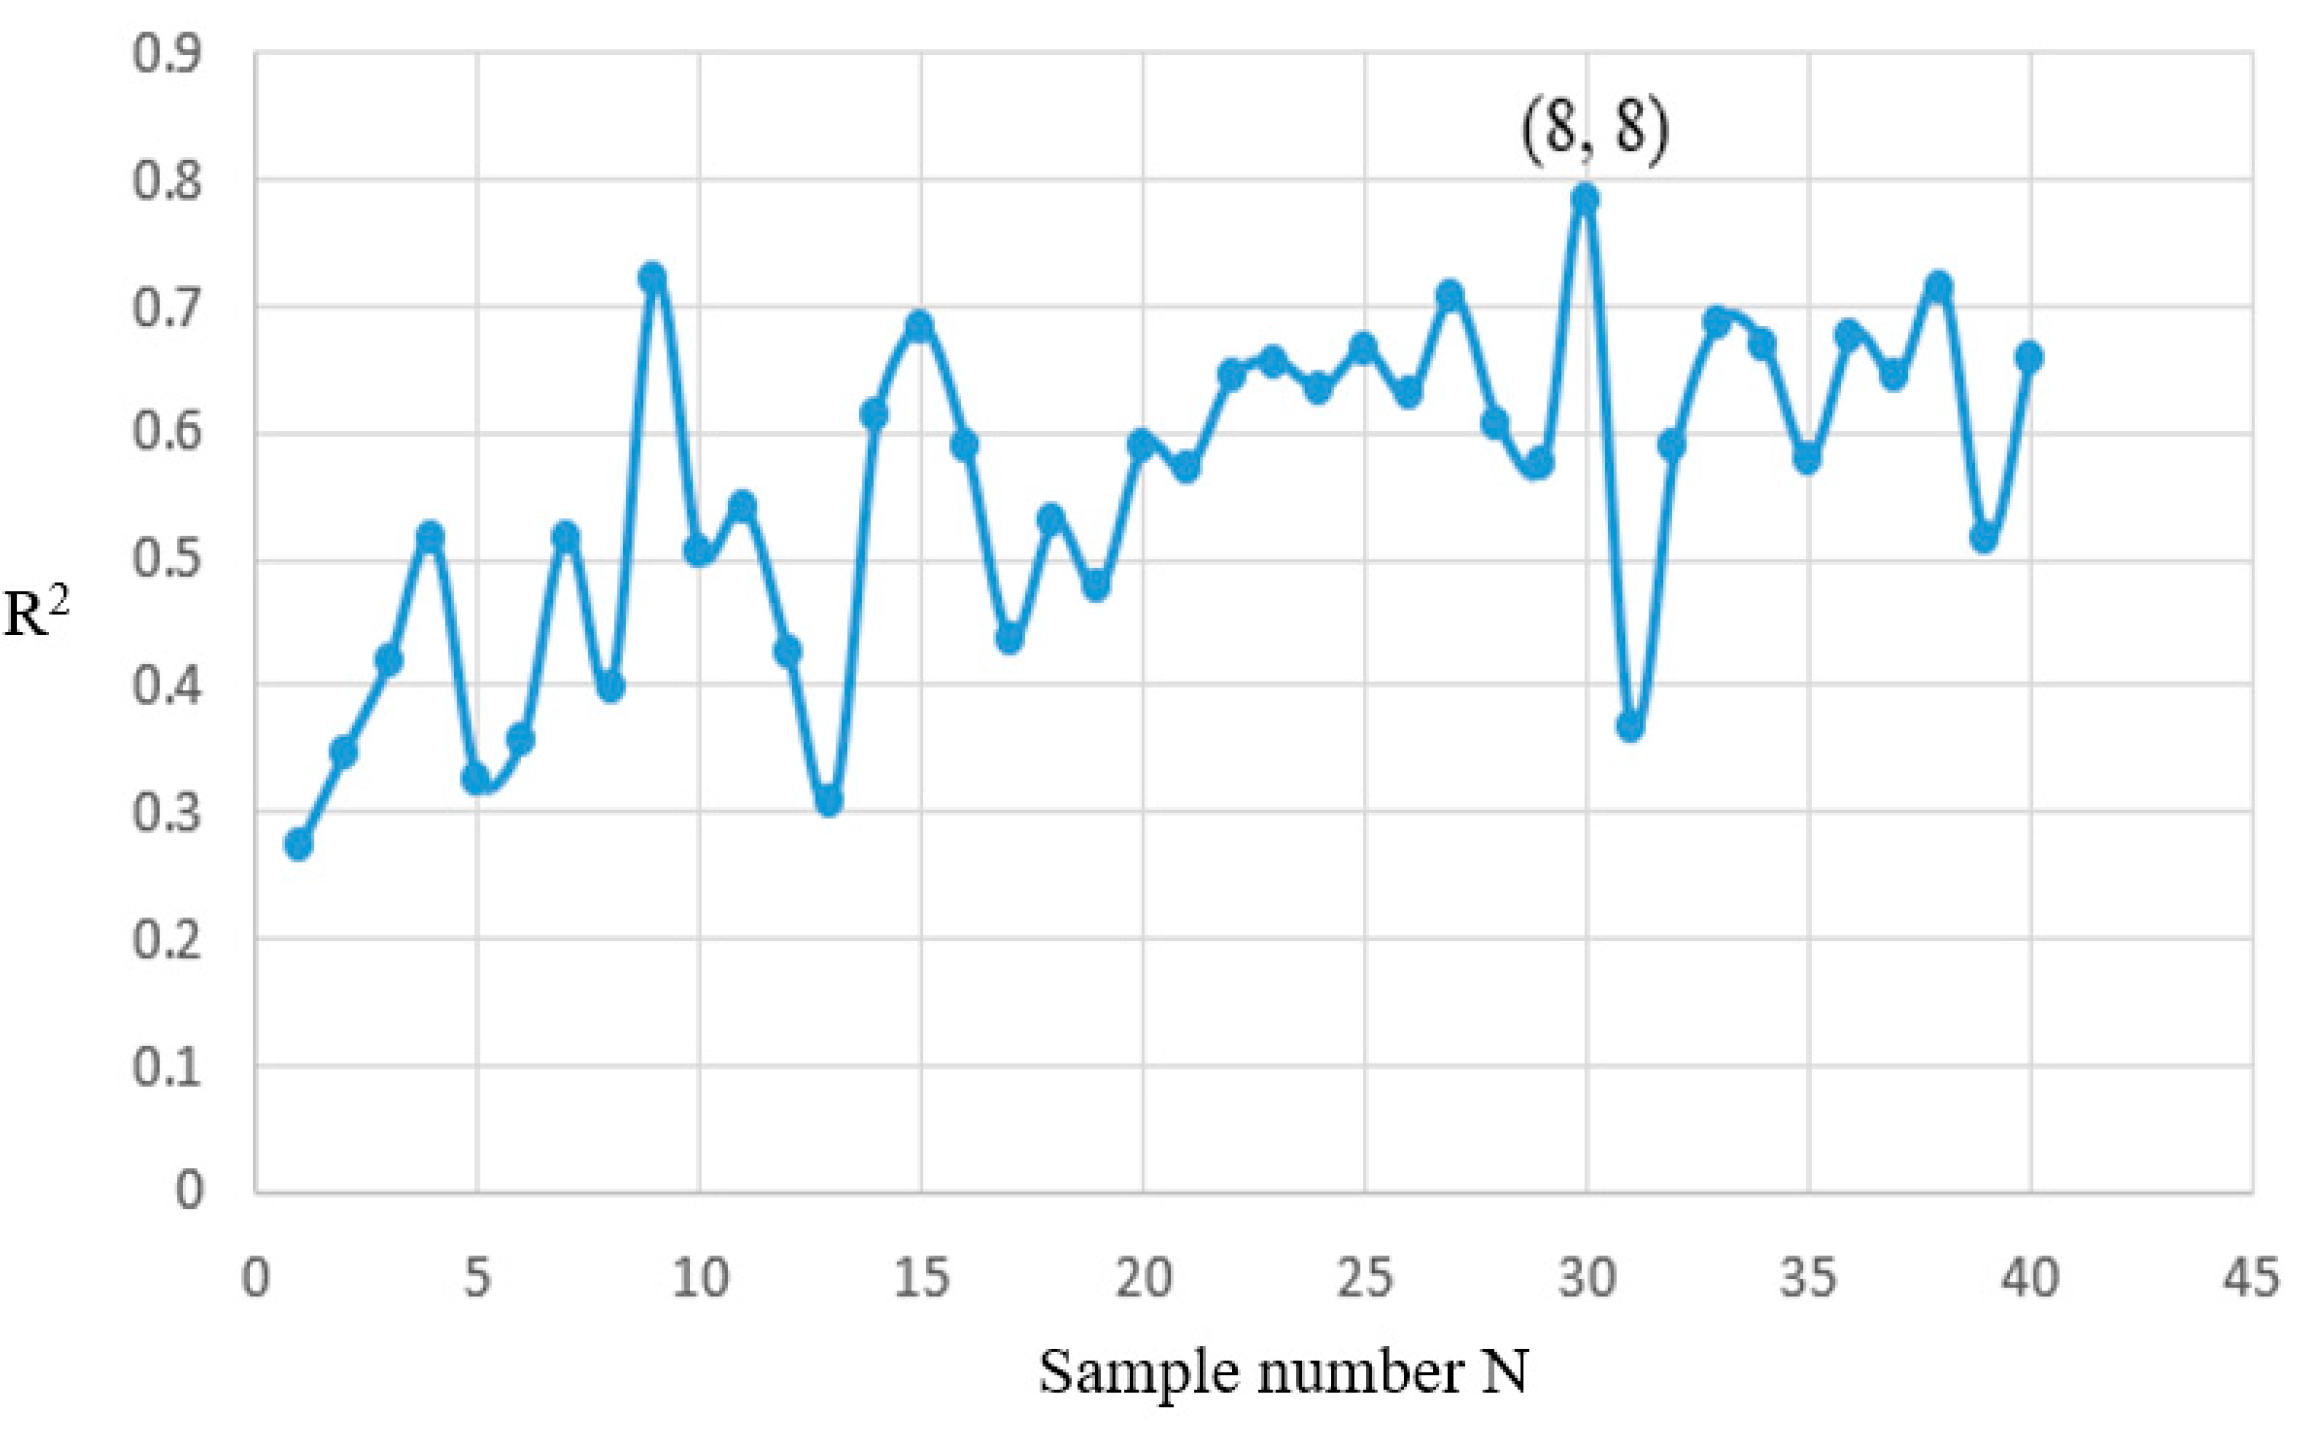
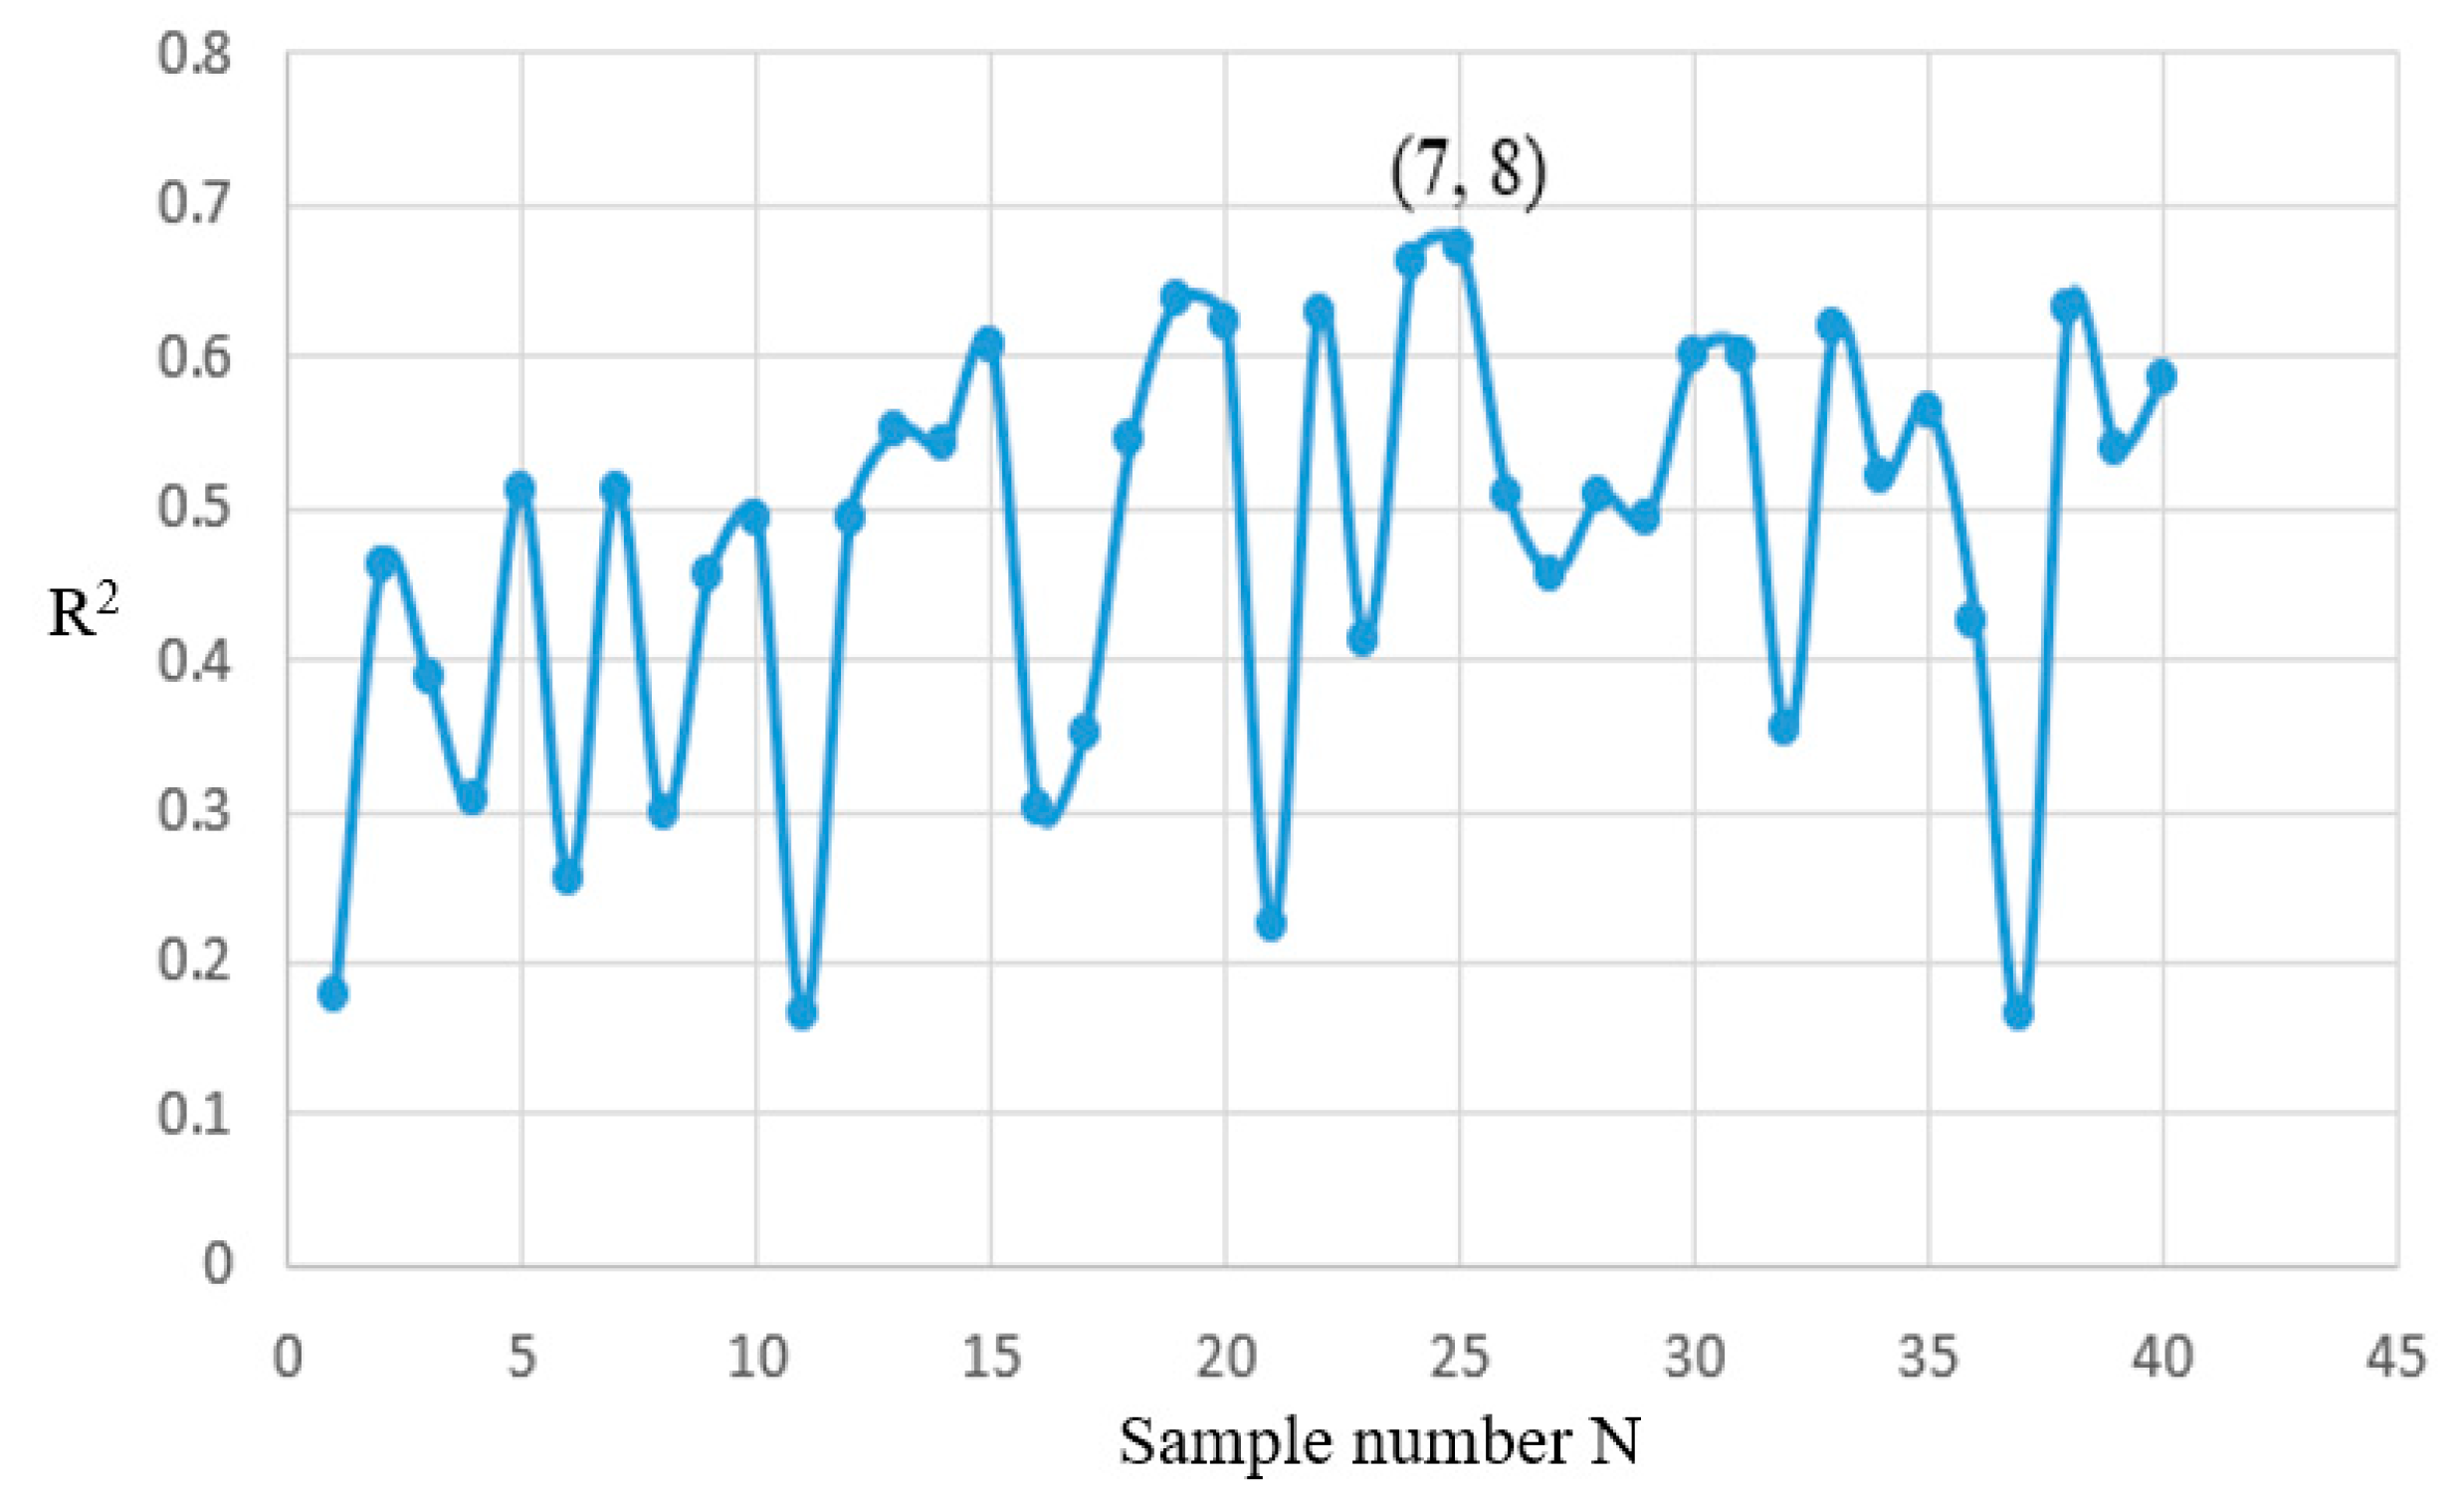
In our analysis, “max_ Depth” is varied across the values of [3,4,5,6,7,8,9,10], while “max_ Features“ is considered in the range of [4,5,6,7,8]. This results in 40 distinct combinations of parameter settings. We use five-fold cross-validation, R2 (coefficient of determination), to assess the predictive performance of the decision tree model. R2 is a statistical indicator used to measure the degree to which a regression model fits data. It represents the proportion of the variance in the dependent variable (target variable) that can be explained by the independent variable (feature variable). The R2 value ranges from 0 to 1, with a higher value indicating a better fit of the model to the data and a value closer to 0 indicating a poorer fit of the model. By comparison, the parameter combination that maximizes R2 is selected.
Figure 8, Figure 9 and Figure 10 show the R2 values corresponding to 40 parameter combinations and indicate the optimal max_ Features and max_ Depth values. The DTs generated based on the optimal parameter values are shown in Figure 11, Figure 12 and Figure 13.
The decision tree models that we have developed serve as potent and cost-effective tools for efficiently optimizing operational parameters. In the realm of GaAs growth, the quality of the crystal is contingent upon three equally vital factors: interface deflection, average interface gradient, and v/Gn. Lower values are indicative of higher quality. Consequently, optimizing GaAs growth constitutes a multi-objective optimization task. Unlike single-objective optimization, where objectives do not conflict, multi-objective optimization often presents internal conflicts among objectives. Improving one aspect may come at the expense of deteriorating others, complicating the search for a unique solution.
In our approach, higher importance means features closer to the tree’s root node. In order to ensure that the solution set remains non-empty in the subsequent multi-objective optimization stages, we expand the optimal parameter range obtained through single-objective optimization. When selecting the optimal parameter pathways for each target, we limit our search to the first three–four layers of the tree, disregarding the features on the lower branches.
We further refine our approach by comparing the values observed at the decision tree nodes (computed as averages of samples in the node) and selecting the four smallest target values, as detailed in Table 3, Table 4 and Table 5. Notably, during our search for the smallest average values in the P1 decision tree, we identify instances where smaller absolute values result from averaging larger positive and negative values, which we subsequently discard.
Our efforts culminated in identifying four favorable combinations for each target, totaling 64 combinations for P1, P3, and P4. After applying an intersection operation to these parameter values, we eliminate the combinations, resulting in empty sets, ultimately retaining 15 combinations. In order to arrive at the final selection, we employ a non-dominated sorting method based on the values for P1, P3, and P4. This method identifies two combinations with Pareto optimality, as showcased in Table 6.
4. Conclusions
In this study, 88 datasets obtained via CFD simulations were visually represented through a parallel co-ordinate system that enabled a comprehensive overview. This visualization was accompanied by an in-depth analysis of variable correlations using the Kendall, Pearson, and Spearman correlation coefficients. Subsequently, we evaluated the significance of process variables concerning three target variables. The results indicated that in the LEC growth of gallium arsenide, the main factor affecting interface deflection and average interface thermal gradients is the crucible rotation rate. For v/Gn, it is the pulling rate. In order to predict interface deflection, the average interface temperature gradient, and v/Gn, we opted for a DT model tailored to small sample sizes. By fine-tuning the model’s parameters, we achieved commendable predictive performance across all three targets. These outcomes furnish valuable insights into the GaAs crystal growth process, offering guidance and facilitating a deeper understanding.
Author Contributions
X.T.: Conceptualization, methodology, data generation, coding, writing—original draft. G.K.C.: DOE support, writing—review and editing. L.V.: Software, writing—review and editing; M.H.: Funding acquisition, writing—review and editing; N.D.: Conceptualization, methodology, resources, project administration, funding acquisition, writing—review and editing. All authors have read and agreed to the published version of the manuscript.
Funding
The research was partly funded by the German Research Foundation, project number: 467401796.
Data Availability Statement
Data available in a publicly accessible repository. The data presented in this study are openly available in the IKZ repository.
Acknowledgments
The proofreading of the article by Ta-Shun Chou is gratefully acknowledged.
Conflicts of Interest
The authors declare no conflict of interest.
Nomenclature
| crystal diameter (inch) | C1 |
| crystal length (mm) | C2 |
| crystal rotational rate (rpm) | C3 |
| pulling rate (mm/min) | C4 |
| crucible diameter (inch) | D1 |
| melt height (mm) | D2 |
| crucible rotational rate (rpm) | D3 |
| radiation screen material | S1 |
| distance between screen and melt surface (mm) | S2 |
| axial displacement of side heater (mm) | SH1 |
| height between crucible and bottom heater (mm) | SH2 |
| power of side heater (kW) | SH3 |
| distance between crucible and bottom heater (mm) | BH1 |
| interface deflection (mm) | P1 |
| average interface temperature gradient (K/cm) | P3 |
| v/Gn P4 (10−4(cm2/min K)) | P4 |
References
- Szweda, R. (Ed.) Gallium Arsenide, Electronics Materials and Devices. In A Strategic Study of Markets, Technologies and Companies Worldwide 1999–2004; Elsevier: Amsterdam, The Netherlands, 2000. [Google Scholar]
- Li, T.; Mastro, M.; Dadgar, A. (Eds.) III–V Compound Semiconductors: Integration with Silicon-Based Microelectronics; CRC Press: Boca Raton, FL, USA, 2010. [Google Scholar]
- Adachi, S. GaAs and Related Materials: Bulk Semiconducting and Superlattice Properties; World Scientific: Singapore, 1994; pp. 1–6. [Google Scholar]
- Howes, M.J.; Morgan, D.V. Gallium Arsenide: Materials, Devices, and Circuits; Wiley: Chichester, UK, 1985. [Google Scholar]
- Chang, C.Y.; Kai, F. GaAs High-Speed Devices: Physics, Technology, and Circuit Applications; John Wiley & Sons: Hoboken, NJ, USA, 1994. [Google Scholar]
- Willardson, R.K.; Beer, A.C. Semiconductors and Semimetals; Academic Press: Cambridge, MA, USA, 1977. [Google Scholar]
- Swaminathan, V.; Macrander, A.T. Materials Aspects of GaAs and InP Based Structures; Prentice-Hall, Inc.: Upper Saddle River, NJ, USA, 1991. [Google Scholar]
- Fornari, R. Improved crystal growth processes for high quality III–V substrates. Mater. Sci. Eng. B 1991, 9, 9–18. [Google Scholar] [CrossRef]
- Kulchitsky, N.A.; Naumov, A.V.; Startsev, V.V. Photonic and Terahertz applications as the next gallium arsenide market driver. Mod. Electron. Mater. 2020, 6, 77–84. [Google Scholar] [CrossRef]
- Kumar, J.; Subramanian, C. Liquid Encapsulated Czochralski Growth of Large size Gallium Arsenide and Indium Phosphide Single Crystals and their Characterisation—A Review. IETE J. Res. 1997, 43, 125–130. [Google Scholar] [CrossRef]
- Mil’vidskii, M.G.; Bochkarev, E.P. Creation of defects during the growth of semiconductor single crystals and films. J. Cryst. Growth 1978, 44, 61–74. [Google Scholar] [CrossRef]
- Jordan, A.; Caruso, R.; Von Neida, A.R. A thermoelastic analysis of dislocation generation in pulled GaAs crystals. Bell Syst. Tech. J. 1980, 59, 593–637. [Google Scholar] [CrossRef]
- Jordan, A.S. An evaluation of the thermal and elastic constants affecting GaAs crystal growth. J. Cryst. Growth 1980, 49, 631–642. [Google Scholar] [CrossRef]
- Frank-Rotsch, C.; Dropka, N.; Rotsch, P. Chapter 6: III-Arsenides. In Single Crystals of Electronic Materials: Growth and Properties; Fornari, R., Ed.; Woodhead Publishing Elsevier: Amsterdam, The Netherlands, 2018. [Google Scholar]
- Metz, E.P.A.; Miller, R.C.; Mazelsky, R. A technique for pulling single crystals of volatile materials. J. Appl. Phys. 1962, 33, 2016–2017. [Google Scholar] [CrossRef]
- Weiner, M.E.; Lassota, D.T.; Schwartz, B. Liquid encapsulated Czochralski growth of GaAs. J. Electrochem. Soc. 1971, 118, 301. [Google Scholar] [CrossRef]
- Mullin, J.B.; Macewan, W.R.; Holliday, C.H.; Webb AE, V. Pressure balancing: A technique for suppressing dissociation during the melt-growth of compounds. J. Cryst. Growth 1972, 13, 629–634. [Google Scholar] [CrossRef]
- Rudolph, P. (Ed.) Handbook of Crystal Growth: Bulk Crystal Growth; Elsevier: Amsterdam, The Netherlands, 2014. [Google Scholar]
- Hur, M.J.; Han, X.F.; Song, D.S.; Kim, T.H.; Lee, N.J.; Jeong, Y.J.; Yi, K.W. The influence of crucible and crystal rotation on the sapphire single crystal growth interface shape in a resistance heated Czochralski system. J. Cryst. Growth 2014, 385, 22–27. [Google Scholar] [CrossRef]
- Noghabi, O.A.; M’Hamdi, M.; Jomâa, M. Effect of crystal and crucible rotations on the interface shape of Czochralski grown silicon single crystals. J. Cryst. Growth 2011, 318, 173–177. [Google Scholar] [CrossRef]
- Böttcher, K.; Rudolph, P.; Neubert, M.; Kurz, M.; Pusztai, A.; Müller, G. Global temperature field simulation of the vapour pressure controlled Czochralski (VCZ) growth of 3 ″–4 ″gallium arsenide crystals. J. Cryst. Growth 1999, 198, 349–354. [Google Scholar] [CrossRef]
- Smirnova, O.V.; Durnev, N.V.; Shandrakova, K.E.; Mizitov, E.L.; Soklakov, V.D. Optimization of furnace design and growth parameters for Si Cz growth, using numerical simulation. J. Cryst. Growth 2008, 310, 2185–2191. [Google Scholar] [CrossRef]
- Kuroda, E.; Kozuka, H. Influence of growth conditions on melt interface temperature oscillations in silicon Czochralski growth. J. Cryst. Growth 1983, 63, 276–284. [Google Scholar] [CrossRef]
- Kalaev, V.V.; Evstratov, I.Y.; Makarov, Y.N. Gas flow effect on global heat transport and melt convection in Czochralski silicon growth. J. Cryst. Growth 2003, 249, 87–99. [Google Scholar] [CrossRef]
- Cho, H.J.; Lee, B.Y.; Lee, J.Y. The effects of several growth parameters on the formation behavior of point defects in Czochralski-grown silicon crystals. J. Cryst. Growth 2006, 292, 260–265. [Google Scholar] [CrossRef]
- Yi, K.W.; Chung, H.T.; Lee, H.W.; Yoon, J.K. The effects of pulling rates on the shape of crystal/melt interface in Si single crystal growth by the Czochralski method. J. Cryst. Growth 1993, 132, 451–460. [Google Scholar] [CrossRef]
- Qi, X.; Ma, W.; Dang, Y.; Su, W.; Liu, L. Optimization of the melt/crystal interface shape and oxygen concentration during the Czochralski silicon crystal growth process using an artificial neural network and a genetic algorithm. J. Cryst. Growth 2020, 548, 125828. [Google Scholar] [CrossRef]
- Tsunooka, Y.; Kokubo, N.; Hatasa, G.; Harada, S.; Tagawa, M.; Ujihara, T. High-speed prediction of computational fluid dynamics simulation in crystal growth. CrystEngComm 2018, 20, 6546–6550. [Google Scholar] [CrossRef]
- Zhang, J.; Tang, Q.; Liu, D. Research into the LSTM neural network-based crystal growth process model identification. IEEE Trans. Semicond. Manuf. 2019, 32, 220–225. [Google Scholar] [CrossRef]
- Dropka, N.; Holena, M. Application of artificial neural networks in crystal growth of electronic and opto-electronic materials. Crystals 2020, 10, 663. [Google Scholar] [CrossRef]
- Dropka, N.; Holena, M.; Thieme, C.; Chou, T. Development of the VGF crystal growth recipe: Intelligent solutions of ill-posed inverse problems using images and numerical data. Cryst. Res. Technol. 2023, 58, 2300125. [Google Scholar] [CrossRef]
- Dropka, N.; Böttcher, K.; Holena, M. Development and Optimization of VGF-GaAs Crystal Growth Process Using Data Mining and Machine Learning Techniques. Crystals 2021, 11, 1218. [Google Scholar] [CrossRef]
- Dropka, N.; Tang, X.; Chappa, G.K.; Holena, M. Smart Design of Cz-Ge Crystal Growth Furnace and Process. Crystals 2022, 12, 1764. [Google Scholar] [CrossRef]
- Chou, T.S.; Anooz, S.B.; Grueneberg, R.; Dropka, N.; Miller, W.; Tran, T.T.V.; Rehm, J.; Albrecht, M.; Popp, A. Machine learning supported analysis of MOVPE grown β-Ga2O3 thin films on sapphire. J. Cryst. Growth 2022, 592, 126737. [Google Scholar] [CrossRef]
- Breiman, L. Random forests. Mach. Learn. 2001, 45, 5–32. [Google Scholar] [CrossRef]
- The Mathematics of Decision Trees, Random Forest and Feature Importance in Scikit-learn and Spark. Available online: https://towardsdatascience.com/the-mathematics-of-decision-trees-random-forest-and-feature-importance-in-scikit-learn-and-spark-f2861df67e3 (accessed on 1 September 2023).
- Tower, J.P.; Tobin, R.; Pearah, P.J.; Ware, R.M. Interface shape and crystallinity in LEC GaAs. J. Cryst. Growth 1991, 114, 665–675. [Google Scholar] [CrossRef]
- Rudolph, P. Fundamentals and engineering of defects. Prog. Cryst. Growth Charact. Mater. 2016, 62, 89–110. [Google Scholar] [CrossRef]
- Kiessling, F.M. Characterization and control of defects in VCz GaAs crystals grown without B2O3 encapsulant. In Crystal Growth Technology: Semiconductors and Dielectrics; Wiley: Hoboken, NJ, USA, 2010; pp. 75–95. [Google Scholar]
Figure 1.
DT model.

Figure 2.
(a) A definition of the geometric and process parameters in LEC-GaAs growth: C1, crystal radius; C2, crystal length; D1, crucible radius; SH1, distance between crucible and side heater; C4, pulling rate; BH1, distance between crucible and bottom heater; SH2, axial displacement of side heater; C3, crystal rotational rate; D3, crucible rotational rate; S2, distance from the radiation screen to the melt; D2, melt height; (b) definition and a sign of interface deflection P1.

Figure 3.
Data are shown in a parallel co-ordinate system. The line color matches the value of (a) the interface deflection P1(mm) and (b) v/Gn P4(10−4(cm2/min K)).
Figure 3.
Data are shown in a parallel co-ordinate system. The line color matches the value of (a) the interface deflection P1(mm) and (b) v/Gn P4(10−4(cm2/min K)).


Figure 4.
Kendall, Pearson, and Spearman correlation coefficients between inputs and (a) output parameter P1, (b) output parameter P3, and (c) output parameter P4.
Figure 4.
Kendall, Pearson, and Spearman correlation coefficients between inputs and (a) output parameter P1, (b) output parameter P3, and (c) output parameter P4.

Figure 5.
The relative importance of the individual considered inputs for interface deflection P1.

Figure 6.
The relative importance of the individual considered inputs for the average interface temperature gradient P3.
Figure 6.
The relative importance of the individual considered inputs for the average interface temperature gradient P3.

Figure 7.
The relative importance of the individual considered inputs for v/Gn P4.

Figure 8.
Parameter regulation of regression tree for P1.

Figure 9.
Parameter regulation of regression tree for P3.

Figure 10.
Parameter regulation of regression tree for P4.

Figure 11.
Regression tree analyzing interface deflection P1 (mm).

Figure 12.
Regression tree analyzing the average interface temperature gradient P3 (K/cm).

Figure 13.
Regression tree analyzing v/Gn P4(10−4 (cm2/min K)).


Table 1.
Material properties of GaAs melt, crystal, and B2O3 encapsulant.
| Parameter (Unit) | Value |
|---|---|
| GaAs melt | |
| Viscosity (kg (m s)−1) | 0.00279 |
| Density (kg m−3) | 5725 |
| Thermal conductivity (W (m K)−1) | 17.8 |
| Specific heat (J (kg K)−1) | 434 |
| Melting temperature (K) | 1511 |
| Heat of fusion (kJ kg−1) | 668.5 |
| Emissivity (−) | 0.55 |
| GaAs crystal | |
| Density (kg m−3) | 5170 |
| Thermal conductivity (W (m K)−1) | 7.2 at 1511 K |
| Specific heat (J (kg K)−1) | 424 |
| Emissivity (−) | 0.55 |
| B2O3 encapsulant | |
| Thermal conductivity (W (m K)−1) | 4 |
| Emissivity (−) | 0.75 |
| Density (kg m−3) | 1506 at 1496 K |
| Specific heat (J (kg K)−1) | 1830 |
| Viscosity (kg (m s)−1) | 3.73 |
Table 2.
Range of process parameters.
| Parameter (Unit) | Value |
|---|---|
| Pulling rate (mm h–1) | 5–15 |
| Crystal rotation rate (rpm) | 5–30 |
| Crucible counter rotation rate (rpm) | 0–20 |
| Side power (kW) | 1–20 |
Table 3.
The most promising input values for P1.
| P1 | Decisive Inputs | |||
|---|---|---|---|---|
| −3.25 | D3 ≤ −9 | SH3 ≤ 7 | 33 < S2 | SH1 ≤ 35 |
| 1.85 | −9 < D3 | S2 ≤ 43 | D2 ≤ 59 | 35 < SH1 |
| −1.08 | −9 < D3 | S2 ≤ 43 | 59 < D2 | D3 ≤ −4 |
| 1 | −9 < D3 | 43 < S2 | BH1 ≤ 106 | C3 ≤ 20 |
Table 4.
The most promising input values for P3.
| P3 | Decisive Inputs | ||
|---|---|---|---|
| 56.65 | D3 ≤ −9 | BH1 ≤ 80 | SH2 ≤ 104 |
| 68.389 | D3 ≤ −9 | BH1 ≤ 80 | 104 < SH2 |
| 66.789 | D3 ≤ −9 | 80 < BH1 | SH2 ≤ 120.5 |
| −69.243 | −9 < D3 | D1 ≤ 25 | C3 ≤ 17.5 |
Table 5.
The most promising input values for P4.
| P4 | Decisive Inputs | |||
|---|---|---|---|---|
| 0.604 | D1 ≤ 35 | C4 ≤ 12 | −13.5 ≤ D3 | C4 ≤ 6 |
| 1.02 | 35 < D1 | S1 = 1 | SH2 ≤ 87.5 | 61 < D2 |
| 1.14 | 35 < D1 | S1 = 1 | 87.5 < SH2 | C4 ≤ 7 |
| 0.934 | 35 ≤ D1 | S1 = 2, 3 | 11 ≤ C3 | C4 ≤ 10 |
Disclaimer/Publisher’s Note: The statements, opinions and data contained in all publications are solely those of the individual author(s) and contributor(s) and not of MDPI and/or the editor(s). MDPI and/or the editor(s) disclaim responsibility for any injury to people or property resulting from any ideas, methods, instructions or products referred to in the content. |
© 2023 by the authors. Licensee MDPI, Basel, Switzerland. This article is an open access article distributed under the terms and conditions of the Creative Commons Attribution (CC BY) license (https://creativecommons.org/licenses/by/4.0/).
Share and Cite
MDPI and ACS Style
Tang, X.; Chappa, G.K.; Vieira, L.; Holena, M.; Dropka, N. Decision Tree-Supported Analysis of Gallium Arsenide Growth Using the LEC Method. Crystals 2023, 13, 1659. https://doi.org/10.3390/cryst13121659
AMA Style
Tang X, Chappa GK, Vieira L, Holena M, Dropka N. Decision Tree-Supported Analysis of Gallium Arsenide Growth Using the LEC Method. Crystals. 2023; 13(12):1659. https://doi.org/10.3390/cryst13121659
Chicago/Turabian StyleTang, Xia, Gagan Kumar Chappa, Lucas Vieira, Martin Holena, and Natasha Dropka. 2023. "Decision Tree-Supported Analysis of Gallium Arsenide Growth Using the LEC Method" Crystals 13, no. 12: 1659. https://doi.org/10.3390/cryst13121659
Note that from the first issue of 2016, this journal uses article numbers instead of page numbers. See further details here.