1. Introduction
The CuO–TiO
2 heterogeneous films with a p–n heterojunction have attracted the attention of the scientific community as promising materials with a high application potential in gas sensing [
1,
2,
3,
4,
5], and also in technologies of semiconductor photocatalysis [
6,
7] or lithium-ion batteries [
8]. The advantages of using a two-metal-oxide compound lie in its nontoxicity, chemical stability, low market price, and high absorption coefficients [
9]. Specifically, for the gas sensing, CuO–TiO
2 combines the distinct advantages of the first CuO monometallic oxide, such as a low bandgap [
10], with the high reactivity of the second TiO
2 monometallic counterpart [
11]. Various physical and chemical methods have been used for the synthesis of the CuO–TiO
2 systems prepared in different forms (as nanocomposite alloys or thin multilayered films), e.g., chemical vapor deposition [
12], a combination of electrospinning and hydrothermal processes [
13], magnetron sputtering [
14], thermal evaporation and oxidation [
15], and some other techniques [
16]. Furthermore, it has been shown that the performance of the chemiresistive gas sensors can also be directly influenced in several other ways, for instance, by a proper morphology of the semiconductor oxide films (including zero-dimensional to three-dimensional structures) [
17]; surface modification, which can be tunable for specific applications [
18]; and also by doping (incorporation) with certain species (alkali or noble metals), such as gas sensors combined with Au [
19] and Pt nanoparticles, improving the charge carrier separation, with beneficial effects on sensitivity response time and operational temperature [
20,
21]. In this work, we have used a combined method consisting of low-energy Ar
+ ion beam sputtering (IBS) and subsequent thermal annealing in air.
Nitrogen dioxide (NO
2) represents an oxidizing corrosive gas that is potentially dangerous for humans even at relatively low concentrations. It is particularly urgent to develop high-performance sensors with a fast selectivity and response. Another oxidizing gas widely used in technologies is ozone (O
3) [
22,
23], which can also be dangerous; therefore, it is necessary to monitor its concentration in the surrounding atmosphere. Chlorine (Cl
2) also represents a hazardous gas that can affect the human body in various ways, such as causing skin infections or liver tumors [
24,
25].
So far, several types of semiconductor metal-oxide sensors for the detection and monitoring of NO
2, O
3, and Cl
2 gases have been proposed [
26,
27]. Their common sensing mechanism is based on the change in the electrical conductivity during the adsorption/desorption of the gas molecules on the sensitive films. However, mono-metal-oxide sensors usually do not exhibit superior gas selectivity and require high temperatures for maintenance (e.g., rapid desorption of the adsorbed molecules). On the other hand, as has been confirmed [
9,
13], the performance of the sensors can be greatly enhanced using heterogeneous nanomaterials, where p- and n-type metal oxides are combined and form efficient p-to-n transition sensing chemiresistors. In this class of sensors, the n–p heterojunctions are based on the electrical contact of the n-type (e.g., SnO
2, TiO
2, WO
3, MoO
3, Nb
2O
5, ZnO) and p-type (CuO, Co
3O
4, Cr
2O
3, NiO, PdO, etc) nanomaterials. A number of studies have shown that such sensors can be highly sensitive to both reducing gas (H
2, H
2S, CO, CH
4, NH
3, etc.) [
28,
29,
30,
31] as well as oxidizing gas (NO
2, NO, O
3, SO
2, etc.) [
32].
Recently, attention also has been paid to alkali metal doping, which has been confirmed to be responsible for a significant modification of the properties of heterojunctions [
33]. The oxidic materials doped with lithium ions found a broad application area in batteries and energy storage, but their gas-sensing properties have only been researched in a few studies. In general, it was observed that Li has a great effect on the structure and properties of the doped materials. For instance, a strong correlation was confirmed between the lithium content and (i) microstructure morphology [
34], (ii) electrical parameters (resistivity, bandgap, and electrical stability) [
35], and (iii) optical properties [
34,
35] of metal oxides. Interestingly, it was observed that lithium tends to occupy the structural defects, and it tends to segregate and accumulate with higher concentrations on the surface of the metal oxide films [
36]. The high diffusivity and interactivity of lithium make it possible, in principle, to modify the electrical properties of nanostructures, which are used for gas sensors. For instance, in the work developed by Zhao et al. [
37], it was demonstrated how to improve the performance of the metal oxide nanoparticles by Li doping. The presence of Li was shown to increase both the concentration of the oxygen vacancy and oxygen interstitial, which led to a higher sensitivity of the sensors.
A basic study of the sensing properties of the materials (closely related to the systems inspected in this paper), i.e., ilmenite-type cobalt titanates doped with various metal cations (2% Li, Na, K, Sb, La, Sm, Gd, Ho, and Pb), was reported in [
38,
39]. The authors tested the sensitivity and selectivity to ethanol vapors and propane and concluded that Li-doped cobalt titanates behave like p-type semiconductors and show the best results of all the above-mentioned cations. It was also demonstrated that CoTiO
3: Li is very suitable for chemiresistors operated at relatively low temperatures of 300–450 °C. In another study, Li
+-doped ZrTiO
4 was shown to work as an effective air humidity sensor [
40]. It was found that the small addition of Li ions increases the sensitivity of the composite by two orders of magnitude; it also increases its conductivity, and enables the sensors to operate at room temperature. However, the observed improvement in sensor performance by lithium doping is not yet well understood. An attempt to interpret the enhanced gas-sensing properties of the lithium-doped oxides is reported in [
38], where, after the addition of lithium, both the conductivity and gas sensing parameters of the ZnO improved. This was explained by the particular role of the Li
+ ions, which stimulated the occurrence of the oxygen interstitials and vacancies that play a key role in the formation of active sites.
To the best of our knowledge, there are currently no studies on the gas-sensing performance of the heterogeneous Li-doped CuO–TiO2 systems. This work, therefore, deals with the question of what effect Li has on the sensor properties of CuO–TiO2 at different concentrations, and what is the driving force behind it. The sensing efficiency was tested for both oxidizing (NO2, O3, and Cl2) and reducing (H2) gases. The expectation was that this work would be a tool to shed more light on this issue.
3. Results and Discussion
The preparation of the CuO–TiO2–Li composites with active heterojunctions requires an effective homogeneous mixing of phases. In the first step of the composite synthesis (by IBS), tens of repeated multilayers (Cu/Ti/Li) are formed, which in the second step (by annealing in the flowing air) intertwine and interact with oxygen to form oxides of building elements. In this step, it is important that the formation of inappropriate oxides (e.g., Cu2O) and spatial separations of phases do not occur. Therefore, it was necessary to choose and optimize a procedure that would limit these two aspects as much as possible. In the experiment, in addition, to monitor the synthesis of mixed phases, it was also needed to control their spatial separation. For this purpose, the samples were inspected before and after annealing and for each sample with a different Li content, to assess the spatial distribution of elements and corresponding phases and to assess their effect on the sensing properties of the composites. The main results of the study, obtained by several complementary methods, are discussed below.
3.1. AFM Analysis
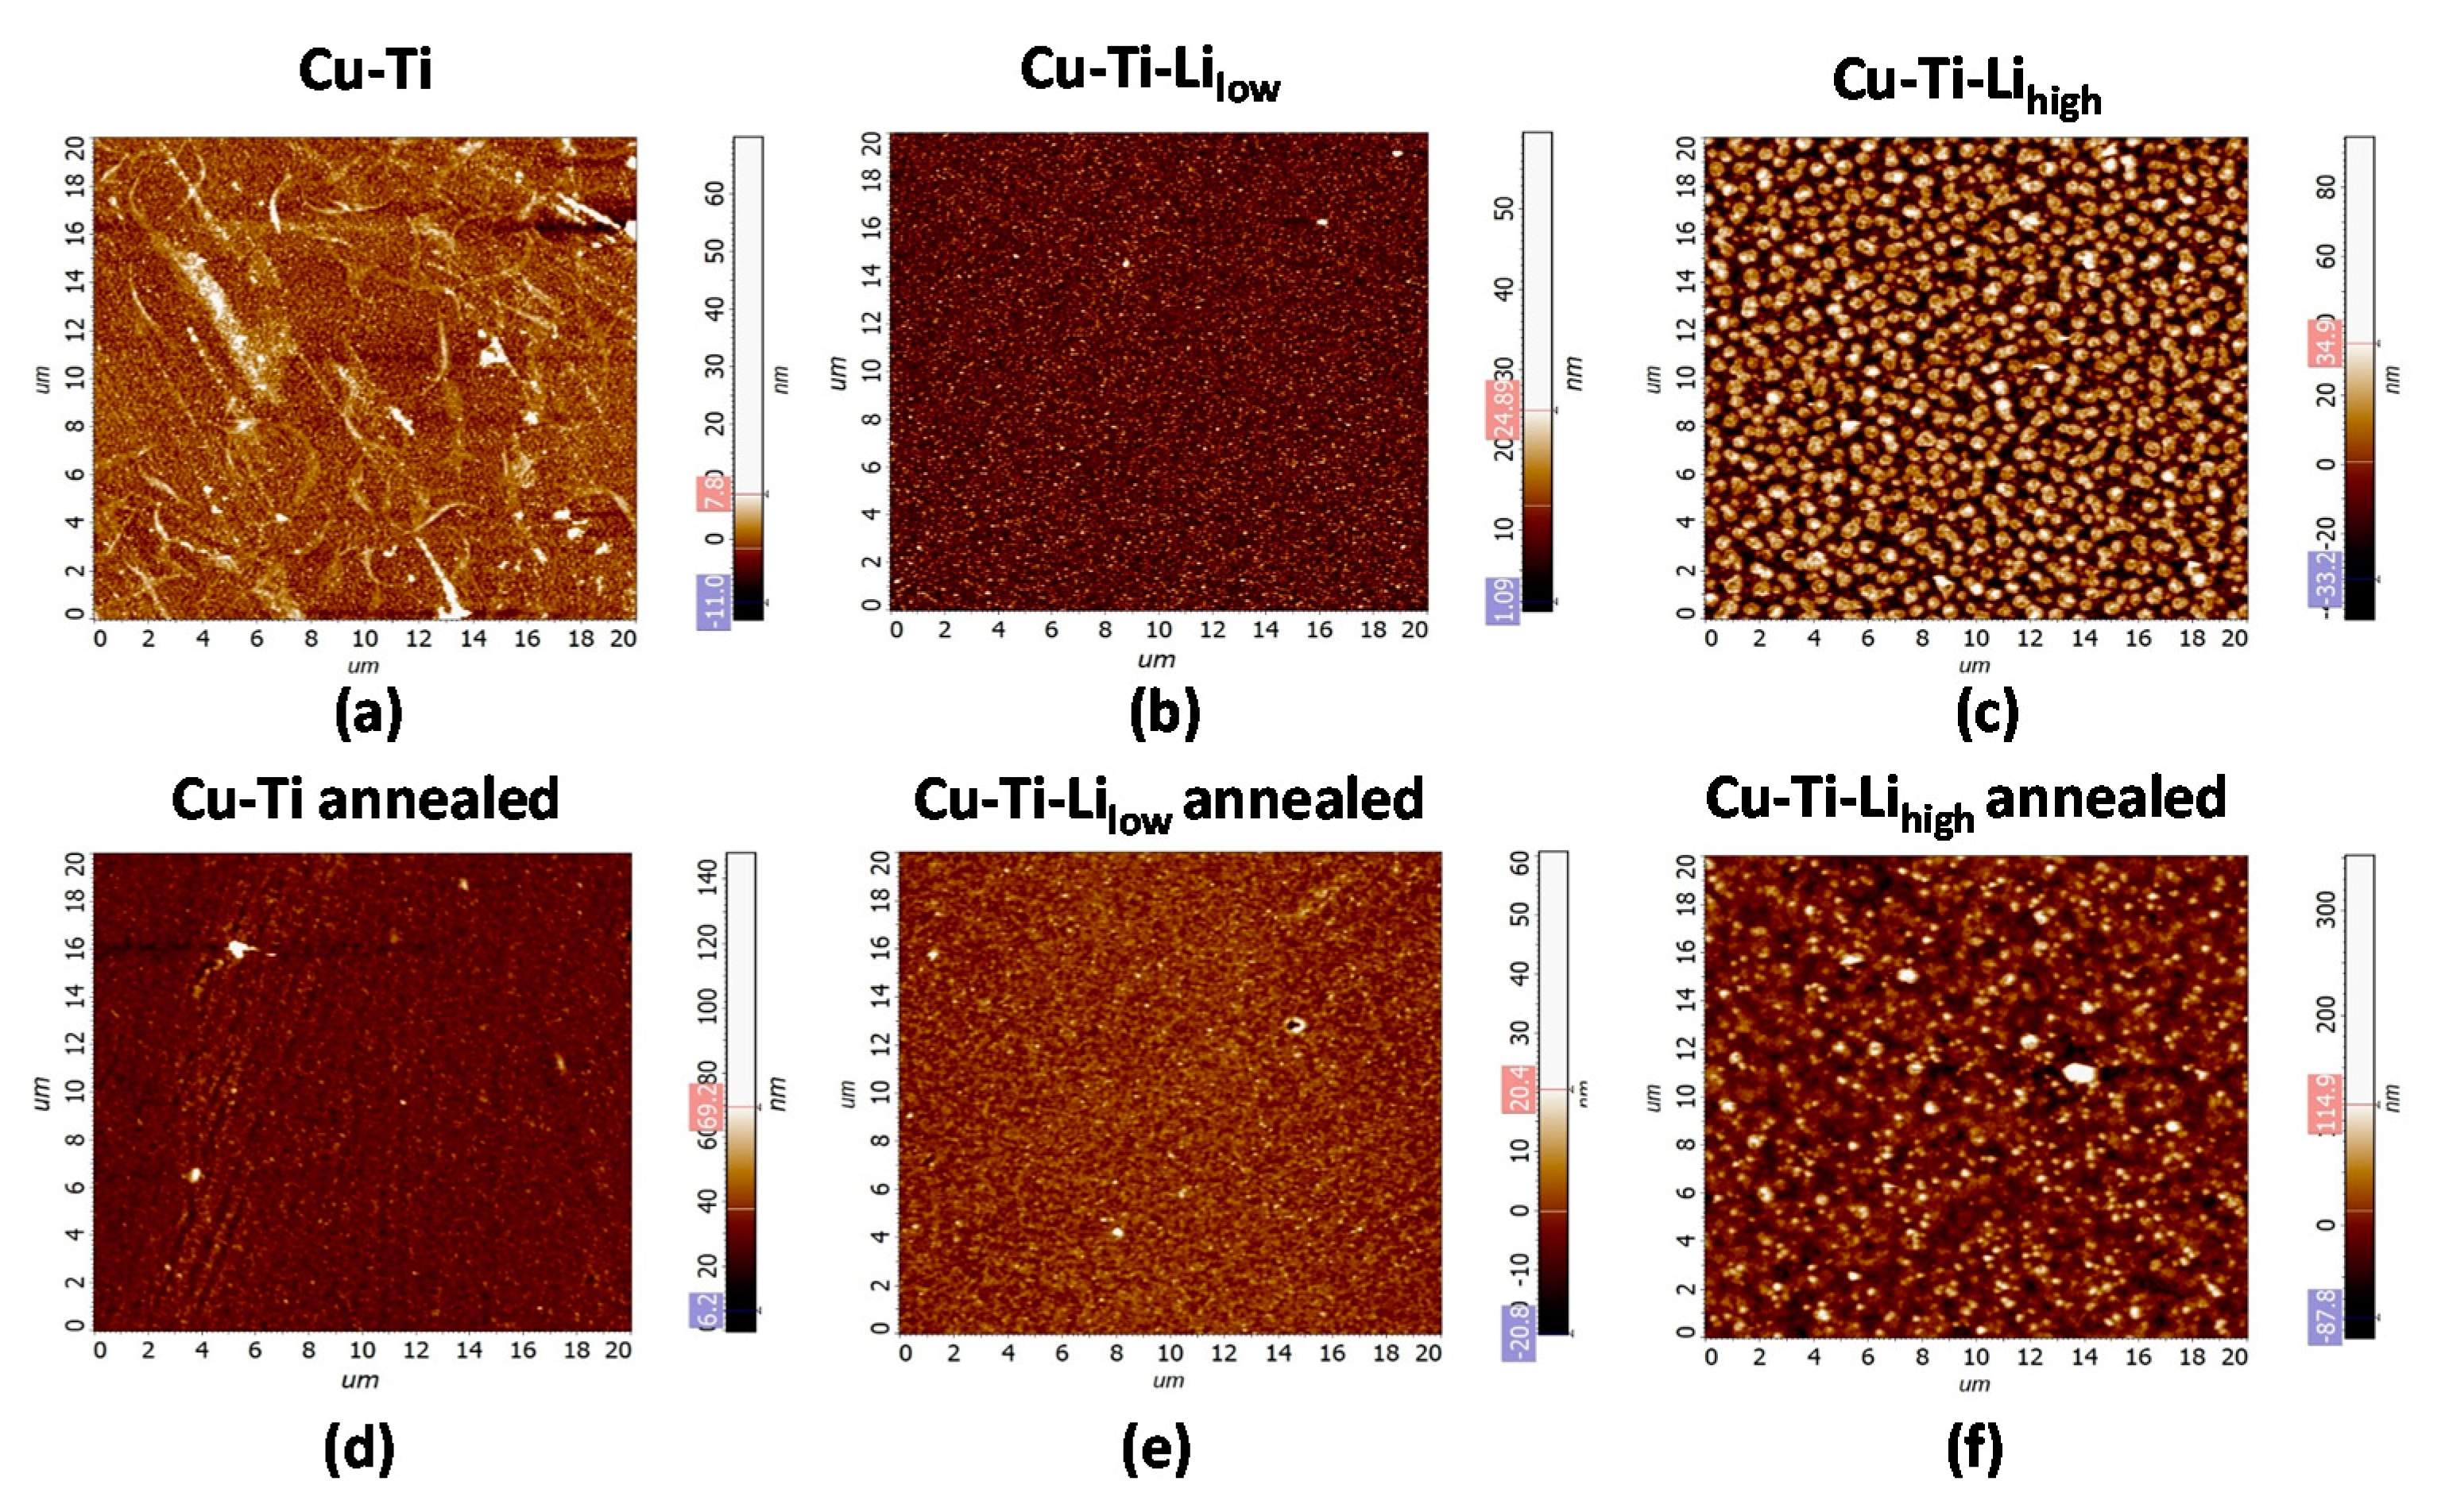
Figure 2 shows the surface morphology (measured on a scanning area of 20 × 20 μm
2) of the composites for different Li contents before (a–c) and after (e–d) annealing. The AFM micrographs indicate significant changes in the morphology observed after annealing (due to the phase mixing), but also before annealing (after deposition, due to the incorporation of lithium). If the data are compared with the results of AFM performed on the CuO–TiO
2 composite prepared without the Li addition [
4,
5], one can point out the strong effect that lithium has on the morphology of the samples.
Depending on the increasing Li concentration, a dramatic evolution of morphology can be observed. Without Li, the surface of the sample is finely granular (with only a few signs of depressions), with densely packed nanoparticles (NPs, about 30 per μm2) and a low roughness (corresponding to a low value of the relative surface area Sr/Sp = 0.203%, where Sr = 400.986 μm2 is a real surface area, and Sp = 400.173 μm2 a projected area, the same for all measurements). After annealing, the granular morphology with about the same NP density remains; however, the surface roughness increased by almost 70% () and the relative surface area more than twice (Sr/Sp = 0.476%; Sr = 402.078 μm2). For the sample with a low content of Li, the surface still appears to be uniformly granular with a density of NPs of about 25 per μm2 (, and Sr/Sp = 0.470%; Sr = 402.054 μm2). However, after annealing the growing interconnections of the NPs into planar domains of different sizes (<1 μm) and shapes, leading to their density of about 5–10 per μm2, a slightly lower (~6%) surface roughness () was seen, and Sr/Sp = 0.349% (Sr = 401.573 μm2). Samples with a high content of Li changed their granular morphology dramatically into round domains (with a chimney-like shape) with a height up to 100 nm and a density of about 5 per μm2, a high surface roughness () and also Sr/Sp = 2.692% (Sr = 410.947 μm2). After annealing, the domains joined/coalesced and formed interconnected objects of irregular shapes, with a density <0.5 per μm2 and height up to several hundreds of nm, leading to an extreme surface roughness () and Sr/Sp = 6.550% (Sr = 426.385 μm2).
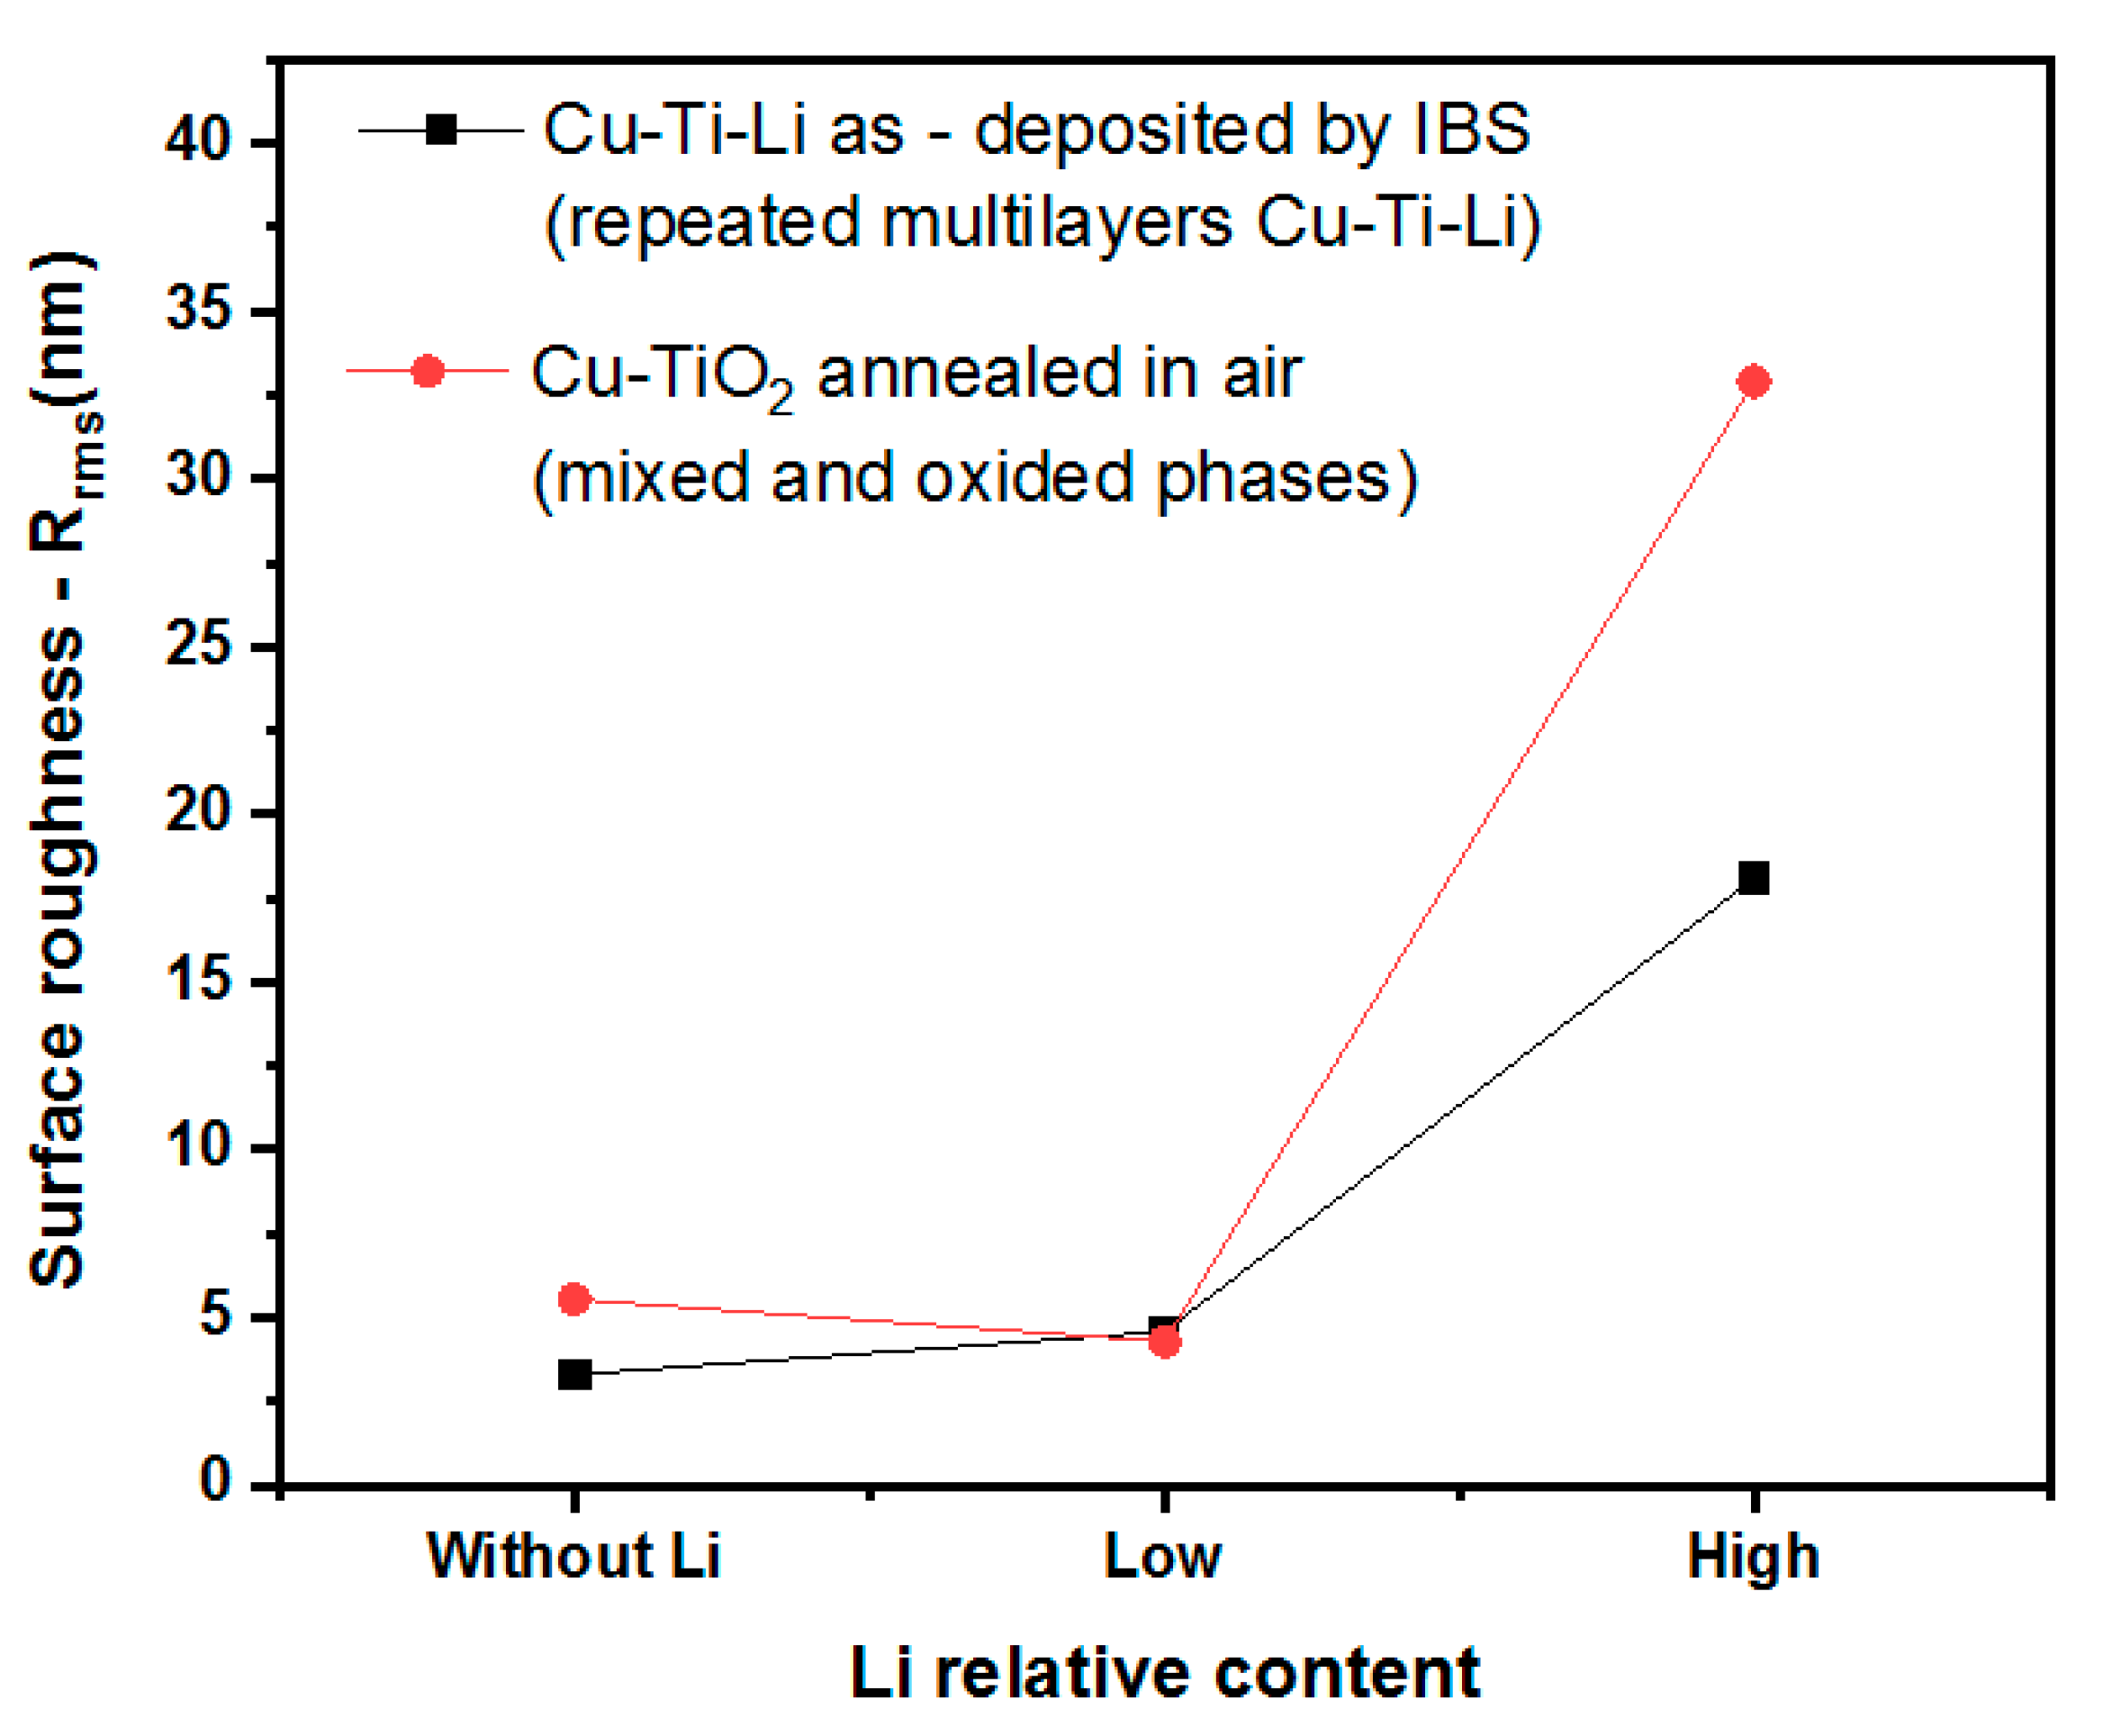
The development of the surface morphology is briefly depicted in
Figure 3, where a comparison of R
rms for samples with a different relative content of Li before and after annealing is given. As can be seen (and as mentioned above), the surface roughness remains at a similar level for the Cu–Ti–Li
low sample before and after annealing. However, for the sample with a high relative content of Li (Cu–Ti–Li
high), R
rms rises sharply both after IBS-deposition (approx. 5×), and especially after thermal annealing (approx. 10×). This is due to the effect of higher concentrations of Li on the morphology (and structure) of the heterogeneous composites. To shed more light on it, the samples were further analyzed by several profiling methods—NDP, RBS, and SIMS. It should be noted, however, that the NDP and RBS analyses were performed only for the IBS-deposited samples, because, as shown by AFM, the composites acquire a high surface roughness after annealing and are therefore not suitable for the NDP and RBS measurements. In addition, it is not expected that the total content of building elements will change after annealing; the elements will only be mixed and oxidized.
3.2. NDP Analysis
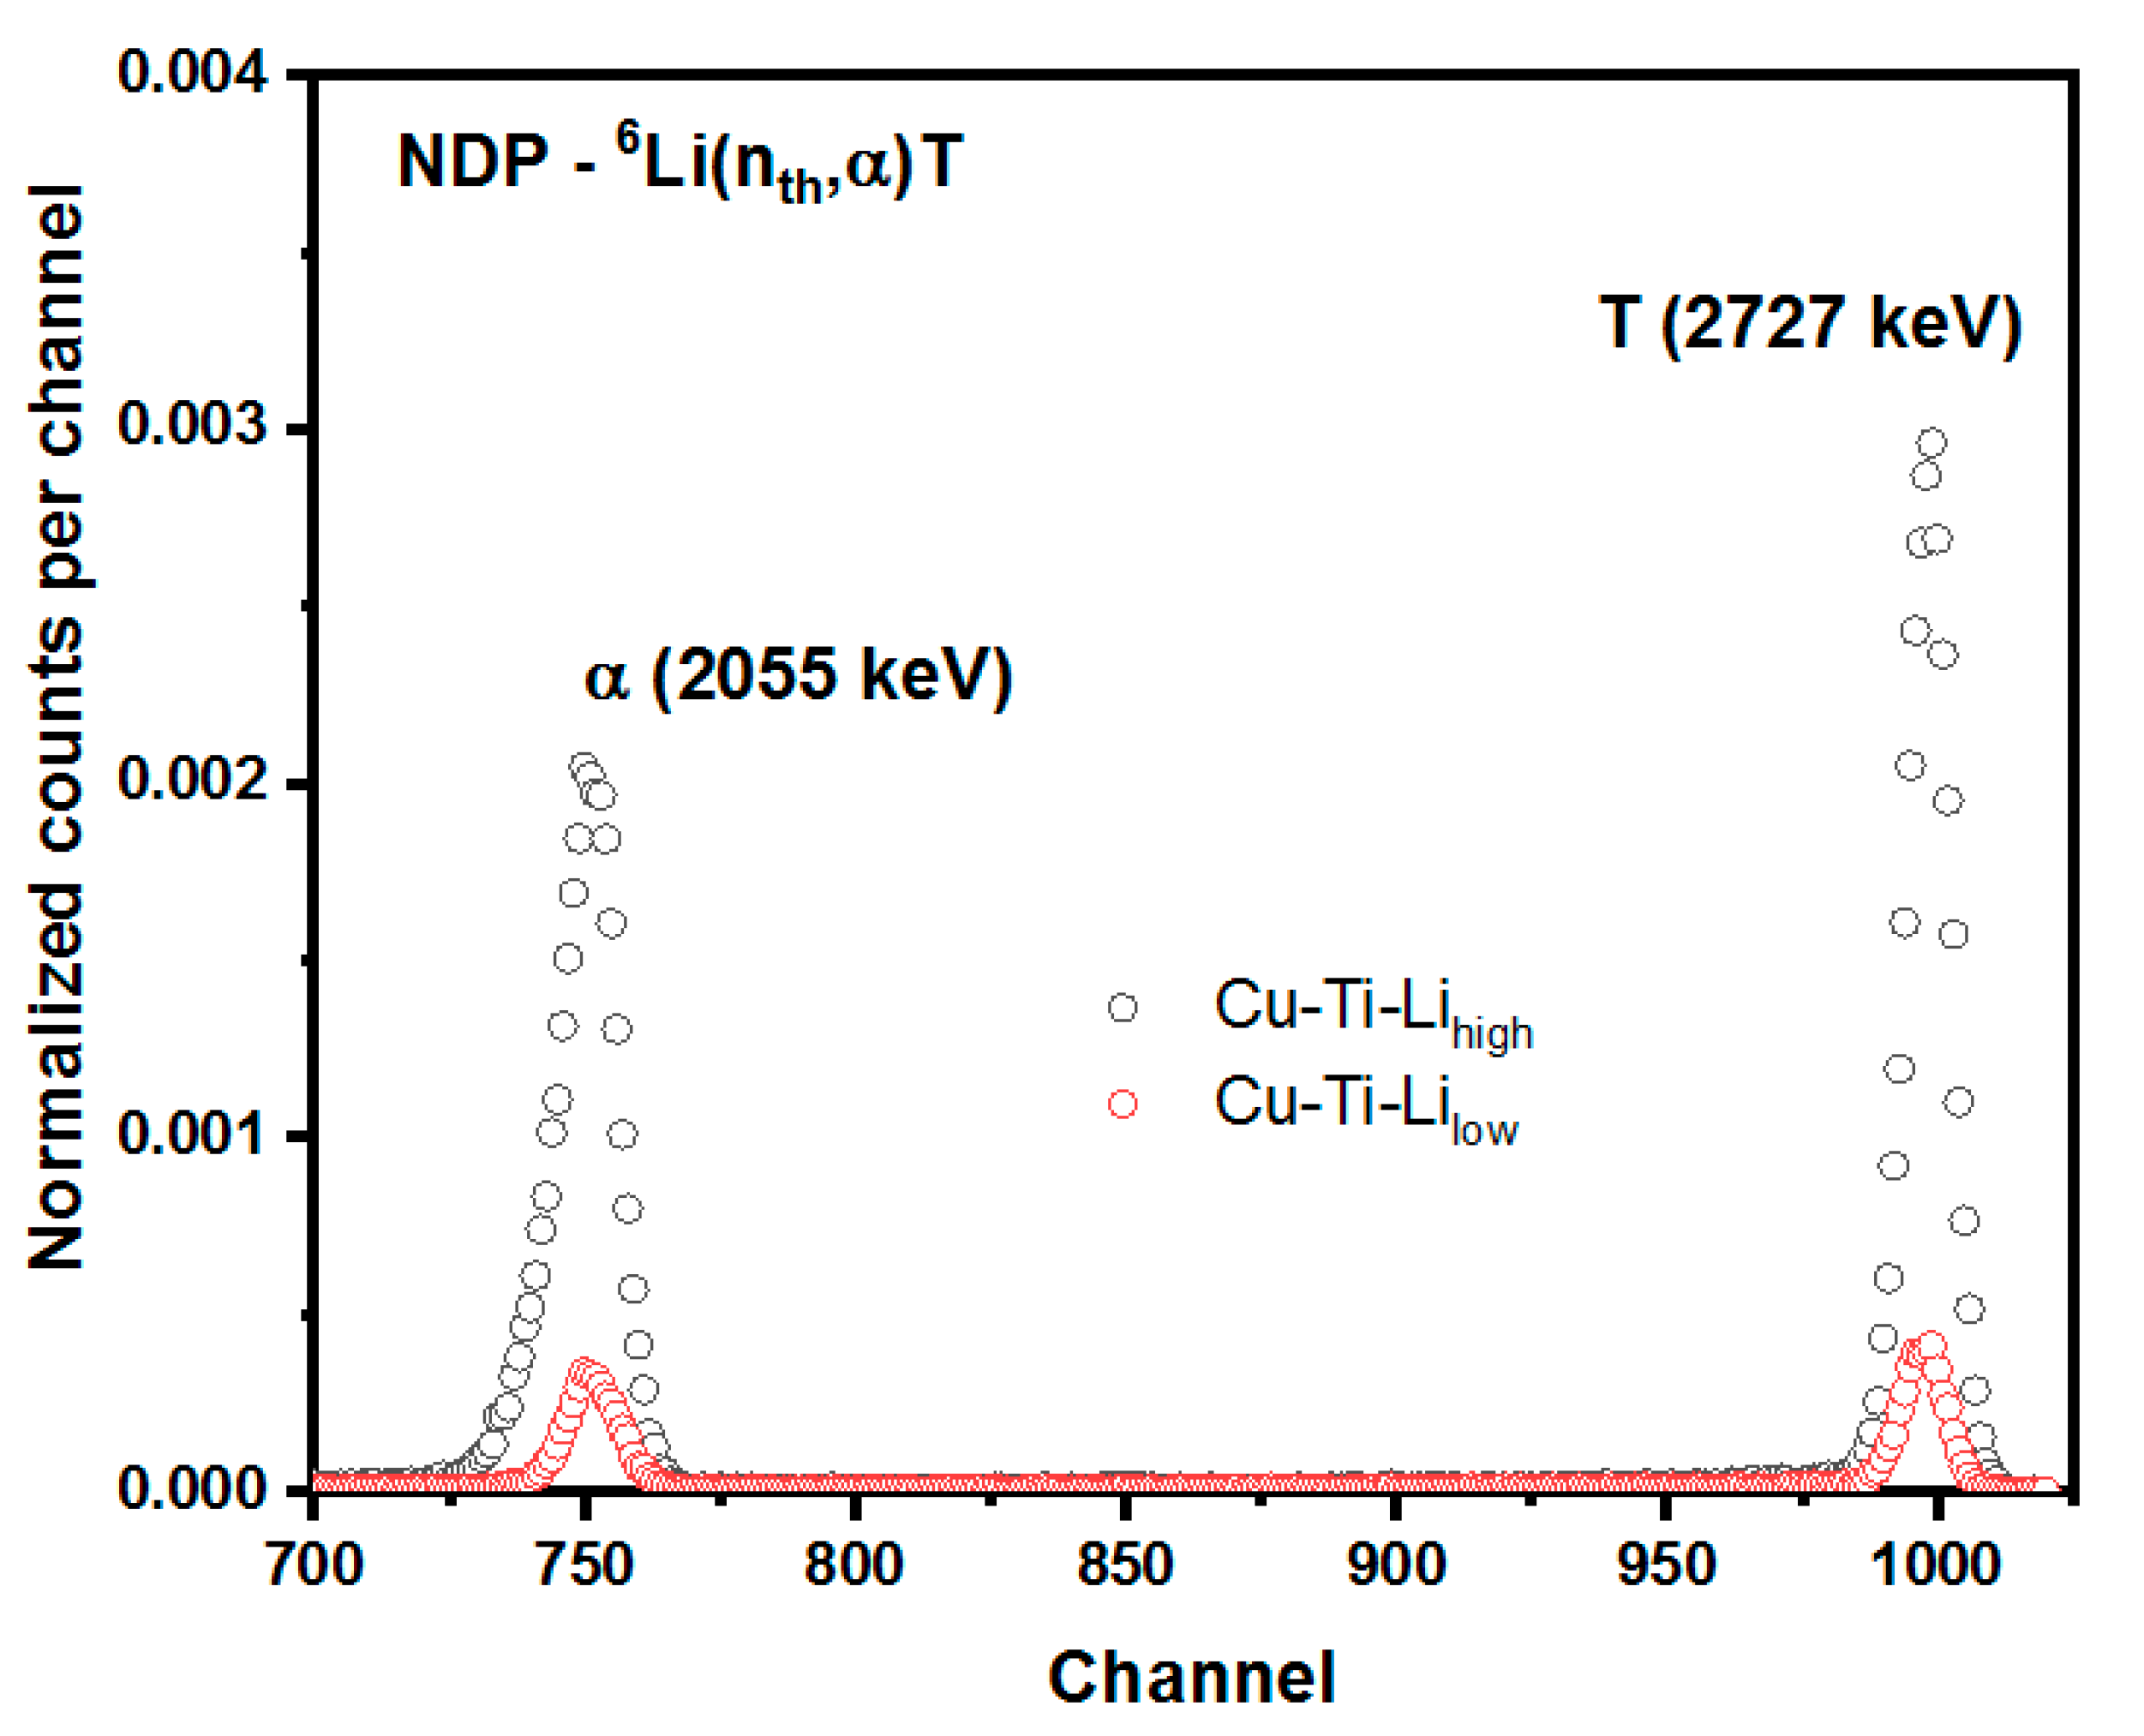
NDP investigations make it possible to determine the quantity of Li atoms in the samples and their concentration vs. depth. The method is based on the nuclear reaction (n
th, α) of thermal neutrons with the
6Li isotope (~7.5% abundance), which has a high cross-section σ = 940 b and relatively high energy of reaction Q = 4782 keV. The energy spectra measured for the IBS-deposited samples with a low and high concentration of Li are shown in
Figure 4. There are two pairs of peaks that correspond to the two reaction products—tritons (2727 keV, channel~1000) and alpha particles (2055 keV, channel~750)—for two samples with a low (red line) and high (black line) relative content of Li. Using the NIST standard (based on calibrated
10B implanted to Si wafer), the amount of Li atoms was determined to be 0.18 × 10
17 at./cm
2 and 1.29 × 10
17 at./cm
2 (with about 10% uncertainty) for the Cu–Ti–Li
low and Cu–Ti–Li
high samples, respectively. Because the thickness of the composites was ~100 nm, NDP (with the depth resolution ~10 nm nominal) did not allow the depth profiles of lithium to be determined in sufficient detail.
3.3. RBS Analysis
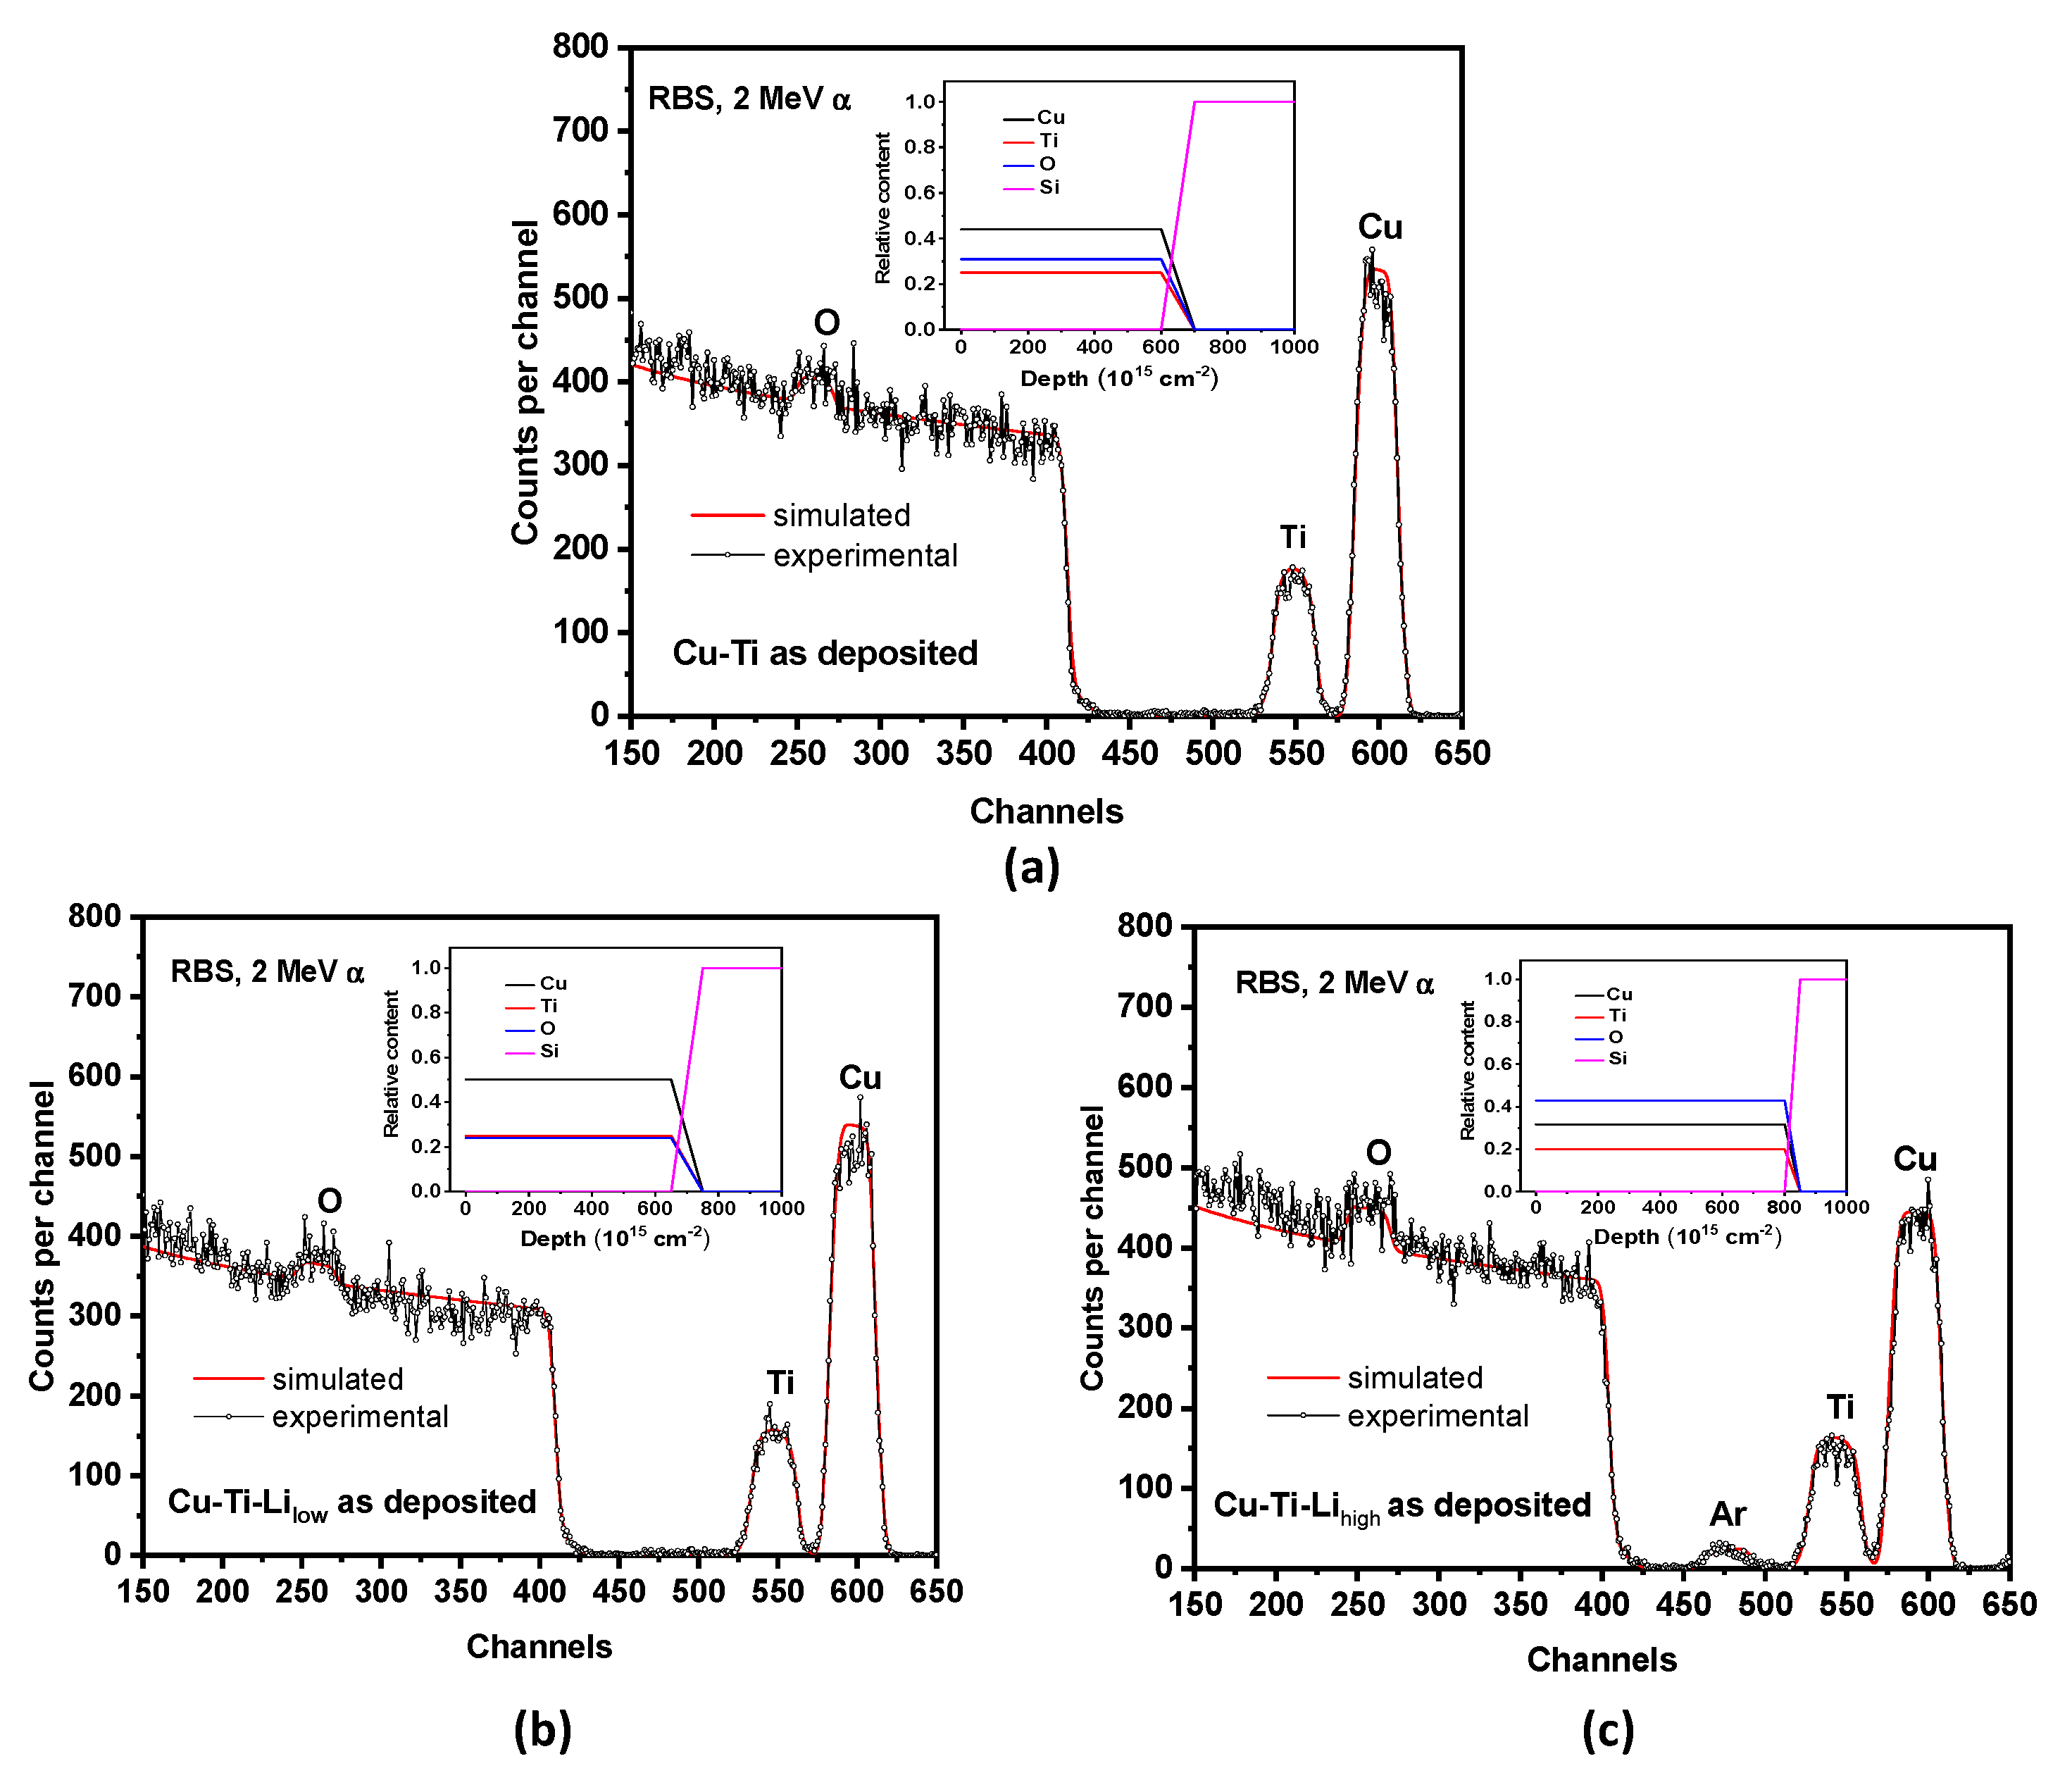
Using RBS with a 2 MeV alpha probe, it was possible to determine the elemental composition of the samples (except light particles including Li) and depth profiles of the building elements (however, since the spatial resolution is only about 10 nm, it was not possible to evaluate the profiles in high detail, similarly to NDP). In
Figure 5, the RBS spectra of the IBS-deposited composites Cu–Ti (a) and Cu–Ti–Li with a low (b) and high (c) Li content are presented. The depth profiles of the building elements, including oxygen (evaluated by the SIMNRA code [
51]), are shown in the insets.
Several aspects can be identified in the RBS spectra. For instance, oxygen is incorporated in a high amount in samples prepared by IBS as multilayers (i.e., before annealing in the air). Its incorporation (e.g., due to oxidation of the building elements) took place either during the preparation process (because of the residual air in the deposition chamber) or during transportation and analyses in air. The amount of oxygen increases sharply (approximately 2×) in the sample with the high proportion of Li. This can be attributed to the oxidation of the incorporated Li. Moreover, as expected, the sample thickness increased with increasing Li content—by about 8% for the sample with a low relative content of Li (compared to the sample without Li), and 33% for the sample with a high relative content of Li (it should be noted that the increase in the sample thickness, measured by RBS, is mainly due to the oxidation, not due to incorporated Li). As can be seen in (c), besides the peaks of the building elements (except Li), also a broad Ar peak is observed in the spectrum. This is obviously due to the extensive bombardment of the targets by Ar+ ions, when they are backscattered and/or entrained by sputtered atoms of building elements.
The results of the measurements with the help of RBS and NDP, presented in
Table 2, shows the concentrations and relative contents of the building elements (including oxygen) in the composites after the first step of the sample preparation. In addition, information on the stoichiometric ratios and thicknesses (in 10
15 at. cm
−2) of the individual samples is also given. As can be seen, the required 2:1 ratio between Cu and Ti have not been reached fully. The actual ratio varied from 2.00:1.14 for Cu–Ti via an optimal value 2.00:1.00 for Cu–Ti–Li
low to 2.00:1.26 for Cu–Ti–Li
high. The reason for this fluctuation can be attributed to unstable sputtering rates (due to small changes in the intensity of the Ar
+ beam), as well as to difficulties to maintain accurate sputtering times (it should be mentioned that sputtering takes only tens of seconds for deposition of a single nanolayer). The analysis of the data in
Table 2 documents also other aspects. It turns out that Cu and Ti are not fully oxidized. If the formation of only CuO, TiO
2, and Li
2O phases is taken into account (although this is not realistic), the percentage of unoxidized Cu and Ti can be derived as follows: Cu-Ti → 77% Cu and 59% Ti, Cu–Ti–Li
low → 84% Cu and 68% Ti, and Cu–Ti–Li
high → 64% Cu and 43% Ti. If for simplicity, it is assumed that lithium (as a highly reactive element) is fully oxidized (to Li
2O) and the remaining oxygen (O
r) is bound to Cu and Ti only, then the O
r/Cu+Ti ratio should be similar in all samples. However, the evaluation showed that this ratio fluctuates: Cu-Ti → 0.45, Cu-Ti-Li
low → 0.32, and for Cu-Ti-Li
high → 0.66. The reason is not clear, but it is most likely a combination of several causes, such as formation of a barrier (on the surface from oxides of building elements) against the deep penetration of air into composites, or a different surface morphology (the AFM and RBS data show that the O
r/Cu+Ti ratio is affected by the surface roughness R
rms). So, oxidation concerns mainly the surface and subsurface layer, the thickness of which can be estimated from the relative ratio of the oxidized elements (provided that both CuO and TiO
2 phases are formed in the same layer, which is again only a simplification). In the case of homogeneous mixing of the elements, the oxidized layers correspond to the following relative part of the thickness: Cu-Ti → 33%, Cu-Ti-Li
low → 16%, and Cu-Ti-Li
high → 36%. One can see that Cu–Ti–Li
high is the most oxidized sample, which can be due to its surface morphology with chimney NPs (
Figure 2c) that enlarge the surface area. Cu–Ti–Li
low, on the other hand, is the least oxidized, which is probably because the sample contains the highest amount of Cu, which does not undergo as intense oxidation as Ti. As mentioned above, the total thickness of the composites is different—it changes (grows) with Li (and its oxidation). The contribution (in 10
15 at. cm
−2) by only Cu and Ti is nearly identical for all samples: Cu-Ti → 4.14, Cu-Ti-Li
low → 4.88, and Cu-Ti-Li
high → 4.14 (a higher value for Cu-Ti-Li
low is due to a higher amount of Cu). The other contributions are (i) due to oxidation of Cu and Ti (Cu-Ti → 1.86, Cu-Ti-Li
low → 1.54, and Cu-Ti-Li
high → 2.71), and (ii) incorporated Li and its oxidation (Cu-Ti-Li
low → 0.27, Cu-Ti-Li
high → 1.94).
3.4. TOF-SIMS Analysis
TOF-SIMS analysis allowed us to monitor the distribution of the building elements in the samples before and after thermal annealing both in the cross section and on the surface (the latter case is not presented here). The SIMS data significantly complement the measurements by NDP and RBS and bring forth information on the distribution of the elements with a 39 × 39 nm spatial resolution.
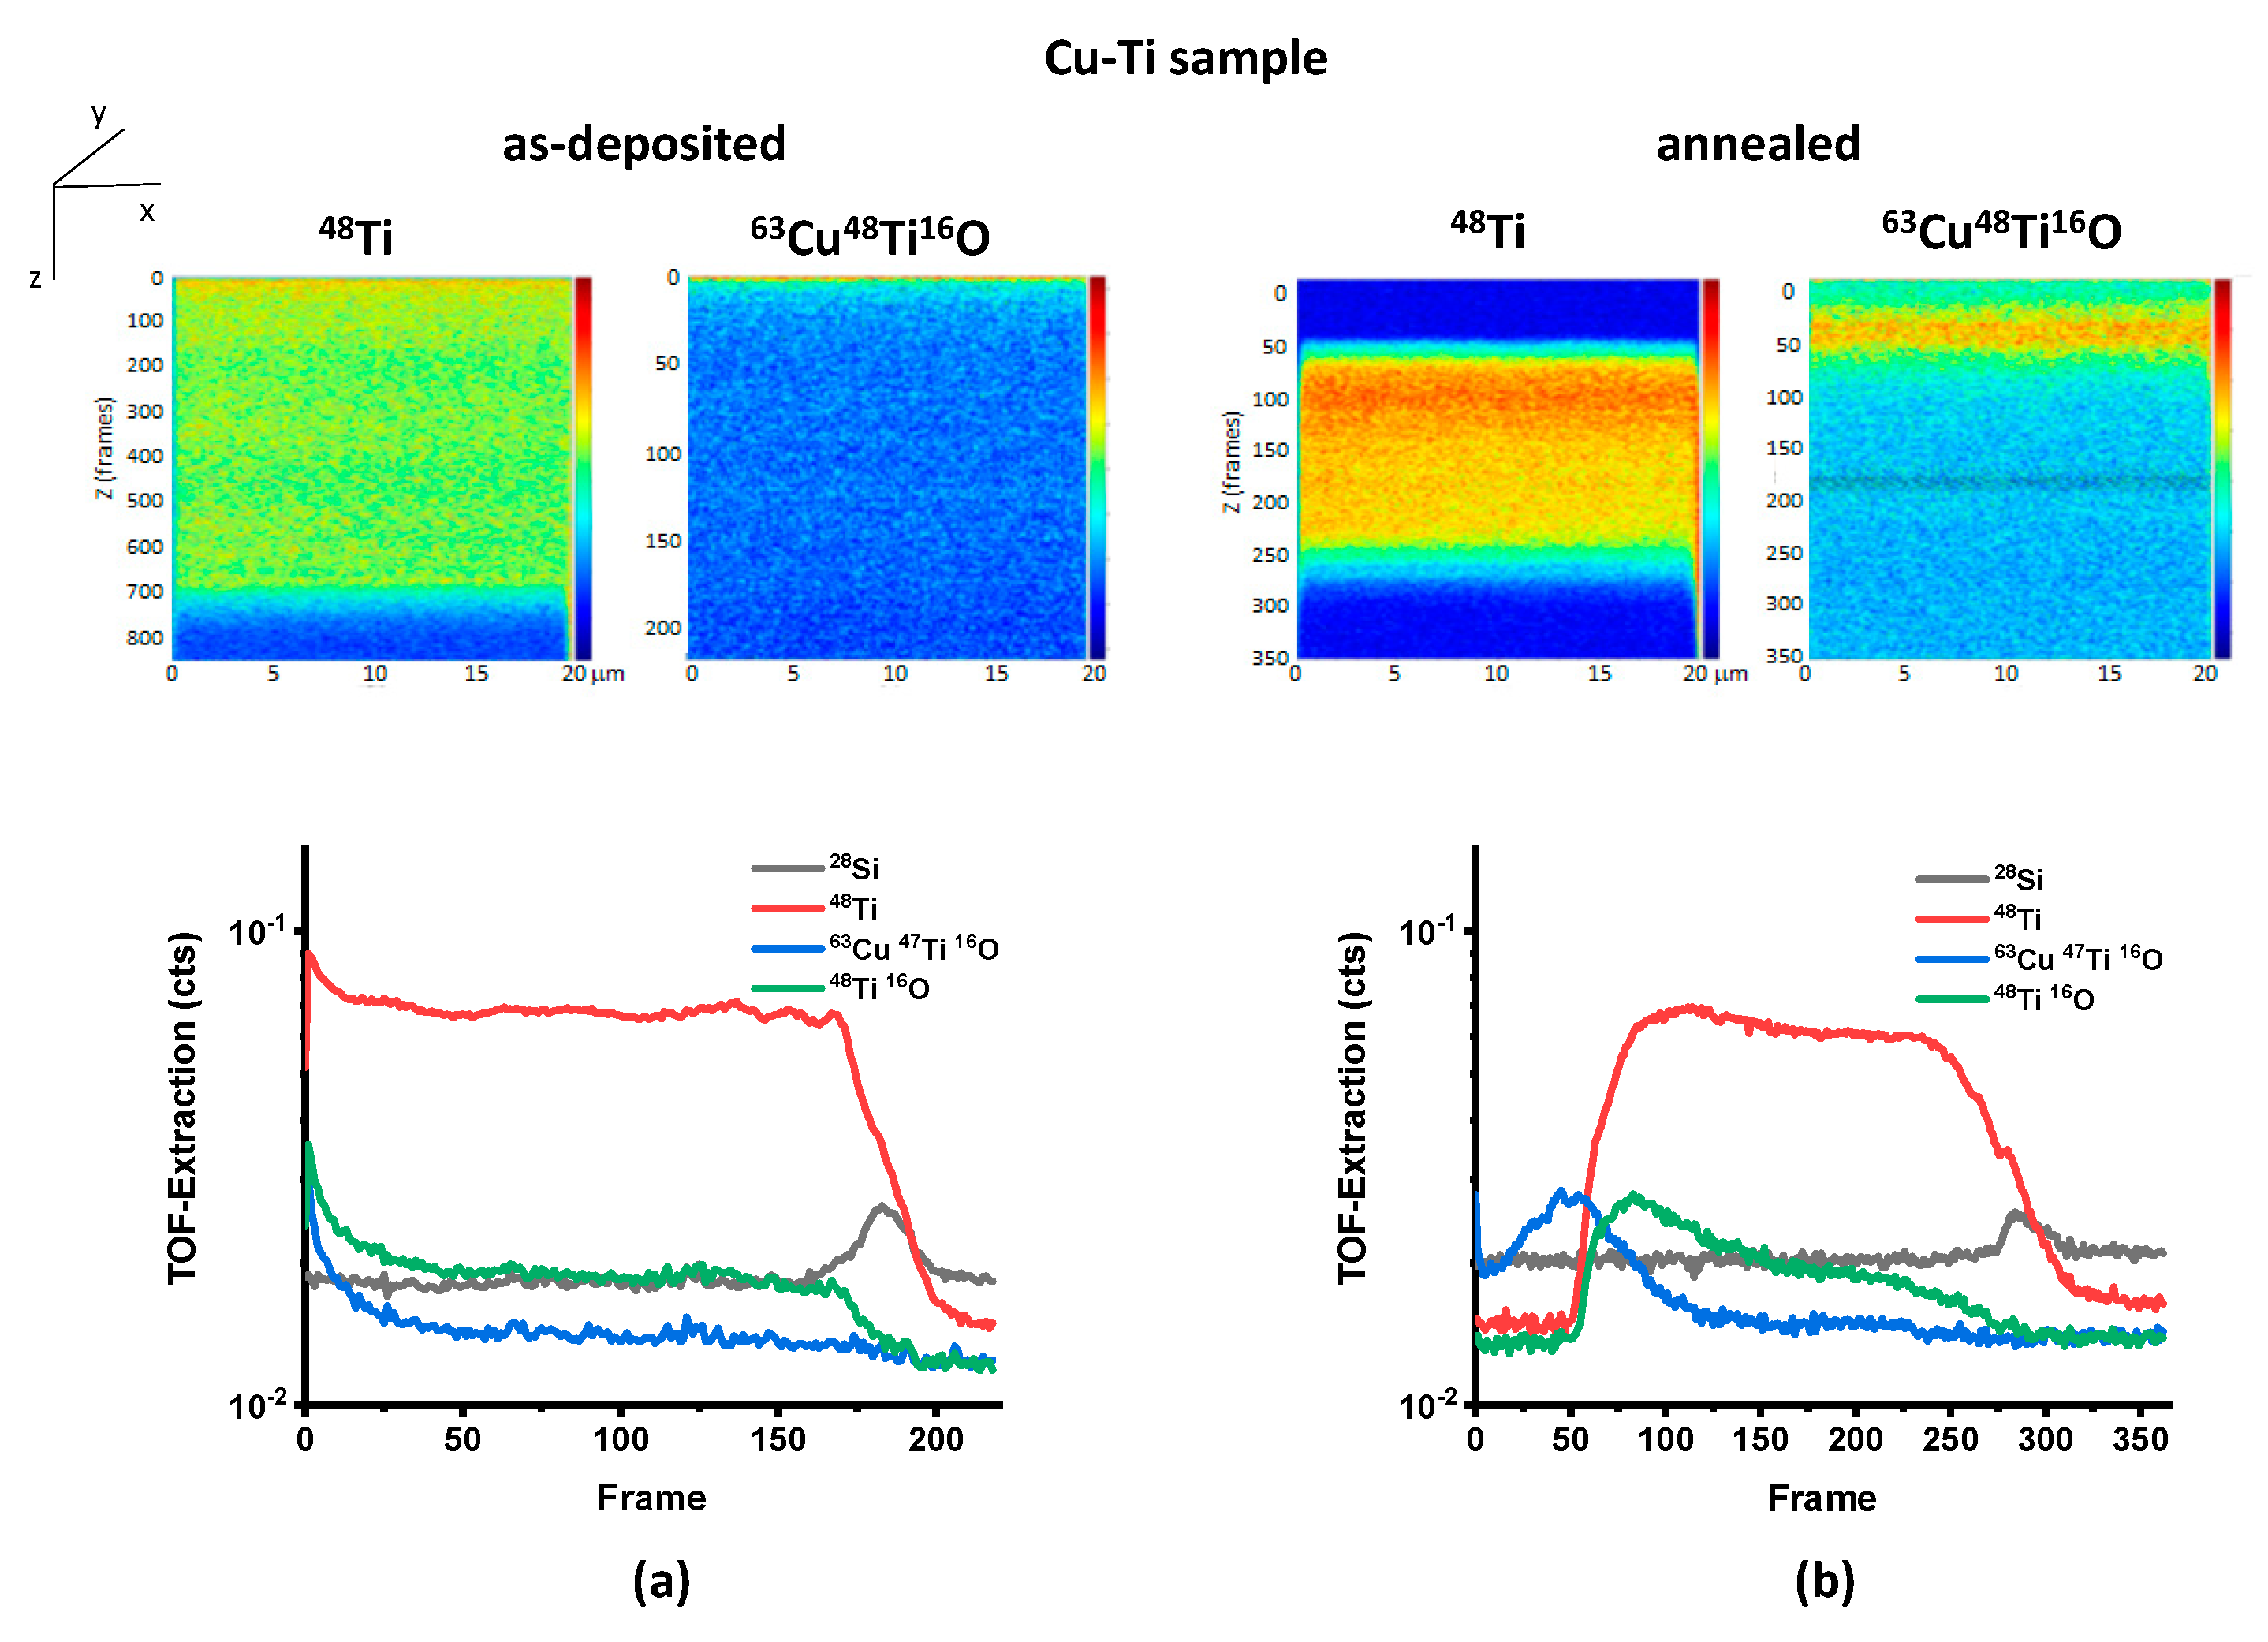
Figure 6 shows cross sections of the SIMS stack frames and corresponding sputtering profiles (of the
48Ti and
63Cu
48Ti
16O ions) obtained for the Cu–Ti sample before (a) and after (b) annealing. Both the x-axis (frontal) and y-axis (perpendicular to the plane with an integrated signal) in the images are set to 20 µm; the z-axis (from top to bottom) is constructed by the frames, with an initial 0 frame at the surface. The color represents the counting intensity, with red as the highest (the maximum is, however, different for each image) and blue as the lowest (with zero counts). The analysis showed that before annealing, the building elements were homogeneously (on a few nm depth scales) distributed, with higher oxidation only in a subsurface layer to a depth of up to about 1/3 of the total film thickness (a), which corresponds to the RBS data (see above). However, the 1-h annealing at 415 °C led to a significant redistribution of elements (b), to the transfer of Cu to a subsurface layer (representing about 20% of the total film thickness), and, consequently, to a higher abundance of Ti (with a relatively uniform distribution reaching the substrate) below it. In a somewhat wider zone (about 1/3 of the total film thickness), Cu and Ti oxides (presumably CuO–TiO
2) were formed with some increase at the Cu/Ti interface. Interestingly, the distribution of the Ti and Cu oxides differs, which is perhaps due to the formation of the top Cu layer and its weaker oxidation.
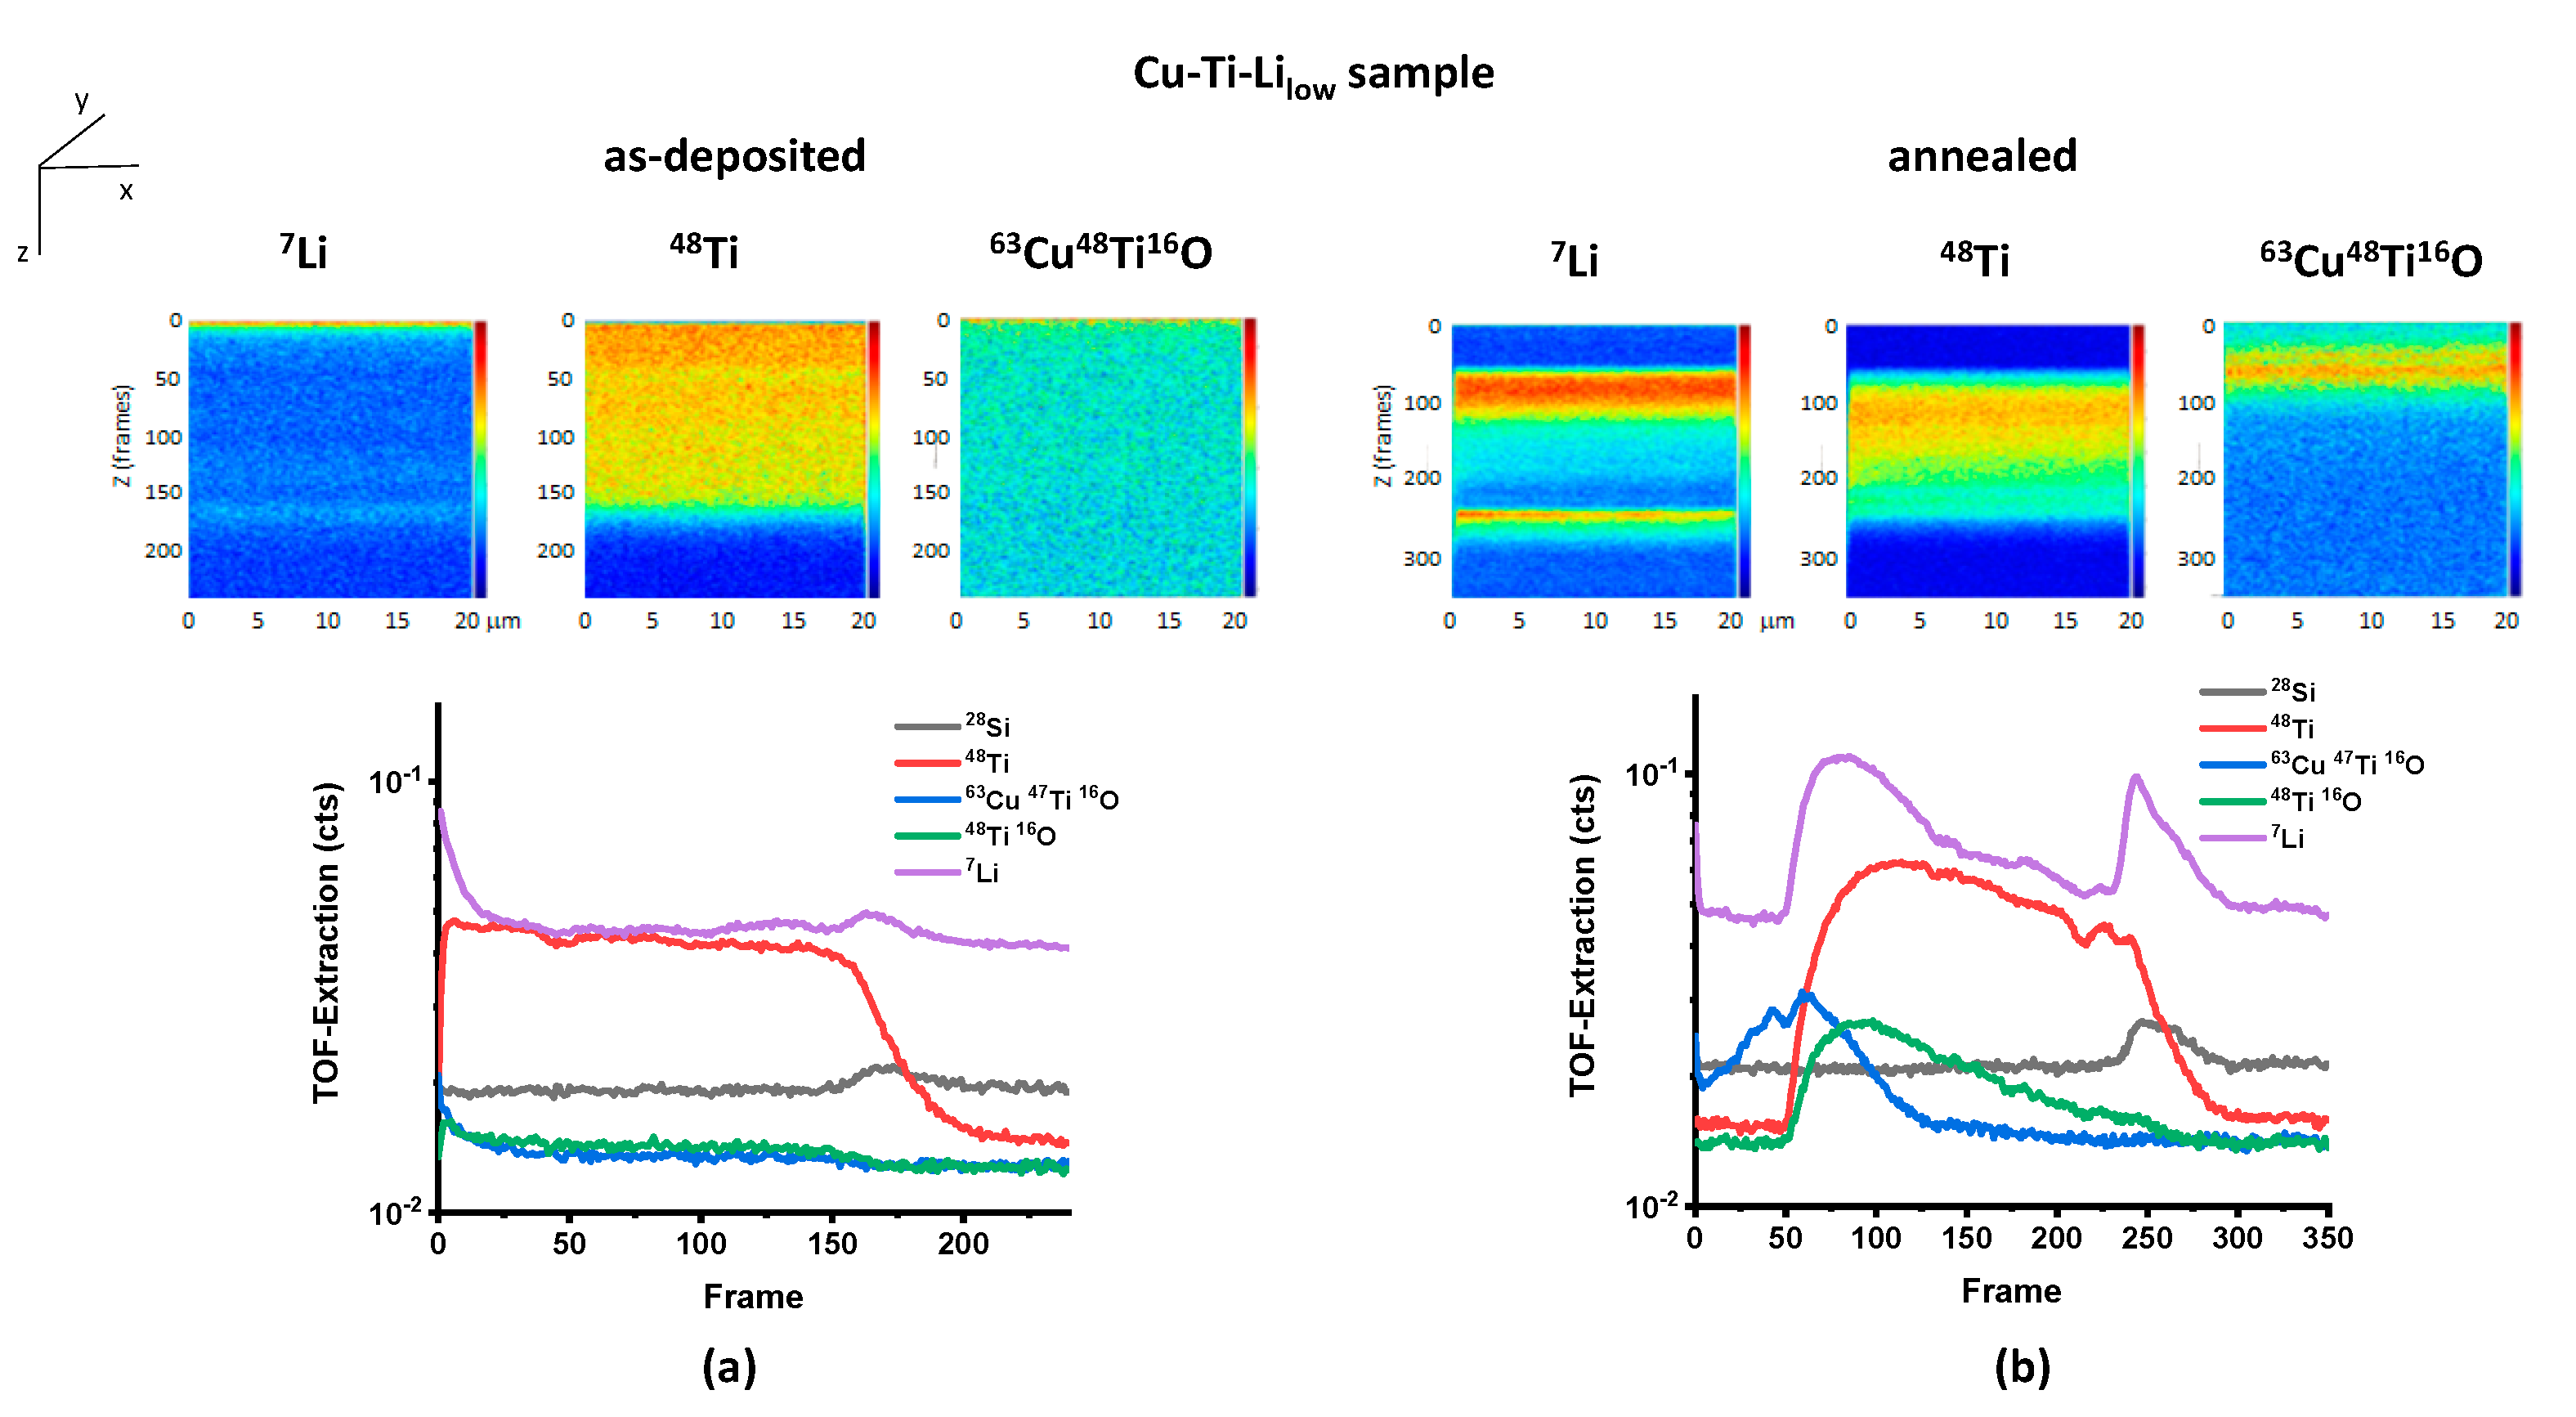
Figure 7 and
Figure 8 show the cross sections of the stack frames and corresponding sputtering profiles of the
7Li,
48Ti, and
63Cu
48Ti
16O ions in the Cu–Ti–Li
low (6) and Cu–Ti–Li
high (7) samples before (a) and after (b) annealing. In Cu–Ti–Li
low, the distribution of the Cu and Ti before annealing is similar as in the Cu–Ti sample, with the oxidized surface layer (
63Cu
48Ti
16O) being only about 15% of the total film thickness (in agreement with RBS). Li is relatively homogeneously distributed in the sample, but unlike Ti, it shows a sharp increase in the subsurface layer (with about 15% of the total film thickness), and also some increase at the interface with the Si substrate. The redistribution of Li in the films may indicate that the sample was heated during preparation (perhaps due to the deposition of sputtered atoms with a keV energy) to temperatures where Li can diffuse rapidly [
52]. After annealing, Cu and Ti show similar behavior as in the Cu–Ti sample, i.e., Cu moves towards the surface and forms a subsurface layer (of about 20% of the total film thickness), while Ti is broadly distributed throughout the depth of the film below the Cu-rich layer, with a moderate decrease in concentration towards the Si substrate. The layer of both (Cu and Ti) oxides (
63Cu
48Ti
16O) is in the form of a wide distribution partially located in the top Cu layer and Ti underlayer with a maximum at the Cu/Ti interface. The Ti oxides (
48Ti
16O) form a broad distribution that begins below the Cu/Ti interface and also gradually decreases towards Si. The behavior of Li is interesting—it moves from the top layer towards the Cu/Ti interface (and is replaced by Cu), where it forms a wide distribution, reaching up to half the thickness of the sample. The rapid growth of Li was also indicated at the interface with Si, with apparent diffusion to the substrate.
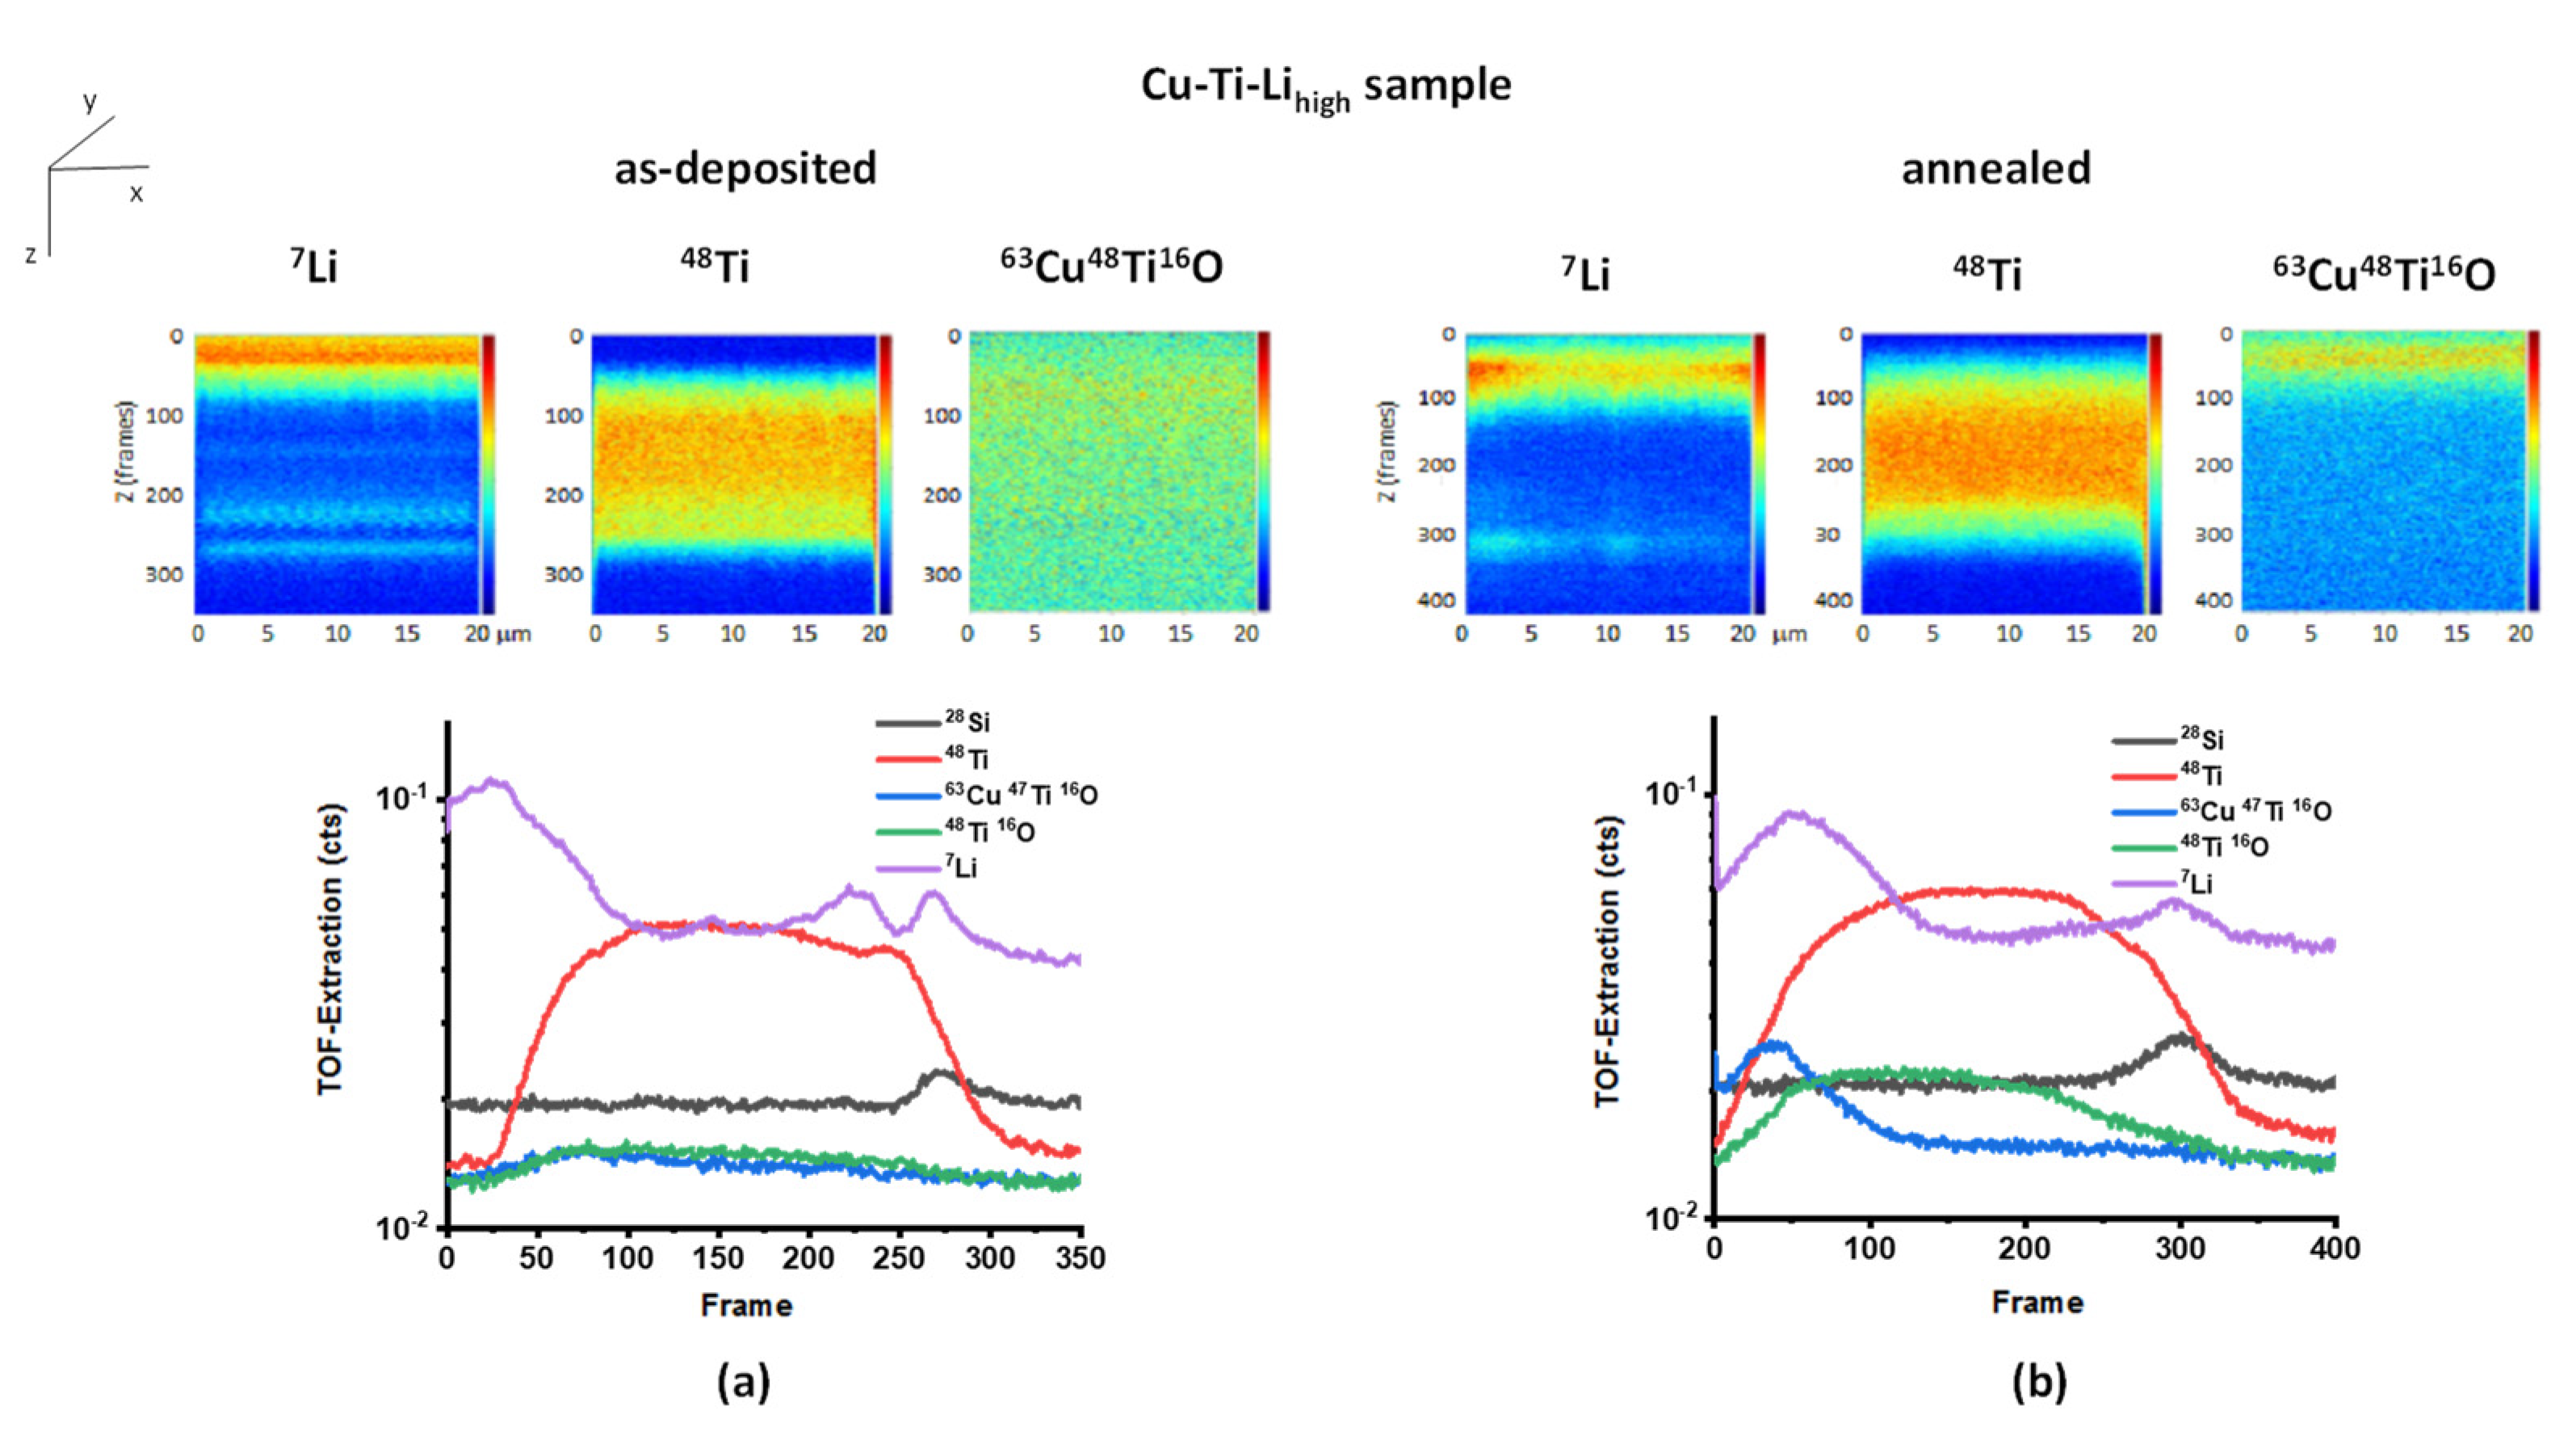
Figure 8a shows that the distribution of the elements in Cu–Ti–Li
high differs from the previous samples. Ti is strongly depleted in the subsurface layer (representing about 20% of the total film thickness) and forms a broad (largely homogeneous) distribution below it, which extends to the Si substrate. A similar distribution can also be assumed for Cu. Interestingly, only relatively weak oxidation of both Ti and Cu (
63Cu
48Ti
16O) is recorded, and (similarly as
48Ti
16O) it is mainly in the Ti distribution region, not in the top layer, and can be estimated to be at about 40% of the total film thickness. This is probably due to a large amount of Li on the surface, which is oxidized preferentially (as a strong reducing agent) and forms a surface barrier that prevents deep oxidizing of the sample. The results are consistent with the RBS and NDP measurements. During the deposition, lithium moves in large quantities to the surface and towards the substrate, where it forms, surprisingly, two peaks (one at the interface with Si, the other just above with a significant drop between). The reason for this bifurcation is not entirely clear, but as follows from the analysis in
Figure 7 (before and after annealing), Li accumulates mainly at the boundaries between the different environments, e.g., at the surface, at the interface with the substrate, or the interface between Cu and Ti. Thus, the observed bifurcation can be considered as a manifestation of the separation of elements, when under certain conditions (e.g., at elevated temperatures and specific densities of Li, Cu, and Ti) mixed components separate from each other, i.e., when Cu separates from Ti (and accumulates above Ti) and Li separates from both Cu and Ti (and accumulates between them, below Cu and above Ti). Thermal annealing significantly changes the distribution of all building elements (
Figure 8b). Ti forms a wide distribution from the surface to the substrate with a slow increase near the surface and a decrease near the interface with the Si substrate. Cu apparently moves towards the surface, where it forms a Cu-rich layer. Both Cu and Ti oxides (
63Cu
48Ti
16O) are synthesized in the whole sample, but particularly in the subsurface layer (with a width of about 1/3 of the total film thickness). Ti oxides (
48Ti
16O) roughly copy the distribution of Ti.
3.5. Sensing Properties of the Prepared Films
The sensitivity of the heterogeneous gas sensors prepared by deposition and annealing of thin Cu–Ti, Cu–Ti–Lilow, and Cu–Ti–Lihigh composites on the multisensor platform KBI-2 (equipped with interdigital electrodes) was tested for different oxidizing gases (NO2, O3, and Cl2) and one reducing (H2) gas. The sensors’ resistance was measured at a temperature 200 °C (NO2, O3, and Cl2) or 300 °C (H2) in ‘pure’ synthetic air (which was used as a reference), and in synthetic air with a mixture of the oxidizing and reducing gases—10 ppm of nitrogen dioxide, 10 ppm of chlorine, 0.6 ppm of ozone, and 1000 ppm of hydrogen. The measurement was performed in a cell with a controlled gas inlet.
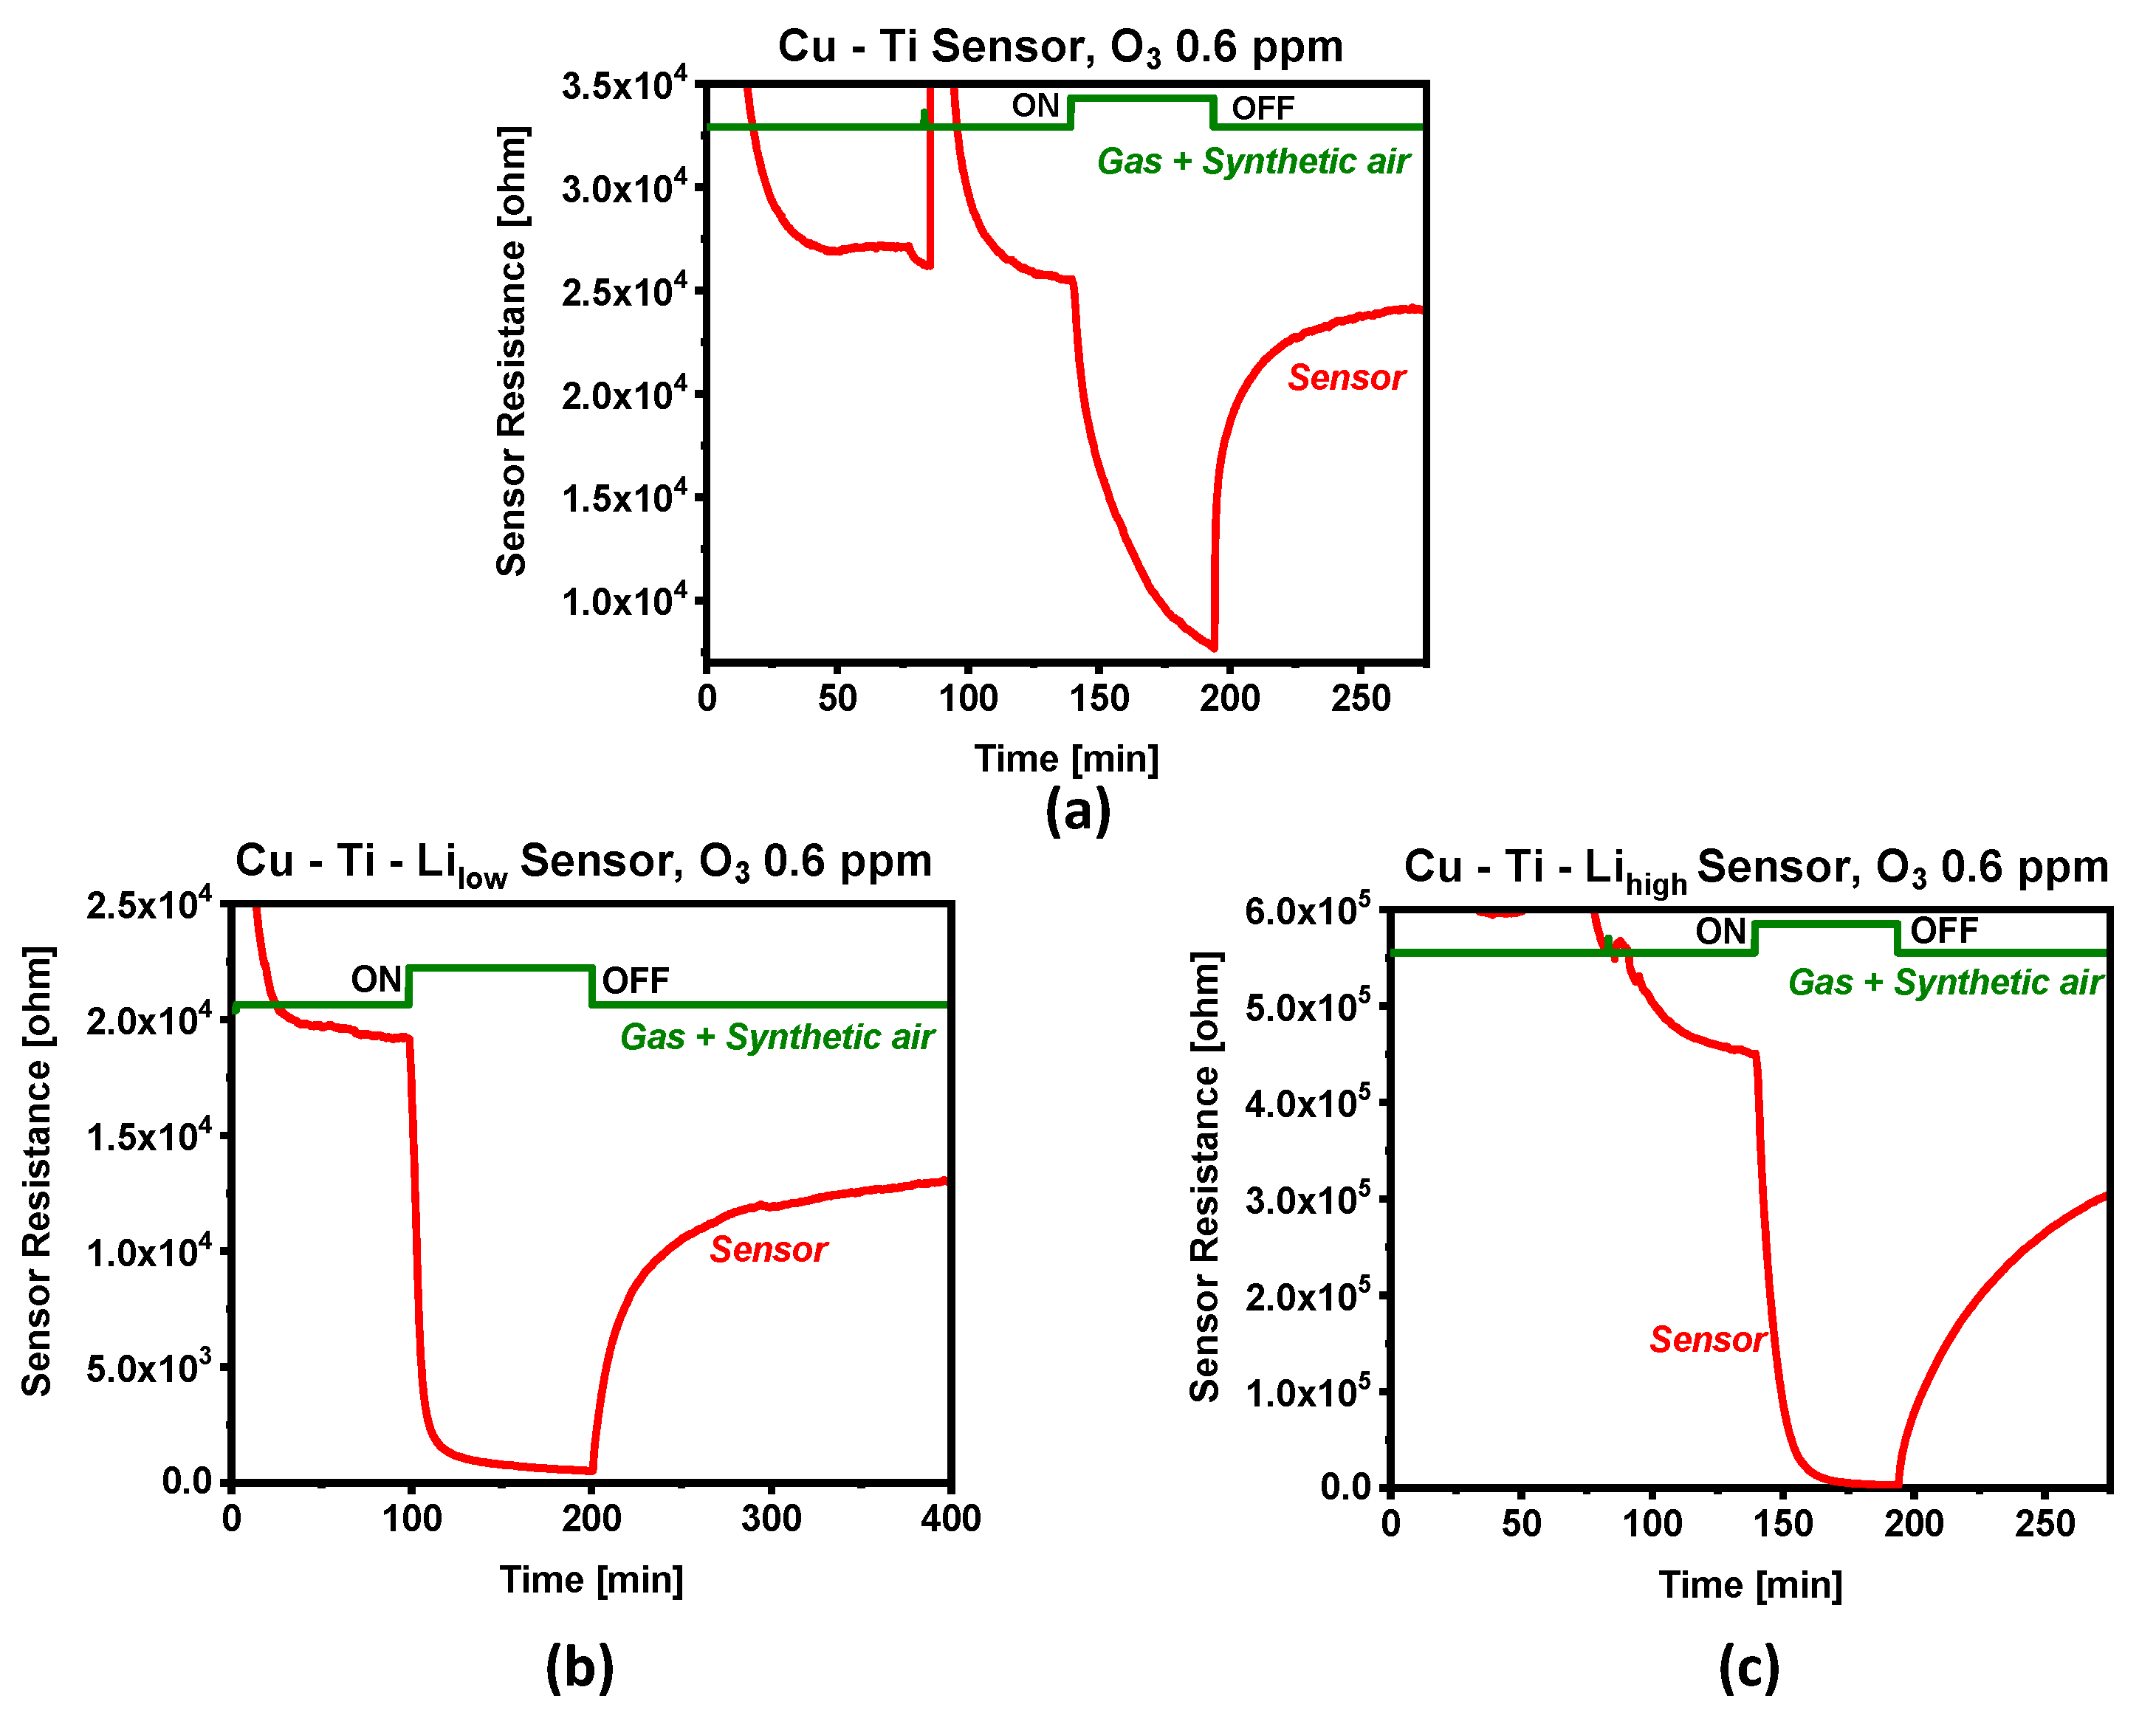
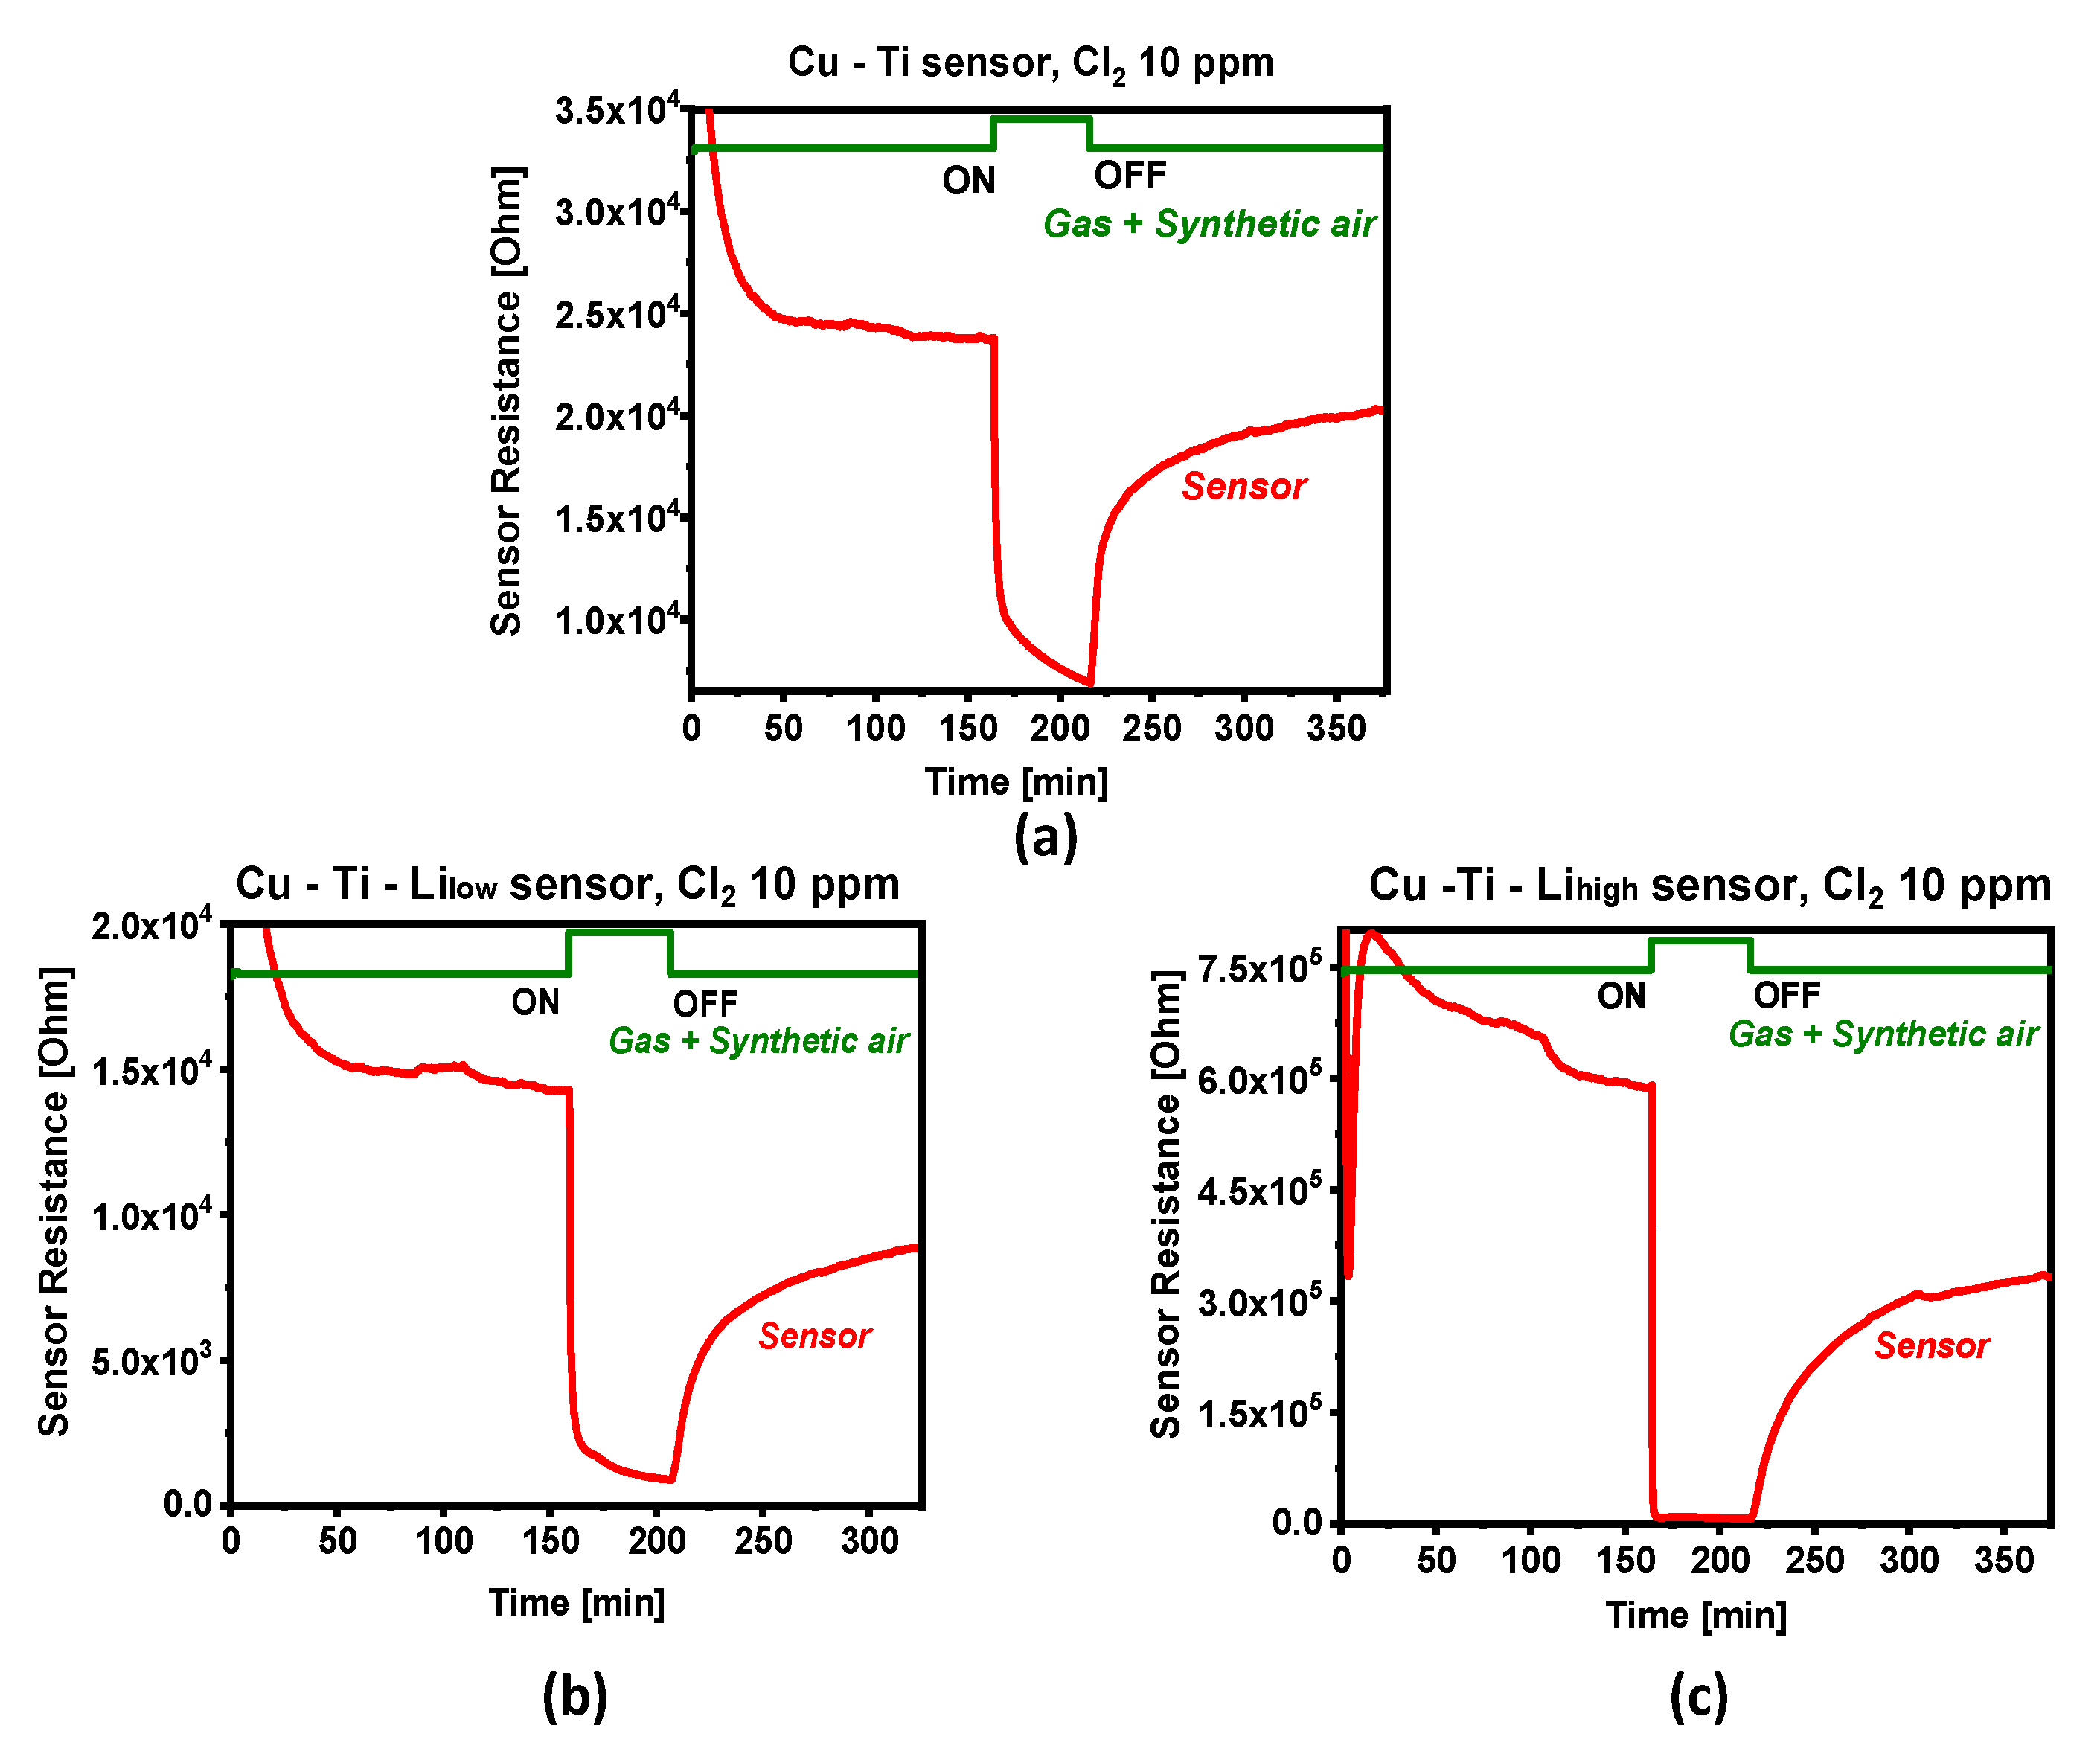
Figure 9,
Figure 10 and
Figure 11 show the responses (i.e., the dependence of the transient resistance on time with a gas inlet window) of the Cu–Ti (a), Cu–Ti–Li
low (b), and Cu–Ti–Li
high (c) sensors to the oxidizing gases NO
2 (
Figure 9), O
3 (
Figure 10), and Cl
2 (
Figure 11) diluted in synthetic air (response to the reducing H
2 gas was insignificant and hence the corresponding graph is not reported here). In
Table 3, the relative sensitivities of the sensors, i.e., ratios of their transient resistance measured in oxidizing (and reducing) gases to the resistance measured in the reference synthetic air, are given.
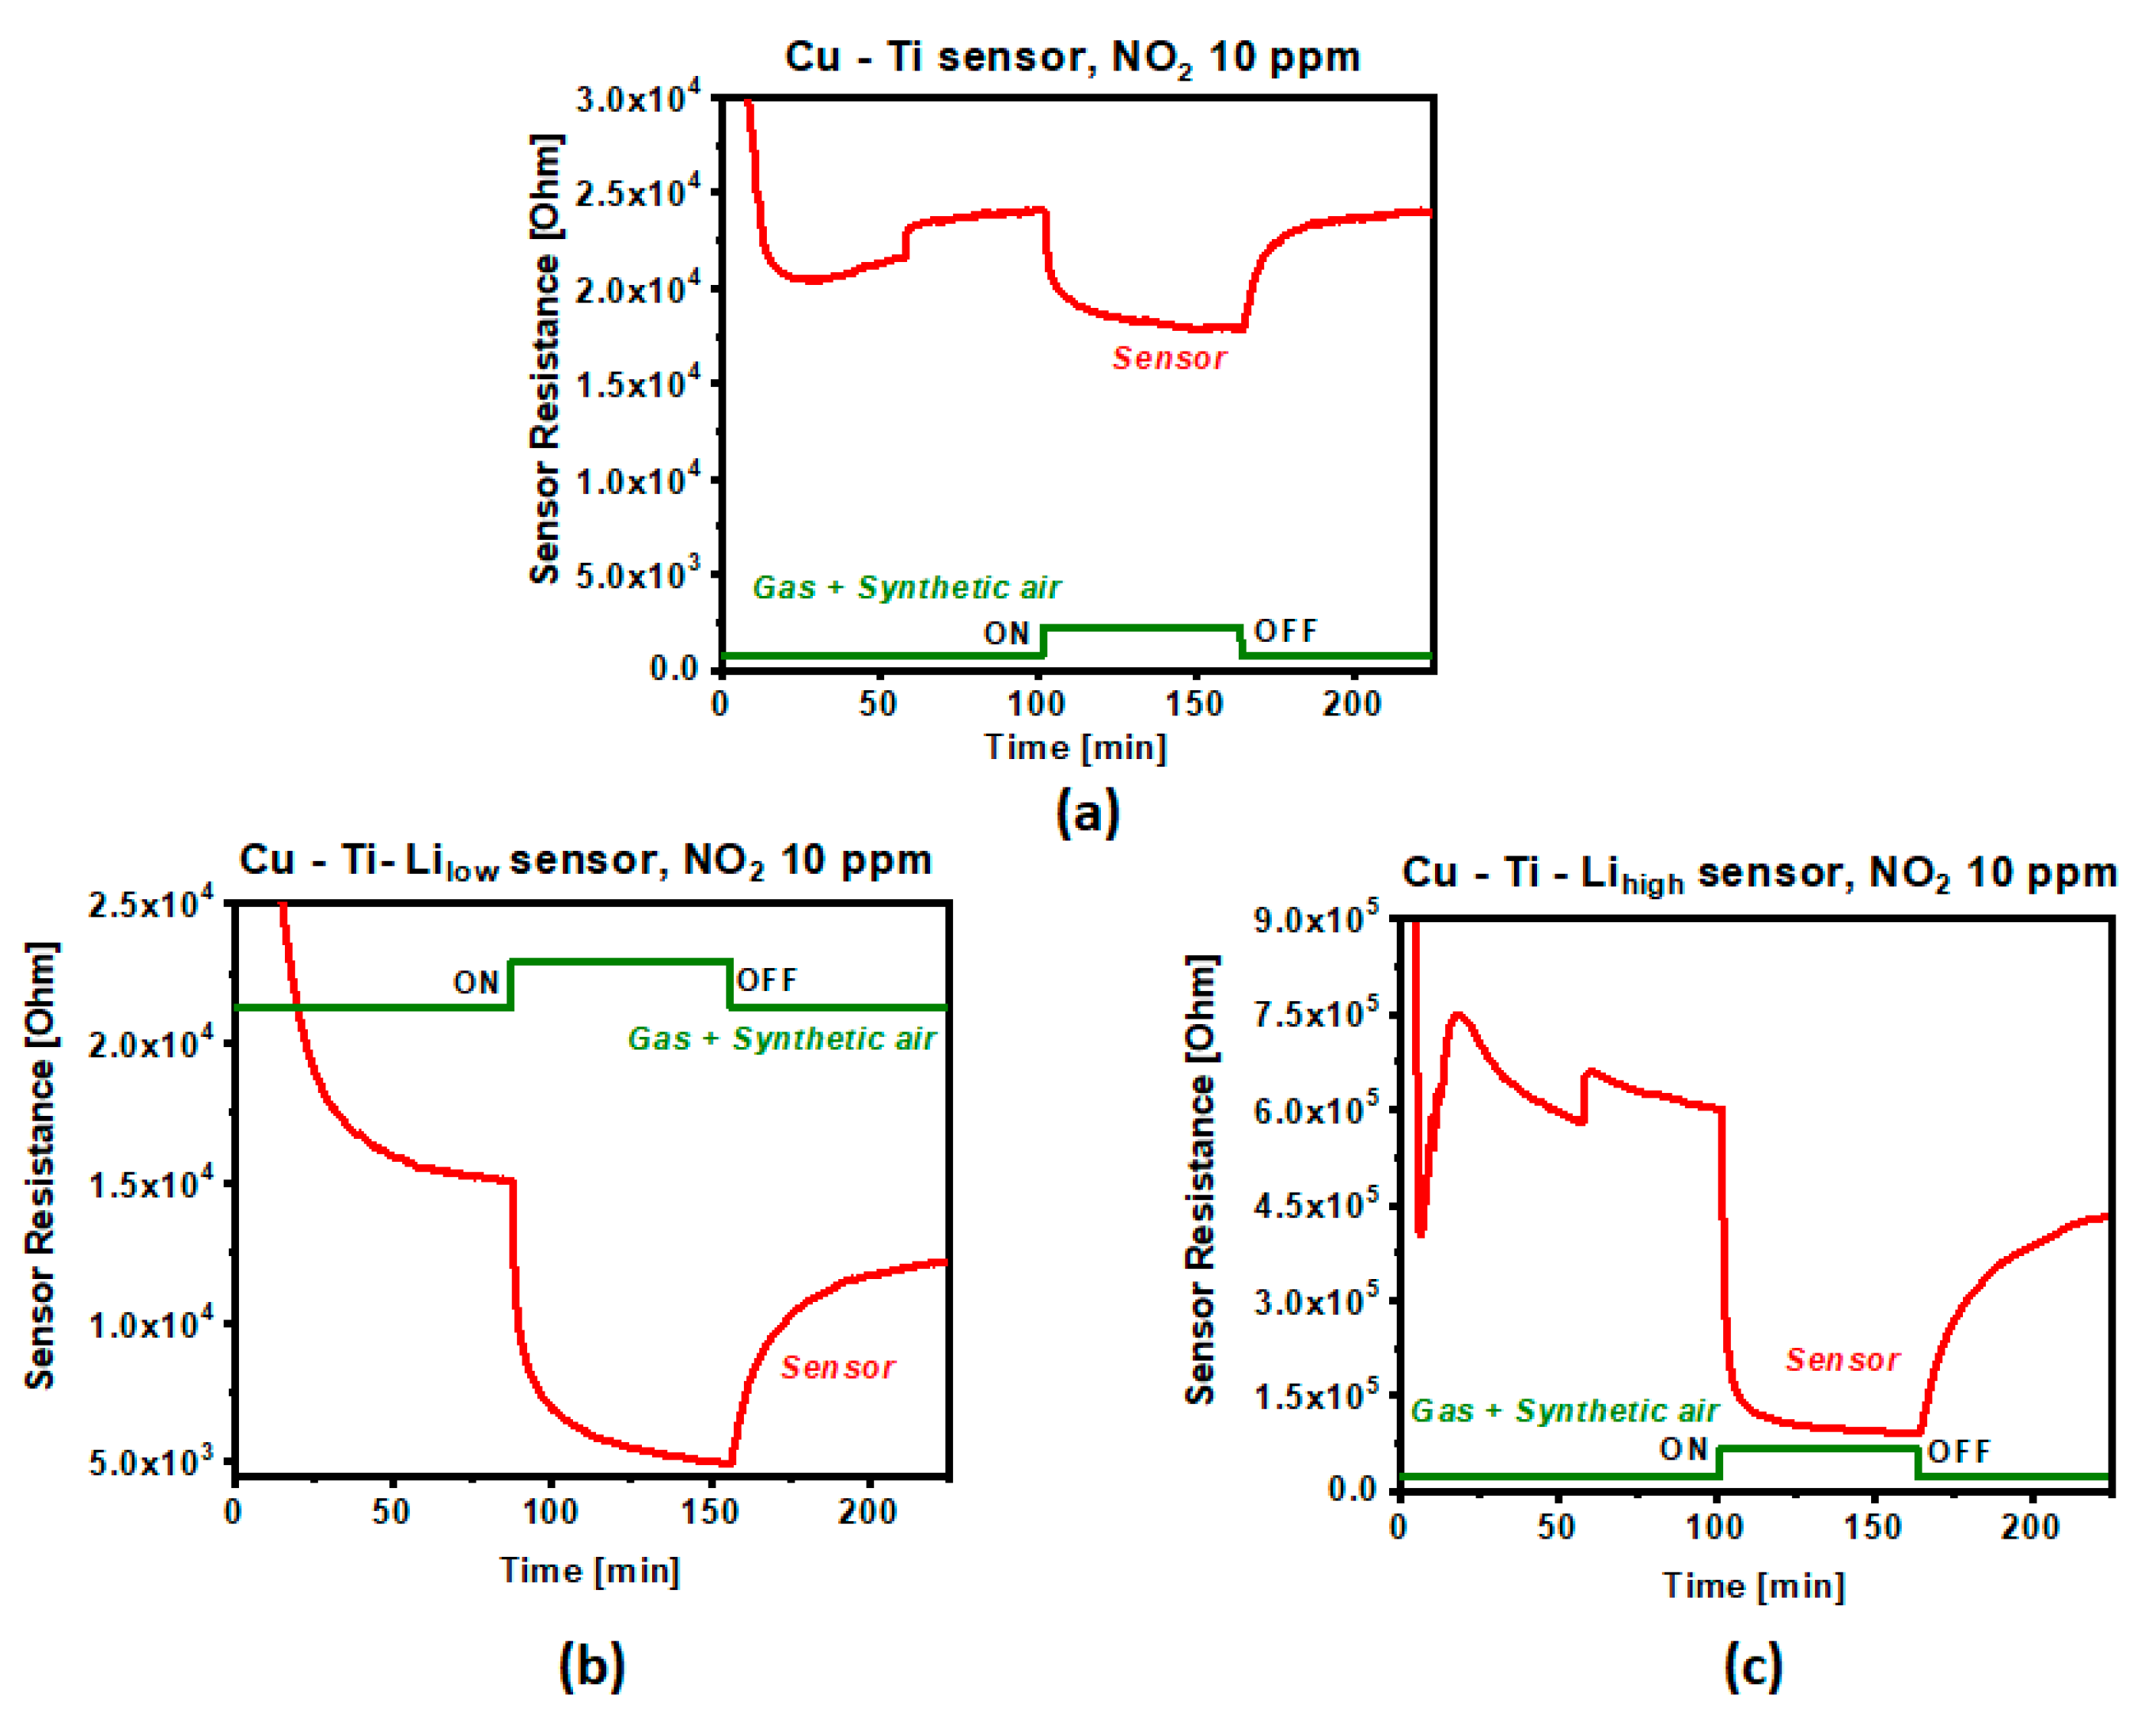
3.5.1. NO2 Response
It turned out that the active parts (heterojunctions) of the sensors strongly react to the diluted NO
2 (and also to O
3 and Cl
2) as a semiconductor with p-type conductivity. This results from measuring the dependence of the resistance on the temperature (the resistance was increasing with decreasing temperature, as can be observed from the red lines) and from the response parameters (resistance decrease) in the oxidizing gases shown in
Figure 9,
Figure 10 and
Figure 11. As can be seen (in
Figure 9 and
Table 3), lithium significantly improves the sensitivity of the sensors to 10 ppm nitrogen dioxide, and it is proportional to the Li content (the sensitivity, quantified as R
NO2/R
air, increases with the content of Li in the sensors).
Figure 9 shows the change in resistance in the time window when the gas inlet is opened and closed (indicated as ON/OFF, see the green lines). It turns out that the rate of reaction to the presence of gas is relatively fast for all sensors, i.e., in a few minutes (although with Cu–Ti–Li
low the saturation of the minimum is reached after about an hour). On the other hand, while the process of recovery for the sensor without Li is rather quick (lasting for about 25 min), for the sensors with Li it is quite slow (hours) and the recovery is only partial (the sensitivity decreases by tens of percent).
3.5.2. O3 Response
Figure 10 shows the response of the sensors to 0.6 ppm of ozone. Surprisingly, the response of Cu–Ti is relatively slow (compared to the sensors with Li) and does not reach saturation (minimum of resistance) even after an hour (for sensors with Li, saturation is reached within a few tens of minutes). As with NO
2, the sensitivity of the sensors with Li to O
3 is significantly higher and increases with the Li content (
Table 3). However, the recovery is relatively slow for all sensors (an hour for Cu–Ti and a few hours for Cu–Ti–Li
low and Cu–Ti–Li
high); in addition, for the sensors with Li, it is incomplete (the sensitivity decreases by several tens of percent).
3.5.3. Cl2 Response
Figure 11 shows the response of the sensors to 10 ppm chlorine. In all cases, the sensors react very strongly (with a significant decrease of resistance) and quickly (in a few minutes). In this case, it also turns out that the higher the Li content, the stronger the response of the sensor (
Table 3). For Cl
2, however, the recovery is slow for all sensors (hours), and incomplete (the sensitivity decreases by about 20% for Cu–Ti, and 45% for Cu–Ti–Li
low and Cu–Ti–Li
high).
For comparison with the data obtained in this work,
Table 4 shows some published results related to sensing performance of the CuO–TiO
2 sensors tested in various oxidizing and reducing gases. The sensitivity
S was calculated as the ratio of
Rgas/Rair. As can be seen, the results of sensing of CuO–TiO
2 in an NO
2 and H
2 atmosphere (although at different concentrations, as we used in this work) are similar to our experimental values.
Table 5 shows the evaluated detection limits of the sensors for the oxidizing gases NO
2, O
3, and Cl
2 at the selected operating temperature of 200 °C. Several important aspects can be seen:
The sensors with Li are very sensitive to all tested oxidizing gases; the sensitivity is higher for sensors with a higher Li content; in contrast, the sensor without Li is significantly less sensitive to oxidizing gases.
The sensors do not show selectivity for oxidizing gases.
For nitrogen dioxide, the detection limit is around ppm or a fraction thereof, which is several times higher than the recommended odor threshold concentration of 0.1–0.4 ppm [
57].
For chlorine, an odor threshold of 0.2–0.4 ppm has been acknowledged [
58], which corresponds to the sensitivity of the lithium-doped sensors.
For ozone, the detection limits of lithium-doped sensors are similar to or better than the ozone odor threshold of 0.01–0.02 ppm [
59].
Thus, one can state that the detection limits of the Cu–Ti–Lilow and Cu–Ti–Lihigh sensors prepared so far without the optimizing Li content and sensor structure are promising to detect the hazardous gases O3 and Cl2, and somewhat less NO2. It can be assumed that their sensitivity and response parameters can be further improved.
The results of the experiments show that lithium in the heterogeneous Cu–Ti systems significantly increases the sensitivity of the sensors to oxidizing hazardous gases. According to
Table 3, the sensitivity of Cu–Ti–Li
high compared to Cu–Ti–Li
low is several times higher—twice for NO
2, four times for O
3, and more than five times for Cl
2. The ratio of the Li content in Cu–Ti–Li
high and Cu–Ti–Li
low (based on the NDP analysis,
Table 2) is about 7.17. This raises the question concerning what is the cause of the increase in sensitivity of the sensors when Li is incorporated into their structure. According to the TOF-SIMS measurements, it turns out that the depth distribution of the building elements in the sensors (especially after annealing) is very inconsistent. There are areas that indicate a separation of the elements, e.g., the Cu-rich zone at the surface, which either overlap or mix with the Li-rich zone, under which the Ti-rich zone is formed. CuO–TiO
2 heterojunctions are dispersed in these areas, but also form a band below the surface (at a depth of about 15–20% of the total film thickness); the closest to the surface is the band in Cu–Ti–Li
high (
Figure 8b).
It is not clear whether Li (resp. lithium oxide) participates in any gas-sensing process as does the active Cu and Ti oxides. However, it is conceivable that this element with high diffusivity and immiscibility in binary systems (copper and lithium show no alloying and chemical intermixing under normal circumstances) affects the structure, elemental and phase separation, and surface morphology. It acts as an agent that to some extent, according to a greater or lesser content, shapes the structure of the composites and their surfaces. Additionally, since the performance of the sensors also depends on the surface properties [
17], it can be suggested that Li acts on the properties of the sensors through the surface morphology. It is important for the sensors that the band of the active phases (i.e., heterojunctions, where the interaction of the target gas molecules with the metal oxide phases takes place) is exposed as much as possible to the detected gas, i.e., that its area is as large as possible and closest to the surface. Moreover, this phenomenon is related to the surface morphology—with great roughness, the real surface area increases, and thus also the dimensions of the active phase band. As mentioned above in the AFM study, the real area of the sensors increases with the amount of Li: for Cu–Ti–Li
high; the real area is more than 6% larger than Cu–Ti–Li
low. This can be related to the increase in the sensitivity of the sensors. The comparison of sensitivity and real surface areas of Cu–Ti and Cu–Ti–Li
low is special. It turns out that the roughness (and real area) of the surface is greater in Cu–Ti, but the sensitivity to the tested gases is lower. This is surprising, but it may be due to the smaller number of heterojunctions formed in the Cu–Ti–Li
low sensor, as evidenced by the RBS analysis (in Cu–Ti–Li
low, relatively less oxidized Cu and Ti atoms were recorded due to the strong Cu barrier formed on the sample surface).
There is also an issue of a slower recovery time of the Li-doped sensors. It can be assumed that when the molecules of the aggressive gas penetrate towards the active centers below the surface, some interactions with Li (but also with unbound Cu and Ti) will occur, which may lead to the formation of other compounds (e.g., lithium nitride, copper oxide, titanium oxide, lithium chloride, etc.), blocking and restricting the access of the tested gases (including synthetic air). The removal of these parasitic components from the sensor structure is slow, leading to the observed phenomena of several-hour-lasting and incomplete recovery.
Thus, one can conclude that the sensitivity of the sensors based on Cu, Ti, and Li (supplemented with oxygen after annealing in the air) is strongly influenced by (i) the number of heterojunctions (the more heterojunctions are created, the greater the sensor sensitivity); and (ii) their depth distribution (the closer the heterojunctions are to the surface, the greater the sensitivity of the sensor). When creating the sensors, several factors play their (even opposite) roles. The number of heterojunctions depends on the efficiency of the oxidation process, i.e., the creation of suitable thermal conditions, which, however, should not allow the formation of the unwanted, inactive phases; however, they also arise when creating heterojunctions. The formation of zones of heterojunctions near the surface is linked to the limitation of the process of separation of the elements, which, however, takes place in the conditions necessary for the oxidation of the Cu and Ti elements. Lithium seems to play an interesting, positive role—it diffuses towards the surface during deposition and annealing, thus limiting the formation of the Cu surface barrier (which otherwise would prevent oxidation of the lower layers). In addition, it has a strong effect on the surface morphology, which can significantly affect the sensitivity of the sensors (the greater the roughness of the surface, the larger its real area, which allows better access of the gas to the active phases, which results in higher sensitivity of the sensors). The construction of optimal Li-doped heterogeneous sensors thus requires a suitable strategy that should assess the mentioned roles, thus effectively reducing their negative aspects. However, this will require further detailed research.
4. Conclusions
Heterogeneous gas sensors based on CuO–TiO2 composites doped with a low and high relative content of Li were tested in several oxidizing gases (NO2, O3, and Cl2), as well as reducing hydrogen H2. The thin film samples were prepared in two steps—by ion beam sputtering of high purity Cu, Ti, and Li targets and by thermal annealing in air. The composition and elemental depth profiling were analyzed by nuclear analytical methods, namely, NDP, RBS, and TOF-SIMS, and the surface morphology by scanning probe microscopy—AFM. The response (measured as the transient resistance) of the sensors to oxidizing and reducing gases was monitored in a flow cell with a controlled inlet of the tested gases (diluted in synthetic air).
The results showed that the CuO–TiO2-based chemiresistors are promising for the detection of NO2, O3, and Cl2. Although they form a complex structure, they are very sensitive and can operate even at a relatively low temperature (200 °C), exhibiting a p-type conductivity. It was demonstrated that doping with lithium significantly increases the sensing efficiency of the sensors; the best improvement was indicated for the sensor with the highest Li content. The reason is attributed to the influence of lithium on the surface morphology, which affects the sensitivity of the sensors. The additional tests performed with the reducing gas showed that the sensors are not sensitive to H2; they show only a poor or negligible response.
The first experiments with the heterogeneous sensors CuO–TiO2 doped with Li yielded promising results. It is, therefore, appropriate to perform further investigations and monitor the behavior of the optimized sensors with incorporated Li in different oxidizing and reducing environments.


 ,
, 


