 Andrea Di Cesare1†
 Nina Dzhembekova2†
 Pedro J. Cabello-Yeves3†
 Ester M. Eckert1
 Violeta Slabakova2Nataliya Slabakova2
 Elisaveta Peneva4Roberto Bertoni1
 Gianluca Corno1
 Michaela M. Salcher5
 Lyudmila Kamburska1Filippo Bertoni6
 Francisco Rodriguez-Valera3,7
 Snejana Moncheva2
 Cristiana Callieri1*
- 1National Research Council (CNR), Institute of Water Research (IRSA), Verbania, Italy
- 2Institute of Oceanology “Fridtjof Nansen” – Bulgarian Academy of Sciences, Varna, Bulgaria
- 3Evolutionary Genomics Group, Departamento de Producción Vegetal y Microbiología, Universidad Miguel Hernández, San Juan de Alicante, Spain
- 4Faculty of Physics, Sofia University “St. Kliment Ohridski”, Sofia, Bulgaria
- 5Biology Centre Czech Academy of Science (CAS), Institute of Hydrobiology, Czechia
- 6Museum für Naturkunde, Berlin, Germany
- 7Laboratory for Theoretical and Computer Studies of Biological Macromolecules and Genomes, Moscow Institute of Physics and Technology, Dolgoprudny, Russia
Picocyanobacteria of the genus Synechococcus are major contributors to global primary production and nutrient cycles due to their oxygenic photoautotrophy, their abundance, and the extensive distribution made possible by their wide-ranging biochemical capabilities. The recent recovery and isolation of strains from the deep euxinic waters of the Black Sea encouraged us to expand our analysis of their adaptability also beyond the photic zone of aquatic environments. To this end, we quantified the total abundance and distribution of Synechococcus along the whole vertical profile of the Black Sea by flow cytometry, and analyzed the data obtained in light of key environmental factors. Furthermore, we designed phylotype-specific primers using the genomes of two new epipelagic coastal strains – first described here – and of two previously described mesopelagic strains, analyzed their presence/abundance by qPCR, and tested this parameter also in metagenomes from two stations at different depths. Together, whole genome sequencing, metagenomics and qPCR techniques provide us with a higher resolution of Synechococcus dynamics in the Black Sea. Both phylotypes analyzed are abundant and successful in epipelagic coastal waters; but while the newly described epipelagic strains are specifically adapted to this environment, the strains previously isolated in mesopelagic waters are able, in low numbers, to withstand the aphotic and oxygen depleted conditions of deep layers. This heterogeneity allows different Synechococcus phylotypes to occupy different niches and underscores the importance of a more detailed characterization of the abundance, distribution, and dynamics of individual populations of these picocyanobacteria.
Introduction
The Black Sea is a unique marine basin, largely isolated from the global ocean, and characterized by an extensive drainage basin, strong vertical stratification, variable salinity (from 7.3 in epipelagic to ca. 20–22 PSU in mesopelagic waters) and high concentrations of hydrogen sulfide content below 150–200 m (Konovalov et al., 2005; Stanev et al., 2014). These conditions confine aerobic biological activity to the upper 100–150 m of the water column, while the water mass below these depths is usually considered inhospitable and restricted to anaerobic microbes (Zaitsev and Mamaev, 1997; Kucuksezgin and Pazi, 2003). The recent recovery of Synechococcus cells living in deep anoxic water layers (Callieri et al., 2019) challenged our knowledge of this part of the Black Sea and its biogeochemical dynamics, and of Synechococcus’ role in them.
Picocyanobacteria of the genus Synechococcus are small autotrophic unicellular organisms (0.6–2 μm), widespread in aquatic ecosystems (e.g., Callieri et al., 2012; Flombaum et al., 2013; Sohm et al., 2016), possessing light-harvesting phycobilisomes with antenna pigments that enable them to use a wide range of wavelengths and colonize different ecological niches (e.g,. Ahlgren and Rocap, 2006; Six et al., 2007). Despite Synechococcus’ remarkable adaptability to different salinities (Fuller et al., 2003; Kim et al., 2018), temperatures, Fe and nutrient concentrations (Fuller et al., 2006; Callieri, 2017; Zwirglmaier et al., 2008), the detection of Synechococcus in an extreme environment like the deep anoxic Black Sea was unexpected – even at relatively low concentrations. This is because, as oxygenic autotrophs, Synechococcus have been usually considered restricted to the photic layer.
Because of their sheer abundance, broad metabolic potential, and widespread distribution, these cyanobacteria are major contributors to global primary production (Flombaum et al., 2013): marine Synechococcus alone contributes to around 21% of the total primary production of oceans (Jardillier et al., 2010), with a projected increase of 14% in the intertropical regions over the next 100 years (Flombaum et al., 2013). But their significance is not limited to the global scale of their impact: mounting evidence suggests that rare microbial species can have disproportionate roles in biogeochemical cycles and microbiome functions (Jousset et al., 2017). While at a broader level, Synechococcus appears as a physiologically plastic, generalist genus, the increased resolution made possible by improving genomic techniques allows us to see Synechococcus as a complex suite of specialists that can cover narrow niches (Farrant et al., 2016).
Thus, understanding Synechococcus’ ecological role, and better characterizing phylotype-specific spatial and vertical distribution in an environment like the Black Sea promises to shed light on the dynamics of this important cyanobacterial group.
Expanding on earlier studies of the distribution, abundance, and dynamics of Synechococcus in the Black Sea, which concentrated on the euphotic layer (Uysal, 2000, 2001, 2006; Feyzioglu et al., 2004, 2015), we investigated the correlation of total Synechococcus counts with environmental variables also deeper in the water column. To increase the resolution of our analysis, we also compared these results to phylotype-specific abundances, distribution patterns, and genetic makeup of two different sets of Black Sea strains. During different field campaigns, we successfully isolated four pure monoclonal Synechococcus strains from the western part of the Black Sea: two from an off-shore mesopelagic station (strains BS55D and BS56D) – previously reported (Callieri et al., 2019) – and two new strains (BSA11S and BSF8S) – first described here – isolated from a coastal epipelagic station (referred to as BSD strains and BSS strains, based on their original isolation sources at 750 m off-shore mesopelagic and 6.5 m coastal epipelagic, respectively). We sequenced and compared their genomes to predict their potential role in the Black Sea microbial ecosystem. These data could provide a proxy for their plasticity and adaptation to different environmental conditions, and allow us to understand whether the strains are strictly adapted to specific conditions or their physiological plasticity allows them to inhabit different environments. Moreover, we designed phylotype-specific primers targeting rpoC1 genes since these sequences provide a robust genetic marker for Synechococcus diversity in several marine environments (Palenik, 1994; Tai and Palenik, 2009). In order to better characterize these phylotypes’ distribution and abundance, we also performed qPCR assays on DNA extracted from various Black Sea samples from two vertical profiles in the western and eastern deep part of the Black Sea and in coastal epipelagic sites. Finally, we tested the abundance of these phylotypes also in metagenomes from two stations at different depths.
Materials and Methods
Study Site, Sampling Activity, and Chlorophyll-a Measurement
Seawater samples (N = 23) were collected during two successive cruises (aboard the R/V Mare Nigrum and the R/V Akademik) at 10 sampling stations located in the north-western, western and south-eastern part of the Black Sea from 17 May to 22 June 2016 (Figure 1 and Supplementary Table S1). Water samples throughout the whole column were collected at discrete depths with a 12-Go Flo bottle CTD rosette sampler system (SBE-911 CTD) outfitted with a fluorometer for measuring in situ fluorescent profiles. At the epipelagic coastal stations, only surface samples (Surface Homogeneous Layer) were collected, with the exception of three stations (K10044, GE-8, GE-10) where an additional sample was taken at the thermocline. At the two mesopelagic (off-shore) stations samples were collected as follows: at station 307: 25, 42, 110, 500, 750, 1000 m; at station JOSS-12: 12.3, 31.2, 75, 750, 1007 m (including the thermocline, the DCM, Deep Chlorophyll Maximum, and the oxycline) (Supplementary Table S1).
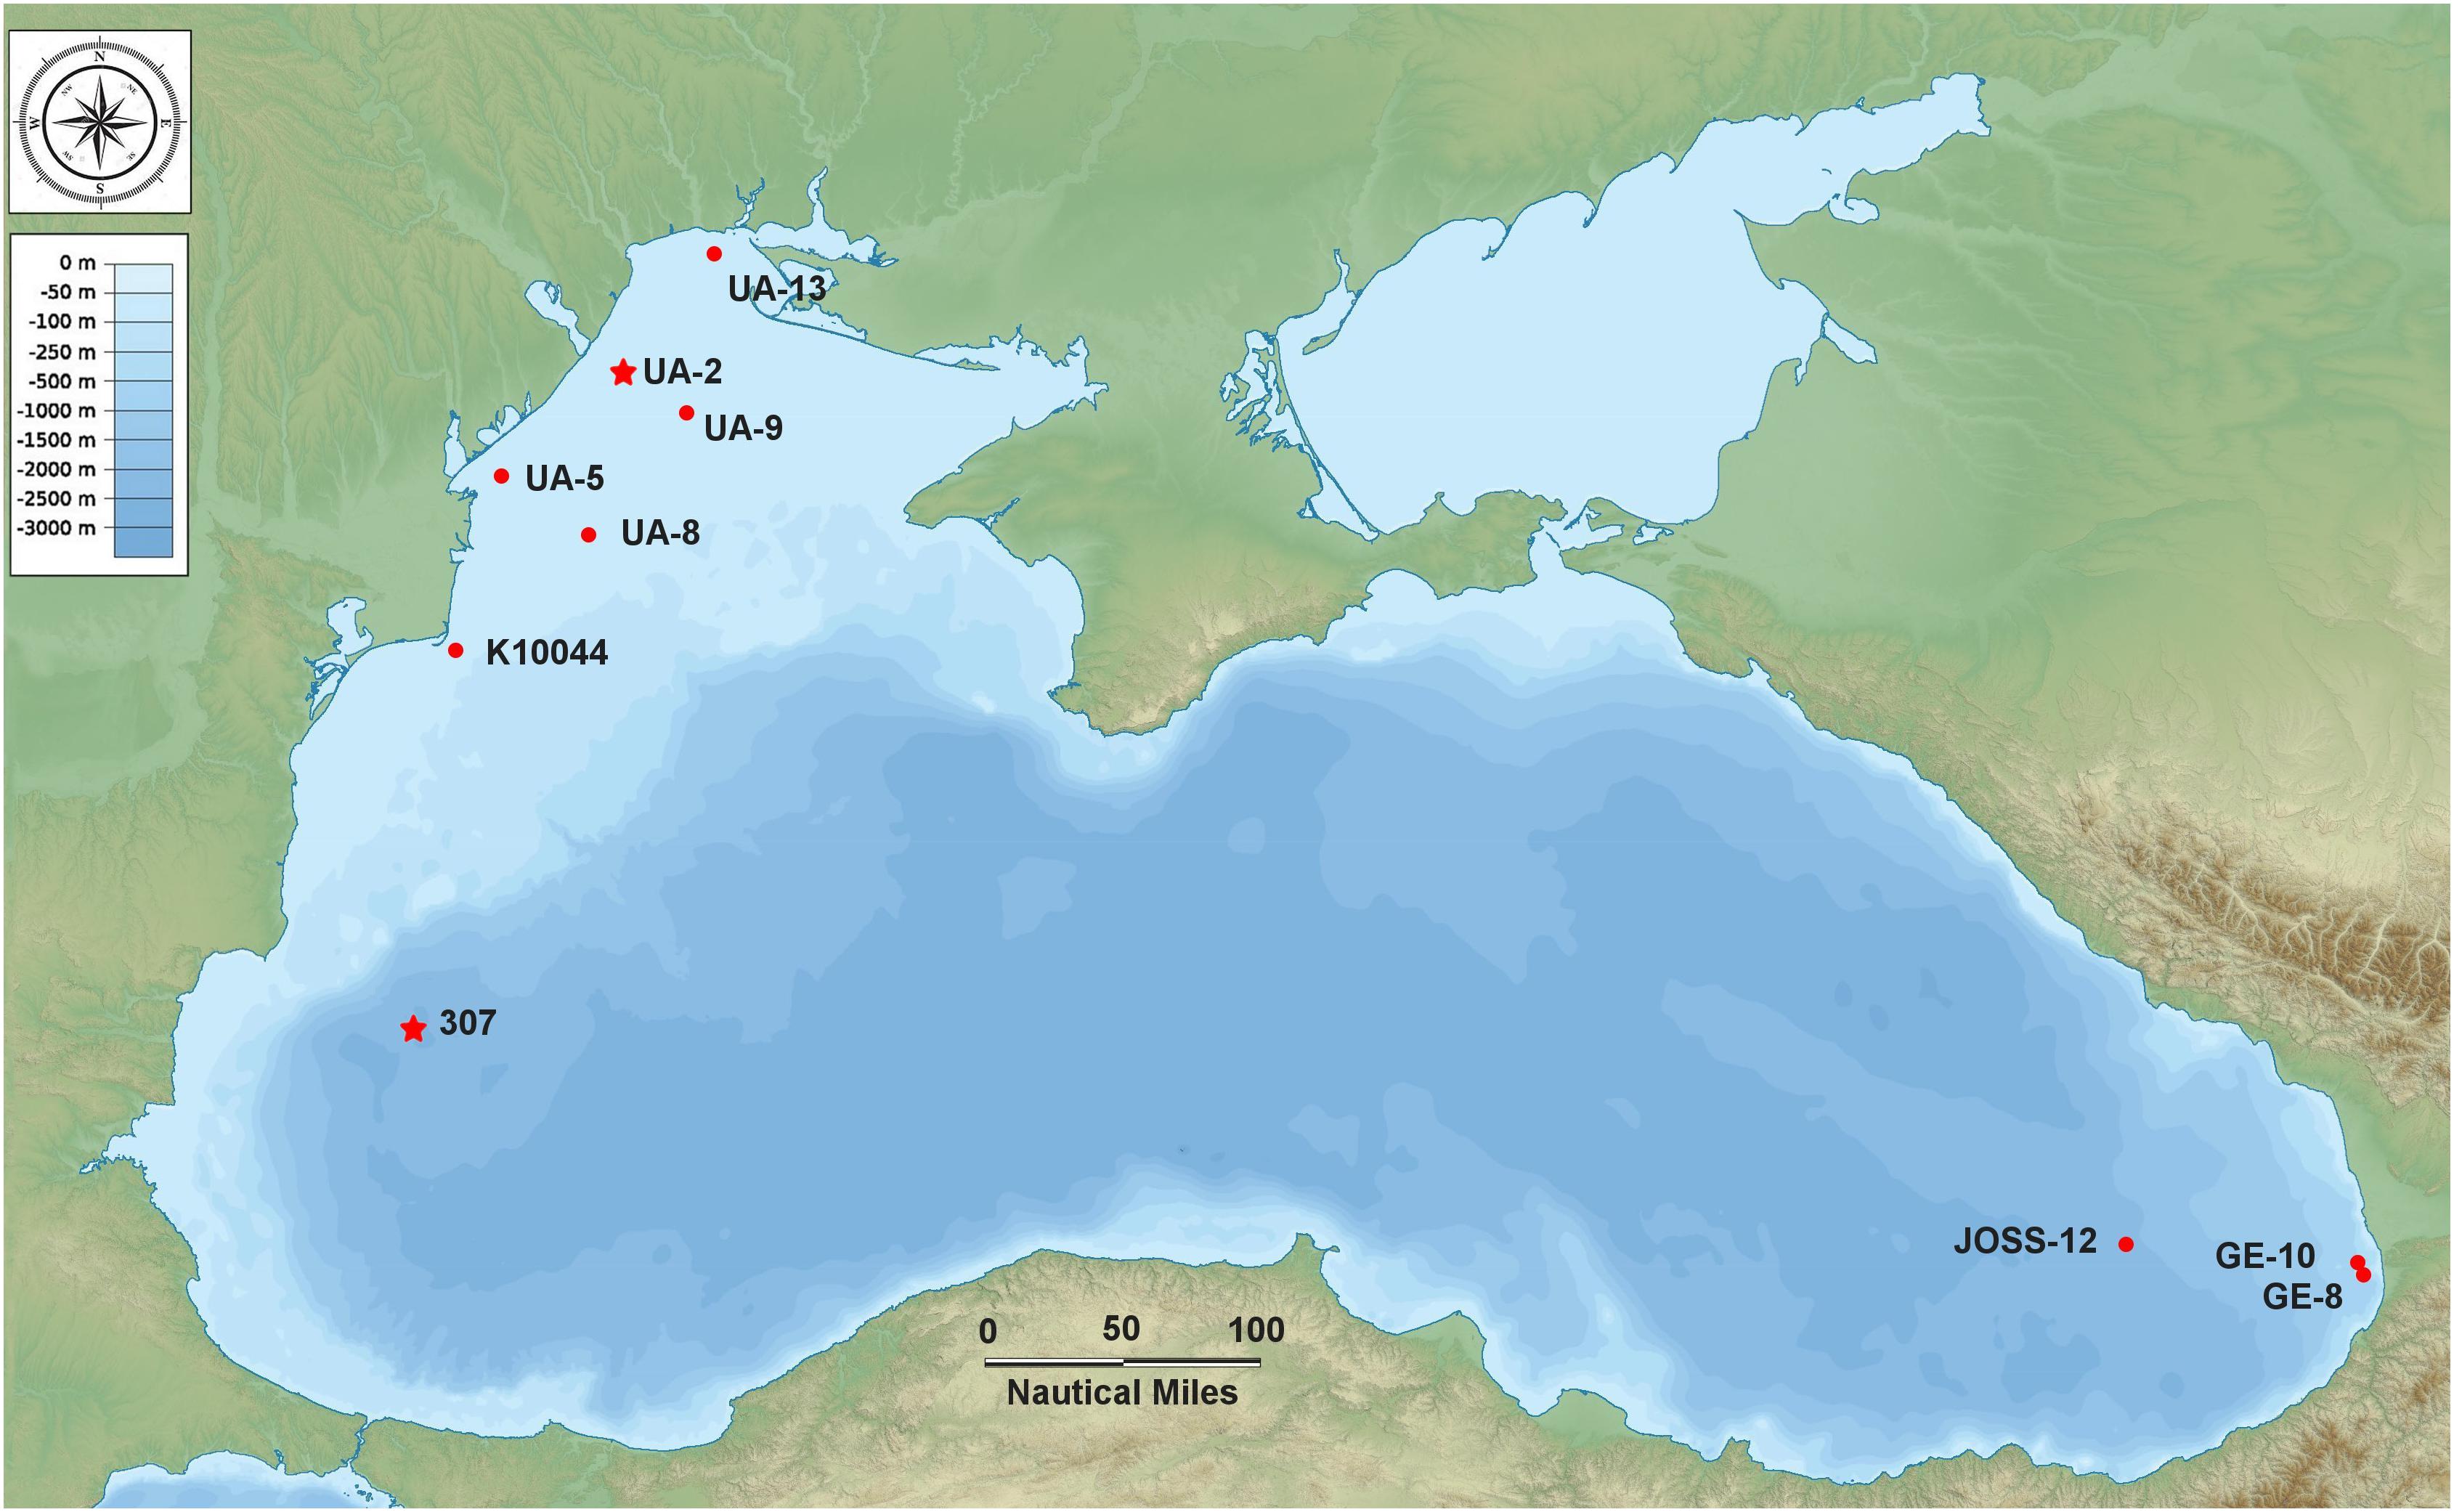
Figure 1. Map of the Black Sea indicating the 10 sampling stations (the two stars indicate the stations where the strains BSD and BSS were isolated).
For DNA analysis a variable volume of water (1.7–5.0 L), from all sites and depths (except for one sample from station UA-9, for technical reasons), was filtered using 0.22 μm SterivexTM Filter Units (Merck) and the filters were stored at -20°C. Additional samples for metagenome analyses were collected from St. 301 (5 m) and St. 307 (5, 30, 150, and 750 m) in October 2019. Up to 6.9 L of sea water from each sampling depth were filtered through a series of 20 μm Nylon Net filters (Millipore), 5 μm polycarbonate membrane filters (Millipore), and 0.22 μm SterivexTM Filter Units (Merck), which were used to sequence the metagenomes. For flow cytometric analyses, 20 ml of water from each sample were preserved with 1% formaldehyde (final concentration), kept at 4°C in the dark and counted within 6 days. Physico-chemical properties of sea water (temperature, salinity, and nutrients – phosphate, silicate, nitrate, nitrite and ammonia) and chlorophyll-a were also measured at each station. Temperature and salinity were measured in situ with SBE-911 CTD system. Nutrients were analyzed using standard methods (Solorzano, 1969; Grasshoff et al., 1999). For chlorophyll-a analysis water samples were filtered through GF/F Whatman filters with vacuum pump (Millipore) at < 0.2 atm pressure. The filters were stored at −20°C until lab analysis. The chlorophyll-a retained by the filters was extracted in 90% cold acetone for 18–20 h at + 8°C - +10°C in a refrigerator. After grinding for 1 min, the extract was centrifuged (ALC, mod. PK 130) at 7000 r/min for 10 min. The spectrophotometric measurements (Nova 400, Merck Spekol 11) were done at the following wavelengths: 750, 665, 663, 645, 630, 480, and 430 nm. After acidification with 1N HCl, within 5 min the extract was measured again at 750 and 665 nm. Three replicates were measured for each sample. The difference between the cuvettes (optical length 5 cm) and the turbidity did not exceed 0.002 at 750 nm. For the calculations the equations of Jeffrey and Humphrey (1975) were used. The precision of the method is 0.1 (mg m–3) and the error does not exceed 10% (Edler, 1979).
Flow Cytometry
The counting was performed using the Flow Cytometer Accuri C6 (Becton Dickinson, Oxford, UK), equipped with a 20 mW 488 nm Solid State Blue Laser and a 14.7 mW 640 nm Diode Red Laser, and 4 fluorescence emission channels. Light scattering signals (forward scatter FSC and side scatter SSC), green fluorescence (FL1 channel = 533/30 nm), orange fluorescence (FL2 channel = 585/40 nm), and red fluorescence (FL3 channel > 670 nm and FL4 channel 675/25 nm) were acquired to discriminate the distinct microbial groups. The counting was done using density plot of FL2-H vs. FL3-H. All data were acquired at a pre-set flow rate of 35 μL min–1, keeping the number of total events below 1000 per second. The BD Accuri C6 software (v. 1.0.264.21) was used for data processing.
Bacteria were counted by staining the samples with SYBR Green I (1:10,000 final concentration; Molecular Probes, Thermo-Invitrogen). Density plots of FSC vs. FL1 allowed for optimal distinction between the stained microbial cells and background noise, with a threshold value of 1000 applied on the FL1-H channel and 500 on FSC-H channel.
During strain isolation, an epifluorescence microscope (Zeiss Axioplan) equipped with an HBO 100 W lamp, a Neofluar 100 × objective plus 1.25 × additional magnification and filter sets for blue (BP450-490, FT510, LP520) and green light excitation (LP510-560, FT580, LP590), was used to check the state of the cultures. To calibrate the automatic data acquisition and to validate cell counts, random samples were checked at the epifluorescence microscope (Zeiss Axioplan, Germany).
Synechococcus spp. Strain Isolation
Synechococcus strains BS55D and BS56D were previously isolated from samples collected from 750 m at station 307 on 25 June and 28 July 2015 (Callieri et al., 2019), and are here referred to as mesopelagic off-shore BSD (Black Sea Deep) strains. In another field campaign on 17 May 2016 samples were collected from surface coastal water at station UA-2, from which the Synechococcus strains BSF8S and BSA11S were isolated, referred to here as epipelagic coastal BSS (Black Sea Surface) strains.
The detailed description of the isolation protocol was published in Callieri et al. (2019). The cells concentrated on a polycarbonate filter were incubated in BG11 prepared using 750 m Black Sea water, 0.2 μm filtered and sterilized. The use of the antibiotic cycloheximide (inhibition of peptide synthesis in eukaryotes) helped to eliminate eukaryotes from the enrichment, and the final purification to obtain a monoclonal strain was performed using flow cytometric single cell sorting with an InFlux V-GS flow cytometer (Becton Dickinson Inc., New Jersey, US) (Callieri et al., 2013). The vials were placed in an incubator held at 20°C and low light (10–15 μmol photons m–2 s–1).
DNA Extraction of Synechococcus Cells From Field Samples and From Strains
The SterivexTM filters (22 out of 23) from the field samples were cut into pieces and the DNA extraction was performed in triplicate using PowerSoil® DNA Isolation Kit (Qiagen) according to the manufacturer’s instruction. The same protocol was applied for the DNA extraction from the pelleted cultured strains (BSA11S and BSF8S). DNA from metagenomic samples was extracted with phenol-chloroform methodology (Martín-Cuadrado et al., 2007). Filters were treated with CTAB lysis buffer and then with 1 mg ml–1 lysozyme and 0.2 mg ml–1 proteinase K (final concentrations) prior to the phenol/chloroform/isoamyl alcohol and the chloroform/isoamyl alcohol steps.
Sequencing, Assembly, Annotation, Genomic Comparison, and Phylogenomics of Black Sea Strains and Metagenomes
Black Sea Synechococcus sp. BS55D and BS56D (BSD strains) were previously sequenced and analyzed (Callieri et al., 2019). The cultures were pure monoclonal, not axenic cultures. Here we introduce two new strains isolated from surface (BSA11S and BSF8S) Black Sea waters; their DNA was extracted and sequenced as described previously for BSD strains (Callieri et al., 2019). Black Sea metagenomic samples were sequenced in an entire lane of Illumina HiSeq X Ten PE 2 × 150 bp (Novogene company), which provided 20 Gb of output for each sample.
All four strains analyzed here are draft genomes obtained in several contigs (42 and 44 contigs for BSA11S and BSF8S, respectively; 7 and 8 contigs for BS55D and BS56D, respectively), but their genomes are 100% complete assessed with Synechococcus specific markers with CheckM (Parks et al., 2015). Assembly of BSS strains was conducted with SPAdes (Bankevich et al., 2012) following careful, only-assembler and default k-mer parameters. Gene prediction was conducted with PRODIGAL (Hyatt et al., 2010). Annotation of CDS was done with BLAST (Altschul et al., 1997) and RAST (Overbeek et al., 2013), KEGG KO (Kanehisa et al., 2016), COG (Tatusov et al., 2001), and TIGR (Haft et al., 2001) databases. Genomic analysis was performed using the abovementioned tools and average nucleotide identities (ANI) between strains were calculated as described elsewhere (Goris et al., 2007). Core and flexible genes of Black Sea strains were determined with the GET_HOMOLOGUES software (Contreras-Moreira and Vinuesa, 2013) and their core/flexible genome was solely calculated among themselves. A maximum-likelihood phylogenomic tree with 396 universal markers and > 100 genomes of Synechococcus, Prochlorococcus, and Cyanobium from marine, brackish, euryhaline and freshwater habitats was built with PhyloPhlAn tool (Segata et al., 2013).
Primer Design and Synechococcus Phylotype Quantification by qPCR
The genomic sequences of the strains (BSD and BSS) were used to design the primers to quantify their specific rpoC1 gene, in order to estimate the difference in their abundance for all collected seawater samples. Sequences of the rpoC1 gene from all four strains were aligned using MUSCLE (Edgar, 2004) with the online multiple sequence aligner provided by EMBL-EBI1. Since the similarity between the rpoC1 sequences of the two BSD strains was 99%, and 100% between the BSS ones, only two primer pairs were designed, one for each set. Primers were designed specifically for the rpoC1 sequence of the strains with the goal to amplify fragments of around 100 bp and with a theoretical annealing temperature of around 60°C. Primers were designed using NCBI Primer BLAST (Ye et al., 2012) or Primer 3 (Untergasser et al., 2012) and target specificity was checked by BLAST. The chosen primers for the BSD strains were 816F- CACCTCTGACCTCAACGACC and 935R- TCCTGGAGCATCCGCTTTTC, and for the BSS strains 472F- GACCTCACCTACAAGCAACTCC and 570R-CACCTCAGGCTCGTTTTCTATC. None of the primer pairs had hits with 100%, thus the in silico specificity of the primer pairs was very high. Hits by single primers with 100% accuracy are summarized in Supplementary Table S2: only one match was a Synechococcus rpoC1 gene (primer 427F, non-target sequence accession number AF448108) and the sequences did not match the reverse primer. The annealing temperature of the primers was determined through a gradient PCR with annealing temperatures between 56 and 63°C (8 steps). This was done using the GoTaq GreenMasterMix (Promega) in 25 μl according to manufacturer’s instructions, the DNA of the strains, and the following protocol: initiation 95°C 1′, 30 times denaturation 95°C 0.5′, annealing 0.5′, elongation 72°C 1′, and the final extension 72°C 7′. Amplicons were visualized by agarose gel electrophoresis and an annealing temperature of 62°C was chosen for both primer pairs.
All DNA samples extracted from seawater were twofold diluted and tested for the abundance of rpoC1 genes using the two primers pairs. The qPCR assays were carried out using the RT-thermocycler CFX Connect (Bio-Rad Laboratories Inc., United States). qPCRs were performed in a volume of 20 μl containing 1XSsoAdvancedTM Universal SYBR® Green Supermix (Bio-Rad), 0.5 μM of each primer, 2 μl template DNA and autoclaved MilliQ water (Millipore) to the final volume. The program of qPCR was 95°C for 2 min, 35 cycles of 95°C for 15 s, 62°C for 30 s, and 72°C for 15 s. In order to evaluate the specificity of reaction, the melting curve analysis was performed from 60 to 95°C with increments of 0.5°C 5 s–1 and the amplicon size was verified by gel electrophoresis (an example of electrophoresis gel picture is showed in Supplementary Figure S1). The standard curves were done by a 10-fold dilution of the purified and quantified amplicon for each target as previously described (Di Cesare et al., 2013). The mean value and the standard deviation of the qPCR efficiency were 97.25 ± 6% and R2-values were always > 0.99. The limits of quantification (LOQ) were determined as previously described (Bustin et al., 2009), they were 11 and 23 copies μl–1 of the rpoC1 genes in the BSD and the BSS strains, respectively.
Recruitment Analysis of Synechococcus Phylotypes on Black Sea Metagenomes
To estimate the relative abundance of Synechococcus genomes we performed read recruitment and mapping, which was assessed considering BLASTN hits of the genome into the metagenomic reads at > 70% identity and > 50 bp of alignment length. Reads mapping at > 95% of identity were considered as belonging to the same Synechococcus species. Reads per Kb of genome per Gb of metagenome (RPKGs) at > 95% identity and > 50 bp of alignment length were also calculated for each genome on the different metagenomes.
Statistical Analyses
All statistics were conducted on 22 samples using the software R version 3.51. To see how similar samples were in terms of their physical and chemical properties Bray-Curtis dissimilarity was calculated using the data for station depth, temperature, salinity, PO4, NH4, and Si using vegan package version 2.5-6 (Oksanen et al., 2007). Clustering was depicted using hclust with average linkage of the samples. We tested how much of the variance was explained by the station characteristics (epipelagic coastal / epipelagic off-shore / mesopelagic off-shore, see Supplementary Table S3) and the sampling depth using PERMANOVA analysis (adonis command in vegan).
Statistical evaluation of the abundances of Synechococcus (flow cytometry and qPCR counts) and bacteria (flow cytometry counts) was done using two sets of models: (1) Related to the physical location of the organisms using the factors: sampling depth and the characterization of the station as epipelagic coastal / epipelagic off-shore / mesopelagic off-shore (model: abundance ∼ sampling depth + station characteristics). (2) Related to chemical and physical variables measured. For the latter, correlations between variables were evaluated using Pearson’s moment correlation and temperature, salinity, NH4 (correlated with PO4; r = 0.95), and Chl-a were chosen as variables for the models (model: abundance ∼ Temp + Salinity + NH4 + Chla). Models of set 1 and 2 are not independent since all chemical/physical variables tested varied significantly with station characteristics and station depth.
For rpoC1 of the BSD phylotype both occurrence (presence/absence data) and abundance (genes ml–1) were evaluated, whereas for rpoC1 of the BSS phylotype only presence/absence data was used. Linear models (lm) of log-transformed data were performed in all cases of abundance data (linear regression model), whereas for presence/absence data generalized mixed models (glm) with a binomial distribution of the data were conducted. The models were evaluated visually by plotting the residuals in order to find a model with the best fit. The results of these models were depicted in an ANOVA like manner using the ANOVA function from the package car (Version 3.0-8) (Fox and Weisberg, 2019).
Data Availability
BSD Black Sea Synechococcus genomes were previously published (Callieri et al., 2019) and are available in the NCBI-GenBank databases under the BioProject PRJNA419515. The novel coastal BSS strains are available under the BioProject number PRJNA556564. Synechococcus sp. BSA11S is codified by BioSample SAMN12359518 and GenBank accession number VNWP00000000. Synechococcus sp. BSF8S is codified by BioSample SAMN12359523 and GenBank accession number VOBS00000000. Black Sea metagenomic datasets were deposited under the NCBI database under the BioProject PRJNA638805.
Results
Environmental Factors
In the Surface Homogeneous Layer the temperature (T) ranged between 13.31 and 17.59°C and salinity (S) from 7.00 to 18.15 PSU, whereas in deep waters (500–1007 m) both T (8.9–9.04) and S (22.04–22.28) were almost constant (Supplementary Table S1). Concentrations of nutrients fluctuated, ranging from 0 to 204 μg L–1 for PO4; 0.5–2490 μg L–1 for NO3; 0–10 μg L–1 for NO2; 0–760 μg L−1 for NH4; and between 12 and 7500 μg L–1 for Si (Supplementary Table S1). Vertical profiles of phosphate and ammonia revealed higher values at station 307 compared to JOSS-12, while the opposite was observed for nitrate and silicon.
Surface chlorophyll-a (Chl-a) ranged from 1.84 (st. GE-8) to 14.30 μg L–1 (st. UA-5) and in general, higher Chl-a values were detected at coastal stations. The vertical distribution showed a Chl-a maximum at 31–42 m depth in the mesopelagic stations (0.79 μg L–1 at st. JOSS-12, and 0.55 μg L–1 at st. 307) (Supplementary Table S1). In contrast with previous observations, Chl-a concentrations in the deep water layers (below 75 m) were below detection limit of the method used.
Differences between the 22 analyzed samples were characterized using the Bray-Curtis distance, based on physical and chemical properties (station depth, temperature, salinity, PO4, NH4, Si). Permutational analysis of variance of the distance matrix (PERMANOVA) showed that 67% of variance between sampling points was explained by the station characteristics (epipelagic coastal / epipelagic off-shore / mesopelagic off-shore) and only 3% by the sampling depth. Thus, the different sampling sites are clearly grouped by their geographic location (Supplementary Figure S2 and Supplementary Table S4).
Total Synechococcus spp. and Bacterial Abundance by Flow Cytometry
Flow cytometry data showed the presence of Synechococcus in all stations and at all depths sampled, including the deep layers down to 1007 m. Total Synechococcus cell abundances ranged from 3.9 × 10² to 1.2 × 10⁵ cells ml–1 in the zone from surface to 100 m (halocline), and from 2.9 × 10² to 1.4 × 10³ cells ml–1 in deep waters (500–1007 m depth) (Figure 2). The peak of abundance was at the deep chlorophyll maximum (42 m at st. 307). Synechococcus abundances were not significantly correlated to the station characteristics nor to the sampling depth (Table 1). Similarly, no difference was found between chemical and physical properties and Synechococcus abundances (Table 2).
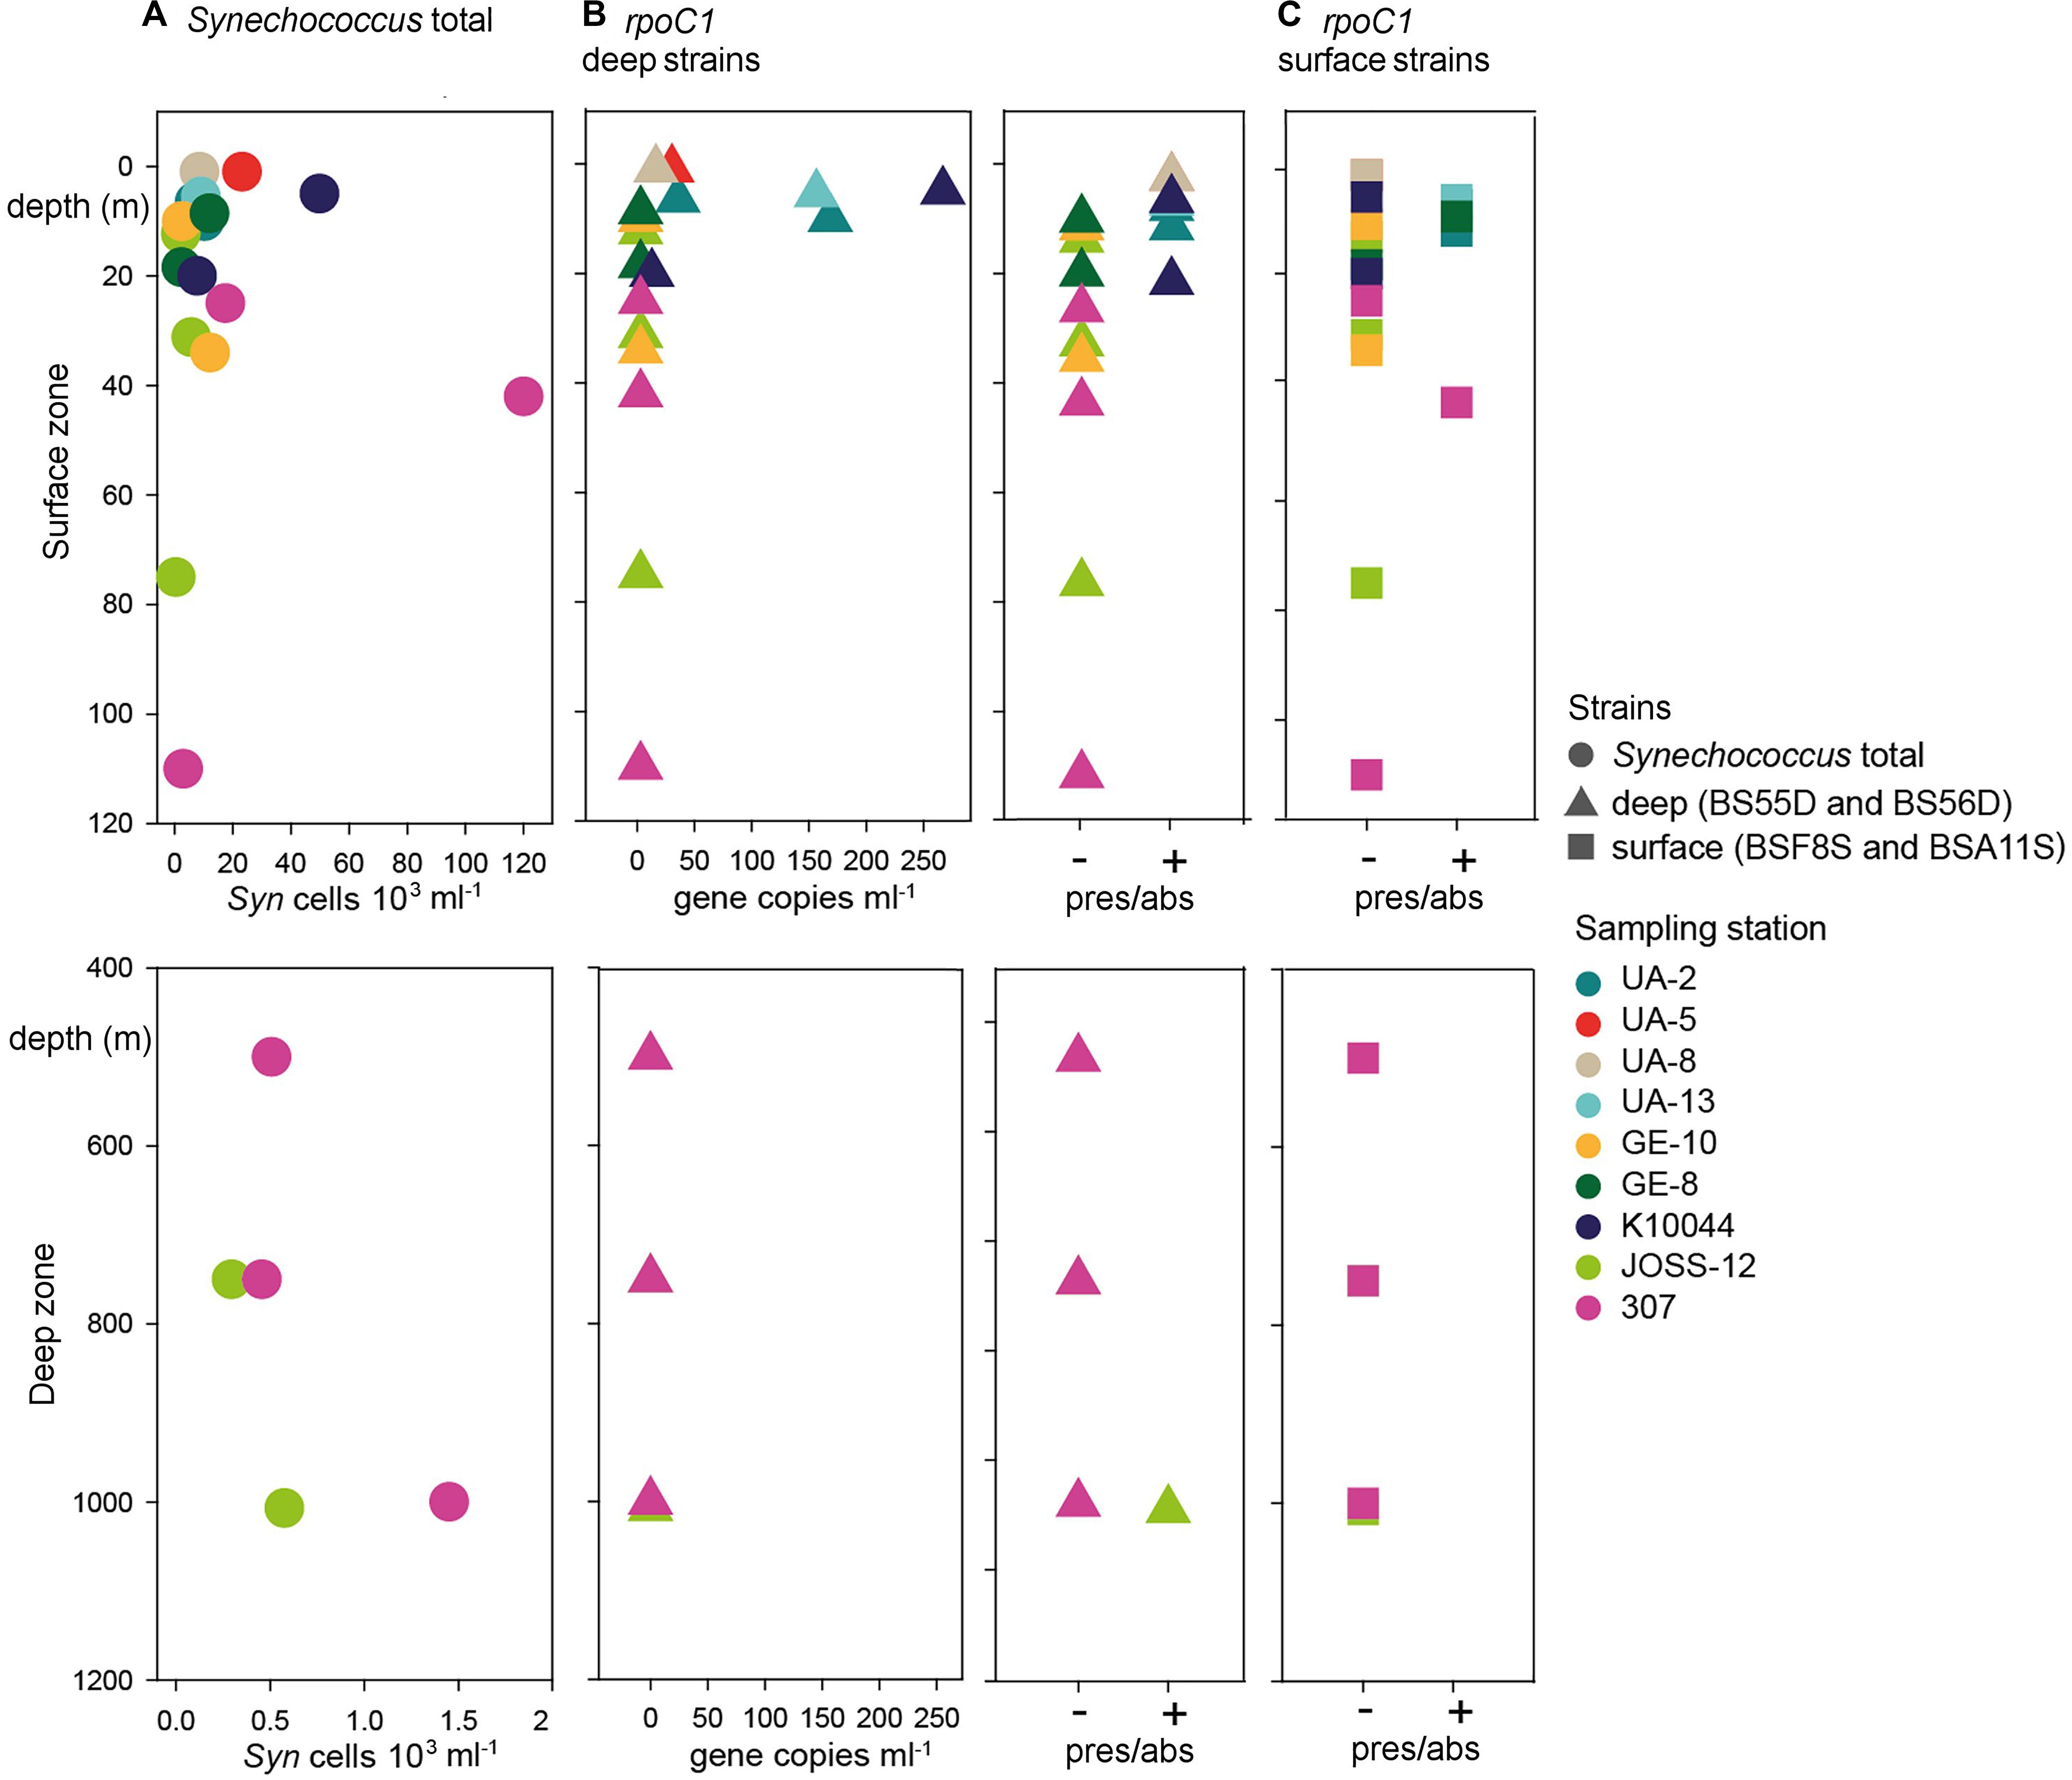
Figure 2. Abundance of Synechoccocus in the Black Sea. Upper panels: epipelagic zone between 0 and 120 m depth. Lower panels: Deep zone between 400 and 1200 m depth. (A) Synechococcus (Syn) cell abundance as determined by flow cytometry. Note that both X-axes are scaled differently in the upper and lower panels. (B) Left: abundance of rpoC1 gene copies affiliated with BSD strains BS55D and BS56D; Right: presence/absence of genes as determined by qPCR. (C) Occurrence of rpoC1 genes affiliated with BSS strains BSF8S and BSA11S. Colors code for the sampling stations and shapes for the type of data.
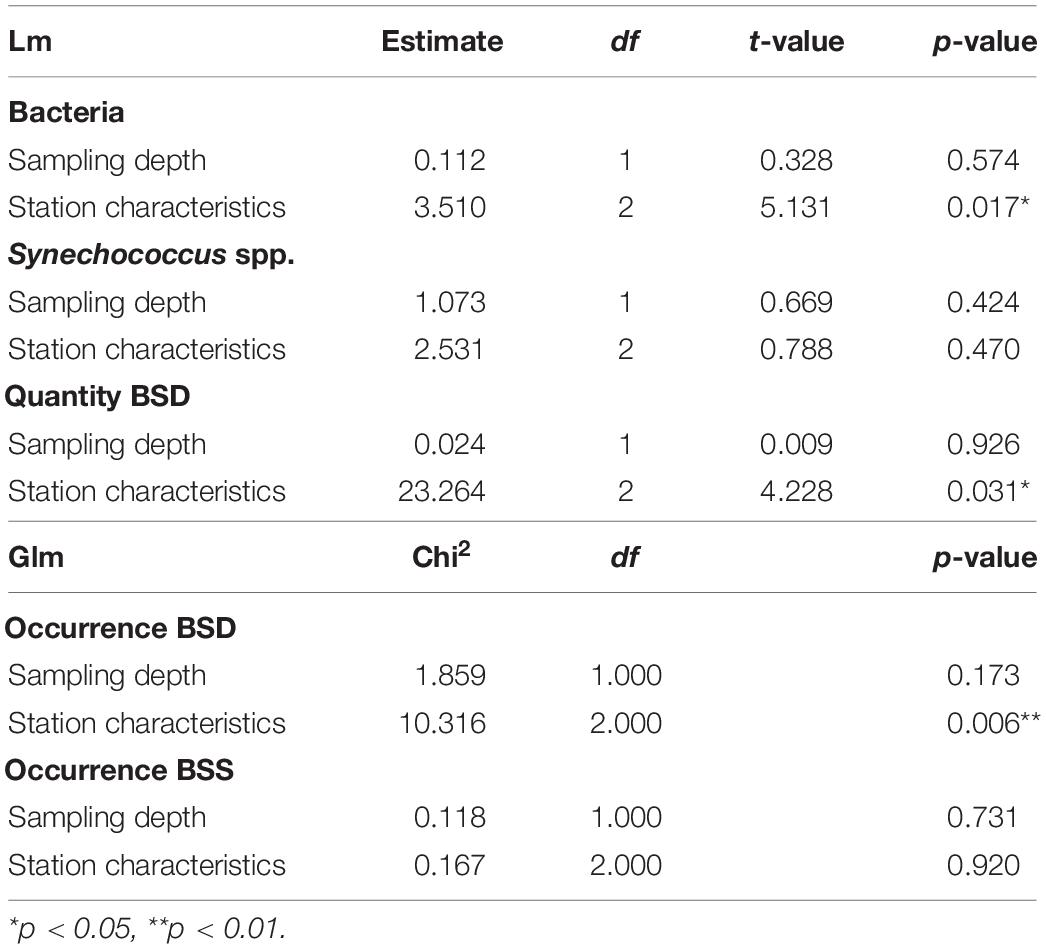
Table 1. Statistical results for the influence of station characteristics (epipelagic coastal, epipelagic off-shore, mesopelagic off-shore) and sampling depth on the abundance (lm) and occurrence (glm) of bacteria and Synechococcus spp. BSD (Black Sea Deep) phylotype, BSS (Black Sea Surface) phylotype.
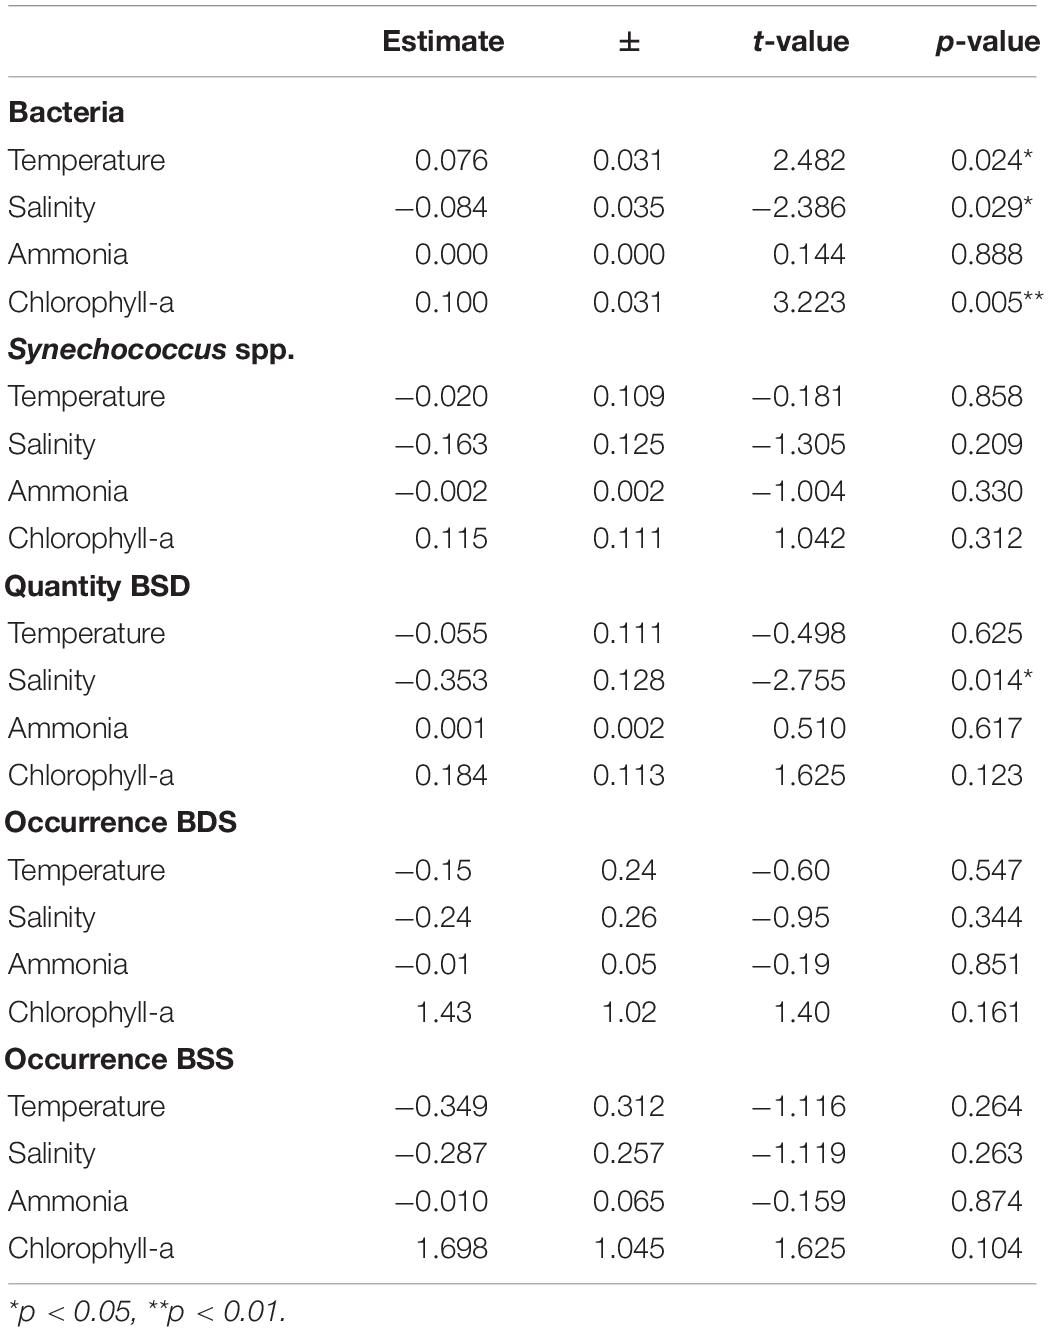
Table 2. Statistical results for the linear models on the influence of chemical and physical conditions on the abundance (lm) and occurrence (glm) of bacteria and Synechococcus spp. BSD (Black Sea Deep) phylotype, BSS (Black Sea Surface) phylotype.
We also quantified the total prokaryotic cell abundance (excluding Synechococcus), which ranged from a minimum of 1.5 × 10⁵ to a maximum of 2.1 × 10⁶ cells ml–1 reached in epipelagic waters (0–20 m depth) (Supplementary Table S1). Bacteria were significantly different between the sampling stations with different characteristics (epipelagic coastal / epipelagic off-shore / mesopelagic off-shore), however, no significant difference was found for depth (Table 1). Bacterial abundances were significantly positively influenced by Chl-a, and slightly influenced by temperature, or salinity, but not by NH4 (Table 2).
Phylotype-Specific Synechococcus Presence and Abundance
Through qPCR analysis we found BSD phylotypes more frequently than BSS ones. BSD were detected in low abundance in 36% of samples (95 rpoC1 gene copies ml–1 average concentration, Figure 2 and Supplementary Table S1), mainly in the northwest part of the Black Sea with higher abundances in surface waters (up to 269 rpoC1 gene copies ml–1 in 5 m depth). Interestingly, at station JOSS-12 these strains were present only in the sample from the deepest layer (1007 m depth), even if in low abundance (below LOQ).
BSS phylotypes occurred rarely and in very low abundance (below LOQ in most cases). They were detected by qPCR only in the upper water layers across the sampling sites. The maximum depth where BSS were detected was 42 m at station 307. In 14% of all samples, BSS and BSD phylotypes co-occurred (Figure 2 and Supplementary Table S1).
The total abundances of Synechococcus cells and the abundances of rpoC1 genes of BSD (the only set for which abundance was tested) were not correlated (Pearson’s coefficient 0.21). BSD was influenced by the station characteristics in terms of quantity and presence/absence, which was not the case for BSS (Table 1). Presence/absence of both tested rpoC1 genes was not related to any chemical/environmental factor tested, whereas the quantity of BSD related rpoC1 was negatively influenced by salinity (Table 2).
We also tested the presence of Black Sea phylotypes in five different sample depths: 5 m (St. 301) and 5, 30, 150, and 750 m (St. 307). We mapped the metagenomic reads with the Synechococcus genomes with BLASTN and showed recruitment plots at > 70% identity and > 50 bp of read-genome alignment lengths (Figure 3). We assessed the presence of any strain when reads mapped at > 95% of identity throughout the genome. All BLASTN reads with identities between 70 and 95% were related to other Synechococcus spp. Our results show that BS56D/BS55D phylotypes were found in both stations at the epipelagic layer of 5 m and were significantly less abundant with the increasing depth, but still detectable both at 30 m and in very low numbers at 750 m, which correlates well with the abovementioned qPCR results. Even if in very low numbers, we must highlight the presence of various reads mapping into the original deep isolate at 750 m. Nonetheless, it is evident that the preferred habitat for this strain was the epipelagic and photic layer, as the phylotype was rare in euxinic waters.
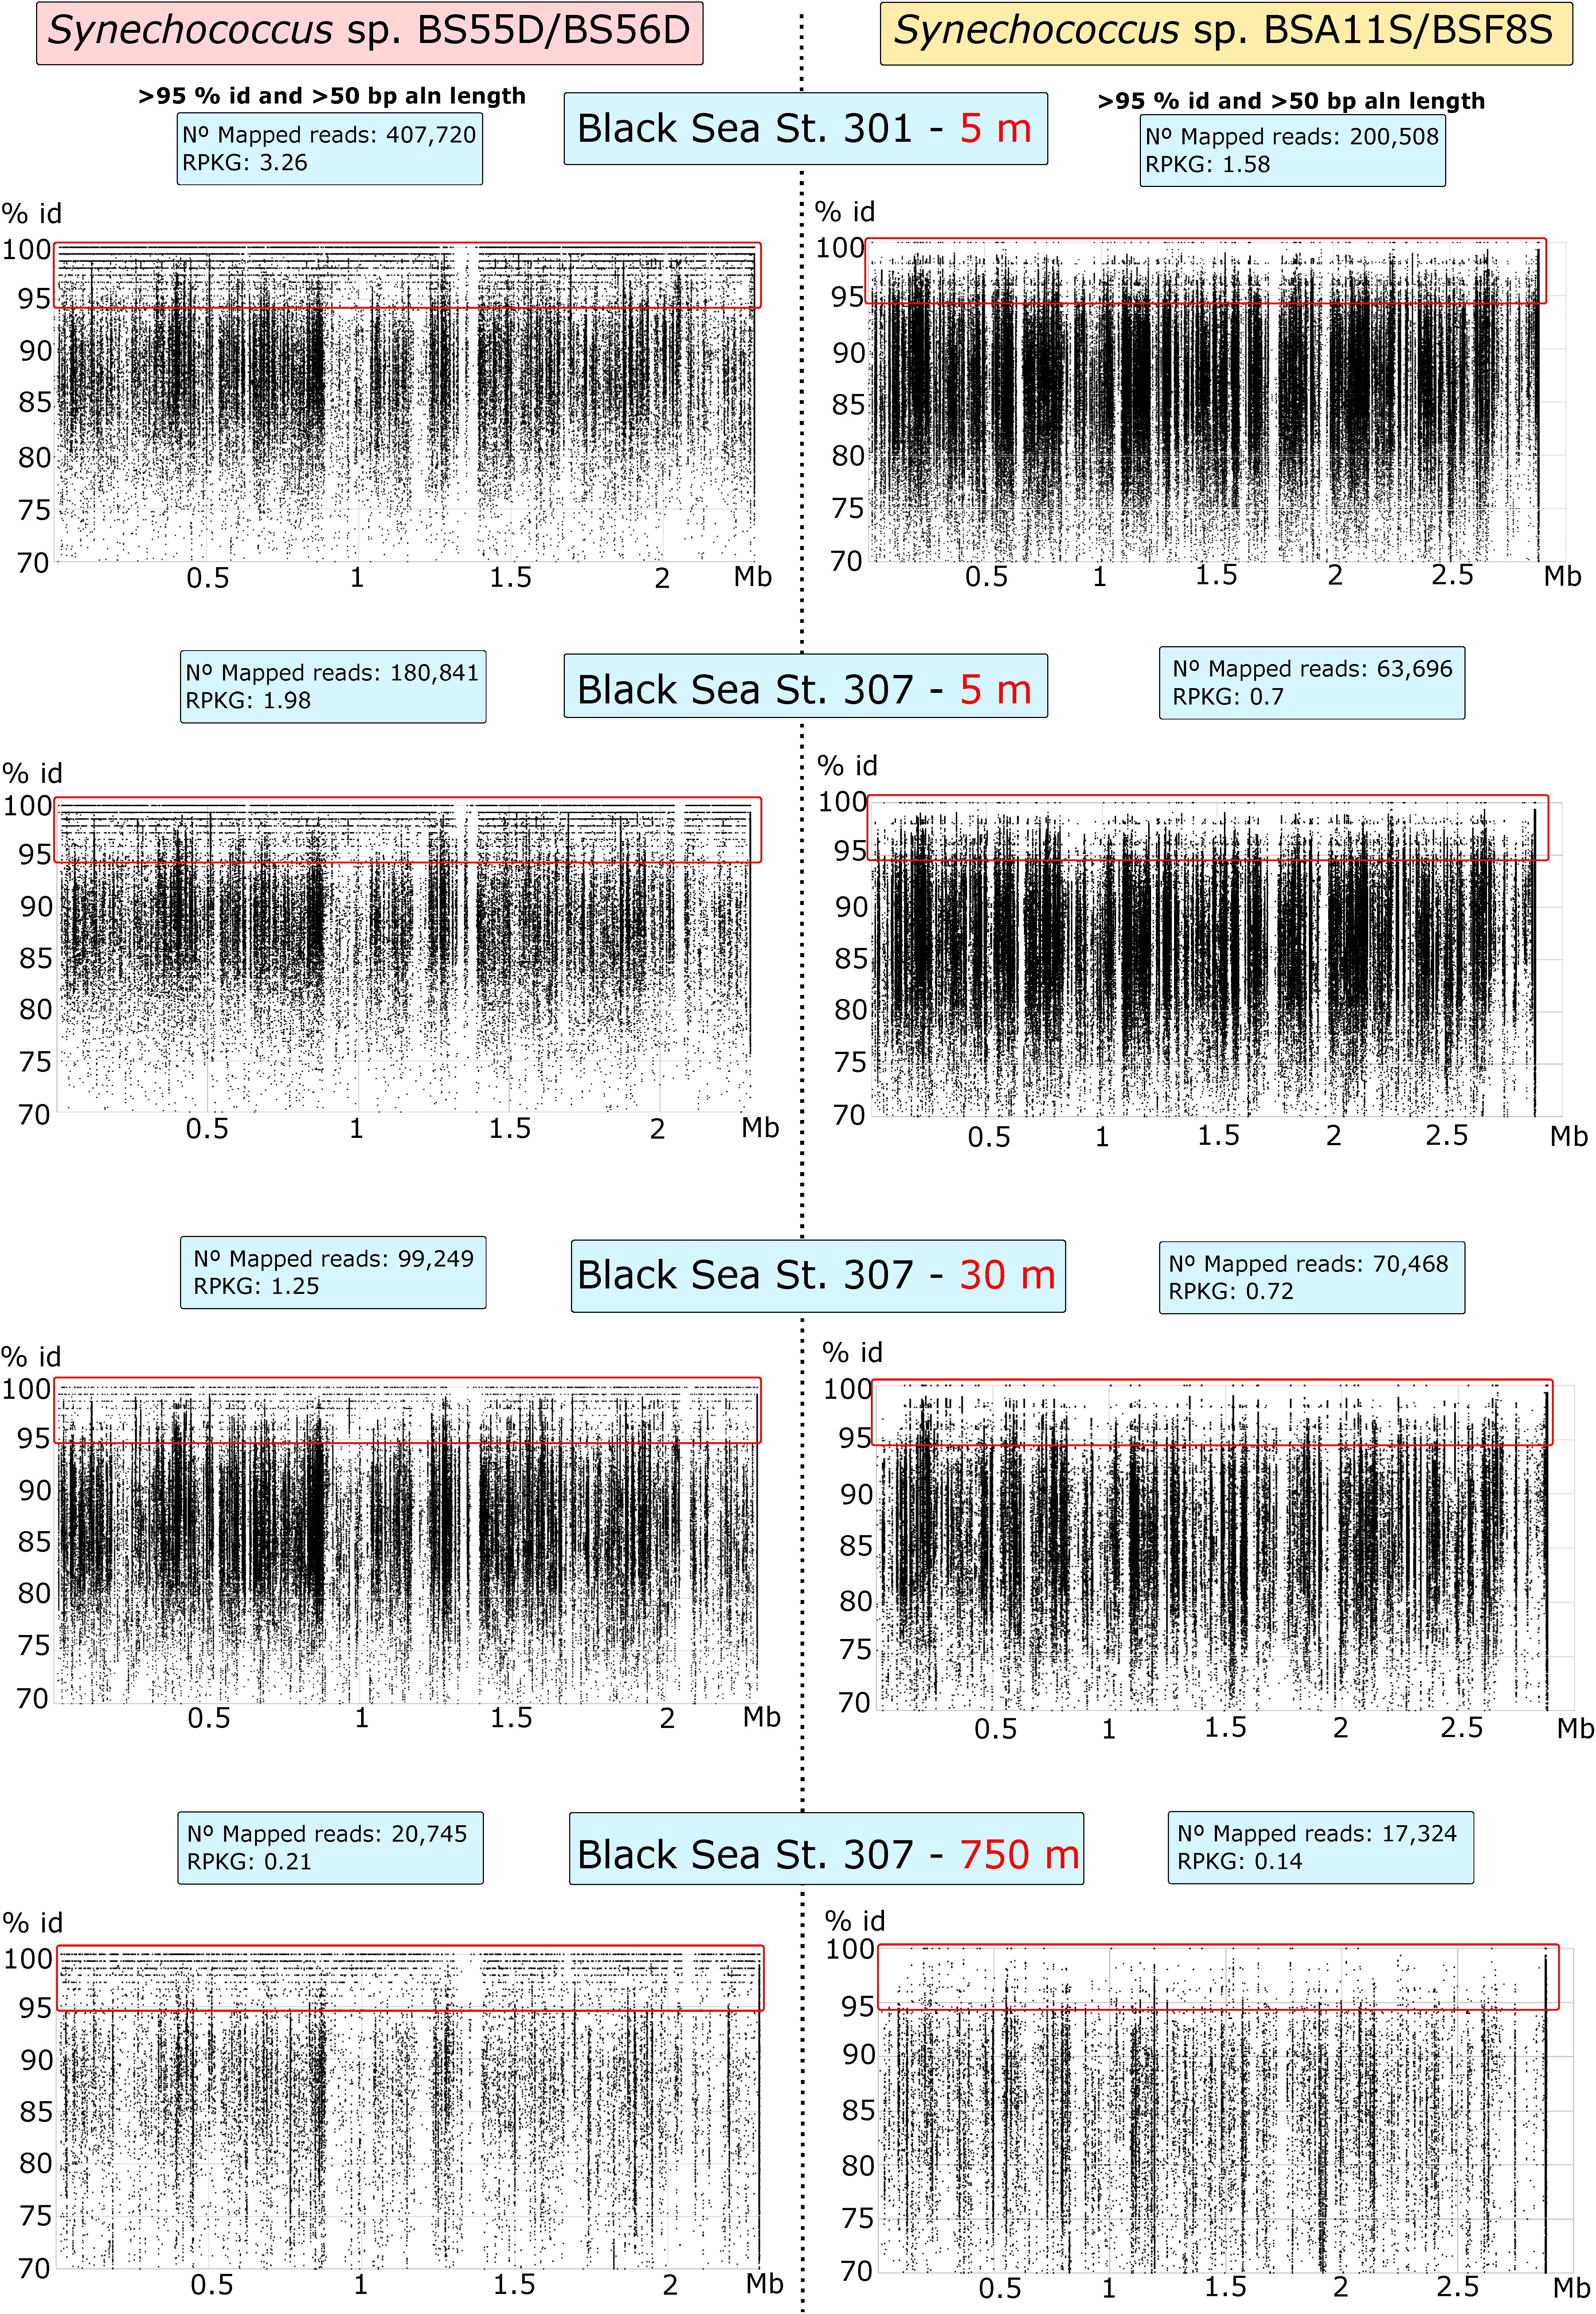
Figure 3. Recruitment plots of Synechococcus sp. BS55D/BS56D and BSA11S/BSF8S phylotypes on Black Sea metagenomic datasets from stations St. 301 (5 m) and St. 307 (5, 30, and 750 m). Each dot represents a single read of the metagenome mapped into the genome of each phylotype. Reads mapped at > 70% of identity and > 50 bp of alignment length with BLASTN are shown. X-axis represents the position of the genome (Mb) and Y-axis the % of identity. Species level threshold to assess presence was set up to > 95% of identity reads and was shown inside the red rectangle. Left panels show recruitment plots of BS55D/BS56D phylotypes and right panels show recruitment plots of BSA11S/BSF8S phylotypes on the metagenomes. Blue boxes show total mapped reads and Reads per Kb of genome per Gb of metagenome (RPKGs) for each genome and metagenome at > 95% of identity and > 50 bp of alignment lengths.
On the other hand, BSA11S/BSF8S phylotypes were not detected above the species level in any of the metagenomes, although similar species clearly inhabit the ecosystem as seen in the recruitment plots > 90% identity.
Phenotypic and Genomic Features of Synechococcus Strains
The main characteristics of the BSD strains were detailed previously (Callieri et al., 2019). The newly described epipelagic coastal strains (BSA11S and BSF8S) were isolated from near-surface samples (6.5 m depth) taken at the coastal station UA-2 in May 2016. They were phenotypically similar to the BSD strains, appearing pink in culture with a peak of absorption of phycoerythrin at 573 nm and of Chl-a at 443 and 682 nm, and with a low peak of allophycocyanin at 643 nm, hardly distinguishable from Chl-a (Supplementary Figure S3).
An updated picocyanobacterial phylogeny is shown in Figure 4, including both BSD and BSS strains. As previously noted, the BSD strains fall inside clades VIII/IX (with closest neighbors RS9917 and RS9916) of the marine sub-cluster 5.1A (Callieri et al., 2019). The new BSS strains (BSA11S and BSF8S) branch inside the polyphyletic and diverse (in terms of genomic distance and habitats of origin) sub-cluster 5.2, with the euryhaline Long Island Sound strain WH5701 as closest relative (Dufresne et al., 2008).
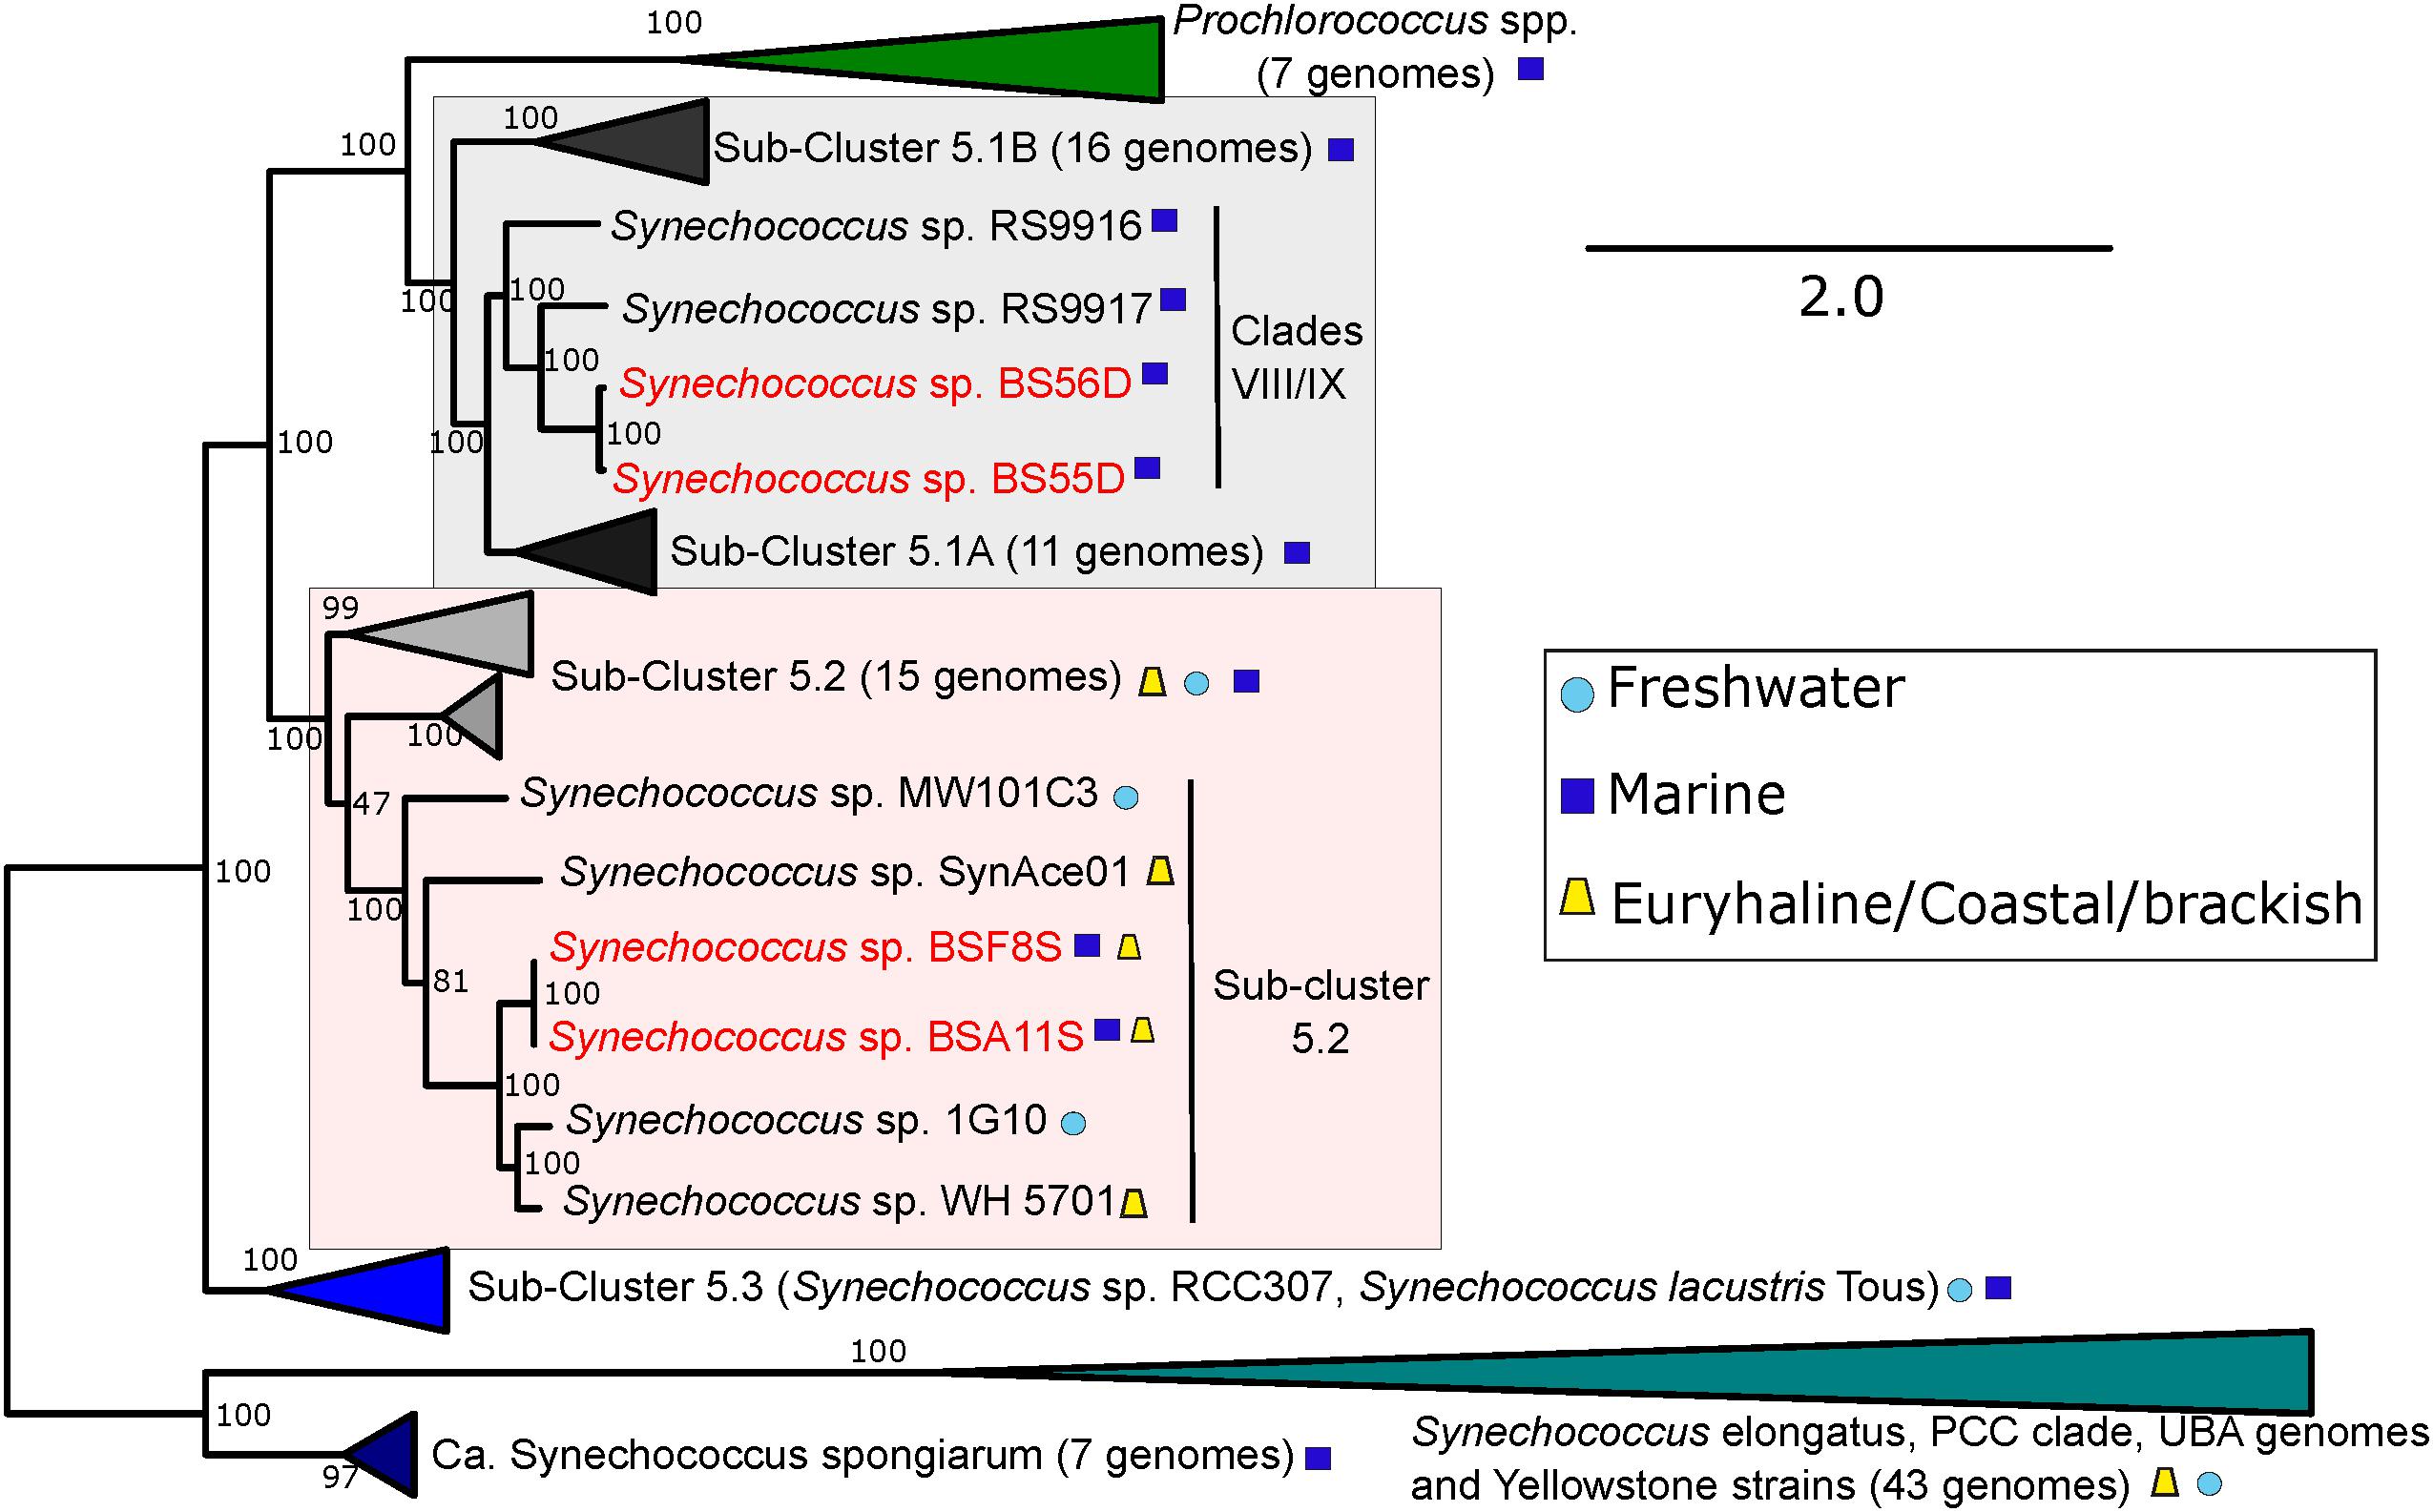
Figure 4. Phylogenomic tree of BSS (BSA11S and BSF8S) and BSD (BS55D and BS56D) phylotypes constructed with PhyloPhlan using 396 universal genes. 100 bootstraps were calculated. Selected marine, freshwater and brackish/euryhaline/coastal strains and clades are displayed. Black Sea strains are colored in red, symbols next to strain names indicate their origin.
At the genomic level, the strains differed considerably (Figure 5). BSS strains displayed larger genomes (2.88 Mb) and higher GC content (65.7%) compared to BSD strains (2.25–2.3 Mb genome size and 61% GC content). The two BSS Synechococcus strains exhibit a very high Average Nucleotide Identity (ANI = 99.98%) and can be thus considered the same species. The same holds true for BSD strains (displaying > 97% of ANI, same species), while both sets of strains only share ca. 71% of ANI and can be thus considered as different genera. BSS and BSD strains contain 43.9% and 30.7% of unique genes, respectively. The relatively high percentages (55–69%) of shared genes (core genome) between all four Black Sea strains is in accordance with what was observed for their closest relatives Synechococcus sp. RS9917 (a halotolerant strain related to BSD strains) (Fuller et al., 2003) and WH5701 (closely related to BSS strains) (Dufresne et al., 2008).
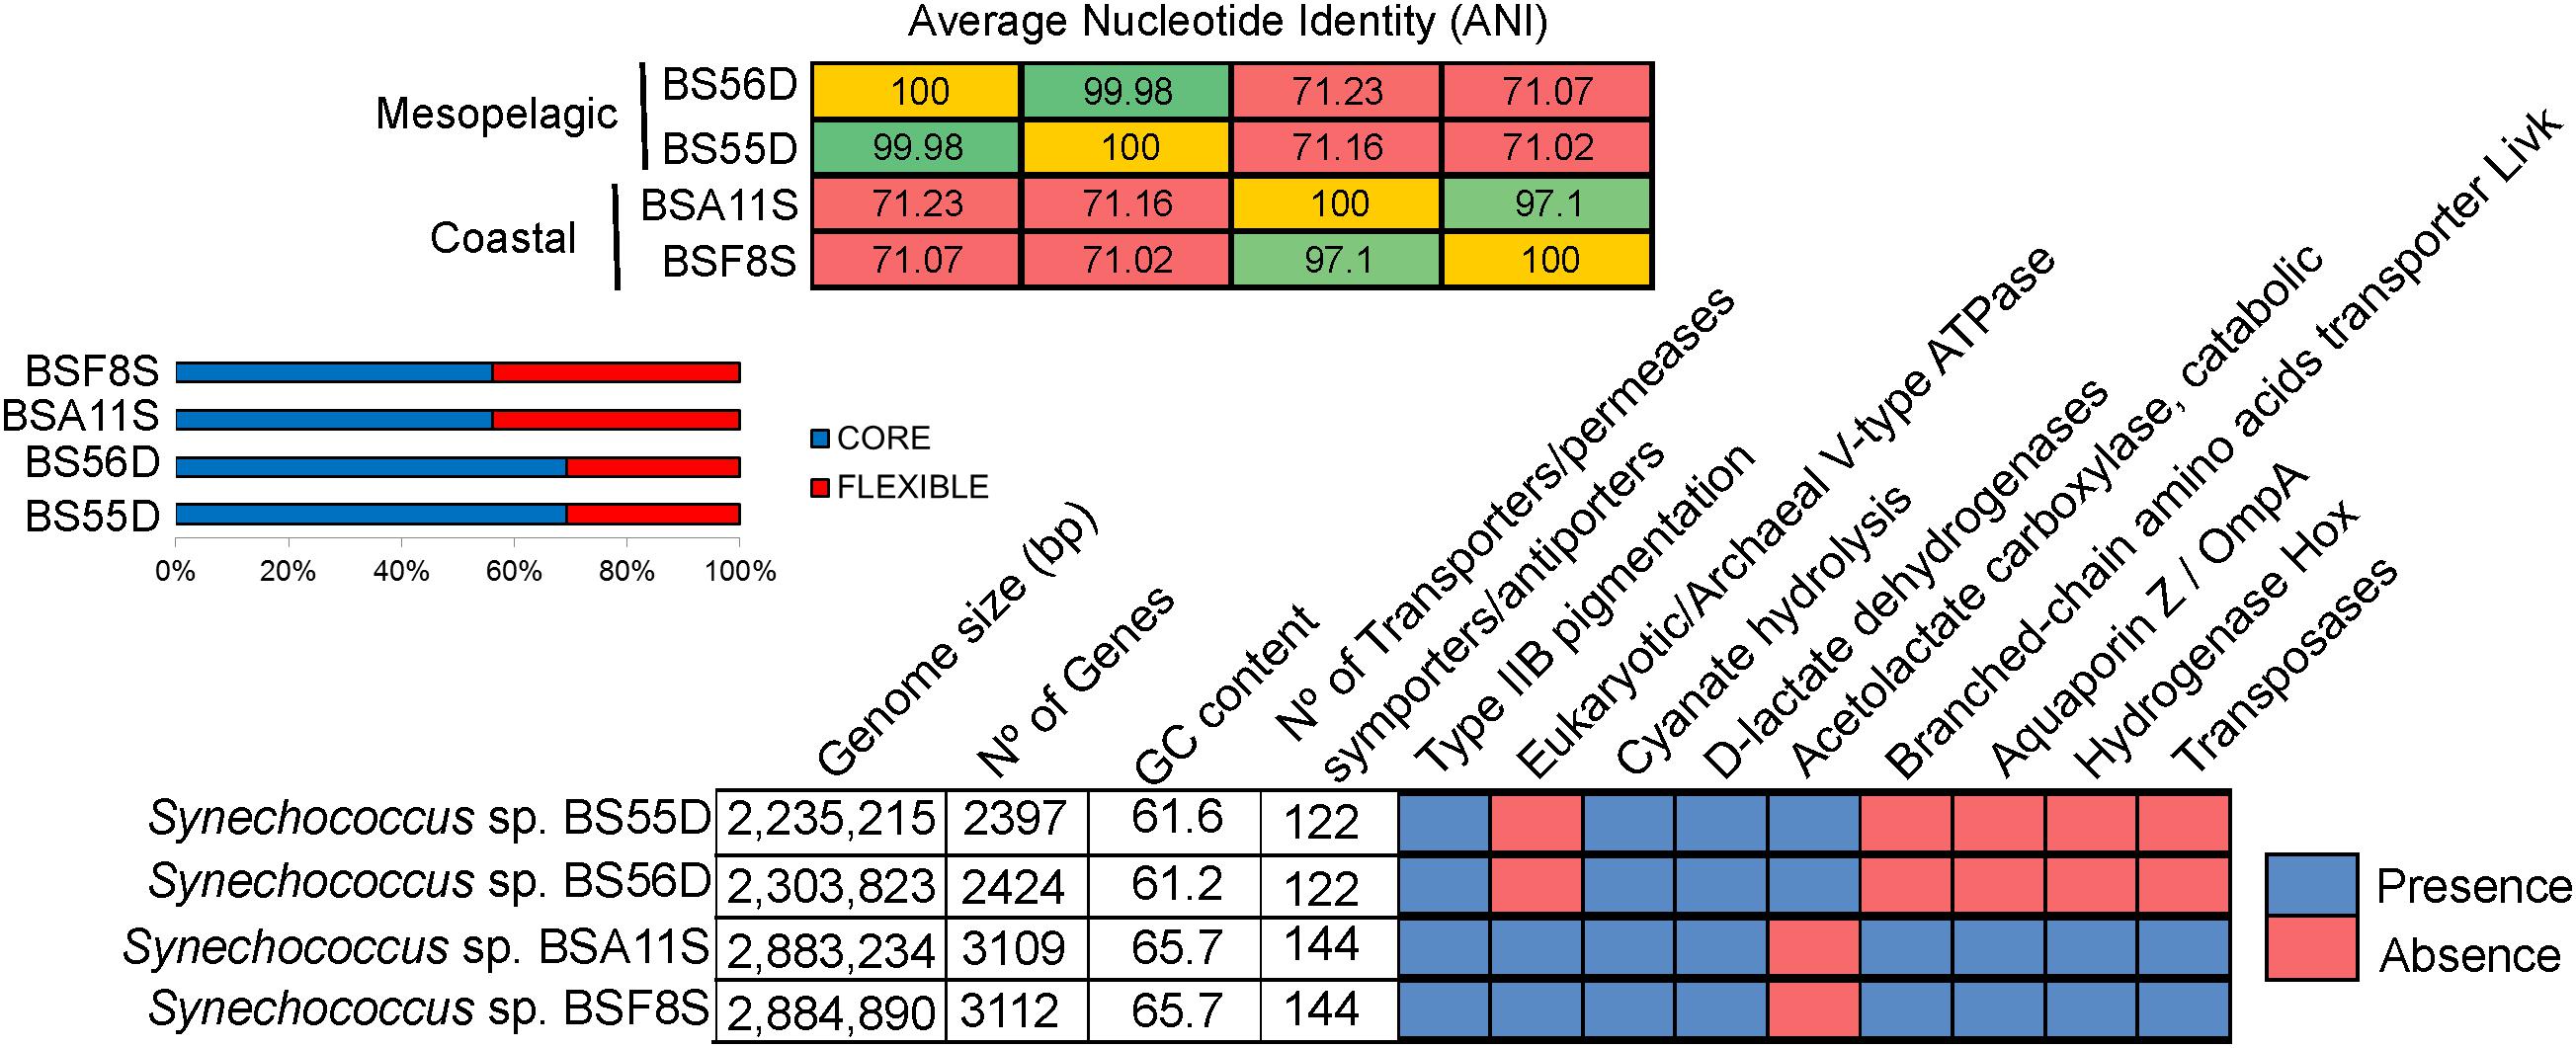
Figure 5. Average Nucleotide Identity (ANI), pan-genome analysis and genomic features of BSS (BSA11S and BSF8S) and BSD (BS55D and BS56D) Black Sea strains.
Looking at the specific genes that were shared and unique among Black Sea strains, we noticed that BSS strains harbor a high number of transposases (n = 69). These were located close to each other in the genome, or flanked by different genes such as those encoding phycobilisomes (PBS operon), a V-type ATPase, D-lactate dehydrogenases, copper-resistance protein, cytochrome P450, aquaporin Z, phosphate ABC transporter substrate-binding protein, bidirectional hydrogenase (hox) and additional genes (hyp), lysozyme/peptidoglycan-binding proteins (common to Microcystis), or an ion channel protein (MscS). In contrast, we did not detect any transposases in BSD strains (Figure 5).
Both sets of strains have the genetic potential to perform cyanate hydrolysis to obtain an additional ammonia source and CO2. The number of transporters for different nutrients, antiporters/symporters was higher in BSS (n = 144) than in BSD strains (n = 122). It is noteworthy that BSS representatives contained 11 high light inducible proteins whilst BSD strains showed only 4. On the other hand, only the BSD strains contained genes for the catabolic acetolactate carboxylase (involved in acetoin fermentation), together with the presence of a very specific type of D-lactate dehydrogenase, which was so far described only for strain RS9917 and no other picocyanobacteria (Callieri et al., 2019). All four strains show type IIB pink pigmentation, however, the structure of the Phycobilisome (PBS) operon differed, as BSD strains possess one additional subunit of phycocyanin while BSS strains contain a transposase along with the PBS cluster (Supplementary Figure S4).
Discussion
Synechococcus spp. Dynamics and Its Correlation With Environmental Factors
Synechococcus cell numbers were higher in the Black Sea’s surface water, in agreement with the distribution of autotrophic picoplankton cells in the oceans (Scanlan, 2012). This result was also in agreement with epifluorescence microscopy counts, where total Synechococcus abundances in the Black Sea ranged between 102 and 105 cell ml–1 in the first 160 m (Uysal, 2006). The detection of Synechococcus in oxygenated mesopelagic waters was reported previously (Vilibić and Šantić, 2008; Sohrin et al., 2011). However, their vertical and horizontal distribution in a deep meromictic system like the Black Sea was so far never investigated and, to our knowledge, no information was available on their correlation with environmental factors.
We found that the abundance of Synechococcus cells was not correlated to bacterial abundance (Pearson’s correlation coefficient: 0.16). Synechococcus spp. were always detectable, and their numbers generally decreased with depth, and only slightly increased at 1000 m compared to 500 m. Bacterial numbers were not influenced by depth, in contrast with what was previously found in the Sargasso Sea, where water depth was one of the main factors influencing the abundances of both Synechococcus and bacterial cells (Sjöstedt et al., 2014). Furthermore, salinity had no discernible impact on total Synechococcus cell abundance, while in other studies and years a correlation with salinity in the Black Sea has been reported (Uysal, 2000, 2006). We found that total Synechococcus cell numbers, unlike bacteria, were not correlated with Chl-a, which mainly derived from the eukaryotic fraction, as previously reported in other marine systems (Tai and Palenik, 2009).
BSD phylotypes were detected more frequently than BSS ones, and they were mostly found in 5 m metagenomes and epipelagic samples tested with qPCR, showing that they are species with preferred epipelagic habitats. However, even if at low numbers, they were also detected at 750 and 1007 m depth, both with metagenomic recruitment and qPCR techniques, confirming their presence and supporting the suggested adaptability of BSD to those depths (Callieri et al., 2019). The abundance of BSD phylotypes (by qPCR) was higher in coastal sites than in off-shore epipelagic ones, and it was negatively influenced by salinity, suggesting that these two factors could be among the main drivers of the distribution of this particular phylotype within the variables that have been analyzed.
Genomic Comparison of Coastal and Pelagic Synechococcus Strains
Comparative genomics of coastal and pelagic strains made it possible to characterize, along with the core genome of Synechococcus, also the flexible genes that diverge between strains (Dufresne et al., 2008) and thus provide a higher resolution of Synechococcus dynamics in the Black Sea. An important feature unique to BSS was the presence of archaeal/eukaryotic V-type ATPases in their genomes. To our knowledge, these genes have only been observed in strains of Synechococcus sp. WH5701, BO8801, PCC7336, and Cyanobium sp. PCC7001. In fact, the closest organisms harboring these V-type ATPases are other filamentous Cyanobacteria (Leptolyngbya or Cyanothece) and different Gammaproteobacteria (Methylococcaceae) and Alphaproteobacteria (Rhodospirillaceae). The presence of V-type ATPases in epipelagic coastal strains (in addition to two operons with the typical F0F1 ATPases) remains enigmatic. Another unique feature of the BSS was the presence of a bidirectional hydrogenase (hox) and additional genes (hyp), putatively involved in the uptake and photoproduction of molecular hydrogen (Tamagnini et al., 2002). Hydrogenases are widespread in anoxygenic photosynthesizers and other filamentous N-fixing Cyanobacteria (Ludwig et al., 2006), but have recently been observed in planktonic freshwater picocyanobacteria (Di Cesare et al., 2018; Cabello-Yeves et al., 2018). Hence, it appears that the BSS phylotypes have many different mechanisms to produce and incorporate H+. These strains also contain genes annotated as D-lactate dehydrogenases, although of a different origin from those present in pelagic strains, which are found in some other Cyanobacteria and Proteobacteria.
Importantly, both BSD and BSS strains display type IIB pigmentation (Supplementary Figure S3), a novel type of pigmentation that was first observed in freshwater and brackish picocyanobacteria (Larsson et al., 2014; Cabello-Yeves et al., 2018; Sánchez-Baracaldo et al., 2019), and then described in marine strains (Callieri et al., 2019). Furthermore, the fact that the above-mentioned unique genes were flanked by transposases in BSS genomes could indicate that these were transferred horizontally by other cyanobacteria, and were probably involved in the niche adaptation of the two coastal strains. Indeed, genes of the phycobilisome operon flanked by mobile genetic elements were most similar to the ones from freshwater strains from sub-cluster 5.2, which once again opens up new evolutionary perspectives on the freshwater to marine transition suggested for this picocyanobacterial sub-cluster (Sánchez-Baracaldo, 2015; Sánchez-Baracaldo et al., 2019). In general, all genes encoded in the flexible genome have been linked to genomic islands, previously associated with niche adaptation in marine and freshwater picocyanobacteria (Dufresne et al., 2008; Scanlan et al., 2009; Cabello-Yeves et al., 2018). Overall, based on the genomic features observed in our Black Sea strains, we could conclude that BSS phylotypes seem to be more adapted to surface layers, as they were only detected in the upper layers of some Black Sea stations by qPCR (except for one station at 42 m) and were rare from the metagenomes. They also contain more high light inducible proteins or transporters (including a V-type ATPase, an aquaporin Z, and hydrogenases), which suggests that they may be specialists of the photic layers of the Black Sea. On the other hand, BSD phylotypes have evolved together within the marine sub-cluster 5.1 (Scanlan et al., 2009). These phylotypes were detected in surface, epi- and mesopelagic layers (including 750 and 1000 m) and hence could be adapted to variable salinities by being halotolerant, just as their closest relatives from the Red Sea (Fuller et al., 2003). However, we must clearly highlight that their preferred habitat were surface and epipelagic waters, as confirmed by recruitment analysis. Nonetheless, their detection in mesopelagic off-shore euxinic waters, even in low numbers (around 1000 cells ml–1) as previously discussed, appears significant, and possibly correlated with a role in the “deep red fluorescence” Chl-a signal characteristic of the deep mesopelagic waters of the Black Sea (Callieri et al., 2019). The putative capability of BSD strains to perform heterolactic and acetoin fermentations remains to be confirmed, and further in vitro experiments will test if the mere presence of these genes allows them to perform this metabolism.
Conclusion
The total abundance and distribution of Synechococcus in the Black Sea did not correlate significantly to most key environmental variables we tested. This suggests that the high genomic variability of this cyanobacterial genus informs more textured and complex strain-specific dynamics that deserve further attention. Providing us with a higher resolution, whole genome sequencing and qPCR techniques indicate that: (1) BSD phylotypes could reach deep waters from the upper epipelagic layers, and are able to withstand the aphotic and oxygen depleted conditions of deep layers, displaying higher resilience and adaptably, while, (2) BSS phylotypes seem to be restricted to epipelagic waters, as specialists of this photic niche.
These results contribute to the growing definition of Synechococcus dynamics and phylogenetics, especially in the unique euxinic conditions of the Black Sea. Already identified as an important analog for the Proterozoic ocean, this is a crucial environment to shed light on the oxygenation of the planet, along with its enormous impact on evolution, and its significance for contemporary climate change. As the importance of the rare biosphere becomes apparent, we need better resolved analyses of the distribution, abundance, dynamics, and evolution of microbial populations, and the higher resolution of Synechococcus dynamics in the Black Sea provided here is a step in this direction.
Data Availability Statement
The BSD Black Sea Synechococcus genomes were previously published (Callieri et al., 2019) and are available in the NCBI-GenBank databases under the BioProject PRJNA419515. The novel coastal BSS strains are available under the BioProject number PRJNA556564. Synechococcus sp. BSA11S is codified by BioSample SAMN12359518 and GenBank accession number VNWP00000000. Synechococcus sp. BSF8S is codified by BioSample SAMN12359523 and GenBank accession number VOBS00000000. Black Sea metagenomic datasets were deposited under the NCBI database under the BioProject PRJNA638805.
Author Contributions
CC, AD, PC-Y, ND, and SM conceived the study. AD, PC-Y, ND, CC, FB, and MS wrote the manuscript. CC isolated the Synechococcus strains. VS, NS, ND, SM, LK, and EP carried out the samplings and organized the research cruise. MS, PC-Y, FR-V, and EE did the sequencing and analyzed the sequences. AD and ND did the qPCR analyses. GC and CC made the cytometer countings and prepared the samples for sequence analyses. RB provided laboratory support and chemical analyses. All authors commented the manuscript.
Funding
This research has been carried out thanks to the International Bilateral Project between the Italian National Research Council and the Bulgarian Academy of Science (CNR-BAS), and in the framework of the National Science Program “Environmental Protection and Reduction of Risks of Adverse Events and Natural Disasters,” approved by the Resolution of the Council of Ministers No. 577/17.08.2018 and supported by the Ministry of Education and Science (MES) of Bulgaria (Agreement No. D01-230/06.12.2018). PC-Y was supported by APOSTD/2019/009 Post-Doctoral fellowship from Generalitat Valenciana. MS was supported by the research grants 19-23469S (Grant Agency of the Czech Republic) and 310030_185108 (Swiss National Science Foundation). FR-V was supported by grants “VIREVO” CGL2016−76273−P (MCI/AEI/FEDER, EU) (cofounded with FEDER funds) from the Spanish Ministerio de Ciencia e Innovación and “HIDRAS3” PROMETEU/2019/009 from Generalitat Valenciana.
Conflict of Interest
The authors declare that the research was conducted in the absence of any commercial or financial relationships that could be construed as a potential conflict of interest.
Acknowledgments
Sequencing was conducted at the Genetic Diversity Centre (GDC), ETH Zürich. Daniel Schaefle is acknowledged for help with genomic library preparation and Eugen Loher for flow cytometric cell sorting of Synechococcus cultures.
Supplementary Material
The Supplementary Material for this article can be found online at: https://www.frontiersin.org/articles/10.3389/fmicb.2020.01979/full#supplementary-material
Footnotes
References
Ahlgren, N. A., and Rocap, G. (2006). Culture isolation and culture-independent clone libraries reveal new marine Synechococcus ecotypes with distinctive light and N physiologies. Appl. Environ. Microbiol. 72, 7193–7204. doi: 10.1128/aem.00358-06
Altschul, S. F., Madden, T. L., Schäffer, A. A., Zhang, J., Zhang, Z., Miller, W., et al. (1997). Gapped BLAST and PSI-BLAST: a new generation of protein database search programs. Nucleic Acids Res. 25, 3389–3402. doi: 10.1093/nar/25.17.3389
Bankevich, A., Nurk, S., Antipov, D., Gurevich, A. A., Dvorkin, M., Kulikov, A. S., et al. (2012). SPAdes: a new genome assembly algorithm and its applications to single-cell sequencing. J. Comput. Biol. 19, 455–477. doi: 10.1089/cmb.2012.0021
Bustin, S. A., Benes, V., Garson, J. A., Hellemans, J., Huggett, J., Kubista, M., et al. (2009). The MIQE guidelines: minimum information for publication of quantitative real-time PCR experiments. Clin. Chem. Spec. Rep. 55, 611–622. doi: 10.1373/clinchem.2008.112797
Cabello-Yeves, P. J., Picazo, A., Camacho, A., Callieri, C., Rosselli, R., Roda−Garcia, J. J., et al. (2018). Ecological and genomic features of two widespread freshwater picocyanobacteria. Environ. Microbiol. 20, 3757–3771. doi: 10.1111/1462-2920.14377
Callieri, C. (2017). Synechococcus plasticity under environmental changes. FEMS Microbiol. Lett. 364:fnx229.
Callieri, C., Coci, M., Corno, G., Macek, M., Modenutti, B., Balseiro, E., et al. (2013). Phylogenetic diversity of nonmarine picocyanobacteria. FEMS Microbiol. Ecol. 85, 293–301. doi: 10.1111/1574-6941.12118
Callieri, C., Cronberg, G., and Stockner, J. (2012). “Freshwater picocyanobacteria: single cells, microcolonies and colonial forms,” in Ecology of Cyanobacteria II: Their Diversity in Time and Space, 2nd Edn, ed. B. Whitton (Dordrecht: Springer Publishers), 229–269. doi: 10.1007/978-94-007-3855-3_8
Callieri, C., Slabakova, V., Dzhembekova, N., Slabakova, N., Peneva, E., Cabello-Yeves, P. J., et al. (2019). The mesopelagic anoxic Black Sea as an unexpected habitat for Synechococcus challenges our understanding of global “deep red fluorescence”. ISME J. 13, 1676–1687. doi: 10.1038/s41396-019-0378-z
Contreras-Moreira, B., and Vinuesa, P. (2013). GET_HOMOLOGUES, a versatile software package for scalable and robust microbial pangenome analysis. Appl. Environ. Microbiol. 79, 7696–7701. doi: 10.1128/aem.02411-13
Di Cesare, A., Cabello-Yeves, P. J., Chrismas, N. A. M., Sánchez-Baracaldo, P., Salcher, M. M., and Callieri, C. (2018). Genome analysis of the freshwater planktonic Vulcanococcus limneticus sp. nov. reveals horizontal transfer of nitrogenase operon and alternative pathways of nitrogen utilization. BMC Genomics 19:259. doi: 10.1186/s12864-018-4648-3
Di Cesare, A., Luna, G. M., Vignaroli, C., Pasquaroli, S., Tota, S., Paroncini, P., et al. (2013). Aquaculture can promote the presence and spread of antibiotic−resistant enterococci in marine sediments. PLoS One 8:e62838. doi: 10.1371/journal.pone.0062838
Dufresne, A., Ostrowski, M., Scanlan, D. J., Garczarek, L., Mazard, S., Palenik, B. P., et al. (2008). Unraveling the genomic mosaic of a ubiquitous genus of marine cyanobacteria. Genome Biol. 9:R90.
Edgar, R. C. (2004). MUSCLE: multiple sequence alignment with high accuracy and high throughput. Nucleic Acids Res. 32, 1792–1797. doi: 10.1093/nar/gkh340
Edler, L. (1979). Recommendations on methods for marine biological studies in the baltic sea. Phytoplankton and Chlorophyll. Baltic Mar. Biol. P 5, 1–38.
Farrant, G., Doré, H., Castillo, F., Partensky, F., Ratin, M., Ostrowski, M., et al. (2016). Delineating ecologically significant taxonomic units from global patterns of marine picocyanobacteria. Proc. Natl. Acad. Sci. U.S.A. 113, E3365–E3374.
Feyzioglu, A. M., Eruz, C., and Yíldíz, Ý (2015). Geographic variation of Picocyanobacteria Synechococcus spp. along the anatolian coast of the black sea during the Late Autumn of 2013. Turkish J. Fish Aquat. Sci. 15, 465–469.
Feyzioglu, A. M., Kurt, I., Boran, M., and Sivri, N. (2004). Abundance and distribution of Synechococcus spp. in the South-eastern Black Sea during of 2001 summer. Indian J. Mar. Sci. 33, 365–368.
Flombaum, P., Gallegos, J., Gordillo, R., Rincón, J., Zabala, L., Jiao, N., et al. (2013). Present and future global distributions of the marine Cyanobacteria Prochlorococcus and Synechococcus. Proc. Natl. Acad. Sci. U.S.A. 110, 9824–9829.
Fox, J., and Weisberg, S. (2019). An R Companion to Applied Regression (Third). Thousand Oaks, CA: Sage.
Fuller, N. J., Marie, D., Partensky, F., Vaulot, D., Post, A. F., and Scanlan, D. J. (2003). Clade-specific 16 S ribosomal DNA oligonucleotides reveal the predominance of a single marine Synechococcus clade throughout a stratified water column in the Red Sea. Appl. Environ. Microbiol. 69, 2430–2443. doi: 10.1128/aem.69.5.2430-2443.2003
Fuller, N. J., Tarran, G. A., Yallop, M., Orcutt, K. M., and Scanlan, D. J. (2006). Molecular analysis of picocyanobacterial community structure along an Arabian Sea transect reveals distinct spatial separation of lineages. Limnol. Oceanogr. 51, 2515–2526. doi: 10.4319/lo.2006.51.6.2515
Goris, J., Konstantinidis, K. T., Klappenbach, J. A., Coenye, T., Vandamme, P., and Tiedje, J. M. (2007). DNA–DNA hybridization values and their relationship to whole-genome sequence similarities. Int. J. Syst. Evol. Microbiol. 57, 81–91. doi: 10.1099/ijs.0.64483-0
Grasshoff, K., Kremling, K., and Ehrhardt, M. (1999). Methods of Seawater Analysis. Weinheim: Wiley-VCH Verlag GmbH.
Haft, D. H., Loftus, B. J., Richardson, D. L., Yang, F., Eisen, J. A., Paulsen, I. T., et al. (2001). TIGRFAMs: a protein family resource for the functional identification of proteins. Nucleic Acids Res. 29, 41–43. doi: 10.1093/nar/29.1.41
Hyatt, D., Chen, G. L., Locascio, P. F., Larimer, F. W., and Hauser, L. J. (2010). Prodigal: prokaryotic gene recognition and translation initiation site identification. BMC Bioinformatics 11:119. doi: 10.1186/1471-2105-11-119
Jardillier, L., Zubkov, M. V., Pearman, J., and Scanlan, D. J. (2010). Significant CO2 fixation by small prymnesiophytes in the subtropical and tropical northeast Atlantic Ocean. ISME J. 4, 1180–1192. doi: 10.1038/ismej.2010.36
Jeffrey, S. W., and Humphrey, G. F. (1975). New spectrophotometric equations for determing chlorophylls a, b, c1 and c2 in higher plants, algae and natural phytoplankton. Biochem. Physiol. Pflanzen. 167, 191–194. doi: 10.1016/s0015-3796(17)30778-3
Jousset, A., Bienhold, C., Chatzinotas, A., Gallien, L., Gobet, A., Kurm, V., et al. (2017). Where less may be more: how the rare biosphere pulls ecosystems strings. ISME J. 11, 853–862. doi: 10.1038/ismej.2016.174
Kanehisa, M., Sato, Y., and Morishima, K. (2016). BlastKOALA and GhostKOALA: KEGG tools for functional characterization of genome and metagenome sequences. J. Mol. Biol. 428, 726–731. doi: 10.1016/j.jmb.2015.11.006
Kim, Y., Jeon, J., Kwak, M., Kim, G., Koh, I., and Rho, M. (2018). Photosynthetic functions of Synechococcus in the ocean microbiomes of diverse salinity and seasons. PLoS One 13:e0190266. doi: 10.1371/journal.pone.0190266
Konovalov, S. K., Murray, J. W., and Luther, G. W. III (2005). Basic processes of Black Sea biogeochemistry. Oceanography 18, 24–35. doi: 10.5670/oceanog.2005.39
Kucuksezgin, F., and Pazi, I. (2003). Vertical structure of the chemical properties of western Black Sea. Indian J. Mar. Sci. 32, 314–322.
Larsson, J., Celepli, N., Ininbergs, K., Dupont, C. L., Yooseph, S., Bergman, B., et al. (2014). Picocyanobacteria containing a novel pigment gene cluster dominate the brackish water Baltic Sea. ISME J. 8, 1892–1903. doi: 10.1038/ismej.2014.35
Ludwig, M., Schulz-Friedrich, R., and Appel, J. (2006). Occurrence of hydrogenases in cyanobacteria and anoxygenic photosynthetic bacteria: implications for the phylogenetic origin of cyanobacterial and algal hydrogenases. J. Mol. Evol. 63, 758–768. doi: 10.1007/s00239-006-0001-6
Martín-Cuadrado, A.-B., Lopez-Garcia, P., Alba, J.-C., Moreira, D., Monticelli, L., Strittmatter, A., et al. (2007). Metagenomics of the deep Mediterranean, a warm bathypelagic habitat. PLoS One 2:e914. doi: 10.1371/journal.pone.0000914
Oksanen, J., Kindt, R., Legendre, P., O’Hara, B., Stevens, M. H. H., Oksanen, M. J., et al. (2007). The vegan package. Commun. Ecol. Package 10, 631–637.
Overbeek, R., Olson, R., Pusch, G. D., Olsen, G. J., Davis, J. J., Disz, T., et al. (2013). The SEED and the rapid annotation of microbial genomes using subsystems technology (RAST). Nucleic Acids Res. 42, D206–D214.
Palenik, B. (1994). Cyanobacterial community structure as seen from RNA polymerase gene sequence analysis. Appl. Environ. Microbiol. 60, 3212–3219. doi: 10.1128/aem.60.9.3212-3219.1994
Parks, D. H., Imelfort, M., Skennerton, C. T., Hugenholtz, P., and Tyson, G. W. (2015). CheckM: assessing the quality of microbial genomes recovered from isolates, single cells, and metagenomes’. Genome Res. 25, 1043–1055. doi: 10.1101/gr.186072.114
Sánchez-Baracaldo, P., Bianchini, G., Di Cesare, A., Callieri, C., and Chrismas, N. A. M. (2019). Insights into the evolution of picocyanobacteria and phycoerythrin genes (mpeBA and cpeBA). Front. Microbiol. 10:45. doi: 10.3389/fmicb.2019.00045
Scanlan, D. J. (2012). “Marine picocyanobacteria,” in Ecology of Cyanobacteria II: Their Diversity in Time and Space, 2nd Edn, ed. B. Whitton (Dordrecht: Springer Publishers), 503–533. doi: 10.1007/978-94-007-3855-3_20
Scanlan, D. J., Ostrowski, M., Mazard, S., Dufresne, A., Garczarek, L., Hess, W. R., et al. (2009). Ecological genomics of marine picocyanobacteria. Microbiol. Mol. Biol. Rev. 73, 249–299. doi: 10.1128/mmbr.00035-08
Segata, N., Börnigen, D., Morgan, X. C., and Huttenhower, C. (2013). PhyloPhlAn is a new method for improved phylogenetic and taxonomic placement of microbes. Nat. Commun. 4:2304.
Six, C., Thomas, J. C., Garczarek, L., Ostrowski, M., Dufresne, A., Blot, N., et al. (2007). Diversity and evolution of phycobilisomes in marine Synechococcus spp.: a comparative genomics study. Genome Biol. 8:R259.
Sjöstedt, J., Martiny, J. B. H., Munk, P., and Riemann, L. (2014). Abundance of broad bacterial taxa in the Sargasso Sea explained by environmental conditions but not water mass. Appl. Environ. Microbiol. 80, 2786–2795. doi: 10.1128/aem.00099-14
Sohm, J., Ahlgren, N., Thomson, Z., Williams, C., Moffett, J., Saito, M., et al. (2016). Co-occurring Synechococcus ecotypes occupy four major oceanic regimes defined by temperature, macronutrients and iron. ISME J. 10, 333–345. doi: 10.1038/ismej.2015.115
Sohrin, R., Isaji, M., Obara, Y., Agostini, S., Suzuki, Y., Hiroe, Y., et al. (2011). Distribution of Synechococcus in the dark ocean. Aquat. Microb. Ecol. 64, 1–14. doi: 10.3354/ame01508
Solorzano, L. (1969). Determination of ammonia in natural waters by the phenol hypochlorite method. Limnol. Oceanogr. 14, 799–801.
Stanev, E. V., He, Y., Staneva, J., and Yakushev, E. (2014). Mixing in the Black Sea detected from the temporal and spatial variability of oxygen and sulfide-Argo float observations and numerical modelling. Biogeosciences 11, 5707–5732. doi: 10.5194/bg-11-5707-2014
Tai, V., and Palenik, B. (2009). Temporal variation of Synechococcus clades at a coastal Pacific Ocean monitoring site. ISME J. 3, 903–915. doi: 10.1038/ismej.2009.35
Tamagnini, P., Axelsson, R., Lindberg, P., Oxelfelt, F., Wünschiers, R., and Lindblad, P. (2002). Hydrogenases and hydrogen metabolism of cyanobacteria. Microbiol. Mol. Biol. Rev. 66, 1–20. doi: 10.1128/mmbr.66.1.1-20.2002
Tatusov, R. L., Natale, D. A., Garkavtsev, I. V., Tatusova, T. A., Shankavaram, U. T., Rao, B. S., et al. (2001). The COG database: new developments in phylogenetic classification of proteins from complete genomes. Nucleic Acids Res. 29, 22–28. doi: 10.1093/nar/29.1.22
Untergasser, A., Cutcutache, I., Koressaar, T., Ye, J., Faircloth, B. C., Remm, M., et al. (2012). Primer3-new capabilities and interfaces. Nucleic Acids Res. 40, e115. doi: 10.1093/nar/gks596
Uysal, Z. (2000). Pigments, size and distribution of Synechococcus spp. in the Black Sea. J. Mar. Sys. 24, 313–326. doi: 10.1016/s0924-7963(99)00092-5
Uysal, Z. (2001). Chroococcoid cyanobacteria Synechococcus spp. in the Black Sea: pigments, size, distribution, growth and diurnal variability. J. Plankton. Res. 23, 175–190. doi: 10.1093/plankt/23.2.175
Uysal, Z. (2006). Vertical distribution of marine cyanobacteria Synechococcus spp. in the Black, Marmara, Aegean, and eastern Mediterranean seas. Deep Sea Res. Part II 53, 1976–1987. doi: 10.1016/j.dsr2.2006.03.016
Vilibić, I., and Šantić, D. D. (2008). Deep water ventilation traced by Synechococcus cyanobacteria. Ocean Dynam. 58, 119–125. doi: 10.1007/s10236-008-0135-8
Ye, J., Coulouris, G., Zaretskaya, I., Cutcutache, I., Rozen, S., and Madden, T. L. (2012). Primer-BLAST: a tool to design target-specific primers for polymerase chain reaction. BMC Bioinformatics 13:134. doi: 10.1186/1471-2105-13-134
Zaitsev, Y., and Mamaev, V. (1997). Marine biological diversity in the Black Sea. A study of change and decline. United Nation Publications. GEF Black Sea Environ. Ser. 3:208.
Keywords: marine Synechococcus spp., rpoC1, qPCR, mesopelagic Black Sea, epipelagic Black Sea
Citation: Di Cesare A, Dzhembekova N, Cabello-Yeves PJ, Eckert EM, Slabakova V, Slabakova N, Peneva E, Bertoni R, Corno G, Salcher MM, Kamburska L, Bertoni F, Rodriguez-Valera F, Moncheva S and Callieri C (2020) Genomic Comparison and Spatial Distribution of Different Synechococcus Phylotypes in the Black Sea. Front. Microbiol. 11:1979. doi: 10.3389/fmicb.2020.01979
Received: 11 March 2020; Accepted: 27 July 2020;
Published: 12 August 2020.
Edited by:
Susana Agusti, King Abdullah University of Science and Technology, Saudi ArabiaReviewed by:
Eric Daniel Becraft, University of North Alabama, United StatesVera Tai, University of Western Ontario, Canada
Muzaffer Feyzioglu, Karadeniz Technical University, Turkey
Copyright © 2020 Di Cesare, Dzhembekova, Cabello-Yeves, Eckert, Slabakova, Slabakova, Peneva, Bertoni, Corno, Salcher, Kamburska, Bertoni, Rodriguez-Valera, Moncheva and Callieri. This is an open-access article distributed under the terms of the Creative Commons Attribution License (CC BY). The use, distribution or reproduction in other forums is permitted, provided the original author(s) and the copyright owner(s) are credited and that the original publication in this journal is cited, in accordance with accepted academic practice. No use, distribution or reproduction is permitted which does not comply with these terms.
*Correspondence: Cristiana Callieri, cristiana.callieri@irsa.cnr.it
†These authors have contributed equally to this work