


Abstract
This paper describes the results of a series of experiments conducted with the PALS laser at intensities of interest for the shock ignition approach to inertial fusion. In particular, we addressed the generation of hot electrons (HE) (determining their average energy and number), as well as the parametric instabilities which are producing them. In addition, we studied the impact of HE on the formation and dynamics of strong shocks.
Export citation and abstract BibTeX RIS
1. Introduction
The so-called 'shock ignition' [1–4] approach (SI) to inertial confinement fusion has been proposed by researchers at the University of Rochester [1] (and somehow anticipated in [5]) as an alternative to the conventional indirect-drive, central-hotspot approach currently investigated at NIF [6]. SI is a direct-drive scheme, and relies on the separation of the phases of target compression and ignition. Compression is achieved similarly to the conventional direct-drive approach with lasers at intensity a few times 1014W cm−2 and pulse duration ≈10 ns (with temporal shaping). The ignition phase is triggered by a high intensity laser spike (≈1016 W cm−2, lasting several hundred ps) launching a very strong shock (⩾0.3 GBar at the ablation front). The convergence of the shock at target centre heats the compressed fuel creating conditions for the onset of nuclear reactions.
A critical issue for SI concerns the role of hot electrons (HE) generated by the interaction of the intense laser spike. HE can either be detrimental or beneficial to SI, depending on their quantity and energy spectrum. HE generation and transport under SI relevant conditions must then be experimentally studied, and properly described within the hydrodynamics simulation codes which will be used for designing full-scale SI experiments.
In the conventional approach to ICF, HE are detrimental since they can preheat the cold fuel in the imploding shell making its compression more difficult. In SI, HE are produced by the final high-intensity laser spike that creates the very strong shock. At such late time the accumulated target areal density  is already quite large and can prevent the HE, depending on their energy, from passing through the compressed shell and to reaching the fuel in the centre. On the contrary they may deposit their energy in the denser part of the plasma providing an extra pressure, which may be the critical factor in reaching the needed sub-Gbar pressures. Therefore, in contrast to the classical scenario, HE may improve laser-target coupling and hence be beneficial to SI. This result was indeed anticipated in several theoretical [7–10] and numerical [11] works.
Recent experiments at Omega facility indicate that pressure of 0.3 GBar has indeed been obtained [12, 13]. This is an important result; however, it is not clear to what extent HE contributed to such a pressure.
At the same time, while studying HE, it is natural to study the impact of parametric instabilities since HE are indeed produced by Stimulated Raman scattering (SRS) and two plasmon decay (TPD). These two instabilities produce HE with different energy and angular spectra and at different times and locations of interaction. TPD electrons are typically much hotter and can then be more dangerous since they can produce preheating. Therefore, it is essential to study when and by what mechanisms HE are produced.
Current experiments in inertial fusion are most performed at the maximum intensity of ≈1015 W cm−2, while the intensity regime around 1016 W cm−2 is quite unexplored. Parametric instabilities are well studied and of relatively minor concern at intensities of ≈1015 W cm−2, but extrapolating results of these experiments to higher intensities is not justified. Indeed, at higher intensities SRS and TPD are expected to be in a strongly nonlinear regime and affected by kinetic effects (such as Landau damping, see section 4), depending critically on plasma conditions. SRS and Stimulated Brillouin scattering (SBS) can reflect a large part of incident laser radiation causing a decrease of absorption. Moreover, laser beam filamentation may ease the onset of parametric instability and affect the uniformity of energy deposition. Therefore, parametric instabilities need to be studied not only as sources of HE, but also since they may alter the laser-plasma coupling.
In this context, we have conducted a series of experiments at the PALS (Prague Asterix Laser System) Laboratory in Prague [14]. Earlier experiments [15–17] have recently been complemented with experiments realized in the framework of the Eurofusion Enabling Research Project «Preparation and Realization of European Shock Ignition Experiments». The laser PALS was chosen, as it is the only laser system in Europe that can deliver energies of the order of 0.5 kJ in a duration of about 300 ps, with the additional advantage of allowing irradiation at 1ω (1314 nm) or at 3ω (438 nm). We highlight that pulse duration of the order of a few hundred ps is just what is needed for SI. In addition, an auxiliary laser beam is available which allows creating an extended plasma corona before the arrival of the main pulse. Although due to the limited available energy, the density scale-lengths are shorter and the corona temperature lower than those envisaged for full-scale SI, these conditions can be considered as a first significant step toward really SI-relevant parameters.
The use of PALS allowed us to perform a unique set of high intensity interaction experiments (1015–1016 W cm−2; see details below), at both 1ω and 3ω, in a well-characterized experimental configuration.
It is worth noticing that while the conventional approach to ICF relies on using short wavelength lasers converted to 3ω, in SI one could envisage using a final spike at 2ω or even 1ω. In addition, measurements at 1ω are needed to validate advanced hydrodynamics codes in a wider range of parameters. In particular, we are interested in testing simplified models which are able to take into account the role of parametric instabilities in the frame of a fluid code.
2. Experimental set-up and diagnostics
PALS is an iodine laser system, which can deliver energies ≈0.5 kJ in a duration ≈300 ps. It can be operated either at 1ω (1314 nm) or at 3ω (438 nm). In our experiments, the PALS laser was focused onto multi-layered targets in order to simultaneously study the generation of a strong shock and the production of HE. Phase Plates were used at both irradiation wavelengths, allowing for a uniform and well-known intensity profile. The focal spot had a nominal Gaussian profile with FWHM of 100 µm. However, dedicated experiments on the spatial distribution of the laser energy showed that, when phase plates are used, the nominal Gaussian spot is superimposed to a larger energy 'plateau' and that about only 55% of the laser energy is actually delivered within the 100 µm spot, both at 1ω and 3ω irradiation. Peak laser intensities on target were up to 6 × 10¹⁵ W cm−2 at 3ω and 2 × 10¹⁶ W cm−2 at 1ω, when RPP are used.
The auxiliary laser beam, with energy up to 80 J at 1ω, and focused onto a spot of 300 µm (again smoothed with phase plate) was used to create a plasma corona with a flat radial profile and relatively long axial scale-length (50–100 micrometres, depending on the delay between auxiliary pulse and main pulse).
We used multi-layered targets with an interaction layer of plastics (either polyethylene or polyurethane) followed by one or more 'tracer layers' (typically Ti and Cu, see figure 1). The HE generated in the interaction propagated in the plastic layer (low-Z, to mimic the low-Z ablator of ICF targets) and then reached the tracer layers. Here the collisions of the HE with the atoms result in creation of holes in inner electronic shells and their subsequent filling via radiative transitions. In particular, the 2p → 1s K-shell fluorescence from the relatively cold target material (usually referred to as Kα emission) provides a direct tool for HE investigation. In some cases, the plastic layer was doped with Cl allowing for diagnostics of plasma conditions through x-ray spectroscopy.

Figure 1. Typical scheme of targets used for characterization of hot-electron generation at PALS. The two laser pulses are also represented. The main pulse (horizontal in the figure) is focused onto a spot of 100 micron diameter, the auxiliary pulse onto a 300 micron spot.
Download figure:
Standard image High-resolution imageThe use of plastic layers with different thicknesses (from 10 to 180 µm) allowed obtaining information on both shock-waves dynamic (through shock chronometry) and HE energy spectrum. The information on the energy spectrum is obtained by analysing Kα emission from targets with plastic layer of different thickness. Indeed, HE propagate through the target depending on their initial energy. For given laser parameters, the intensity of Kα radiation depends on the number of HE reaching the tracer layer and on their residual energy. When a double tracer layer was present, a comparison of the relative intensities of Cu and Ti Kα emissions was used to get information on the HE energy spectrum. This is a widely-used technique [18–20] for the characterization of HE. We performed both imaging of the Kα sources using spherically bent crystals [21] and x-ray spectroscopy [22]. This enables the separation of the contribution of Kα emission from the continuum radiation in the same spectral range [23].
The K-shell spectra emitted from the Ti tracer layer were observed at an angle of 65° to the target surface by using the x-ray spectrometer equipped with the crystal of quartz (2 1 1) spherically bent to a radius of 150 mm. The spectrometer was aligned to cover the photon energy range of 4.4–4.8 keV and provided the 1D spatial resolution at magnification of M = 0.53. The spectra were recorded on x-ray film Kodak Industrex AA 400 or imaging plate BAS-MS (IP). Characteristic curves of these detectors were recalibrated using a Fe-55 source. This set-up allowed achieving spectral resolution E/ΔE of 5000, and spatial resolution along the target surface of 11 µm (using the film) or 104 µm (using IP). The spectral records were calibrated with respect to a ray-traced dispersion relation of the experimental geometry and crosschecked via tabulated dominant Ti K-shell transitions.
The transfer function of the x-ray spectrometer was calculated using a detailed quantitative ray-tracing analysis [24]. This procedure accounted for all relevant geometric factors (source-to-crystal and crystal-to-detector distances, crystal and detector dimension, and bending-broadened reflection curves of the crystal). The computed transfer characteristics of the spectrometer relate one photon impinging on the detector to TF = 1.2 × 10⁷ photons emitted from the source over the whole solid angle. The fluorescence yields were taken into account to calculate the photon production probability for a given electron. This allowed to finally determine the relation between the relation of K-shell photons to HEs by using the spatially integrated signal recorded on the detector within the above-mentioned photon energy range 4450–4650 eV. It is also worth noticing that in our conditions the generation of Kα photons due to photo-pumping from the x-rays produced in the plasma corona is negligible. This is due to the relatively low temperature and to the relatively low emission of x-rays (since the ablator is low-Z).
As for the emission from the Cu tracer layers, 2D-resolved (time-integrated) images of the Cu Kα source were recorded with a quartz crystal (4 2 2) spherically bent to a radius of 380 mm. Images were recorded on x-ray film Kodak Industrex AA400, digitized with a scanner providing spatial resolution of 5.3 µm, and converted to incident photon fluxes by using the film calibration curve and filter transmission.
The combination of Cu Kα radiation (photon energy 8047.8 eV) and of the crystal interplanar spacing 2d = 0.154 14 nm results in quasi-normal incidence configuration with a Bragg angle at the centre of the crystal θB = 88.15°. The range of photon energies reflected from the crystal surface is limited to 3.86 eV, which is comparable to the FWHM width of the cold Cu Kα1 emission (2.29 eV). The signal collected by the crystal therefore corresponds only to a fraction of the K-shell emission due to HEs. To take this effect into account, the recorded signal was complemented to the information obtained via high-resolution spectroscopy.
Cu K-shell spectra were observed at an angle of 10° to the target surface by using the x-ray spectrometer equipped with the crystal of quartz (2 2 3) spherically bent to a radius of 150 mm. The spectrometer was aligned to cover the photon energy range of 7.9–8.5 keV and provided 1D spatial resolution of 14 µm in the direction of the target normal. The spectra were again recorded on x-ray film, calibrated with respect to the dispersion relation of the experimental geometry and cross-checked via tabulated dominant Cu K-shell transitions (Kα doublet, resonance w and intercombination y line of He-like Cu). The recorded signal was converted to an absolute intensity taking into account crystal reflectivity and filter transmission.
In addition to using Kα diagnostics, we also characterized HE by detecting the hard x-ray emission with a bremsstrahlung cannon [25, 26]. This hard x-ray spectrometer, placed inside the experimental chamber, allowed inferring the high-energy bremsstrahlung-produced photon distribution and hence indirectly estimating the HE energy distribution. The detector was made of a stack of 14 IP's separated by filters, leading to different transmission curves for each IP. Incident bremsstrahlung spectra (and then HE 'temperatures') were obtained with the help of GEANT4 Monte Carlo simulations using the measured doses released in the IP's, as well the IP sensitivities [27].
The simultaneous use of the three diagnostics provides higher confidence in obtained results.
The onset of parametric instabilities was studied by measuring the back-reflected radiation [28, 29]. We measured both the time-resolved emitted spectra and the reflected energy in the different spectral regions, by suitable spectroscopic and calorimetric tools. Details on the setup can be found in [29].
Finally, in order to study shock propagation, we used a shock chronometry diagnostics based on streaked optical pyrometry. The target rear-side is imaged on the slit of a streak camera, recording self-emission in the visible range of the electro-magnetic spectrum [30–32]. This allows to determine shock transit time through the sample. Shock pressure is then inferred by using hydrodynamic simulations reproducing the experimental shock breakout time.
3. Hot electron characterization
We characterized HE generation by either comparing Cu Kα and Ti Kα emission, or by studying the dependence of Ti Kα emission on the thickness of the plastic layer. As described in the previous section we used three different diagnostics simultaneously.
- (i)Kα imaging, using a spherically bent Bragg crystal, providing an image of the Kα source. The signal was processed and integrated spatially to provide the total Kα yield. The drawback of this diagnostics is its very narrow bandwidth, which implies the possibility of losing a part of the Kα signal whenever matter is significantly ionized and heated producing a shift of the Kα emission (indeed in ionized atoms the screening effect of electrons on nuclear charge is reduced, causing a shrink of the energy levels).
- (ii)X-ray spectroscopy, centered on the Kα line. This diagnostic complements imaging data, since it can easily detect the shift of Kα emission. In addition, it allows estimating the continuum due to bremsstrahlung emission which may also partially superimpose to the Kα signal
- (iii)Bremsstrahlung cannon, allowing measuring the hardest x-rays generated by HE propagation inside the target.
An example of the Ti K-shell spectra emitted from the non-coated 5 µm-thick Ti foil irradiated by the 1ω-beam, is presented in figure 2. The spectra emitted from the central part of the laser focal spot and from its periphery are governed, respectively, by the inner-shell Kα emission (singly ionized up to B-like Ti), and by line transitions in highly ionized atoms (Be- up to He-like w and y lines).
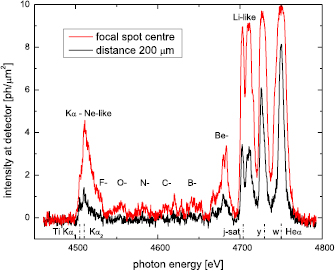
Figure 2. Ti K-shell spectra emitted from the central part of the laser focal spot and from its periphery.
Download figure:
Standard image High-resolution imageDetailed interpretation of these spectral features depends on two factors, namely hot electron (HE) production as a driving force, and the heated, variable-temperature target material as a diagnostic medium. Modelling of relevant spectra was performed using the collisional-radiative atomic code FLYCHK [33]. The synthetized spectra proved that the occurrence of singly-ionized Ti Kα1,2 to B-like transitions in the photon energy range up to approximately 4650 eV is due to HE interaction with Ti at bulk temperature T ⩽ 200 eV. At higher bulk temperatures, the K-shell emissivity is instead governed by thermal emission and the effect of HEs is of secondary importance. Consequently, when studying HE generation, only the photon fluxes recorded in the spectral range of 4450–4650 eV were taken into account, corresponding to the range between Kα and B-like Ti emission (see figure 2). The number of these photons was then related to HE population via Monte-Carlo simulations. We used GEANT4 combined to the PENELOPE physics library [34, 35] to simulate HE propagation and K-shell emission inside the studied targets. Note that K-shell ionization cross sections are provided by PENELOPE, which is known to reproduce experimental data rather well [23]. The use of a Monte–Carlo code assumes that HEs propagate through cold materials. Moreover, only collisional effects are treated in GEANT4, which means that collective effects such as self-consistent magnetic and electrostatic fields are fully ignored. Indeed, such a Monte–Carlo approach does not intend to fully model the experiment, but it is used as a benchmark for interpreting data. The resulting photon fluxes detected in dependence on the plastic coating thickness is given in figure 3.
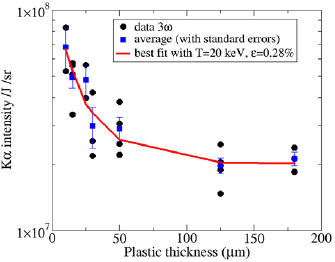
Figure 3. Ti Kα emission versus thickness of plastic overlayer. 3ω irradiation, intensity of 3 × 10¹⁵ W cm−2.
Download figure:
Standard image High-resolution imageFigure 3 shows the Kα intensity versus target thickness, at 3ω and laser intensity of about 3 × 10¹⁵ W cm−2. The black scattered points represent the measured fluxes while the blue squares are the average values at each thickness. The associated error bars are defined as SE = SD/√n, where SD is the standard deviation of the sample and n is the number of data points. The red line in figure 3 is the result of the Monte–Carlo simulation using an HE exponential energy distribution function [≈exp(−E/Thot)], with temperature Thot ≈ 20 keV, which was the one that better approximates the experimental data.
The results obtained following this procedure are reported in table 1, at both 1ω and 3ω.
Table 1. HE characteristics at 3ω and 1ω irradiation deduced from the χ2 minimization procedure. We assumed an exponential distribution for the HE energy, described as exp(−E/Thot). Here ε is the laser-to-electrons conversion efficiency.
| 3ω, Elaser = 200 J | 1ω, Elaser = 650 J | |
|---|---|---|
| I = 3 × 10¹⁵ W cm−2 | I = 1016 W cm−2 | |
| Thot (keV) |  |
 |
| ε (%) |  |
 |
The data in table 1 imply that the HE temperature is in both cases in agreement with theoretical estimates for the HE generation from SRS, obtained by considering the phase velocity  of the driven plasma waves in the density regions obtained by experimental spectra [28]. Also, the conversion efficiency is much larger at 1ω, as expected, due to the much larger impact of parametric instabilities. Figure 3 also shows the presence of some Kα emission even from targets with plastic layer thickness of 125 and 180 µm. This implies a non-negligible number of electrons with energy higher than 100 keV, since only electrons with such an energy can cross 125 µm of plastic. This Kα contribution could be due to HE produced by TPD or other mechanisms.
Figure 4 shows Cu spectra obtained from bare Cu targets. These clearly demonstrate the effect of the wavelength dependence of laser plasma coupling: at 1ω the typical density of the interaction region (≈critical density) is lower and the target temperature is higher (both due to the higher intensity and to the lower density). This results in an increased emission of inner shell electronic transitions in less ionized atoms (Kα transitions in single-ionized Cu II overlapped by Cu III up to Cu XIX emission). At 3ω, instead, Cu K-shell emission is governed by the resonance line transitions in highly ionized atoms and their satellites (the so-called quasi-optical transitions). Complementary spectral structure observed between Kα and Heα lines belongs to emission from Li-like to Ne-like copper ions.
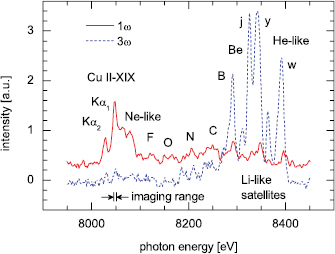
Figure 4. X-ray spectra emitted from Cu targets (no coating) subject to 1ω and 3ω laser radiation.
Download figure:
Standard image High-resolution imageIn addition to high-resolution x-ray spectroscopic investigation, the bremsstrahlung cannon also allowed inferring the high-energy photon distribution and hence indirectly estimate the HE energy distribution. Typical results from this diagnostic are shown in figure 5.

Figure 5. Raw data (each circle corresponds to the signal recorded on a single IP) and related fit and deduced photon spectrum at 3ω (left panel) and 1ω (right panel) irradiation.
Download figure:
Standard image High-resolution imageRaw cannon data were analysed by using Monte Carlo simulations. Best results were systematically obtained using a single exponential photon energy distribution, exp(−E/Tγ), and are given in table 2 (notice: the value in the figure, 18 keV, differs from that in the table, 20 keV, because this last one is the average over different shots)
Table 2. Bremsstrahlung emission characteristics at 3ω and 1ω irradiation deduced from BSC data. 'Temperature' of the photon distribution and number of emitted photons per unit solid angle.
| 3ω, Elaser = 200 J | 1ω, Elaser = 650 J | |
|---|---|---|
| I = 3 × 10¹⁵ W cm−2 | I = 1016 W cm−2 | |
| Tγ (keV) | 20 ± 6 | 30 ± 9 |
| Nγ (/sr) | 7 · 108 ± 2 · 108 | 4 · 1010 ± 1 · 1010 |
The inferred Bremsstrahlung spectra give direct information on the HE distribution, since in first approximation Tγ ≈ Thot. The data in table 2 confirm, within error bars, the values of HE temperature obtained using Kα spectroscopy and Kα imaging (table 1). They also confirm that HE conversion efficiency is much larger at 1ω than at 3ω.
The lack of a higher energy component in bremsstrahlung emission could be explained as follows. At high electron energies bremsstrahlung emission is strongly peaked in the direction of motion of the HE beam, and the bremsstrahlung cannon might simply be outside the lobe of emission of the highest energy electrons.
4. Parametric instabilities
In 3ω shots, back-reflectivity was dominated by SBS and laser reflection, accounting for 3%–15% of laser energy [28, 29]. Poor spectral resolution, however, did not allow separating SBS contribution from laser reflection. The energy backscattered by SRS was lower than 0.2% and exhibited an increasing trend with the auxiliary-main pulse delay [29]. DUED hydrodynamic simulations [36] showed that the delay between auxiliary and main pulses affected the interaction conditions mainly by modifying the density scalelength of the plasma, increasing from 50 to 100 µm as the pulse delay increased from 0 to 1200 ps, while the plasma temperature remained roughly the same in the regions of interest for instabilities. Considering that larger delays produce longer plasmas, the trend of SRS with the time delay confirmed that SRS gain and threshold were mainly limited by inhomogeneity effects and had a convective character.
Emission spectra showed broad and non-reproducible peaks in the spectral range 630–750 nm (figure 6), implying that SRS was driven at densities 0.10–0.15 ncr, well below the ncr/4 region. By considering the electrons moving with the phase velocity of plasma waves at these densities, HE generated by SRS are expected to have a temperature about 18 keV [37] which is in agreement with the main component measured in the experiment; such an agreement suggested that SRS was the main source of HE in the present experiment. Considering that the low-density limit of the SRS unstable region (ne/ncr ≈ 0.1) corresponds to keλD ≈ 0.27 for a temperature Te = 1.5 keV (as estimated from the CHIC and DUED hydro-simulations at the time of SRS onset), it is clear that the low-density edge of SRS region was limited by Landau damping.
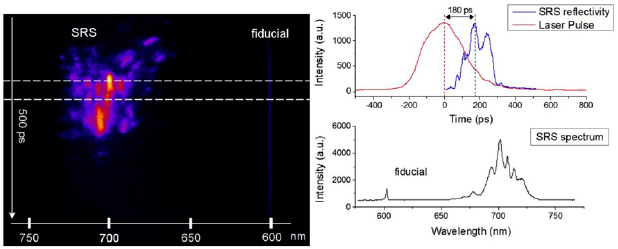
Figure 6. (left) time-resolved SRS spectrum obtained at 3ω a laser intensity I ≈ 4.1 × 10¹⁵ W cm−2 and no auxiliary pulse. The acquisition time window, spanning the vertical axis, is 500 ps; (centre) temporal profiles of laser pulse and SRS emission; (right) SRS spectrum emitted in the selected time window in the image.
Download figure:
Standard image High-resolution imageAt slightly higher densities (ne/ncr ≈ 0.12), where SRS emission was maximal, the instability was mostly limited by the length of the resonance region l where the k-matching is satisfied, which determined also the SRS threshold. In the present experiment l ≈ 1.5 µm ≈ 3.4 λ0, as usually calculated by imposing  where
where  is the wavenumber mismatch of the interacting waves [37], resulting in a SRS threshold ISRS = (4.5–8) ×1015 W cm−2 [38]. It can be calculated that such a threshold almost doubles when other damping factors of EPWs are taken into account, as for example Landau damping and side-loss of electrons from the speckles. It is therefore evident that in all the shots the laser intensity was lower than the SRS threshold. However, the intensity in laser speckles can be much higher than the envelope intensity. Therefore, the statistics of local intensity in speckles should be considered to explain the experimental results. An accurate investigation of these effects is reported in [28], where the experimental results were compared to those calculated by the radiative-hydrodynamic code CHIC. As described in section 5, the code was modified to account for the local intensity in the beam speckles and included self-consistent calculations of non-linear laser plasma interactions, by using suitable scaling laws [39]. The results clearly showed that a correct modelling of the speckle intensity statistics into the beam allows the experimentally observed SRS reflectivity to be explained.
Interesting details on SRS were also retrieved from time resolved measurements (figure 6). Streaked spectra showed that SRS was driven in the trailing part of the laser pulse, with a time delay of the SRS peak from the laser peak around 200 ps. This can be understood by considering that density scale-length progressively increased during laser irradiation and reached the maximum value at a time of 300–400 ps after the laser peak. Since the convective SRS gain, through the Rosenbluth parameter [40], is proportional to the product of laser intensity and density scalelength, the instability maximized at a certain time after the laser peak. In addition, plasma temperature was expected to fall after the laser peak. Therefore, at the time of SRS onset, both Landau damping and side-loss of electrons from the speckles, due to thermal motion, were significantly reduced.
Streak camera measurements with higher temporal resolution (Δt ≈ 8 ps) also revealed a bursty behaviour of SRS, where the duration of the measured emission spikes was limited by time resolution (see figure 8 in [29]). In agreement with numerical PIC simulations, this confirmed the presence of kinetic mechanisms ruling SRS emission, where large electron plasma waves (EPW) were repeatedly driven and successively damped by nonlinear frequency detuning, due to ponderomotive and electron trapping effects.
Both 3/2 ω0 and ω0/2 harmonics were detected, indicating that a fraction of laser energy reached the ncr/4 surface; the splitting of these spectra also suggested the prevalence of TPD over absolute SRS in this density region of the plasma. Due to the linear dependence of TPD threshold on the plasma temperature, it is in fact expected that in the ncr/4 region SRS starts to dominate on TPD at temperatures higher (Te > 4 keV) than that obtained in our experiment. At the same time, our low temperature (Te < 2 keV) results in a Landau damping rate significantly lower than in realistic full-scale shock-ignition plasmas and allows SRS to develop convectively in lower density regions, as experimentally observed. A more careful analysis of the half harmonic spectra revealed that different instabilities were driven in different plasma regions near ncr/4: while TPD was convectively driven at low densities ≈0.21–0.22 ncr near the Landau cut-off (ke ≈ 2.3k0, keλD ≈ 0.27 for Te = 1.5 keV), hybrid TPD/SRS was present near ncr/4 (ne ≈ 0.24 ncr, ke ≈ k0). The EPWs driven by the latter process could in principle give rise to very energetic HE (Thot > 100 keV), which could therefore explain the Kα emission measured for plastic thickness of 125 and 180 µm (figure 3). However, their flux is expected to be limited by the small number of thermal electrons that can be trapped at so large EPW phase velocities, unless a staged acceleration of electrons from low-density regions occurred, as suggested by Yan et al [41].
Also in 1ω shots, back-reflected energy was dominated by SBS and laser reflection, consisting of 12%–18% of laser energy. Measurements showed that light backscattered in the lens cone by SRS was here higher than in 3ω shots, around 0.5%–5% of laser energy, which can be explained by the higher Iλ2 factor (~18 times than in 3ω shots) and by the larger size of speckles, which reduced the side-loss of electrons. This value however did not include light in the spectral range 2550–2650 nm, which could not be measured by our calorimetric/spectroscopic apparatus. Time-integrated IR spectra showed that backscattered light covered the spectral range 2200–2550 (which was the upper wavelength limit of the detector) and was peaked around 2400–2450 nm (figure 7). By considering a plasma temperature Te ≈ 3–4 keV, as given by CHIC hydro-simulations, emission spectra indicated that backward SRS was excited mainly at densities ne ≈ 0.185 ncr and extended down to ~0.12 ncr. It is worth noting that EPWs excited at ne ≈ 0.185 ncr in a plasma with temperature ~4 keV are expected to generate HE with Thot ≈ 40 keV, which is close to the values obtained by Kα spectroscopy and Bremsstrahlung x-ray spectra.

Figure 7. Time-integrated SRS spectrum obtained at 1ω and laser intensity I ≈ 2 × 10¹⁶ W cm−2.
Download figure:
Standard image High-resolution imageTime-integrated spectral measurements in the visible range exhibited integer harmonics up to 4ω0, denoting non-linear laser interaction near critical density, and half-integer harmonics up to 7/2ω0, indicating Thomson scattering of laser light and integer harmonics with EPWs driven by SRS and TPD. The analysis of half-harmonics suggested the presence of SRS down to low densities (< 0.1 ncr), which was made possible by the occurrence of side-scattering SRS, maybe in inflationary regime, resulting in a reduction of the Landau damping, as shown by PIC simulations at high laser intensity [42]. However, the amount of side-scattered reflected light could not be quantified.
5. LPI and HE model for advanced hydrodynamic simulations
Modelling nonlinear laser-plasma interaction (LPI) and the laser-plasma-electron coupling on hydrodynamic scales poses severe difficulties related to the accurate description of the laser intensity in plasmas and the consistent description of HE sources from the laser propagation model. These limitations are related to the use of geometrical optics, which implies a ray-tracing description of the wave field and does not allow for robust evaluations of the laser intensity in plasma. We have developed an approach to hydrodynamic modelling that relies on paraxial complex geometrical optics (PCGO) [43] to describe the laser propagation in plasma using randomly distributed Gaussian optical beamlets. It is coupled to a model for the HE source and reduced HE transport model that describes electron propagation and computes energy deposition. The model for HE transport is based on the angular scattering approximation [44], adapted to two-dimensional (2D), transversally Gaussian, multigroup HE beams of arbitrary angular distribution. We consider the simultaneous and concurrent acceleration of HE by resonant absorption (RA), SRS, and TPD. This coupled LPI-HE model has been implemented in the CHIC arbitrary Lagrangian-Eulerian radiative hydrodynamic code [45], and is computed inline, i.e. within hydrodynamic time steps.
The reduced electron transport model is derived from the kinetic Vlasov–Fokker–Planck equation by considering electron-ion and electron–electron collisions. The HE distribution function is decomposed on the basis of spherical harmonics at first order, and the mean scattering angle is expressed as a function of the curvilinear electron beam coordinate. Assuming the HE beam propagates along a straight line, the energy loss is induced by bound electrons, free electrons, and plasmons. Scattering on background electrons and ions widens the beam as a significant process in ICF conditions. Each HE beam is described by an exponential distribution function in energy that is logarithmically discretized in a series of monoenergetic beamlets. This multigroup model for HE transport in plasmas has been validated with a reference code [46] for various cases in homogeneous and inhomogeneous plasmas. The free parameters defining a given HE source are the initial energy flux, mean temperature, angular distribution, and direction. Those parameters are determined with intensive PIC simulations.
The characterization of HE sources from parametric instabilities is inherently challenging. Theoretical works have demonstrated that the temperature of TPD-HEs is not related to the EPW's phase velocity at the quarter critical density (ncr/4), because electrons undergo an acceleration stage. Time-dependent scaling laws for the flux and the temperature as a function of laser intensity were proposed from extensive PIC simulations in the 1015–1016W cm−2 intensity range with λ = 351 nm and in plasmas of electron temperature ≈2 keV. The steady-state values of these scaling laws are used within CHIC to define HE sources from TPD. The EPWs excited by TPD have privileged directions at ±45° with respect to the pump. Shared pump wave processes and plasma density modulations have been shown to be significant in ICF regimes and spread the optimal angle of forward HE emission in various directions in that cone. We assume that the multiplicity of configurations for the pump and daughter waves produces a uniform HE emission in the −45° to +45° cone with respect to the PCGO ray direction. This spread is obtained by superimposing electron beamlets at various angles. HEs from TPD are emitted at ncr/4, both forward and backward.
Contrary to the TPD process, the energy of SRS-induced HE is correlated with the phase velocity of the EPW at its resonance point and not with the laser intensity driving SRS (ISRS). Conversely, the number of HEs scales with ISRS. The asymptotic HE flux is set to 12.5% of the pump intensity (ISRS), which is the maximum number of forward HEs that SRS can drive in a steady state. The shape of the flux function is chosen to be similar to that of TPD, and rearranged to correspond to experimental estimates. The relative pump intensity is defined with respect to the absolute instability threshold in inhomogeneous plasma and at ncr/4. In order to account for the Raman gap observed in experiments, we assume that SRS takes place at plasma densities lower than ncr/4. Experiments have shown that SRS-driven HEs are directional with respect to the laser drive. Consequently, HE sources from SRS are initialized in the direction of the pump wave with no initial angular spread, although a 'global' spread arises due to the different direction of laser Gaussian optical beamlets in the plasma.
6. Shock dynamics
We performed several experiments on shock wave dynamics. In two previous experiments [15–17], we studied shock transit time versus laser intensity, at 3ω. Targets with approximately the same thickness (25 µm of plastic and 5–10 µm of higher-Z tracer) were used. Recently, we studied transit time versus target thickness at both 3ω and 1ω. We kept laser energy (and then intensity) fixed: about 110 J in the nominal spot at 3ω and 300 J at 1ω. Figure 8 shows streaked images of two shots at 3ω and 1ω. Both shots were performed using 50 µm plastic thickness. For the 3ω case we observe a very low preheating signal before shock breakout. Moreover, the shock breakout ramp is steep, which suggests that the preheating did not dramatically affect the Ti layer. In the shot at 1ω, instead, the preheating signal is comparable with the shock breakout signal. In addition, the rise of the shock breakout signal is significantly affected by preheating.
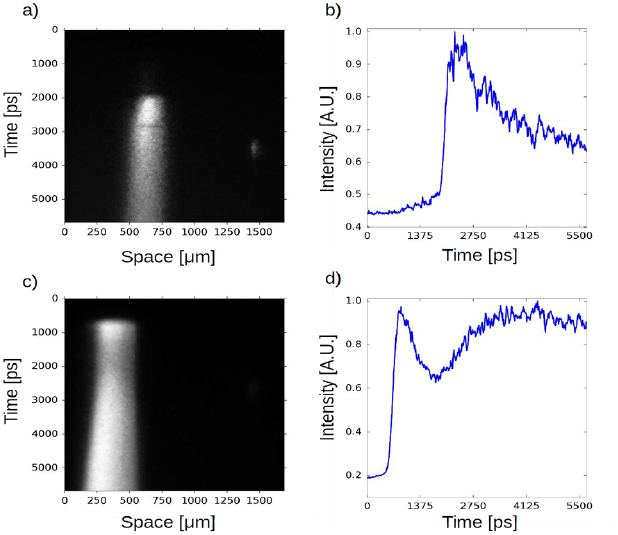
Figure 8. Streak images and intensity versus time lineout: (a) and (b) shot at 3ω and I = 3 × 10¹⁵ W cm−2 and lineout at space coordinate x = 625 µm. (c) and (d) 1ω; I = 1016 W cm−2, x = 300 µm in (d). Thickness of the plastic layer: 50 µm in both cases.
Download figure:
Standard image High-resolution imageExperiments showed the expected trends for shock breakout times (and hence shock velocity and drive pressure) versus both laser intensity and target thickness. However, shock break-out times always turned out to be significantly longer than expected from simple models and pure hydrodynamics simulations, as reported in [15] (see, in particular, figure 5). A summary of data is presented in figure 9, showing shock break-out times versus target thickness, for 3ω shots. Detailed analysis and comparison with simulations will be discussed in a forthcoming publication.
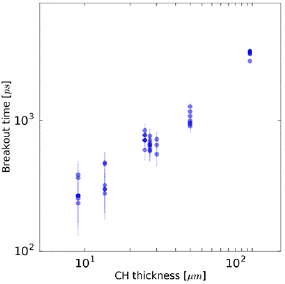
Figure 9. PALS experiment. Laser pulse at 3ω and intensity I = 3 × 10¹⁵ W cm−2. Targets: plastic layer and 10 µm Ti layer. The figure shows shock breakout times versus thickness of the plastic layer.
Download figure:
Standard image High-resolution imageIn discussing the comparison between experiments, simulations, and simple scaling laws, we proceeded by steps, which allowed revealing the importance of the different processes.
- (i)First we carefully characterized the laser focal spot which was imaged at high (although not full) energy on the streak camera used for shock chronometry operated in focus mode, after inserting appropriate filter on the beam to reduce the laser intensity. This resulted to be approximately Gaussian with a FWHM of 100 µm consistently with the design of the used phase plate. However, we also needed to take into account the real energy deposited on target within the nominal focal spot size. This required dedicated measurements in which the laser beam was focused on pin-holes of different diameters and we measured the energy going through the pinholes. Results showed that the nominal focal spot is superimposed to a larger energy 'plateau' and that about only 55% of the laser energy is actually deposited within the spot. This reduction of the effective energy was always taken into account in our evaluation of the laser intensity on targets and in following simulations.
- (ii)Then, we performed 2D simulations with purely hydrodynamic models, i.e. by neglecting any effect due to LPI and HE. We found that the experimental break out times could be approximately recovered by DUED and CHIC simulations with laser intensity reduced by a factor about 2. (Notice that instead hydrosimulations correctly reproduce recent experiments on shock propagation conducted at lower intensities by Baton et al [47] and by Hohenberger et al [48]). From the simulations that reproduced the experimental break-out times we could infer a laser-induced peak ablation pressure of about 90 Mbar at intensity of the order of (0.5–1) × 1016 W cm−2. This pressure is much lower than the 200–300 Mbar predicted at these laser intensities from well-known, simple 1D scaling laws relating shock pressure to intensity [p(Mbar) = 40 (I/λ)2/3, with the intensity in units of 1015 W cm−2 and the wavelength in µm; see equation (47) of [49].
- (iii)We understood that shock pressure during laser interaction is strongly affected by the spot size. In our experiments, the distance between the laser absorption layer and the ablation region (≈60 µm) is comparable to spot size. Pressure therefore decreases due to the lateral energy flow in the overcritical region. To evaluating such an effect, we performed simulations with the same intensity but increased focal spot size, approaching a 1D ideal case. This considerably reduced the lateral flow and increased the pressure generated. For instance, for the case previously cited, the maximum pressure increases by a factor of ≈2 to ≈180 Mbar. The effect and the pressure increase were similar for all investigated laser intensities. Notice that this effect significantly contributes to the discrepancy between 1D scaling laws and inferred pressure, but cannot explain the discrepancy between 2D hydro simulation and experimental data.
- (iv)Next, we run simulations using the PCGO description including the generation of HE but without considering their effect on hydrodynamics. Here the main difference with normal hydro simulations is that we have a better description of laser absorption. Collisional absorption is modelled more precisely, and RA and effects of parametric instabilities are taken into account. For a typical run at 3ω, 1.3% of the laser energy is resonantly absorbed at the critical surface layer, early in the interaction, thus increasing the shock pressure and velocity. SRS and TPD start slightly later generating HE with temperatures and fluxes (averaged in time and space over the laser profile) of ≈40 keV and ≈1% of laser energy, respectively. These values are of the same order of magnitude and not too far from those experimentally measured taking into account experimental error bars (see section 3 'HE characterisation'). In the 3ω case the overall effect is a slight reduction of absorbed laser energy and hence a hence a very small decrease of shock pressure and increase of shock breakout time. The integrated reflectivity in the simulation is 28%, in good agreement with the experimental measurements of 25 ± 10%. However, such simulations still predict a shock breakout time much shorter than the experimental timings.
- (v)Finally, we performed simulations using the full multiscale LPI-HE model. In this case, SRS and TPD-generated HE beams gradually preheat the bulk of the target both in front and behind of the shock to a few tens of eV, as illustrated in figure 10. Preheating of the dense cold target raises the plasma pressure at a nearly constant density, thus increasing the shock velocity which scales as √(P/ρ). However, HE preheating also rises the local sound velocity, thus significantly decreasing target compression during laser drive, i.e. the shock strength. Although the shock strength is lower, the local pressure increase leads to a post-shock pressure that is higher with HEs, up to 40% with respect to simulations without HEs, depending on the targets. Simultaneously to the bulk preheat, LPI-generated HEs that reach the target rear surface heat it to several eV, thus initiating a backside plasma expansion that delays the shock breakout. For instance, in the case shown in figure 10, the shock breaks out at t = 1.2 ns, versus t = 0.9 ns in a simulation not accounting for preheating. This effect contributes, at least partly, to explaining the discrepancy between experimental and simulated shock breakout times and simulated ones. It also suggests that pressures are underestimated when analysing experiments with pure hydro simulations.
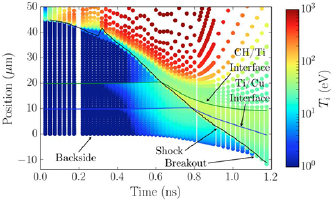
Figure 10. Evolution of ion temperature (eV, Log-scale) inside an irradiated CH/Ti/Cu target as a function of time (ns) and depth in the target (µm), along the laser axis. The solid lines show the locations of the tracer interfaces.
Download figure:
Standard image High-resolution imageThe results obtained at 1ω (λ = 1314 nm) generally show the same trends. At 1ω, preheating is clearly visible in the streak camera images (see figure 8) as an early signal before shock breakout. However, the laser to HE conversion efficiency is much higher, when compared to experimental results (as those in table 1). This is not a surprise since the scaling laws used to define HE sources from TPD and SRS have mainly been derived from experiments at 3ω. Such overestimation produces a stronger target heating and a bigger expansion before shock breakout as compared to experimental results.
7. PIC simulations for LPI
The radiation hydrodynamic simulations of the PALS experiment, with laser wavelength λ0 = 1.314 µm and a plane CH target, have been compared with kinetic simulations for several selected time moments within the laser pulse. The goal of these kinetic simulations is to evaluate how the laser plasma nonlinear microscopic interaction processes, omitted in the hydrodynamic model, are modifying the global plasma characteristics. The kinetic simulations are performed with the relativistic electromagnetic code EPOCH [50] in planar 2D geometry. Absorbing boundary conditions were applied for both electromagnetic fields and particles. Two representative instants are selected, during the laser pulse, as shown in figure 11(a). Case A corresponds to a relatively low intensity of 4 × 10¹⁵ W cm−2 at time t = 250 ps, while case B corresponds to the pulse maximum at time t = 450 ps with the intensity 2 × 10¹⁶ W cm−2. As kinetic simulations consider a relatively small plasma volume of 50 laser wavelengths in the transverse direction, the laser pulse is assumed to be a plane wave with 1 ps rise time following a constant intensity corresponding to red circles in figure 11(a). Each simulation is run for about 10 ps until a quasi-stationary state has been reached that can be compared with the corresponding macroscopic data. The initial conditions for the kinetic simulations are obtained from hydrodynamics simulations with the code CHIC (see above), which provides density (figure 11(b)) and temperature distributions of the corona at the corresponding time moments. In the kinetic simulations, only part of the plasma with minimum and maximum densities of 1% and 100% of the critical density was considered. Spatial resolution  and time step
  were chosen to resolve the Debye length, where
  is the laser frequency. The simulation box length was 180 λ0 for case A and 350 λ0 for case B. Case A corresponds to density scale length of 29 λ0, electron temperature of 2.7 keV, ion temperature of 155 eV and average ion charge of 3.5. Case B corresponds to density scale length of 47 λ0, electron temperature 4.3 keV, ion temperature 245 eV and the same ion charge of 3.5.

Figure 11. (a) Temporal profile of the laser intensity and the selected simulation case A and B. (b) Initial electron density distributions for the two simulation cases.
Download figure:
Standard image High-resolution imageThe simulations converge to a quasi-steady state after 5–10 ps where a comparison with the hydro simulations and experiment can be made. Kinetic simulations show that the energy balance is dominated by SBS backscattering in early interaction, case A. The reflectivity saturates at that time at the level of 40% (figure 12(a)) and the average electron temperature increases from 2.3 to 4 keV. A high SBS reflectivity is explained by a low ion temperature and consequently a very low damping of ion acoustic waves [37, 51–54]. Consequently, SBS saturated on a rather high level. Conversely, SRS is very weak at that time because the secondary Langmuir decay instability (LDI) has a very low threshold and quickly saturates the SRS growth. The maximum SRS reflectivity is about 3% and on average this is about 1%. These values are of the order of magnitude of the measured HE energy fraction. The energy spectra of the electrons are presented in figure 12(b). In the case A, the HE temperature is in the range of 50–70 keV. The analysis of the energy transmitted through the right boundary of the simulation box shows that the energy flux is dominated by thermal electrons and contribution of SRS-generated HE with energies above 50 keV is less than 4%.

Figure 12. (a) The reflectivity with the different frequency domain to distinguish SRS and SBS. (b) The electron energy spectra for the two cases with different simulation time.
Download figure:
Standard image High-resolution image
With the increase of intensity in later interaction stage (case B), the bulk electrons are heated to the temperature of 6.2 keV and SRS attains a level of a few percent (figure 12(a)). Inspection of the plasma wave activity shows that it is localized near the quarter critical density region. However, the backward SBS still dominates reflectivity, which decreases to the level of 15% (figure 12(a)). A part of absorbed energy is transferred to HE generation. In case B, the HE temperature is in the range of 70–130 keV (figure 12(b)). SRS is identified as the major source of electron heating and HE generation. These HE contribute to about 40% to the energy flux transported from the corona to the dense plasma.
The presented results of kinetic simulations significantly contribute to shed light on the laser plasma interaction and are a unique tool to explain the experimental data. In our case, they confirm that SBS dominates light reflectivity; considering the progressive reduction of SBS with time, as suggested by simulations, the back-reflected energy tends to approach the value that was measured in the experiment. PIC data also show that SRS increases with time, reaching reflectivity values around a few percent, and that it is the main driving source of HE. All these features roughly agree with the experiment, even if for the moment they also show a significant discrepancy for what concern the plasma temperature, which in the PIC simulations is much higher than from experimental data or hydrosimulations.
Finally, the HE conversion efficiencies by SRS and TPD found by the numerical simulations are in good agreement with the predictions of hydrodynamic simulations. This confirms that the nonlinear laser plasma interaction package implemented in the hydrodynamic code provides quite reasonable results. Concerning the HE temperature, a meaningful quantitative comparison between numerical simulations and experimental data is quite difficult, since HE energy distributions significantly change with time while the experiment only provides time-averaged values. However, further comparisons between numerical simulations and experimental data will allow to improve the code predictive capabilities and to extend its domain of validity.
8. Conclusions
We have reported a wide study of the physical processes occurring in laser plasma interactions under conditions approaching those relevant to SI (but, of course, with lower electron temperature and significantly shorter plasma density gradient scale-lengths). A combination of several high-resolution diagnostics in optical and x-ray domains and advanced numerical simulations with radiation hydrodynamic and particle-in-cell codes allows to predict the plasma characteristics and identify the nonlinear processes of HE generation and transport. Generally we found a good agreement between the results obtained by advanced hydrodynamics simulations with experimental results in the UV domain of laser wavelengths (λ ~ 0.35–0.45 µm). For the case of 1ω irradiation, our experimental results thus provide indications on improving the performance of existent numerical tools in the IR domain. PIC simulations confirm several experimental results like the fact that SBS dominates light reflectivity, that SRS increases with time, reaching reflectivity values around a few percent, and that it is the main driving source of HE. Future works and comparisons between numerical simulations and experimental data will allow to improve the predictive capabilities of both PIC and advanced hydrocodes.
Future studies should be dedicated to reaching a better control of parametric processes and mitigation of the undesirable effects from HE, while maintaining their capacity of increasing shock strength.
Acknowledgment
This work has been carried out within the framework of the EUROfusion Enabling Research Project: AWP17-ENR-IFE-CEA-01 «Preparation and Realization of European Shock Ignition Experiments» and has received funding from the Euratom research and training programme 2014–2018 under grant agreement No 633053. The views and opinions expressed herein do not necessarily reflect those of the European Commission.
The work was also supported by the European Union under the Laserlab program, by the Competitiveness Program of NRNU MEPhI, Russia, and by the Czech Ministry of Education, Youth and Sports, projects LD14089, LM2015083 and LM2010014. The authors also acknowledge targeted support of Large Infrastructures, ELI Beamlines Project LQ1606 of the National Programme of Sustainability II and ELI Tools for Advanced Simulation (ELITAS) (CZ.02.1.01/0.0/0.0/16 013/0001793) from European Regional Development Fund. Finally, the authors are grateful the PALS staff for help in running the experiments.