
Brain Functional Connectivity Asymmetry: Left Hemisphere Is More Modular
by
 , , , and
Lucia Jajcay
1,2,3 ,
,
David Tomeček
1,2,3,
Jiří Horáček
1,4,
Filip Španiel
1,4 and
Jaroslav Hlinka
1,2,* 1
National Institute of Mental Health, 250 67 Klecany, Czech Republic
2
Department of Complex Systems, Institute of Computer Science of the Czech Academy of Sciences, 182 07 Prague, Czech Republic
3
Faculty of Electrical Engineering, Czech Technical University in Prague, 166 27 Prague, Czech Republic
4
Department of Psychiatry, Third Faculty of Medicine, Charles University, 100 00 Prague, Czech Republic
*
Author to whom correspondence should be addressed.
Symmetry 2022, 14(4), 833; https://doi.org/10.3390/sym14040833
Submission received: 22 February 2022
/
Revised: 26 March 2022
/
Accepted: 13 April 2022
/
Published: 18 April 2022
(This article belongs to the Special Issue The Study of Brain Asymmetry)
Abstract
:Graph-theoretical approaches are increasingly used to study the brain and may enhance our understanding of its asymmetries. In this paper, we hypothesize that the structure of the left hemisphere is, on average, more modular. To this end, we analyzed resting-state functional magnetic resonance imaging data of 90 healthy subjects. We computed functional connectivity by Pearson’s correlation coefficient, turned the matrix into an unweighted graph by keeping a certain percentage of the strongest connections, and quantified modularity separately for the subgraph formed by each hemisphere. Our results show that the left hemisphere is more modular. The result is consistent across a range of binarization thresholds, regardless of whether the two hemispheres are thresholded together or separately. This illustrates that graph-theoretical analysis can provide a robust characterization of lateralization of brain functional connectivity.
1. Introduction
The human cerebrum is organized into two hemispheres. Macroscopically, the left and the right hemisphere appear to be largely symmetrical. Nonetheless, a variety of hemispheric asymmetries have long been established—in humans as well as, more recently, in nonhuman species (including “lower” vertebrates, such as fish)—with comparative studies of brain asymmetry dating back to the 19th century [1,2]. These asymmetries involve differences in neuroanatomy as well as the lateralization of brain function more dominantly to one side of the brain [3,4].
In terms of structural asymmetry, a recent large-scale meta-analysis of cerebral cortical asymmetry conducted by the ENIGMA (Enhancing NeuroImaging Genetics through Meta-Analysis) Consortium showed significant asymmetries in cortical thickness and surface area, both hemispheric and regional, particularly in regions involved in lateralized functions [5]. As repeatedly documented at the whole-brain level, the right hemisphere has a larger cortical surface area, while the left hemisphere has a thicker cortex [5,6]. This macroscopic cortical asymmetry is congruent with microscopic cortical architecture showing greater neuronal and neurite density in the left hemisphere, as demonstrated by post-mortem histological studies [7,8]. Moreover, diffusion tensor imaging has compellingly revealed a clear leftward asymmetry of the microstructure and connectivity of white matter tracts [9].
A range of higher functions, including memory, perception, learning, spatial cognition, attention, emotion processing, and complex motor skills, show some degree of hemispheric specialization—are lateralized to either hemisphere [10,11,12,13,14,15,16]. Functional asymmetry is most notably associated with language function lateralization [17]. In most human subjects, the language function is lateralized to the left hemisphere, as initially discovered by Broca [18]. The early hypothesis of left-handers being right-hemisphere dominant for language has been refuted [19]. Nevertheless, language dominance does appear to be related to handedness, with left-handedness associated with a higher probability of its lateralization to the right hemisphere [20,21].
Note that brain asymmetries are, to an extent, variable across individuals. This variability can be affected by biological factors such as age, sex, and genetic variation [5]. Moreover, a disruption of normal brain (a)symmetry—structural or functional—has also been associated with a number of neuropsychiatric conditions, such as dyslexia, aging, Alzheimer’s disease, schizophrenia, depression, and mood disorders [6,9,22,23,24,25]. Notably, an altered pattern of cerebral asymmetry is considered to be one of the neural correlates of schizophrenia [26,27,28].
Brain function is commonly characterized in terms of functional connectivity (FC), defined as the “temporal correlations between spatially remote brain events” [29]. In other words, the pattern of statistical dependencies of the activity of spatially separated brain regions, measured by methods such as functional magnetic resonance imaging (fMRI), provides FC estimates that characterize the network of functional relationships between these regions.
The growing interest in brain connectivity has led to a gradual adoption of methods of complex network analysis in neuroscience [30,31]. Symmetries of complex systems, such as the brain, are often represented as symmetries of the corresponding graph representation, such as that given by the functional connectivity matrix. Indeed, graph-theoretical approaches are increasingly being used to study the brain and describe the hemispheric asymmetry of its connectivity [32,33,34,35,36]. Interestingly, fMRI studies suggest a lateralized pattern of functional coupling in which the left hemisphere has greater inter-hemispheric connectivity, while the right hemisphere interacts across both hemispheres [23,37]. Nevertheless, brain asymmetry has not yet been fully characterized in a graph-theoretical sense.
In this paper, we thus characterize brain asymmetry using graph-theoretical approaches. Specifically, we investigate functional connectivity asymmetry in terms of modularity.
Modularity is a statistic that quantifies the degree to which a graph (or network) may be subdivided into clearly delineated groups of nodes (also called modules or clusters) [38,39,40]. The optimal community structure is a subdivision of the graph into nonoverlapping modules in a way that maximizes the number of edges (i.e., connections) within modules and minimizes the number of edges between different modules. Formally, modularity is defined as:
where denotes the link between nodes ; is the module number assigned to node i; is the degree of node i; and m is the number of modules [40].
Complex networks, including biological neural networks, are known to be hierarchically modular [41,42]. Indeed, each of the two cerebral hemispheres is further subdivided into functionally specialized regions (modules) [43]. Due to the hemispheric asymmetries mentioned above, we hypothesize that the left hemisphere is more modular. In order to verify this hypothesis, we measured healthy subjects’ resting-state fMRI data, estimated the functional connectivity graph of each subject, and compared the modularity of the two hemispheres. We also investigated the relationship between modularity and subject age, sex, and handedness.
2. Materials and Methods
2.1. Subjects
Ninety healthy control subjects (40 males—mean age 28.15 ± 6.90 years, 36 right-handed; 50 females—mean age 27.54 ± 6.82 years, 46 right-handed) participated in this study. The data were collected as part of the Early-Stage Schizophrenia Outcome (ESO) study, a prospective trial conducted in the Prague and Central Bohemia surveillance area, investigating first-episode schizophrenia spectrum subjects [44]. The study was conducted in accordance with the Declaration of Helsinki. The local Ethics Committee of the Prague Psychiatric Center approved the protocol on 29 June 2011 (protocol code 69/11). All participants were informed about the purpose of the study, the experimental procedures, as well as the fact that they could withdraw from the study at any time, and provided written informed consent prior to their participation. The subjects were recruited via local advertisements and excluded if a personal lifetime history of any psychiatric disorder or substance abuse was established by the Mini-International Neuropsychiatric Interview (M.I.N.I.) [45]. We used the expert translation of the fifth version of M.I.N.I. into Czech conducted by Petr Zvolský, a professor of psychiatry. This version has been used in clinical practice in the Czech Republic for many years [46]. Subjects were also excluded if meeting any of the following criteria: any psychotic disorder in first or second-degree relatives, current neurological disorders, a lifetime history of seizures or head injury with altered consciousness, intracranial hemorrhage or neurological sequelae, a history of mental retardation, a history of substance dependence, and any contraindication for MRI scanning. Handedness was assessed by the 10-item Edinburgh Handedness Inventory (EHI) (translated into Czech by Filip Španiel) [47]. The EHI provides a value ranging from 100 (fully right-handed) to −100 (fully left-handed). A threshold of 60 was used to establish right-handedness. Each participant underwent MRI scanning that included approximately 13 min (400 volumes) in the resting-state condition as well as the acquisition of an anatomical image. For the resting-state acquisition, the participants were instructed to lie still with their eyes closed while staying awake and not thinking of anything in particular.
2.2. Data Acquisition
Scanning was performed with a Siemens Trio 3T MRI scanner (Siemens Healthineers, Erlangen, Germany) located at the Institute for Clinical and Experimental Medicine in Prague, Czech Republic. Functional images were acquired during the resting-state condition using T2*-weighted echo-planar imaging (EPI) with blood oxygenation level-dependent (BOLD) contrast. GE-EPIs (TR/TE = 2000/30 ms, flip angle = 70°, 48 × 64 voxels, voxel size = 3 × 3 × 3 mm, FOV = 192 mm, 400 volumes, 35 axial slices) covering the entire cerebrum were acquired continuously in descending order. Using the magnetization prepared rapid acquisition gradient echo (MPRAGE) sequence, a 3D high-resolution structural T1-weighted image (TR/TE/TI = 2300/4.63 ms/900 ms, flip angle = 10°, 162 × 210 voxels, voxel size = 1 × 1 × 1 mm, FOV = 256 mm, 170 slices) covering the entire brain was also acquired and used for anatomical reference. T2-weighted images were also acquired but not used in the current study.
2.3. Preprocessing
Initial data preprocessing was performed using a combination of the SPM12 software package (Wellcome Department of Cognitive Neurology, London, UK) and CONN toolbox (McGovern Institute for Brain Research, MIT, Cambridge, MA, USA) running under MATLAB (The Mathworks). CONN’s default preprocessing pipeline (defaultMNI) comprises of the following steps: (1) functional realignment (correction for head motion) and unwarping, (2) slice-timing correction, (3) structural segmentation into grey matter, white matter, and cerebrospinal fluid and structural normalization to the MNI space, (4) functional normalization to the MNI space, (5) outlier detection, and (6) smoothing with 8mm kernel size [48].
The default denoising steps in the CONN toolbox included a component-based noise correction method (CompCor) performing regression of six head-motion parameters (acquired during the correction of head motion) with their first-order temporal derivatives and five principal components of white matter and cerebrospinal fluid [49]. Time series from 90 regions of interest (ROIs) from the Automated Anatomical Labeling (AAL) atlas were additionally linearly detrended to remove possible signal drift and finally filtered by a Butterworth band-pass filter with cutoff frequencies 0.009–0.08 Hz.
2.4. Analysis
Functional connectivity matrices were computed by cross-correlation of the ROI-based average BOLD time series. In line with the most common practice, we use Pearson’s correlation coefficient to quantify FC. Other, nonlinear approaches for FC assessment have been proposed; however, linear Pearson’s correlation coefficient is sufficient under standard conditions similar to those of the current data [50,51]. To increase the normality of the distribution of correlation values, Fisher’s r-to-z transformation was applied to each correlation coefficient.
Individual FC matrices were thresholded by preserving a selected proportion of the strongest weights, i.e., fixing the graphs’ edge density across subjects. This is conducted to ascertain comparability of the modularity estimates across subjects, as the edge density has a systematic effect on modularity. The choice of the edge density threshold is to large extent arbitrary. It involves a tradeoff between network sensitivity and specificity, with higher thresholds yielding networks that are more specific but less sensitive. Specificity is more important to the evaluation of most graph-theoretical properties than sensitivity [52,53]. Moreover, a low threshold can result in the inclusion of spurious connections, particularly in individual networks with lower overall functional connectivity [53]. Stringent thresholds thus appear to be preferable; however, thresholds used for functional connectivity networks are often relatively low, ranging from 0.1 to 0.3 [54,55,56]. Ultimately, there is a lack of consensus on how to choose an optimal threshold. Moreover, network measures, including modularity, are unstable across thresholds. To avoid the impact of threshold selection on our results, we thus decided to use thresholds ranging from 0.05 to 0.95, in increments of 0.05, rather than a single pre-determined threshold [57]. For each threshold, the graphs were then binarized, with all above-threshold connection weights converted to 1.
Modularity was computed separately for each hemisphere, i.e., for each subgraph formed by the 45 corresponding regions of the given hemisphere. The thresholding, binarization, and modularity computation were performed using the Brain Connectivity Toolbox [58].
The modularity of the two hemispheres was compared using the Wilcoxon signed-rank test across the 90 study subjects. Comparison of samples of this size () by a paired samples t-test would provide 80% power to detect an effect of size (Cohen’s d, i.e., effect size divided by standard deviation, corresponding to a small to medium effect size [59]). Note that, depending on the data distribution, the power of nonparametric tests (such as the Wilcoxon signed-rank test used in this study) may be slightly higher or lower than that of the corresponding parametric tests; however, the current sample size should provide power 0.8–0.95 for effect sizes of 0.2–0.4 for a range of distributions [60].
The relationship of the modularity of each hemisphere to subject sex and handedness, as well as age, was then evaluated using the Mann–Whitney U-test and Spearman correlation, respectively. These tests were performed on the mean modularity across the entire range of thresholds—as well as the modularity at each threshold—to assess whether the lateralization is more apparent at a particular network edge density level.
In addition, we performed a secondary analysis—a slightly modified version of the pipeline described above. In this analysis, individual FC matrices were first separated into the subgraphs corresponding to the left and the right hemisphere. Subsequently, the subgraph of each hemisphere was thresholded separately. This resulted in two subgraphs of equal edge density. This analysis variant aims to control for any potential mediating role of a systematic difference between the functional connectivity strengths of the two hemispheres.
3. Results
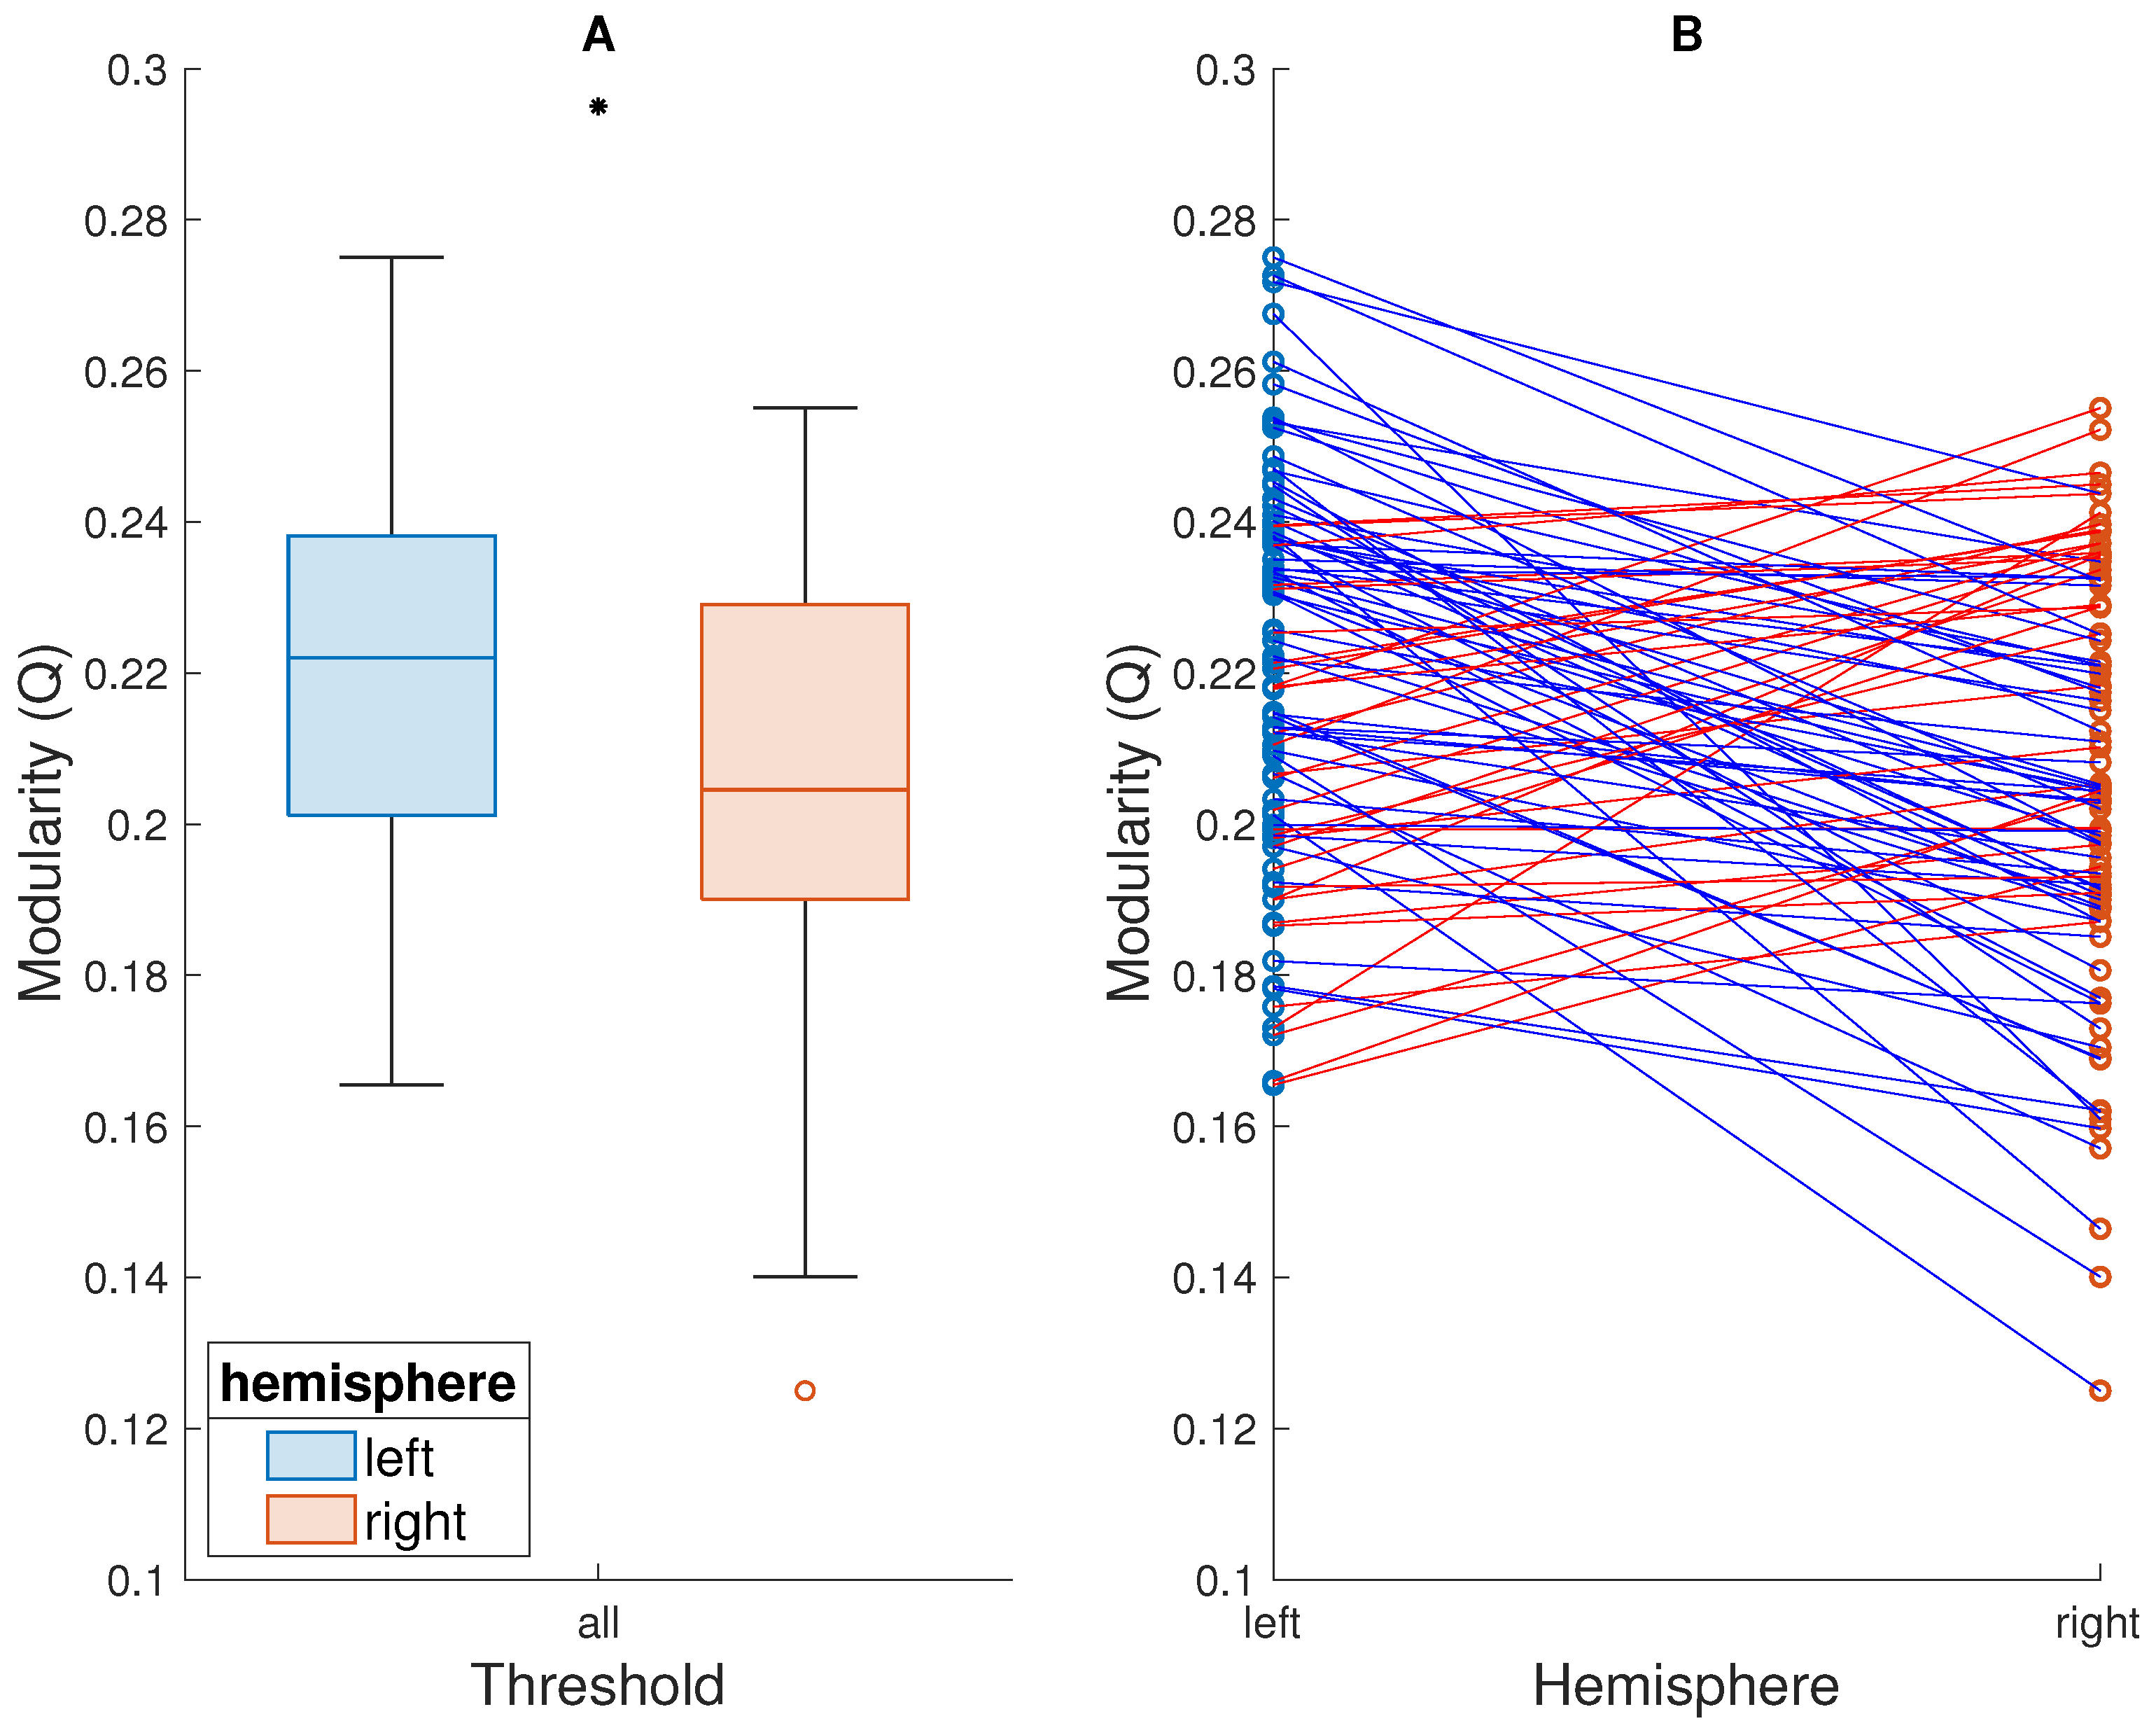
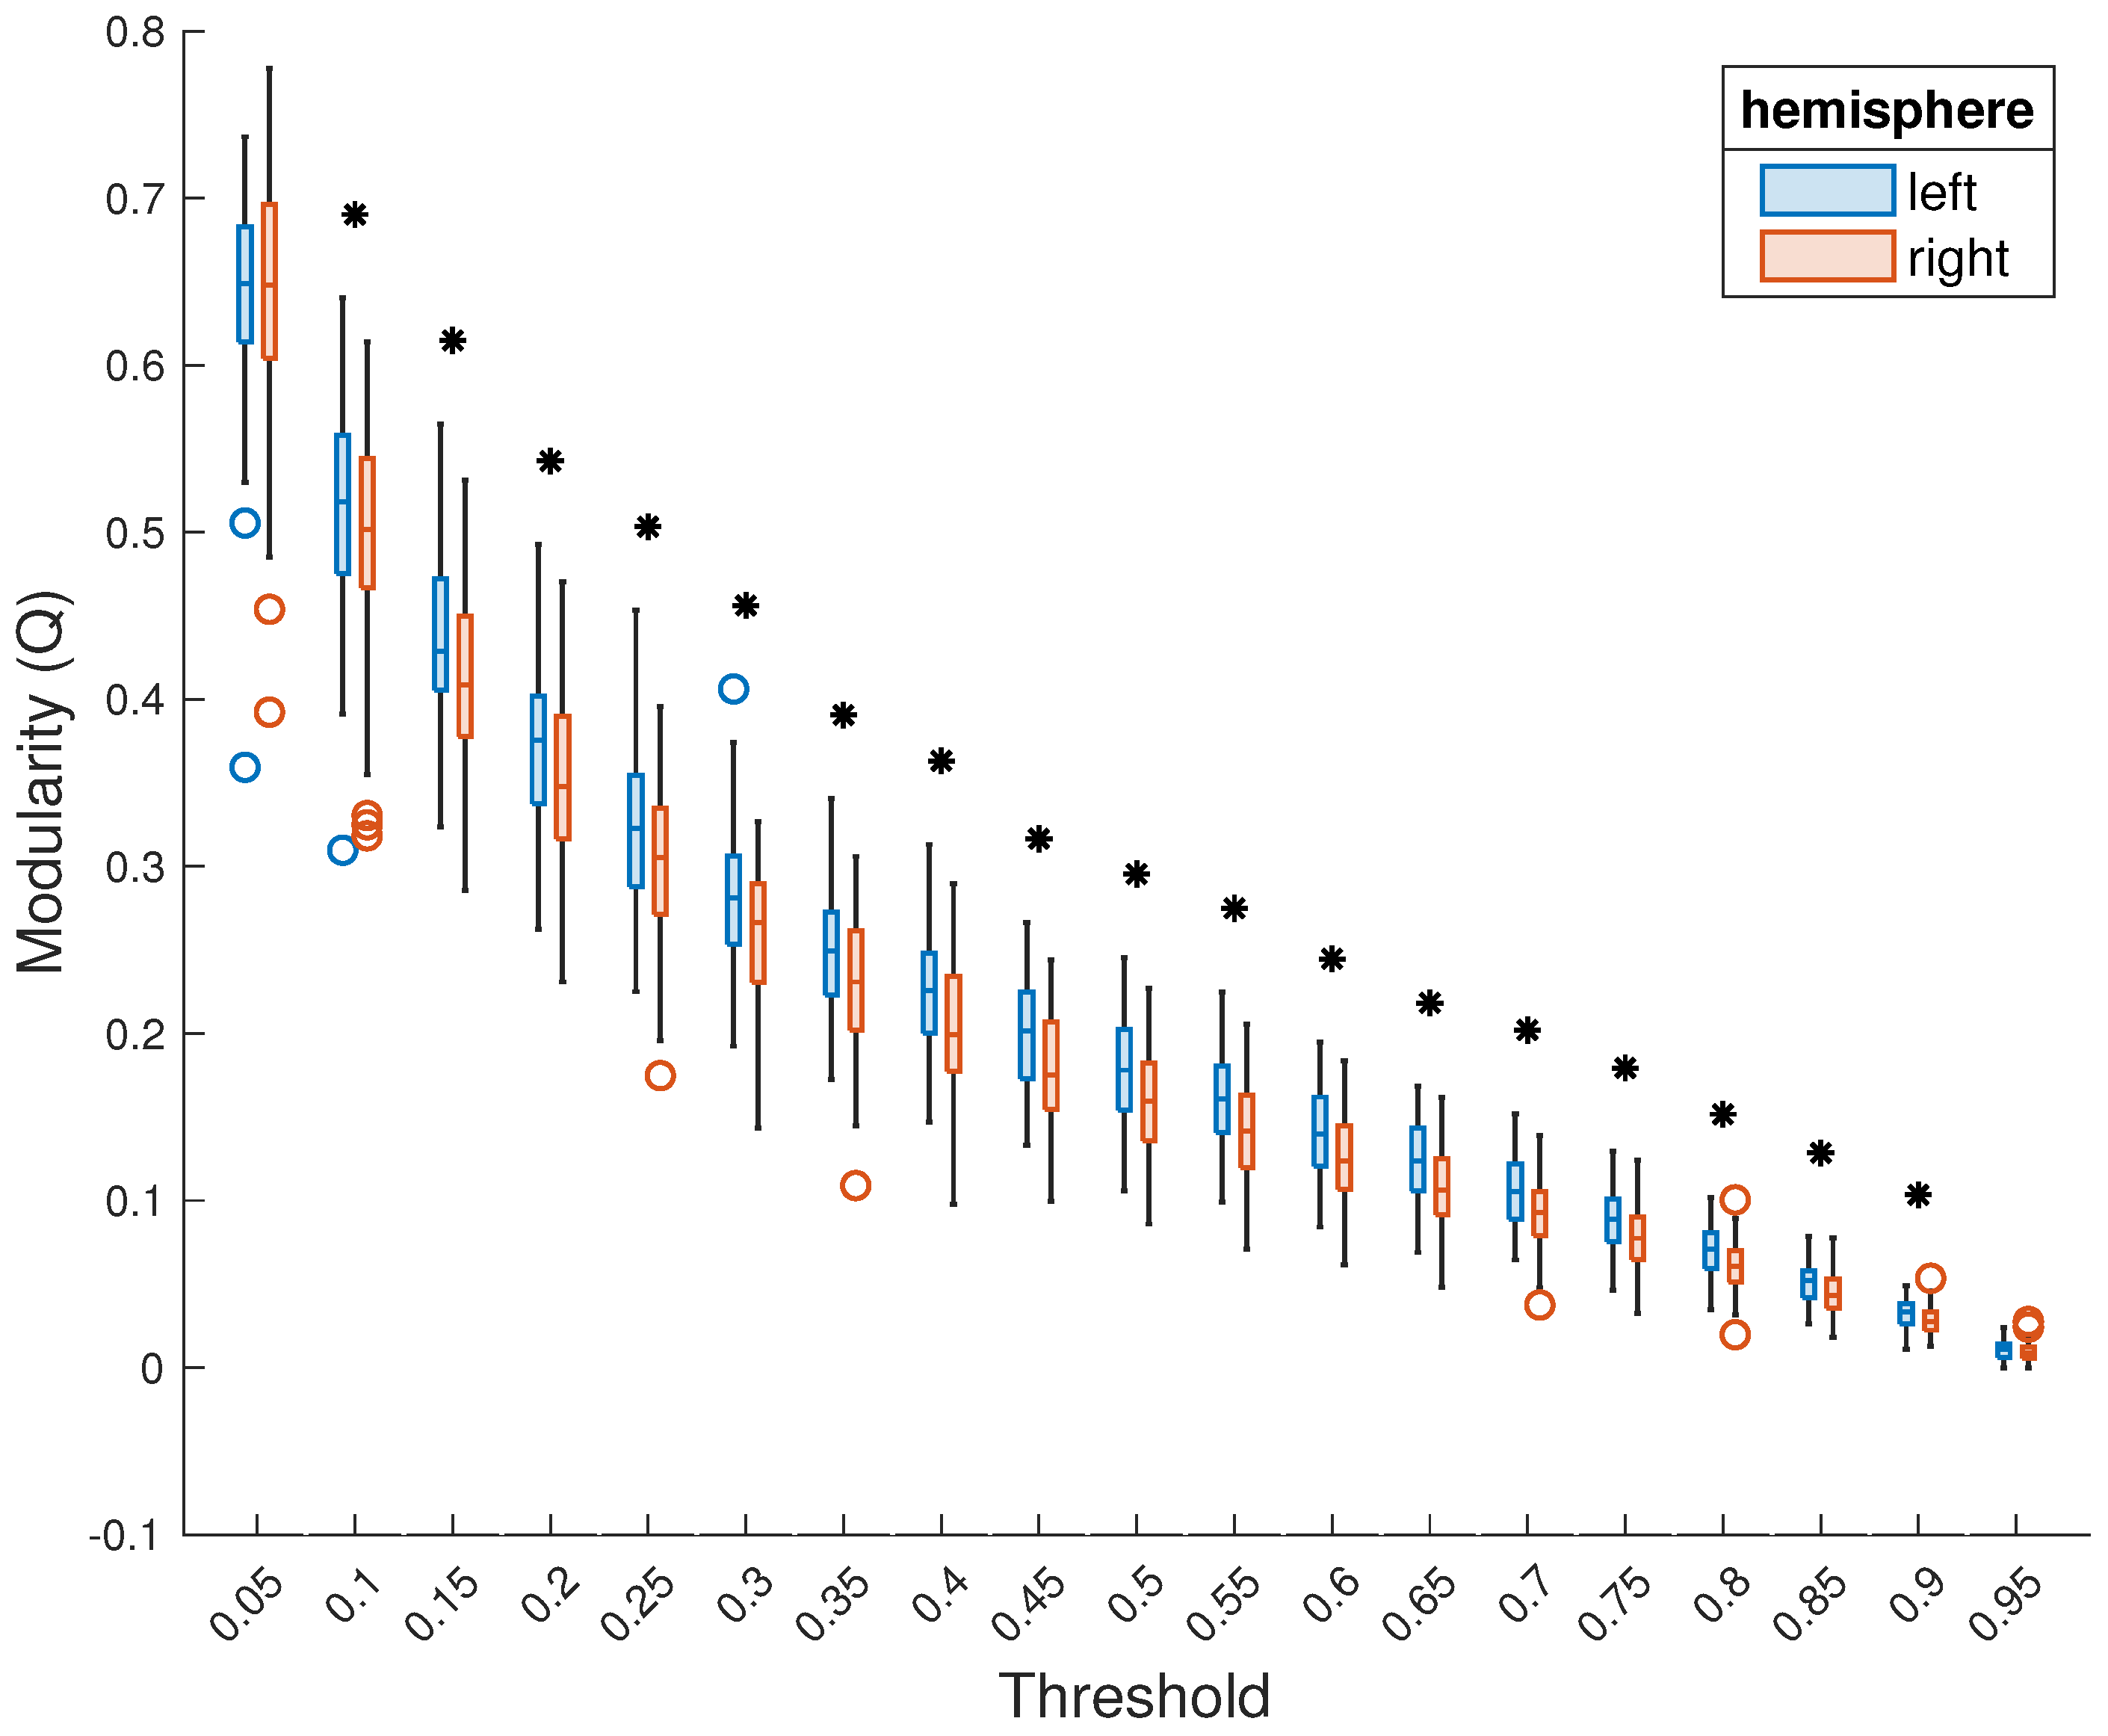
In the primary analysis, where the two hemispheres were thresholded together—i.e., the threshold was applied to each subject’s entire functional connectivity matrix—the left hemisphere showed higher modularity (median ranks across subjects). This was true for modularity averaged across the entire range of thresholds (left hemisphere: median = 0.22; right hemisphere: median = 0.20; , ; Figure 1) as well as for each threshold individually (Figure 2). The result was statistically significant () for all but the lowest (0.05) and highest (0.95) thresholds, suggesting the robustness of this result to the choice of thresholding. No significant relationship between the mean modularity of either hemisphere and subject age, sex, or handedness was observed, and we thus did not proceed to detailed analysis at individual thresholds.
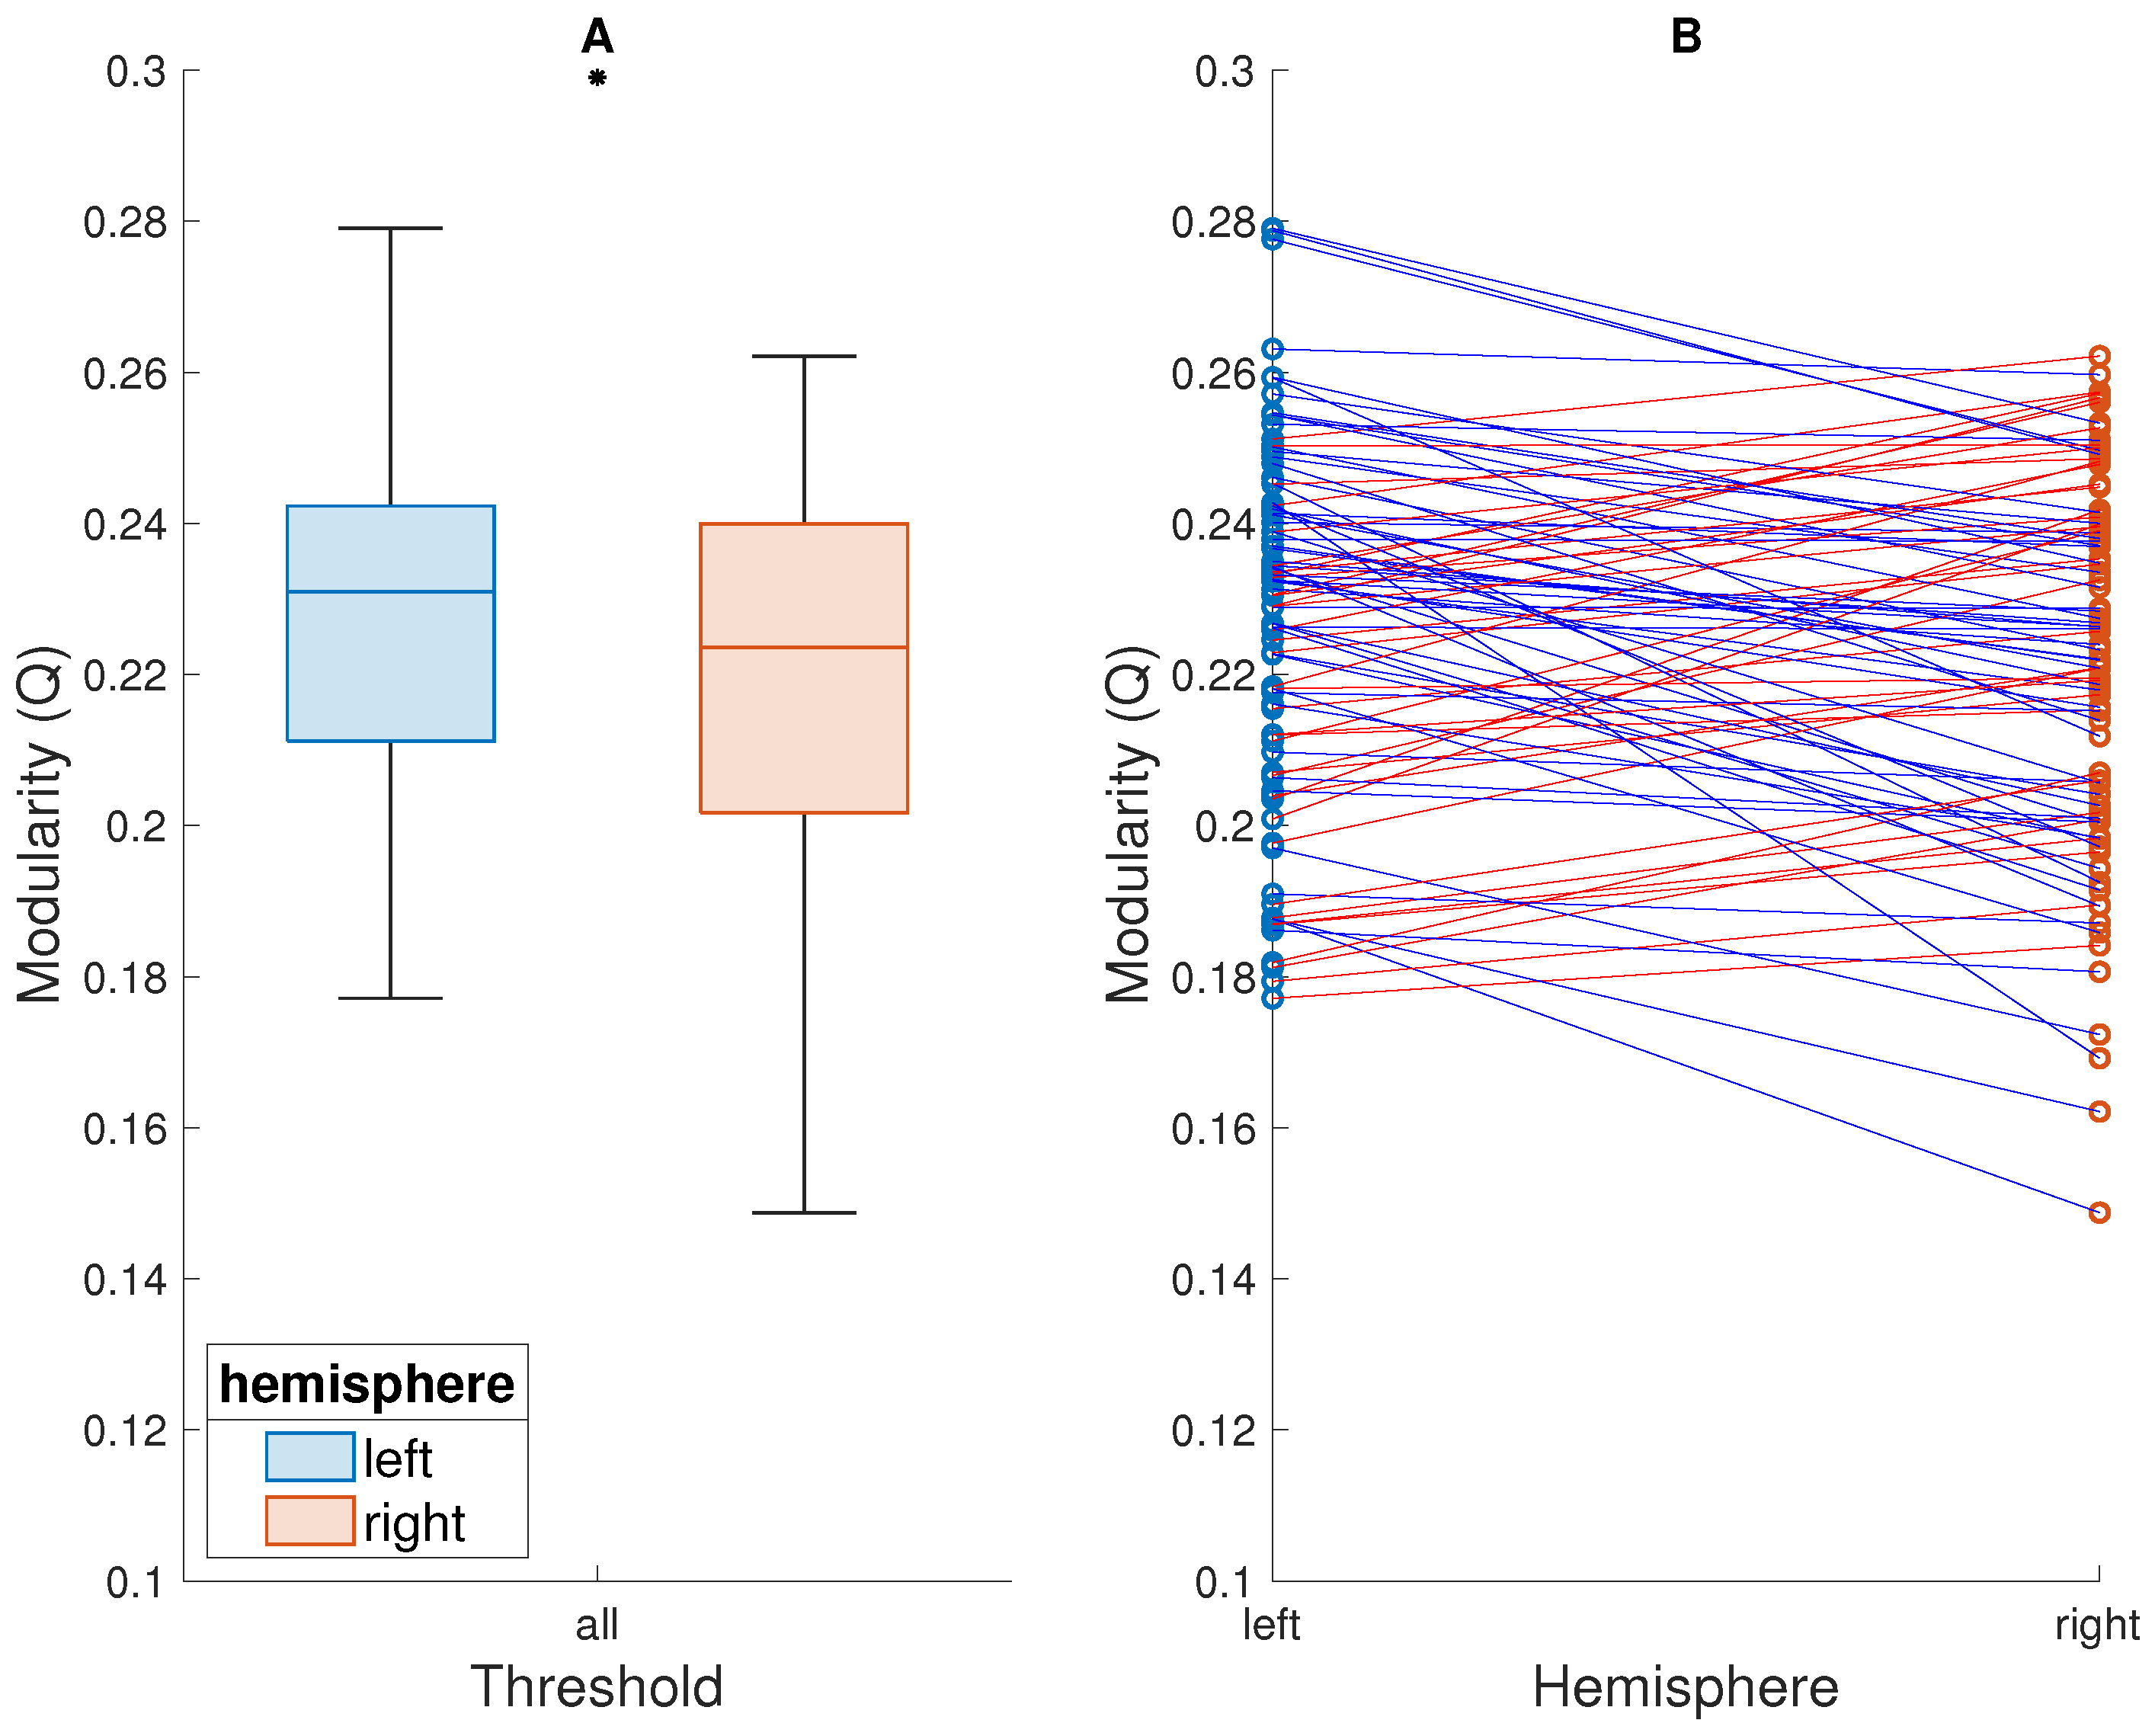
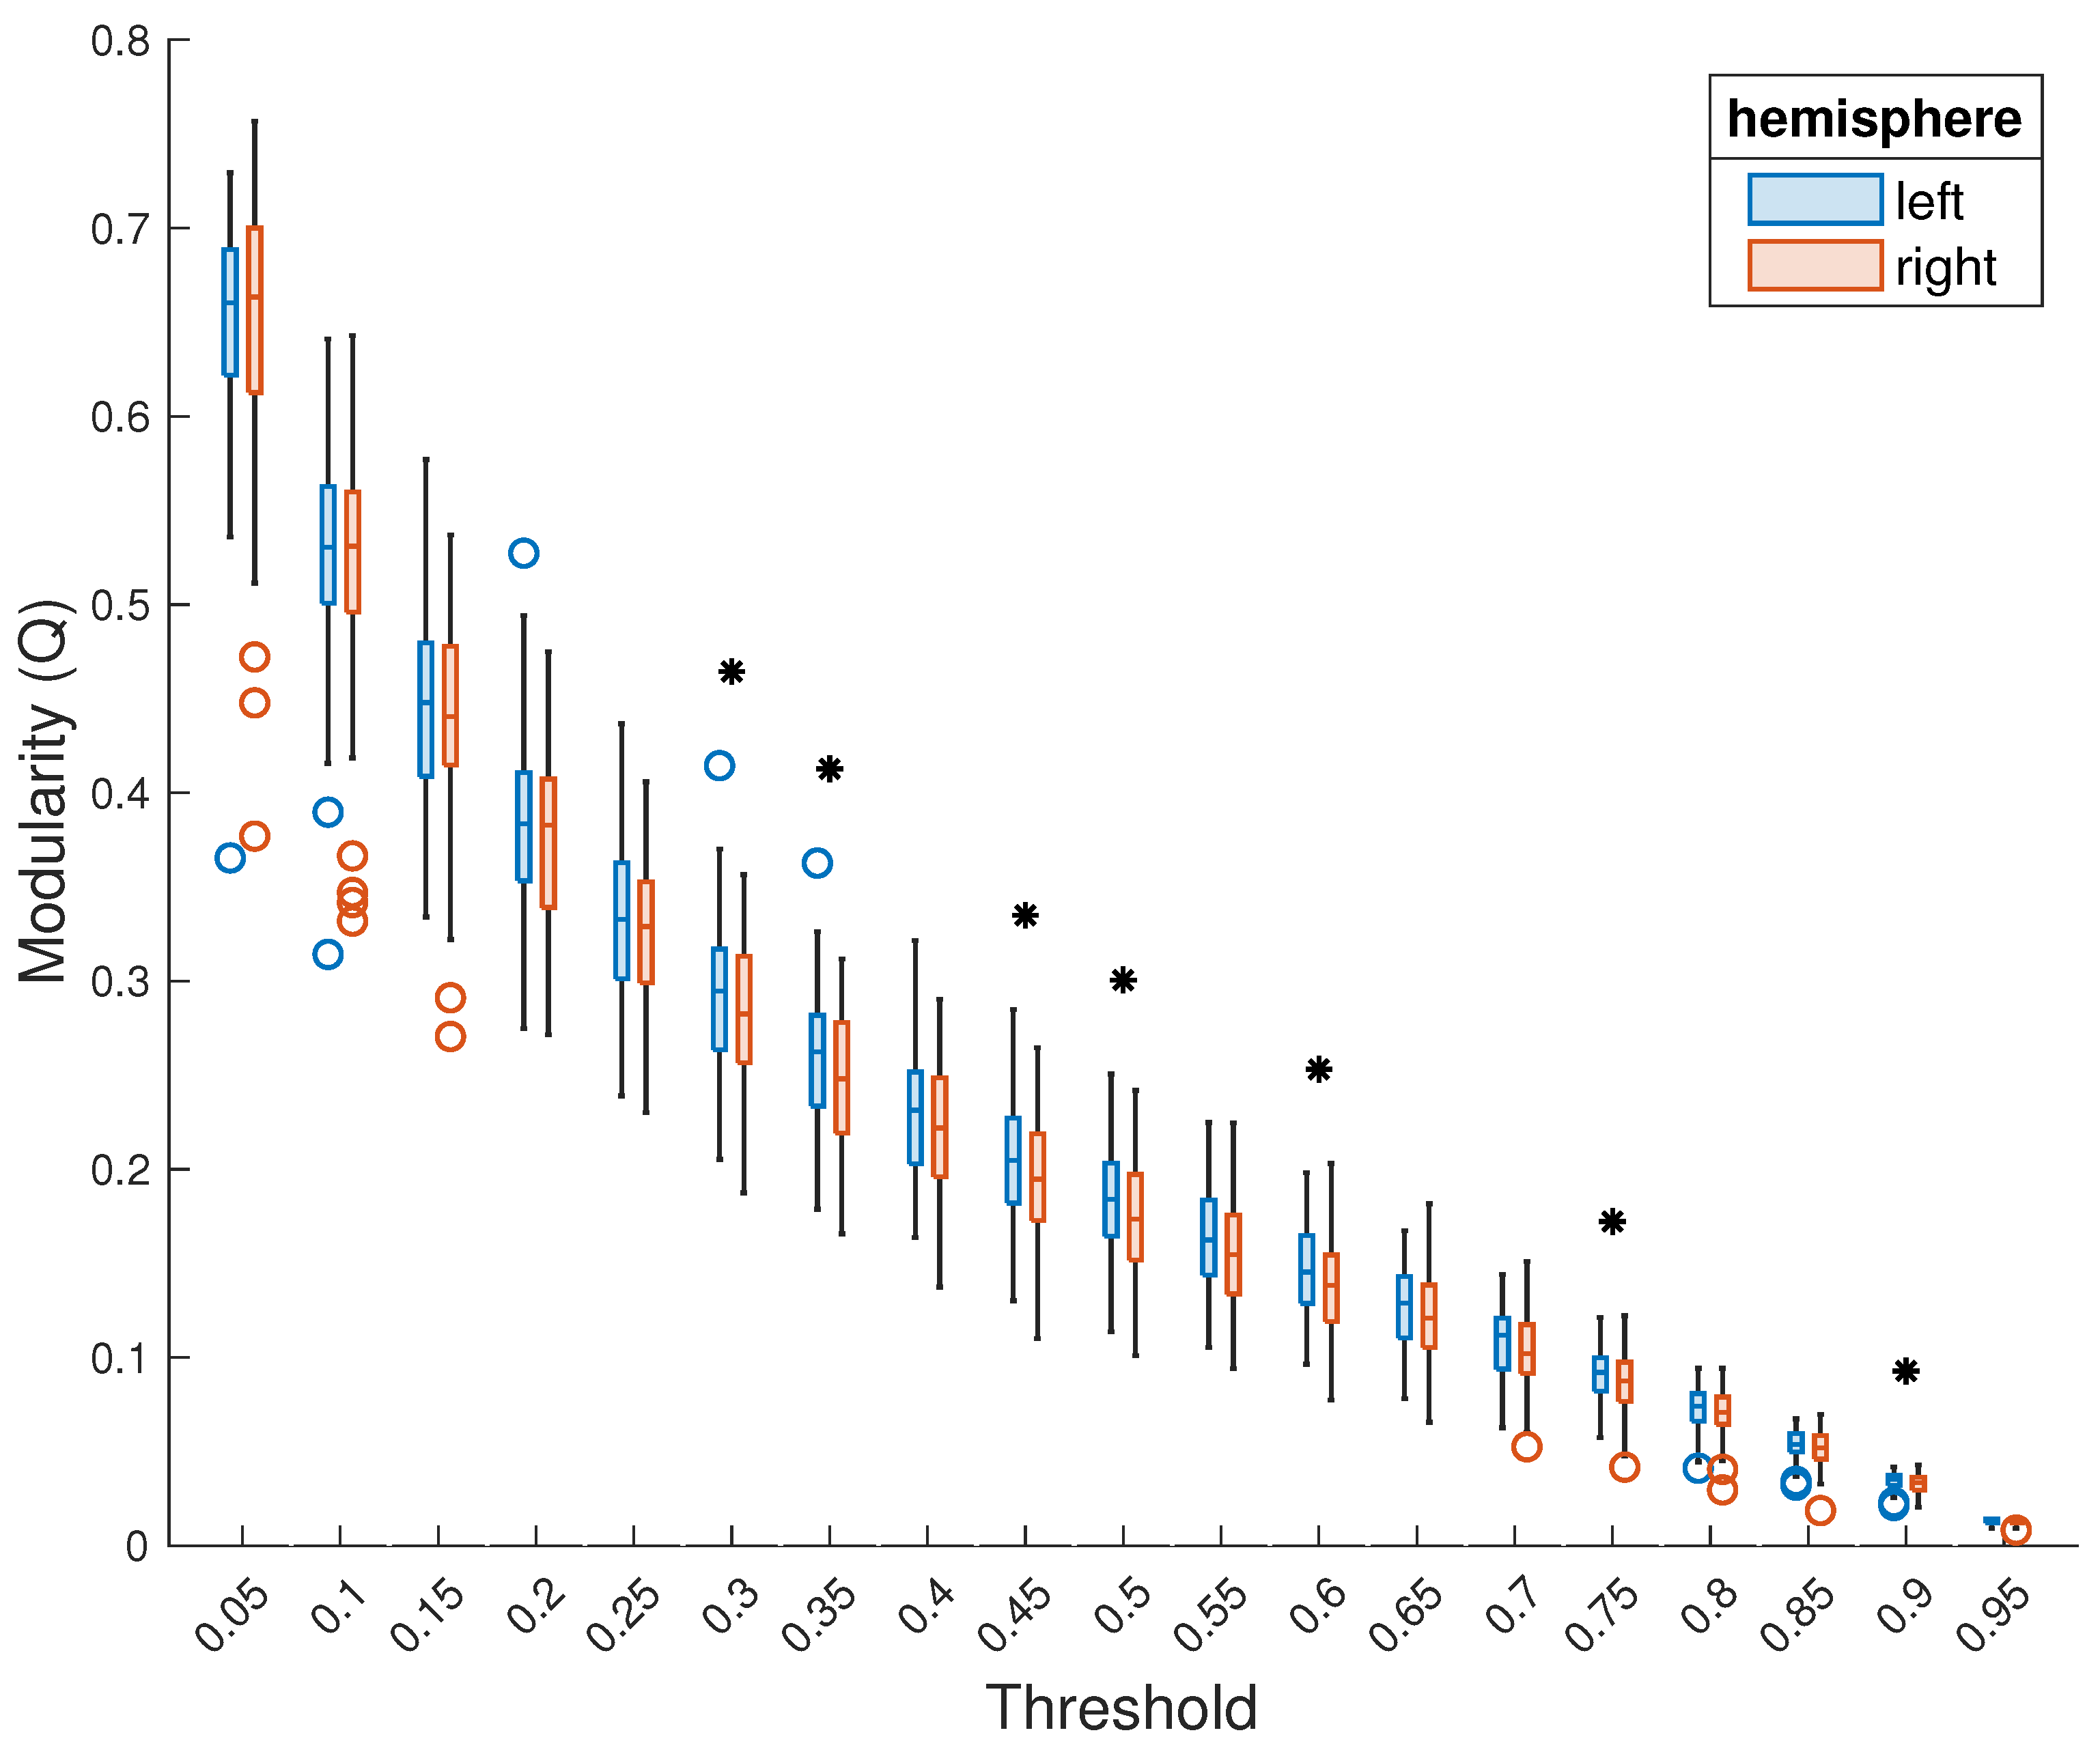
When the two hemispheres were thresholded separately—i.e., the FC matrix of each subject was separated into the two subgraphs before thresholding was performed—the left hemisphere, again, showed higher modularity across subjects. This difference was statistically significant () for modularity averaged across the entire range of thresholds (left hemisphere: median = 0.23, right hemisphere: median = 0.22; , ; Figure 3) as well as for seven specific thresholds (Figure 4). Moreover, for all but the lowest thresholds (0.05 and 0.1), the median modularity of the left hemisphere was higher than that of the right hemisphere. Again, no significant relationship between the modularity of either hemisphere and subject age, sex, or handedness was observed.
4. Discussion
We have shown that the left hemisphere is, on average, more modular. This result was consistent across a range of edge density thresholds. Note that, at the lowest threshold of 0.05, the graph is mostly disconnected. The highest threshold of 0.95 does not sufficiently reduce noise. The fact that the result of the primary analysis was not significant at the two extreme thresholds is, therefore, arguably, unsurprising.
Importantly, thresholding the hemispheres together can result in the hemispheric subgraphs having unequal edge density. Since graph density refers to the ratio between the number of edges present in a graph and the total number of edges possible in the graph, graphs of lower density generally tend to be more modular. An additional analysis (results not shown) showed that, at each threshold, the edge density of the left hemisphere was slightly lower than that of the right hemisphere. The higher modularity of the left hemisphere could thus, hypothetically, be attributed to lower graph edge density of the left hemisphere subgraph; however, this hypothesis was refuted by the result of our secondary analysis. The latter confirmed that the left hemisphere is more modular, even when the two hemispheres are thresholded together, i.e., when the two subgraphs are of equal edge density.
Further analysis—beyond the scope of the current paper—is necessary to explore the robustness of the result with respect to methodological choices. Such analysis may target the effect of the choice of alternative anatomical atlases or of the method used to construct the functional connectivity matrix.
Our main finding—that the left hemisphere is more modular than the right one—is in line with both structural and functional morphological studies of the human brain. The more modular arrangement in the left hemisphere may be explained as a functional consequence of greater neuronal and neurite density that promotes local information processing. Functionally, the increased modularity of functional connectivity in the left hemisphere is likely related to the left-hemisphere lateralization of language and fine motor control that have been proposed to be more focal and utilizing functional segregation. On the other side, the lower modularity of the functional connectivity of the right hemisphere might be related to the right lateralization of the visuospatial attention mechanisms that require a greater degree of interhemispheric as well as intrahemispheric integration [37]. Together, these characteristics point to increased functional connectivity modularity in the left hemisphere, represented by a higher number of short intrahemispheric connections (edges) within modules relative to longer connections between different modules and hemispheres.
While altered hemispheric asymmetry has been associated with various neuropsychiatric conditions, the findings have not been consistent, and their explanatory potential for understanding brain disorders is limited [6]. This is due to the methodological heterogeneity of previous studies as well as the different explanatory potential of the histological approach on one side and structural/functional MRI techniques on the other. To this end, the asymmetry of hemispheric modularity shown in our sample may have a practical implication. Modularity as a functional measure depending on macro-microscopic hemispheric connectivity may present a promising candidate for studying aberrant hemispheric lateralization—and its functional relevance—in neuropsychiatric disorders. Similarly, future studies can also examine the relationship between the asymmetry of hemispheric modularity and variability in behavior and cognition, including asymmetry of sensory and motor functions.
5. Conclusions
We have shown that hemispheric network properties can be used to characterize brain asymmetry. Here, we focused on modularity, and demonstrated that the modularity of the left hemisphere is higher than that of the right hemisphere; however, other network properties can, presumably, be used in a similar fashion. Once their relationship to normal functional asymmetry has been established, these properties can also be used to study the disruption of brain asymmetry in neuropsychiatric disorders. In future work, we intend to extend our analysis of hemispheric modularity to patients with schizophrenia.
Author Contributions
Conceptualization, J.H. (Jaroslav Hlinka); Data curation, J.H. (Jiří Horáček) and F.Š.; Formal analysis, L.J., D.T. and J.H. (Jaroslav Hlinka); Funding acquisition, J.H. (Jiří Horáček), F.Š. and J.H. (Jaroslav Hlinka); Methodology, L.J. and J.H. (Jaroslav Hlinka); Resources, J.H. (Jiří Horáček), F.Š. and J.H. (Jaroslav Hlinka); Software, L.J. and J.H. (Jaroslav Hlinka); Supervision, J.H. (Jaroslav Hlinka); Validation, L.J. and J.H. (Jaroslav Hlinka); Visualization, L.J.; Writing—original draft, L.J.; Writing—review & editing, L.J., D.T., J.H. (Jiří Horáček), F.Š. and J.H. (Jaroslav Hlinka). All authors have read and agreed to the published version of the manuscript.
Funding
This research was funded by the Czech Science Foundation (grant No. 21-17211S and No. 21-32608S), the Grant Agency of the Czech Technical University in Prague (grant No. SGS20/172/ OHK3/3T/13), and by the Visegrad Fund (scholarship No. 52110300).
Institutional Review Board Statement
The study was conducted according to the guidelines of the Declaration of Helsinki, and approved by the Ethics Committee of the Prague Psychiatric Center (protocol code 69/11, approved on 29 June 2011).
Informed Consent Statement
Informed consent was obtained from all subjects involved in the study.
Data Availability Statement
Data available upon request.
Acknowledgments
We thank Petra Fürstová for her assistance in data curation.
Conflicts of Interest
The authors declare no conflict of interest. The funders had no role in the design of the study; in the collection, analyses, or interpretation of data; in the writing of the manuscript, or in the decision to publish the results.
References
- Güntürkün, O.; Ströckens, F.; Ocklenburg, S. Brain lateralization: A comparative perspective. Physiol. Rev. 2020, 100, 1019–1063. [Google Scholar] [CrossRef] [PubMed]
- Vallortigara, G. Comparative neuropsychology of the dual brain: A stroll through animals’ left and right perceptual worlds. Brain Lang. 2000, 73, 189–219. [Google Scholar] [CrossRef] [PubMed]
- Duboc, V.; Dufourcq, P.; Blader, P.; Roussigné, M. Asymmetry of the brain: Development and implications. Annu. Rev. Genet. 2015, 49, 647–672. [Google Scholar] [CrossRef] [PubMed]
- Renteria, M.E. Cerebral asymmetry: A quantitative, multifactorial, and plastic brain phenotype. Twin Res. Hum. Genet. 2012, 15, 401–413. [Google Scholar] [CrossRef] [PubMed] [Green Version]
- Kong, X.Z.; Mathias, S.R.; Guadalupe, T.; ENIGMA Laterality Working Group; Glahn, D.C.; Franke, B.; Crivello, F.; Tzourio-Mazoyer, N.; Fisher, S.E.; Thompson, P.M.; et al. Mapping cortical brain asymmetry in 17,141 healthy individuals worldwide via the ENIGMA Consortium. Proc. Natl. Acad. Sci. USA 2018, 115, E5154–E5163. [Google Scholar] [CrossRef] [Green Version]
- Kong, X.Z.; Postema, M.C.; Guadalupe, T.; de Kovel, C.; Boedhoe, P.S.; Hoogman, M.; Mathias, S.R.; Van Rooij, D.; Schijven, D.; Glahn, D.C.; et al. Mapping brain asymmetry in health and disease through the ENIGMA consortium. Hum. Brain Mapp. 2022, 43, 167–181. [Google Scholar] [CrossRef]
- Cullen, T.J.; Walker, M.A.; Eastwood, S.L.; Esiri, M.M.; Harrison, P.J.; Crow, T.J. Anomalies of asymmetry of pyramidal cell density and structure in dorsolateral prefrontal cortex in schizophrenia. Br. J. Psychiatry 2006, 188, 26–31. [Google Scholar] [CrossRef]
- Schmitz, J.; Fraenz, C.; Schlüter, C.; Friedrich, P.; Jung, R.E.; Güntürkün, O.; Genç, E.; Ocklenburg, S. Hemispheric asymmetries in cortical gray matter microstructure identified by neurite orientation dispersion and density imaging. Neuroimage 2019, 189, 667–675. [Google Scholar] [CrossRef]
- Lubben, N.; Ensink, E.; Coetzee, G.A.; Labrie, V. The enigma and implications of brain hemispheric asymmetry in neurodegenerative diseases. Brain Commun. 2021, 3, fcab211. [Google Scholar] [CrossRef]
- Hellige, J.B. Hemispheric Asymmetry: What’s Right and What’s Left; Harvard University Press: Cambridge, MA, USA, 2001. [Google Scholar]
- Davidson, R.J.; Hugdahl, K. Brain Asymmetry; MIT Press: Cambridge, MA, USA, 1996. [Google Scholar]
- Gazzaniga, M.S. Cerebral specialization and interhemispheric communication: Does the corpus callosum enable the human condition? Brain 2000, 123, 1293–1326. [Google Scholar] [CrossRef] [Green Version]
- Burgess, N.; Maguire, E.A.; O’Keefe, J. The human hippocampus and spatial and episodic memory. Neuron 2002, 35, 625–641. [Google Scholar] [CrossRef] [Green Version]
- Ocklenburg, S.; Packheiser, J.; Schmitz, J.; Rook, N.; Güntürkün, O.; Peterburs, J.; Grimshaw, G.M. Hugs and kisses—The role of motor preferences and emotional lateralization for hemispheric asymmetries in human social touch. Neurosci. Biobehav. Rev. 2018, 95, 353–360. [Google Scholar] [CrossRef] [PubMed]
- Blom, S.S.A.H.; Aarts, H.; Semin, G.R. Lateralization of facial emotion processing and facial mimicry. Laterality 2020, 25, 259–274. [Google Scholar] [CrossRef] [PubMed]
- Gerrits, R.; Van der Haegen, L.; Brysbaert, M.; Vingerhoets, G. Laterality for recognizing written words and faces in the fusiform gyrus covaries with language dominance. Cortex 2019, 117, 196–204. [Google Scholar] [CrossRef]
- Riès, S.K.; Dronkers, N.F.; Knight, R.T. Choosing words: Left hemisphere, right hemisphere, or both? Perspective on the lateralization of word retrieval. Ann. N. Y. Acad. Sci. 2016, 1369, 111–131. [Google Scholar] [CrossRef]
- Broca, P. Perte de la parole, ramouissement chronique et destruction partielle du lobe antérieur gauche du cerveau. Bull. Soc. Anthropol. 1861, 2, 235–238. [Google Scholar]
- Carey, D.P.; Johnstone, L.T. Quantifying cerebral asymmetries for language in dextrals and adextrals with random-effects meta analysis. Front. Psychol. 2014, 5, 1128. [Google Scholar] [CrossRef] [Green Version]
- Johnstone, L.T.; Karlsson, E.M.; Carey, D.P. Left-handers are less lateralized than right-handers for both left and right hemispheric functions. Cereb. Cortex 2021, 31, 3780–3787. [Google Scholar] [CrossRef]
- Knecht, S.; Dräger, B.; Deppe, M.; Bobe, L.; Lohmann, H.; Flöel, A.; Ringelstein, E.B.; Henningsen, H. Handedness and hemispheric language dominance in healthy humans. Brain 2000, 123, 2512–2518. [Google Scholar] [CrossRef] [Green Version]
- Mundorf, A.; Peterburs, J.; Ocklenburg, S. Asymmetry in the central nervous system: A clinical neuroscience perspective. Front. Syst. Neurosci. 2021, 15, 733898. [Google Scholar] [CrossRef]
- Ribolsi, M.; Daskalakis, Z.J.; Siracusano, A.; Koch, G. Abnormal asymmetry of brain connectivity in schizophrenia. Front. Hum. Neurosci. 2014, 8, 1010. [Google Scholar] [CrossRef] [PubMed] [Green Version]
- Hill, C.; Van Gemmert, A.W.; Fang, Q.; Hou, L.; Wang, J.; Pan, Z. Asymmetry in the aging brain: A narrative review of cortical activation patterns and implications for motor function. Laterality 2020, 25, 413–429. [Google Scholar] [CrossRef] [PubMed]
- Kong, X.Z.; Boedhoe, P.S.; Abe, Y.; Alonso, P.; Ameis, S.H.; Arnold, P.D.; Assogna, F.; Baker, J.T.; Batistuzzo, M.C.; Benedetti, F.; et al. Mapping cortical and subcortical asymmetry in obsessive-compulsive disorder: Findings from the ENIGMA Consortium. Biol. Psychiatry 2020, 87, 1022–1034. [Google Scholar] [CrossRef] [PubMed]
- Crow, T.J. Schizophrenia as an anomaly of development of cerebral asymmetry: A postmortem study and a proposal concerning the genetic basis of the disease. Arch. Gen. Psychiatry 1989, 46, 1145–1150. [Google Scholar] [CrossRef] [PubMed]
- Sha, Z.; Schijven, D.; Francks, C. Patterns of brain asymmetry associated with polygenic risks for autism and schizophrenia implicate language and executive functions but not brain masculinization. Mol. Psychiatry 2021, 26, 7652–7660. [Google Scholar] [CrossRef] [PubMed]
- Li, D.; Tang, W.; Yan, T.; Zhang, N.; Xiang, J.; Niu, Y.; Wang, B. Abnormalities in hemispheric lateralization of intra- and inter-hemispheric white matter connections in schizophrenia. Brain Imaging Behav. 2021, 15, 819–832. [Google Scholar] [CrossRef] [PubMed]
- Friston, K.J. Functional and effective connectivity in neuroimaging: A synthesis. Hum. Brain Mapp. 1994, 2, 56–78. [Google Scholar] [CrossRef]
- Bullmore, E.; Sporns, O. Complex brain networks: Graph theoretical analysis of structural and functional systems. Nat. Rev. Neurosci. 2009, 10, 186–198. [Google Scholar] [CrossRef]
- Boccaletti, S.; Latora, V.; Moreno, Y.; Chavez, M.; Hwang, D. Complex networks: Structure and dynamics. Phys. Rep. 2006, 424, 175–308. [Google Scholar] [CrossRef]
- Iturria-Medina, Y.; Pérez Fernández, A.; Morris, D.M.; Canales-Rodríguez, E.J.; Haroon, H.A.; García Pentón, L.; Augath, M.; Galán García, L.; Logothetis, N.; Parker, G.J.M.; et al. Brain hemispheric structural efficiency and interconnectivity rightward asymmetry in human and nonhuman primates. Cereb. Cortex 2011, 21, 56–67. [Google Scholar] [CrossRef]
- Caeyenberghs, K.; Leemans, A. Hemispheric lateralization of topological organization in structural brain networks: Hemispheric lateralization in structural brain networks. Hum. Brain Mapp. 2014, 35, 4944–4957. [Google Scholar] [CrossRef] [PubMed]
- Hutchison, R.M.; Culham, J.C.; Everling, S.; Flanagan, J.R.; Gallivan, J.P. Distinct and distributed functional connectivity patterns across cortex reflect the domain-specific constraints of object, face, scene, body, and tool category-selective modules in the ventral visual pathway. Neuroimage 2014, 96, 216–236. [Google Scholar] [CrossRef] [PubMed]
- Farahani, F.V.; Karwowski, W.; Lighthall, N.R. Application of graph theory for identifying connectivity patterns in human brain networks: A systematic review. Front. Neurosci. 2019, 13, 585. [Google Scholar] [CrossRef]
- Faskowitz, J.; Yan, X.; Zuo, X.N.; Sporns, O. Weighted stochastic block models of the human connectome across the life span. Sci. Rep. 2018, 8, 12997. [Google Scholar] [CrossRef] [PubMed] [Green Version]
- Gotts, S.J.; Jo, H.J.; Wallace, G.L.; Saad, Z.S.; Cox, R.W.; Martin, A. Two distinct forms of functional lateralization in the human brain. Proc. Natl. Acad. Sci. USA 2013, 110, E3435–E3444. [Google Scholar] [CrossRef] [Green Version]
- Newman, M.E.J.; Girvan, M. Finding and evaluating community structure in networks. Phys. Rev. E 2004, 69, 026113. [Google Scholar] [CrossRef] [Green Version]
- Newman, M.E.J. Modularity and community structure in networks. Proc. Natl. Acad. Sci. USA 2006, 103, 8577–8582. [Google Scholar] [CrossRef] [Green Version]
- Newman, M.E.J. Finding community structure in networks using the eigenvectors of matrices. Phys. Rev. E 2006, 74, 036104. [Google Scholar] [CrossRef] [Green Version]
- Meunier, D.; Lambiotte, R.; Bullmore, E.T. Modular and hierarchically modular organization of brain networks. Front. Neurosci 2010, 4, 200. [Google Scholar] [CrossRef] [Green Version]
- Betzel, R.F.; Medaglia, J.D.; Papadopoulos, L.; Baum, G.L.; Gur, R.; Gur, R.; Roalf, D.; Satterthwaite, T.D.; Bassett, D.S. The modular organization of human anatomical brain networks: Accounting for the cost of wiring. Netw. Neurosci. 2017, 1, 42–68. [Google Scholar] [CrossRef]
- Martínez, J.H.; Buldú, J.M.; Papo, D.; De Vico Fallani, F.; Chavez, M. Role of inter-hemispheric connections in functional brain networks. Sci. Rep. 2018, 8, 10246. [Google Scholar] [CrossRef] [PubMed] [Green Version]
- Melicher, T.; Horacek, J.; Hlinka, J.; Spaniel, F.; Tintera, J.; Ibrahim, I.; Mikolas, P.; Novak, T.; Mohr, P.; Hoschl, C. White matter changes in first episode psychosis and their relation to the size of sample studied: A DTI study. Schizoph. Res. 2015, 162, 22–28. [Google Scholar] [CrossRef] [PubMed]
- Sheehan, D.V.; Lecrubier, Y.; Sheehan, K.H.; Amorim, P.; Janavs, J.; Weiller, E.; Hergueta, T.; Baker, R.; Dunbar, G.C. The Mini-International Neuropsychiatric Interview (M.I.N.I): The development and validation of a structured diagnostic psychiatric interview for DSM-IV and ICD-10. J. Clin. Psychiatry 1998, 59, 22–33. [Google Scholar] [PubMed]
- Bareš, M.; Brunovský, M.; Kopeček, M.; Stopková, P.; Novák, T.; Kožený, J.; Čermák, J.; Šoš, P.; Höschl, C. EEG in prediction of antidepressant response in patients with depressive disorder: Review and extended pilot data. Psychiatrie 2006, 4, 205–210. [Google Scholar]
- Oldfield, R. The assessment and analysis of handedness: The Edinburgh Inventory. Neuropsychologia 1971, 9, 97–113. [Google Scholar] [CrossRef]
- Kopal, J.; Pidnebesna, A.; Tomeček, D.; Tintěra, J.; Hlinka, J. Typicality of functional connectivity robustly captures motion artifacts in rs-fMRI across datasets, atlases, and preprocessing pipelines. Hum. Brain Mapp. 2020, 41, 5325–5340. [Google Scholar] [CrossRef]
- Behzadi, Y.; Restom, K.; Liau, J.; Liu, T.T. A component based noise correction method (CompCor) for BOLD and perfusion based fMRI. Neuroimage 2007, 37, 90–101. [Google Scholar] [CrossRef] [Green Version]
- Hlinka, J.; Paluš, M.; Vejmelka, M.; Mantini, D.; Corbetta, M. Functional connectivity in resting-state fMRI: Is linear correlation sufficient? Neuroimage 2011, 54, 2218–2225. [Google Scholar] [CrossRef] [Green Version]
- Hartman, D.; Hlinka, J.; Paluš, M.; Mantini, D.; Corbetta, M. The role of nonlinearity in computing graph-theoretical properties of resting-state functional magnetic resonance imaging brain networks. Chaos 2011, 21, 013119. [Google Scholar] [CrossRef]
- Zalesky, A.; Fornito, A.; Cocchi, L.; Gollo, L.L.; van den Heuvel, M.P.; Breakspear, M. Connectome sensitivity or specificity: Which is more important? Neuroimage 2016, 142, 407–420. [Google Scholar] [CrossRef]
- van den Heuvel, M.P.; de Lange, S.C.; Zalesky, A.; Seguin, C.; Yeo, B.T.; Schmidt, R. Proportional thresholding in resting-state fMRI functional connectivity networks and consequences for patient-control connectome studies: Issues and recommendations. Neuroimage 2017, 152, 437–449. [Google Scholar] [CrossRef] [PubMed]
- Hlinka, J.; Hartman, D.; Jajcay, N.; Tomeček, D.; Tintěra, J.; Paluš, M. Small-world bias of correlation networks: From brain to climate. Chaos 2017, 27, 035812. [Google Scholar] [CrossRef] [PubMed]
- Godwin, D.; Barry, R.L.; Marois, R. Breakdown of the brain’s functional network modularity with awareness. Proc. Natl. Acad. Sci. USA 2015, 112, 3799–3804. [Google Scholar] [CrossRef] [Green Version]
- Arnemann, K.L.; Chen, A.J.W.; Novakovic-Agopian, T.; Gratton, C.; Nomura, E.M.; D’Esposito, M. Functional brain network modularity predicts response to cognitive training after brain injury. Neurology 2015, 84, 1568–1574. [Google Scholar] [CrossRef] [PubMed] [Green Version]
- Garrison, K.A.; Scheinost, D.; Finn, E.S.; Shen, X.; Constable, R.T. The (in)stability of functional brain network measures across thresholds. Neuroimage 2015, 118, 651–661. [Google Scholar] [CrossRef] [PubMed] [Green Version]
- Rubinov, M.; Sporns, O. Complex network measures of brain connectivity: Uses and interpretations. Neuroimage 2010, 52, 1059–1069. [Google Scholar] [CrossRef]
- Cohen, J. Statistical Power Analysis for the Behavioural Sciences, 2nd ed.; Lawrence Erlbaum Associates: Hillsdale, NJ, USA, 1988. [Google Scholar]
- Shieh, G.; Jan, S.L.; Randles, R.H. Power and sample size determinations for the Wilcoxon signed-rank test. J. Stat. Comput. Simul. 2007, 77, 717–724. [Google Scholar] [CrossRef]
Figure 1.
Comparison of modularity of the left and right hemispheres thresholded together, averaged across the entire range of thresholds. (A) Box plots showing the modularity (Q) of each hemisphere, across subjects. The line inside each box represents the median. The top and bottom edges represent the upper and lower quartiles, respectively, with the distance between them representing the interquartile range (IQR). The whiskers above and below the boxes represent the highest and lowest values that are not outliers. Points beyond the whiskers are outliers, i.e., values that are more than 1.5 × IQR away from the top or bottom of the box. A black asterisk above the boxes indicates that the difference between the modularity of the two hemispheres is statistically significant. (B) The modularity of each hemisphere, of each subject. Subjects are represented by points—one for each hemisphere—joined by a straight line. The color of the line indicates whether the left hemisphere of the given subject is more (blue line) or less (red) modular than the right.

Figure 2.
Comparison of modularity of the left and right hemispheres thresholded together, at each threshold. Presentation as in Figure 1A. A black asterisk above a threshold indicates that, at this threshold, the difference between the modularity of the two hemispheres is statistically significant.

Figure 3.
Comparison of modularity of the left and right hemispheres thresholded separately, averaged across the entire range of thresholds. Presentation as in Figure 1. (A) Box plots showing the modularity (Q) of each hemisphere, across subjects. A black asterisk above the boxes indicates that the difference between the modularity of the two hemispheres is statistically significant. (B) The modularity of each hemisphere, of each subject. Subjects are represented by points—one for each hemisphere—joined by a straight line.

Figure 4.
Comparison of modularity of the left and right hemispheres, thresholded separately. Presentation as in Figure 2. A black asterisk above a threshold indicates that, at this threshold, the difference between the modularity of the two hemispheres is statistically significant.
Figure 4.
Comparison of modularity of the left and right hemispheres, thresholded separately. Presentation as in Figure 2. A black asterisk above a threshold indicates that, at this threshold, the difference between the modularity of the two hemispheres is statistically significant.

Publisher’s Note: MDPI stays neutral with regard to jurisdictional claims in published maps and institutional affiliations. |
© 2022 by the authors. Licensee MDPI, Basel, Switzerland. This article is an open access article distributed under the terms and conditions of the Creative Commons Attribution (CC BY) license (https://creativecommons.org/licenses/by/4.0/).
Share and Cite
MDPI and ACS Style
Jajcay, L.; Tomeček, D.; Horáček, J.; Španiel, F.; Hlinka, J. Brain Functional Connectivity Asymmetry: Left Hemisphere Is More Modular. Symmetry 2022, 14, 833. https://doi.org/10.3390/sym14040833
AMA Style
Jajcay L, Tomeček D, Horáček J, Španiel F, Hlinka J. Brain Functional Connectivity Asymmetry: Left Hemisphere Is More Modular. Symmetry. 2022; 14(4):833. https://doi.org/10.3390/sym14040833
Chicago/Turabian StyleJajcay, Lucia, David Tomeček, Jiří Horáček, Filip Španiel, and Jaroslav Hlinka. 2022. "Brain Functional Connectivity Asymmetry: Left Hemisphere Is More Modular" Symmetry 14, no. 4: 833. https://doi.org/10.3390/sym14040833
Note that from the first issue of 2016, this journal uses article numbers instead of page numbers. See further details here.