Article

Embryonal Masses Induced at High Temperatures in Aleppo Pine: Cytokinin Profile and Cytological Characterization

by
Cátia Pereira
1,2,
Ander Castander-Olarieta
2,
Itziar A. Montalbán
2,
Aleš Pěnčík
3,
Ivan Petřík
3,
Iva Pavlović
3,
Eliana De Medeiros Oliveira
4,
Hugo Pacheco de Freitas Fraga
5,
Miguel Pedro Guerra
6,
Ondrej Novák
3,
Miroslav Strnad
3,
Jorge Canhoto
1,* and
Paloma Moncaleán
2,*
1
Center for Functional Ecology, Department of Life Sciences, University of Coimbra, 3000-456 Coimbra, Portugal
2
Department of Forestry Science, NEIKER, 01080 Arkaute, Spain
3
Laboratory of Growth Regulators, Institute of Experimental Botany of the Czech Academy of Sciences & Faculty of Science, Palacký University, 783 71 Olomouc, Czech Republic
4
Central Laboratory of Electron Microscopy, Universidade Federal de Santa Catarina, 88040-400 Florianópolis, Brazil
5
Department of Botany, Universidade Federal do Parana, 81531-980 Curitiba, Brazil
6
Laboratório de Fisiologia do Desenvolvimento e Genética Vegetal, Universidade Federal de Santa Catarina, 88034-000 Florianópolis, Brazil
*
Authors to whom correspondence should be addressed.
Forests 2020, 11(8), 807; https://doi.org/10.3390/f11080807
Submission received: 7 July 2020 / Revised: 24 July 2020 / Accepted: 24 July 2020 / Published: 26 July 2020
(This article belongs to the Special Issue Application of Tissue Culture in Plant Reproduction)

Abstract

:
Aleppo pine (Pinus halepensis Mill.), a native species of the Mediterranean region, has been suggested as a species that when introduced in degraded areas could facilitate the long-term colonization and expansion of late-successional species. Due to climate changes, plants need to withstand extreme environmental conditions through adaptation and changings in developmental pathways. Among other paths, plants undergo changes in developmental pathways controlled by phytohormones. At the same time, somatic embryogenesis has been widely used as a model to understand the mechanisms involved in plant response to different stresses. In this study, in order to induce a strong effect of temperature stress on plants regenerated from somatic embryos, higher temperatures (40 °C for 4 h, 50 °C for 30 min, and 60 °C for 5 min) than the control (23 °C) were applied during the induction stage of somatic embryogenesis in Pinus halepensis. A morphological characterization of the embryogenic cultures showed small differences in the number of starch grains, lipid bodies, and phenolic compounds between treatments. Results showed that high temperatures (60 °C) led to higher rates at the maturation stage of somatic embryogenesis when compared to the control (23 °C), strengthening the productivity through the increase in the number of somatic embryos obtained. Finally, analysis of endogenous concentration of cytokinins showed that different conditions applied during the initiation phase of somatic embryogenesis led to different hormonal profiles; isoprenoid cytokinins showed a clear defined pattern with the higher total hormone concentration being found in embryonal masses induced at 50 °C for 30 min, while different aromatic cytokinins presented different individual responses to the treatments applied. These differences corroborate the idea that cytokinins could be potential regulators of stress–response processes during initial steps of somatic embryogenesis.

1. Introduction

Aleppo pine (Pinus halepensis Mill.) is native of the Mediterranean basin and the most important and broadly distributed pine tree in the area, covering ca. 3.5 million hectares of forest area both as natural stands and in reforestation programs [1,2]. It prevails in the driest and warmest sites, especially in the western Mediterranean, due to its tolerance to high temperatures and drought stress [3,4,5].
Pine species appear to be very sensitive to climate warming because of their first position in the successional evolution of Mediterranean ecosystems [6]. As a pioneer species, Aleppo pine has been suggested as a species that when introduced in degraded areas could facilitate the long-term colonization and expansion of late-successional species [7,8]. Models predict that climate change will be one of the major environmental and economic threats worldwide being the Mediterranean basin particularly vulnerable, since strong drought and intensification of extreme events, such as heat waves, are expected in the area the upcoming years [9,10]. Despite the fact that recent increase in the minimum temperature seems to improve the growth of P. halepensis [10,11] its capacity to withstand drought displays strong variations across the species distribution area [12] and the impacts, frequency and magnitude of extreme events are uncertain. The capacity of forest ecosystems to cope with this problem will rely on the relationship between how fast these changes occur and how fast forest trees can adapt to them [4].
Plant stress stands as a condition that inhibits normal growth and development that may be severely damaging or even lethal and could be caused, among other factors, by extreme temperatures. As sessile organisms, plants need to withstand extreme environmental conditions in situ through adaptation and modification of developmental pathways [13]. Moreover, it was observed that Picea abies plants keep a memory of temperatures [14] and photoperiod [15] experienced during zygotic embryogenesis and further seed maturation through the development of an adaptive epigenetic memory. To this respect, several authors have shown that environmental conditions can induce epigenetic changes in plants, favoring their adaptation to different stress situations, which can be permanent and even hereditary [16,17,18].
Phytohormones, like cytokinins (CKs), are defined as naturally occurring compounds that function at very low concentrations and control various cellular processes and plant responses to environmental conditions [19,20]. Among other different factors involved in stress signaling, they can have multiple effects and prompt different responses depending on various factors as nutrient and water availability, environmental conditions and interactions with other phytohormones [21].
CKs are the mobile adenine derivatives that carry N6-linked isopentenyl or aromatic side chains and they serve as hormonal signals functioning in a countless of biological processes [22]. These plant hormones are involved, through modulation of its levels either by upregulation of synthesis or deregulation of their degradation [23], in abiotic stress responses [24] as well as to regulate a number of aspects of plant growth and development, such as cytokinesis, cell differentiation, growth, quiescence, and senescence [25].
Somatic embryogenesis (SE) brings great advantages and applications to biotechnology because it can be used for large-scale propagation of plant species and it can be combined with other techniques such as cryopreservation or conservation at low temperatures [26]. Also, it allows the selection of clones in field tests and has been widely used as a model system for understanding the physiological and biochemical events occurring in response to different abiotic stresses [27]. The first report of SE in P. halepensis was carried out in our laboratory [28]. Later conducted experiments in our group in P. halepensis showed that changes in temperature and water availability at initial steps of SE affect the success of the process in this species [29,30]. Considering these previous results, the main goal of this work was to evaluate the effect of high temperatures (40, 50, and 60 °C) applied for different induction periods (4 h, 30 min, and 5 min, respectively) in the initiation stage of P. halepensis SE in terms of the success of the process itself (initiation, proliferation, maturation and germination rates) as well as in the quantity and quality of somatic embryos (SES) obtained. In line with this goal and in order to study the involvement of CKs in temperature stress, levels of isoprenoid and aromatic cytokinins were analyzed. Moreover, morphological and ultrastructural alterations on the embryogenic cultures coming from different treatments was also evaluated.

2. Materials and Methods

2.1. Plant Material and Temperature Experiment

One-year-old green female cones, enclosing immature seeds of P. halepensis from five open pollinated trees (17-1, 17-2, 17-3, 17-4 and 17-5) were sampled on July, at Manzanos (Spain; latitude: 42°44′29″ N, longitude: 2°52′35″ O). Cones from each mother tree were separately stored at 4 °C for three months following the method described in [31]. Whole megagametophytes containing immature embryos, corresponding to early cleavage polyembryony and the first “bullet” stages with a dominant embryo [32], were used as initial explants.

2.1.1. Initiation of EMs

Initiation medium was DCR [33] supplemented with 30 g L−1 sucrose and 3.5 g L−1 gellan gum (Gelrite®, Duchefa Biochemie, Amsterdam, Netherlands), with a combination of 9.0 µM 2,4-dichlorophenoxyacetic acid and 2.7 µM kinetin, at pH 5.7. After autoclaving, a filter-sterilized solution containing EDM6 amino acid mixture [34] was added to the cooled medium. For temperature treatments, sealed Petri dishes containing initiation medium were preheated for 30 min. For the induction of embryonal masses (EMs) the procedure described in [28] was followed. In brief, immature megagametophytes were cultured at 40, 50, and 60 °C for 4 h, 30 min, and 5 min, respectively. As control conditions, 23 °C were used. After the application of the different treatments, all the megagametophytes were kept at 23 °C for 9 weeks in darkness. Four to eight megagametophytes per 26 Petri dish per treatment were cultured.

2.1.2. Proliferation of EMs

After 9 weeks on the initiation medium, proliferating EMs with an approximate diameter of 16 mm were detached from the megagametophyte. Before the first subculture on the proliferation medium, fresh tissues from all treatments were immersed in liquid nitrogen and immediately stored at −80 °C for further analysis. Proliferation medium had the same composition to that used in the initiation stage, but a higher gellan gum concentration (4.5 g L−1). EMs were subcultured every 2 weeks and kept in the dark. Following three subcultures, actively growing EMs were recorded as established embryogenic cell lines (ECLs). Proliferation and the subsequent stages of SE process were carried out at the same temperature (23 ± 2 °C).

2.1.3. Maturation of ECLs

Maturation of SES was carried out following the procedure described in [28]. Thus, after 4 subcultures on the proliferation medium, 75 mg of EMs per dish from different treatments were used. Maturation medium was the DCR medium supplemented with 60 g L−1 sucrose, 75.0 µM abscisic acid, the EDM6 amino acid mixture [34] and 9 g L−1 Gelrite®. Eight or nine ECLs per treatment and eight Petri dishes per ECL were cultured in the dark for 18 weeks.
To analyze their morphology 160 of the produced SES, 10 from four ECLs per temperature treatment, were selected. For this purpose, two measurements were made using a Leica DMS 1000 microscope and the LAS V4.12 (Leica Application Suite, Wetzlar, Germany) software: the total length of the SES and the width, measured just below the cotyledonary intersection (Figure 1).

2.1.4. Somatic Embryo Germination

SES were transferred to half-strength macronutrients LP medium [35,36] supplemented with 2 g L−1 of activated charcoal and 9.5 g L−1 Difco® granulated agar (Becton Dickinson, Franklin Lakes, USA). Twenty embryos per Petri dish and four Petri dishes per 8 ECLs of each treatment were tested. Cultures were placed partially covered for 7 days, and, afterwards were kept under a 16:8 h photoperiod at 100 µmol m−2 s−1 provided by cool white fluorescent tubes (TFL 58 W/33, Philips, France). The obtained plantlets were subcultured onto fresh medium of the same composition every 4 weeks.

2.2. Cytological Characterization of Embryogenic Cultures

2.2.1. Micromorphological Study

EMs at the end of the initiation phase, right before the first subculture on the proliferation medium, were used for light microscopy analyses following the procedure described in [37]. Two ECLs per treatment, comprising a total of 8 ECLs were analyzed. Samples of 3–5 mm in diameter were collected and fixed in formaldehyde 2.5% (v/v) in 0.1 M sodium phosphate buffer (pH 7.2) overnight at 4 °C. The material was washed twice for 15 min in buffer without fixative and then dehydrated in an increasing series of ethanol aqueous solutions (30–100% v/v), comprising a total of six different solutions, for 30 min. Samples were then infiltrated with Historesin (Leica Historesin, Heidelberg, Germany) and sections of 5 µm were obtained using a rotatory microtome (Slee Technik, Mainz, Germany). After adhesion to histological slides, sections were stained with 1% (w/v) toluidine blue in an aqueous solution of 1% Borax, pH 9. Samples were analyzed and photographed using an Olympus BX 40 microscope equipped with a computer-controlled Olympus DP 71 digital camera (Olympus, Tokyo, Japan).

2.2.2. Ultrastructural Analysis

Part of the ECLs used for the micromorphological studies were also subjected to transmission electron microscopy (TEM) analysis. Samples of 3–5 mm in diameter were fixed in 2.5% (v/v) glutaraldehyde in 0.1% (w/v) sodium cacodylate buffer and 0.6% (w/v) sucrose overnight. After five washing steps of 20 min, with decreasing concentrations of 0.1% (w/v) sodium cacodylate buffer (1; 0.75; 0.50; 0.25; 0) and increasing concentrations of 0.6% sucrose (w/v) (1; 1.25; 1.50; 1.75; 2) in 2.5% (v/v) glutaraldehyde, the samples were post-fixed using 1% (w/v) osmium tetroxide prepared in 0.1 M sodium cacodylate for 4 h. Samples were washed again three times with the same buffer and dehydrated in an increasing series of acetone aqueous solutions from 30 to 100% (v/v) following the same procedure described above for light microscopy assays. Finally, the material was embedded in Spurr’s resin [38] and ultrathin sections (60 nm) were collected and contrasted on grinds using aqueous uranyl acetate followed by lead citrate [39]. The samples were then examined under a TEM JEM 1011 electron microscope (JEOL Ltd., Tokyo, Japan, at 80 kV).

2.3. Extraction, Purification and Quantification of Endogenous Cytokinins

Liquid nitrogen frozen EMs at the end of the initiation phase, right before the first subculture on the proliferation medium, were used for the CKs analysis. Three or four ECLs per treatment, comprising a total of 13 ECLs, including the 8 ECLs studied at microscopy, were analyzed. The isoprenoids CKs studied were: cis-Zeatin (cZ), cis-Zeatin riboside (cZR), cis-Zeatin O-glucoside (cZOG), cis-Zeatin-7-glucoside (cZ7G), cis-Zeatin-9-glucoside (cZ9G), cis-Zeatin riboside O-glucoside (cZROG), cis-Zeatin riboside-5′-monophosphate (cZRMP), trans-Zeatin (tZ), trans-Zeatin riboside (tZR), trans-Zeatin O-glucoside (tZOG), trans-Zeatin-7-glucoside (tZ7G), trans-Zeatin-9-glucoside (tZ9G), trans-Zeatin riboside O-glucoside (tZROG), trans-Zeatin riboside-5′-monophosphate (tZRMP), Dihydrozeatin (DHZ), Dihydrozeatin riboside (DHZR), Dihydrozeatin O-glucoside (DHZOG), Dihydrozeatin-7-glucoside (DHZ7G), Dihydrozeatin-9-glucoside (DHZ9G), Dihydrozeatin riboside O-glucoside (DHZROG), Dihydrozeatin riboside-5′-monophosphate (DHZRMP), N6-Isopentenyladenine (iP), N6-Isopentenyladenosine (iPR), N6-Isopentenyladenine-7-glucoside (iP7G), N6-Isopentenyladenine-9-glucoside (iP9G), N6-Isopentenyladenosine-5′monophosphate (iPMP); and the aromatic CKs studied were: N6-Benzyladenine (BA), N6-Benzyladenosine (BAR), N6-Benzyladenine-7-glucoside (BA7G), N6-Benzyladenine-9-glucoside (BA9G), N6-benzyladenosine-5′monophosphate (BARMP), ortho-Topolin (oT), ortho-Topolin riboside (oTR), ortho-Topolin-7-glucoside (oT7G), ortho-Topolin-9-glucoside (oT9G), meta-Topolin (mT), meta-Topolin riboside (mTR), meta-Topolin-7-glucoside (mT7G), meta-Topolin-9-glucoside (mT9G), para-Topolin (pT), para-Topolin riboside (pTR) para-Topolin-7-glucoside (pT7G), para-Topolin-9-glucoside (pT9G), Kinetin (Kn), Kinetin riboside (KR), and Kinetin-9-glucoside (K9G).
Two technical replicates of 10 mg per ECL were analyzed, using miniaturized purification (pipette tip solid-phase extraction), according to the protocol described by [40]. Samples were extracted in 1 mL of modified Bieleski solvent and homogenized using a MM 301 vibration mill (Retsch GmbH & Co. KG, Haan, Germany) (27 Hz, 5 min, 4 °C) after addition of 3 zirconium oxide beads. Samples were extracted with the addition of stable isotope-labeled internal standards (0.2 pmol for base, ribosides, 9- and 7-glucoside CKs and 0.5 for O-glucoside and CK nucleotides). The extracts were ultrasonicated for 3 min and incubated at 4 °C with continuous shaking for 30 min at 20 rpm. After centrifugation (15 min, 20,000 rpm, 4 °C) from the supernatants of each sample, another 3 technical replicates of 300 μL per sample were transferred onto Stage Tips and purified according to the aforementioned protocol, with C18, SDB-RPS, and Cation-SR sorbents.
Previously to the loading of the sample the StageTip sorbents were conditioned with 50 μL acetone (by centrifugation at 2,000 rpm, 10 min, 8 °C), 50 μL methanol (2,000 rpm, 10 min, 8 °C), 50 μL water (2,200 rpm, 15 min, 8 °C), equilibrated with 50 μL 50% (v/v) nitric acid (2,500 rpm, 20 min, 8 °C), 50 μL water (2,500 rpm, 20 min, 8 °C) and 50 μL modified Bieleski solvent [41] (2,500 rpm, 20 min, 8 °C). After the application of 300 μL of sample (3,500 rpm, 30 min, 8 °C), the tips were washed using 50 μL of water and methanol (3,500 rpm, 20 min, 8 °C). Samples were then eluted with 50 μL of 0.5 M NH4OH in 60% (v/v) methanol (3,500 rpm, 20 min, 8 °C) and elutes were collected into new clean microcentrifuge tubes, evaporated to dryness and dissolved in 30 μL of mobile phase prior to UHPLC-MS/MS analyses.
Mass analysis was carried out following the procedure described by [24], using an Acquity UPLC® System and a triple-quadrupole mass spectrometer XevoTM TQ-S MS (Waters MS Technologies, Manchester, United Kingdom). All MS data were processed using the MassLynxTM software with TargetLynxTM program (version 4.2., Waters, Milford, USA), and compounds were quantified by standard isotope dilution analysis [42].

2.4. Data Collection and Statistical Analysis

After 7–9 weeks on initiation medium, the number of initiated EMs per Petri dish was registered and the initiation percentages were calculated. Following three subcultures, actively growing EMs were recorded as ECLs and the percentage of proliferation respect to the EMs initiated was calculated. After 18 weeks from the beginning of the maturation stage, the number of ECLs able to form SES and the number of mature somatic embryos produced per ECLs were registered. The percentage of mature SES per gram of ECLs and morphology data were also assessed. In the second subculture on germination medium, the number of germinated SES was evaluated to calculate germination rates.
A one-way analysis of variance was carried out to assess the effect of temperature on SE stages percentages, mature SES produced per gram as well as their morphology data, and different concentration of endogenous cytokinins produced (GraphPad Prism 8.4.1 (676)). Following confirmation of the homogeneity of variances and normality of the samples an ANOVA was made. Whenever the analysis of variance did not fulfill the normality hypothesis, the corresponding non-parametric test, Kruskal–Wallis test, was applied. When significant differences were found (p < 0.05), the Tukey HSD post hoc test or Dunn’s multiple comparison test, respectively, were carried out to find out which treatments were statistically different.

3. Results

3.1. Temperature Experiment

Induction at the control temperature (23 °C) presented the lowest initiation rate. The highest initiation (Figure 2a) and proliferation percentages were achieved when megagametophytes were induced at 40 °C and the lowest proliferation rate was obtained at EMs (Figure 2b) induced at 60 °C for 5 min. Despite the fact that there were no significant differences between treatments at initiation and proliferation rates (Table 1 and Table 2), a decreasing pattern could be seen as the temperature rose along the high induction temperatures applied during initiation.
Concerning the effect of different temperatures during initiation on somatic embryo maturation all ECLs transferred to maturation conditions were able to produce somatic embryos (Table 2).
No statistically significant differences were found for initiation, proliferation, or maturation capacity. Nevertheless, statistically significant differences were found when the number of SES per gram were analyzed, with the treatment of 60 °C for 5 min presenting the highest values (Table 2), regardless of the fact that this treatment showed lowered rates of initiation when compared to other treatments. Control temperature showed an intermediate value (Table 2).
When the morphological aspects of SES produced were analyzed (Figure 1), the results showed that those produced from the ECLs initiated under control (23 °C) temperatures and at the highest temperature tested (60 °C) were significantly longer compared to somatic embryos resulting from other treatments. Regarding the ratio between length and width, SES from EMs induced at 60 °C for 5 min were significantly more elongated than those from EMs induced at 40 °C for 4 h and 50 °C for 30 min that presented a more barrel-shape form (Table 3 and Table 4).
No significant differences were found for the percentage of germination (Figure 2c) (Table 1). The highest germination rates were achieved in SES from ECLs initiated at 50 °C for 30 min followed by 60 °C for 5 min (Table 2).
In contrast with somatic embryos length and the ratio between length and width, no significant differences could be found between SES width coming from different temperature treatments (Table 4).

3.2. Cytological Characterization of Embryogenic Cultures

Three cell types were revealed in the embryogenic cultures analyzed by light microscopy: (1) Small round-shaped embryogenic cells (ECs) strongly stained and displaying a dense cytoplasm, a high ratio nucleus/cytoplasm, a conspicuous nucleoli and where mitotic figures were often seen; (2) highly vacuolated elongated suspensor cell (SCs), which have a reduced cytoplasm between the cell membrane and the tonoplast and (3) tube-like cells (TLCs) that seemed to be in transition between ECs and SCs sharing characteristics of both cell types (Figure 3a–e). All three types of cells could be found in all samples analyzed. These different types of cells usually appeared in clusters forming proembryogenic masses (PEM).
Two different stages of development were found: PEM I (Figure 3a) with smalls groups of ECs associated with one or two SCs; and PEM II, with a higher number of ECs and SCs in the cluster (Figure 3b). No PEM III, which consists of larger clusters of ECs and SCs, were found.
Despite the organized and clear cell polarization of PEM II found in some sections (Figure 3b) the majority of PEMs found in the analyzed samples showed poor cellular organization. However, although all three types of cells were present (ECs, SCs, and TLCs), all of them tangled together without defined polarization and an unbalanced proportion between embryonal areas and suspensors, with a big number of TLCs and SCs, was often observed (Figure 3c,e). Both polarized and non-polarized areas were detected for all treatments, therefore, it seems that there are not differences respect to cellular organization between treatments.
Finally, a large number of starch grains (S) on ECs on samples from all treatments (Figure 3c,d) and some phenolic compounds (PCs) were found only in one sample from an embryogenic culture induced at 60 °C for 5 min (Figure 3e).
TEM observation of samples from the same embryogenic cultures analyzed by light microscopy confirmed the presence three different types of cells, ECs, TLCs and SCs (Figure 4a–i).
ECs were characterized by a dense cytoplasm and a large central nucleus containing one or more nucleolus. Many cytoplasmic organelles, indicatory of intense metabolic activity such as mitochondria, Golgi complex, and PVs were found around the nucleus (Figure 4a–c). Quite common was the presence of vacuoles containing phenolic compounds in ECs (Figure 4d,e) in samples from different temperatures. These polyphenolic-containing vacuoles were particularly abundant in samples induced at 50 °C for 30 min. On the contrary, PCs could not be found in explants cultured under control temperatures. These observations confirm those obtained with light microscopy where PCs where only found in cultures kept at 60 °C for 5 min.
Concerning the starch found by light microscopy in samples from all treatments, TEM analysis displayed the same results. A great amount of starch was found in all treatments in ECs (Figure 4a,f) and some could also be found in TLCs (Figure 4f). It can also be noted that, contrary to light microscopy where no evident differences were clear between treatments, TEM allowed the identification of a higher number of starch in samples from cultures initiated at the control temperature (23 °C). A great amount of lipid bodies (LB) were also detected on samples from all treatments (Figure 4e) particularly in samples cultured under the lowest temperature (control).
Regarding TLCs, that seem to be in transition between ECs and SCs, cells were more elongated and had a higher number of PVs when comparing to ECs (Figure 4g). It appeared that by progressive destruction of the cytosol and organelles, PVs were formed on the cytoplasm and together started to form a large central vacuole (V). SCs appeared as PVs started rising in number toward the cell periphery and converged to the formation of a large central V that occupied the majority of cell volume, restraining the cytoplasm to a narrow layer confined between tonoplast and plasma membrane (Figure 4i). No clear differences among treatments were found for TLCs or PVs.

3.3. Endogenous Cytokinins Quantification

Statistically significant differences with a very defined pattern were found concerning the concentrations of total isoprenoids CKs, CKs bases, CKs ribosides, and CKs nucleotides (Table 5), Figure 5). Samples coming from control conditions showed the lowest values in all the CKs groups analyzed. On the contrary, tissues coming from EMs induced at 50 °C for 30 min contained a significantly higher concentration compared to the control. The other treatments presented intermediate values (Figure 5a). The same results were obtained for CKs ribosides (Figure 5b). Samples coming from EMs initiated at 50 °C for 30 min showed significantly higher concentration of CKs bases when compared to all treatments (Figure 5c). In the same way, CKs nucleotides concentrations were significantly higher in samples coming from 50 °C treatment (Figure 5d). It should also be noted that this was the functional group that presented the highest concentration of isoprenoid endogenous CKs.
When the total contents of different isoprenoids CKs types were analyzed, the results showed the same pattern observed for isoprenoids functional groups (Figure 6a–d).
cZ types showed significant differences between samples from all treatments and the control (Figure 6a). EMs induced at 50 °C for 30 min contained amounts significantly higher of tZ, DHZ, and iP types than the other treatments assayed (Figure 6b–d).
Examining the content of each isoprenoid CKs individually, cZ and iP concentrations in samples from 50 °C showed statistically significant differences from other treatments, apart from 40 °C that presented intermediate values (Figure 7a,b). In tZ and DHZRMP mean values of samples from 50 °C treatment resulted in the highest values of cytokinins (Figure 7c,d). cZRMP and tZRMP presented higher concentrations in samples cultured at highest temperatures (50 and 60 °C) and DHZR showed the same pattern as cZ and iP (Figure 7e–g).
The ratios between CK bases and CK nucleotides (Figure 8a), between total DHZ and cZ types (Figure 8b) and between [bases + ribosides] and nucleotides (Figure 8c) presented a decreasing pattern as the temperature increased, with samples from the control presenting a statistically significant higher ratio than the ones from 60 °C treatment. Contrary, the ratio between cZ and tZ types showed to be statistically significant higher in samples from higher temperatures comparing to the control (Figure 8d).
The majority of CKs N-glucosides (7-G/9-G) and O-glucosides were under the limit of detection in samples from all treatments applied. No statistically significant differences were found neither for cZR, tZR, DHZ, DHZR, iPR, and iPMP, nor for the ratios between CK bases and ribosides, iP, and Z types and tZ and DHZ (Table 6).
When the effect of different induction temperatures in the endogenous concentrations of aromatic CKs was analyzed, statistically significant differences were found concerning the concentrations of BA and K types, as well as BA, Kn, K9G, and oT (Table 7). Concentrations of BA types in samples coming from 40 °C treatment were significantly lower than samples from the control (Figure 9a). BA concentrations showed the same pattern, and samples coming from 50 and 60 °C treatment presented intermediate values (Figure 9b). K types and Kn mean values obtained in samples cultured under 50 °C were significantly higher when compared to the other treatments. It should be noted that the Kn presented, by far, the higher concentration for all treatments (Figure 9c,d). K9G concentration was the highest in samples coming from 60 °C initiation treatment (Figure 9e). oT concentrations in samples cultured at the control treatment were significantly lower when compared to higher temperatures (Figure 9f).
The majority of aromatic CKs N-glucosides (7-G/9-G) (apart from K9G), BARMP, oTR and all of pT types were under limit of detection in all samples from different treatments. Finally, it is worth to mention that statistically significant differences were not found for BAR, total mT types, mT, mTR or KR (Table 8).

4. Discussion

4.1. Temperature Experiment

In the present study temperatures higher than used in standard routine were applied (40, 50, and 60 °C) during the initiation stage of P. halepensis SE for different periods (4 h, 30 min, and 5 min, respectively). No statistically significant differences could be found between initiation, proliferation, maturation or germination rates obtained in the different treatments assayed during the induction of EMs. These results are in agreement with the ones obtained when the same temperatures and induction times were studied in P. radiata [43] where no significant differences were also found. Nonetheless, the control presented a lower initiation rate when compared to higher temperatures, in contrast with the results obtained in previous studies carried out in our laboratory [29].
Also, the ECLs initiated under different temperatures did not show significant differences regarding their capacity to produce SES, corroborating the results found in Pinus spp. previous studies [29,43]. However, samples induced at 60 °C for 5 min showed significantly higher number of somatic embryos, doubling the number of embryos produced in samples cultured at 40 or 50 °C. Similar results have been obtained in P. radiata, where although not statistically significant differences were found, the highest embryo production was achieved at 60 °C [43]. Similar experiments carried out in P. pinaster [44] showed that an increase of temperature up to 28 °C resulted on initiation rates similar to those observed in standard conditions but significantly higher number of SES were produced. This fact reinforce the idea that temperature exerts a selective pressure in the SE initial stages, that can result in an initiation decrease but higher rates for the forthcoming steps [45,46].
It seems that the temperature treatment that triggered a deeper effect on the efficiency of P. halepensis SE, was 60 °C for 5 min. In spite of the association of stress with adaptation mechanisms and the induction of SES formation, cell responses to the applied stresses depends on its intensity [47]. The different induction times for each temperature could in a way affect samples response to the different high temperatures applied.
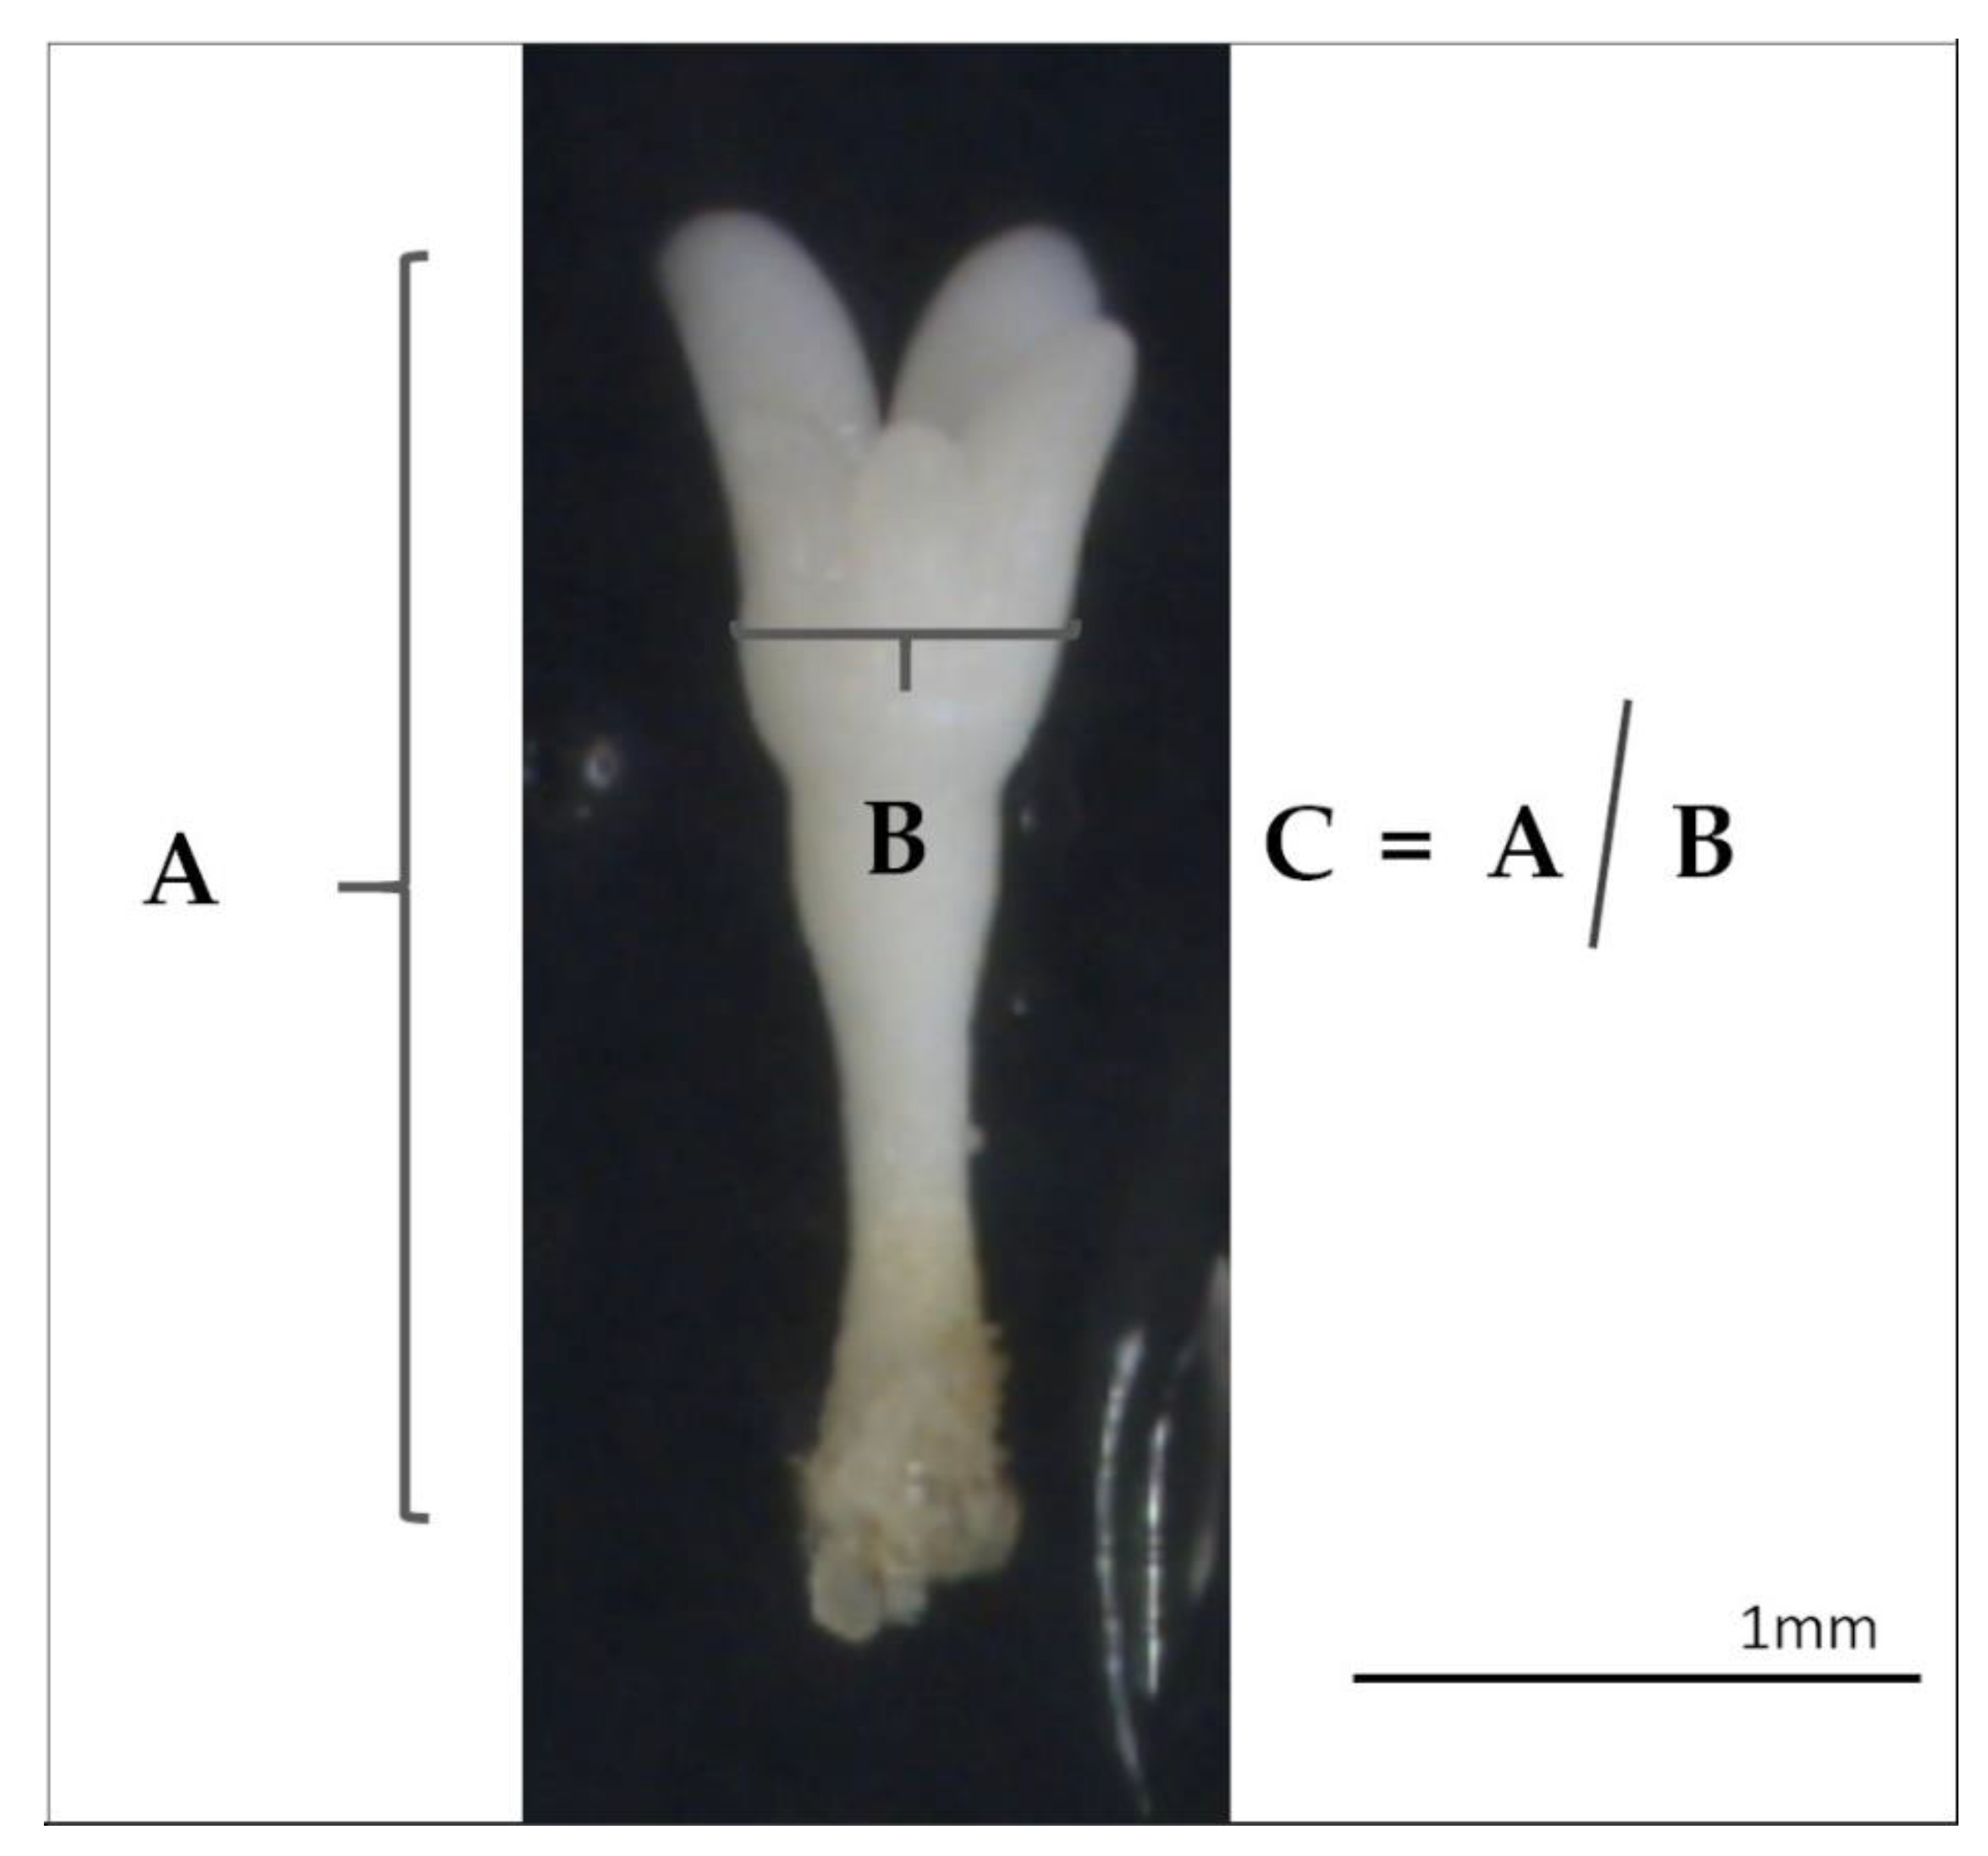
Regarding the morphological analysis of the SES obtained, more elongated embryos were obtained from samples induced at 60 °C for 5 min and from the control treatment, while the ones obtained from 40 °C for 4 h or 50 °C for 30 min were smaller and more barrel-shaped. Barrel-shaped form has been described as a symptom of poor quality embryos, which is usually accompanied by low germination rates in P. taeda [48], P. Pinaster [49], and P. radiata [43]. This is contrary to our results since no significant differences were found in the percentage of germinating somatic embryos, and, in fact, the highest percentage of germination was achieved in SES from ECLs initiated at 50 °C for 30 min. These results indicate that the shape of P. halepensis SES may not be related with their ability to germinate as long as they are well formed.

4.2. Cytological Characterization of Embryogenic Cultures

Previous work on Picea abies [50] showed that embryogenic cultures appeared in three distinct levels or organization: PEM I, PEM II, and PEM III, formed by three different cell types (ECs, TLCs, and SCs) attached together in clusters in different proportions.
In Aleppo pine three different types of cells (ECs, TLCs, and SCs) in embryogenic cultures from all different temperature treatments (23, 40, 50, and 60 °C) were also found. Nonetheless, only two of the organizational structures described by [50] could be found, since no PEM III were present. In Picea abies [50] PEM III were described as enlarged clumps of densely cytoplasmic cells loosely attached to each other that do not present polarity while in the case of P. radiata these cells formed compact clusters which showed a well-organized structure with a clear polarization in samples from the control and a higher disorganization at samples from higher temperatures treatments [43]. Also, despite the fact that well organized and polarized PEMs could be observed from different treatments, the common scenario featured high cellular disorganization with a disproportionate number of TLCs and SCs and no apparent discrepancies in the analyzed samples could be found between treatments when it comes to these features. In P. sylvestris [51] a continuous loop of embryo degeneration and differentiation of new embryos during the initiation of embryogenic tissue was suggested. However, they could not find if the differentiation pattern during the initiation stage would give rise to differences in the embryos obtained. This can explain the higher number of TLCs and SCs found in our samples and the fact that all of the analyzed embryogenic cultures produced somatic embryos despite their disorganization
A large number of starch was found both in light microscopy and TEM analysis from all treatments. In fact, TEM analysis showed that starch grains were present both in ECs and TLCs and in higher number in samples from the control. Some authors support the idea that, in ECs, the accumulation of starch around the nucleus is a signal of loss of embryogenic competence and it is also linked with the appearance of dead cells in meristematic centers, leading to low initiation and proliferation rates [43,52]. This was not the case in P. halepensis, since no differences were found for initiation or proliferation rates between treatments. Other authors pointed out that starch, as a primary source of energy for cell proliferation, is abundantly found at competent embryogenic cells that will later differentiate into PEMs. High metabolic activity of these cells will deplete this reserve in such a way that it will no longer be present when embryos start to organize [53,54]. In Picea glauca a precise pattern of storage compound accumulation during SE was identified with the first accumulation of starch further followed by the formation of lipid bodies and protein vacuoles [55]. In P. halepensis lipid bodies were also found in all treatments, although more abundantly in the control. Numerous protein bodies of different sizes or lipid bodies were also observed in ECs of other species [54,56]. In the case of P. halepensis, the presence of the above mentioned storage compounds could not be directly correlated with the progress of SE and their function could probably be related with house-keeping functions of the cells more than with a control of the embryogenic process.
Finally, PCs were found in cultures induced at the higher temperatures. These compounds started to accumulate in the internal face of membrane vacuoles and were particularly notorious when cultures were initiated at 50 °C. The accumulation of this type of secondary metabolites has been described as playing an essential role preventing oxidative damage caused by different types of stresses [27,57], explaining their appearance in samples coming from high temperature treatments and not in control ones. In P. radiata differences were also seen among different treatments respect to PCs with larger accumulations at higher temperatures [43]. Also, opposite to our results, a positive association between accumulation of phenolic compounds and somatic embryo formation has been indicated in Acca sellowiana [58].

4.3. Quantification of Endogenous Cytokinins

A significantly higher concentration of isoprenoid CKs is present at EMs induced at 50 °C when compared to the control. Samples from 40 and 60 °C treatments presented concentrations that could be similar to one or another, but were generally intermediate. This pattern was detected through the analysis of the endogenous content of total CKs, CK ribosides, CK nucleotides, cZ, tZ and DHZ types, and finally for cZ, tZ, iP, cZRMP, tZRMP, DHZRMP, and DHZR. The results obtained in P. halepensis are in line with the concept that short-term or mild stresses stimulate CKs accumulation, while prolonged or more severe stresses are generally associated with downregulation of active CKs levels [59,60,61]. Furthermore, the ribosylated form of the initial precursor of CKs biosynthesis, iPA, across the time of heat stress exposure in P. radiata showed an increase as other author pointed out [62]. Contrary, when the same temperatures and induction times were analyzed in P. radiata, the results showed a decreasing tendency when applying high temperatures for isoprenoid CKs, especially for those applied for the longest periods of time (40 and 50 °C) [63].
Although the physiological function of each individual CKs is not yet completely understood they can be classified into different functional groups: (1) Active forms (bases), (2) translocation forms (ribosides), (3) precursors (nucleotides), and (4) storage and inactivated forms usually bound to glycosides (N-glucosides (7-G/9-G) and O-glucosides) [22,64]. Regarding the analysis of different isoprenoid functional groups, the results showed that the highest concentration was obtained for CK nucleotides. As reviewed by [19], it has been demonstrated that exogenously applied free cytokinin bases are rapidly metabolized into the corresponding ribosides and nucleotides and that, in general, high concentrations of these are found in developing organs. In this sense, when the same induction conditions were studied in P. radiata EMs a higher concentration of CKs bases was found [63], while at mature SES of the same species CKs ribosides showed the highest concentration in general [24].
The majority of N-glucosides (7-G/9-G) and O-glucosides, both for isoprenoids and aromatic CKs, were below the limit of detection. In terms of physiological activity, they exhibit little or no activity in CK bioassays [65]. These data are in agreement with those reported for P. radiata when high temperatures were analyzed [63], and opposite to those obtained when different water availability and temperatures were tested at maturation stage of P. radiata SE, despite the low values obtained [24], or when different CKs were examined on the induction of organogenesis [66]. The latter authors hypothesized that this type of forms are normally used by the plant as a form of detoxification in the face of excess hormone. Following this hypothesis, we can say that, in our case, the endogenous content of the hormone is not such that it needs this detoxification mechanism. Data obtained with Norway spruce showed that CKs O-glucosides are the most abundant group during all stages of the SE process, including at callus stage, whereas CKs N-glucosides were practically absent [67]. This can be explained by the difference in the tissues and species analyzed, and the fact that these metabolites have distinctive importance at different stages of SE in these species.
When endogenous concentrations of aromatic CKs were analyzed, a different pattern was obtained when compared to isoprenoid CKs. In K types, despite the fact that samples from 50 °C showed the higher concentrations, 40 °C showed a significantly lower concentration and, in BA types, samples from 40 °C showed significantly lower concentrations when compared with samples from the control. It seems that, when it comes to BA and K types, 40 °C for 4 h acted more as a severe stress, contrary to its effect on isoprenoids CKs [59,60,61]. Also, our results show that the different temperature treatments did not lead to a clear accumulation of these hormones. Reports in apple trees [68], where concentration of Kn tended to reduce with the intensity of water deficit, and in soybean [69], where its growth under salt stress was significantly promoted by elevated Kn levels that effectively improved the quantities of isoflavones presented a more clear function of Kn in response to stress.
Kinetin showed to be the most abundant cytokinin in our samples which might be related to its exogenous application in the culture media. Despite the fact that the majority of naturally occurring CKs in plants are the N6-isopentenyl conjugated adenine derivatives, in addition to a small amount of N6-aromatic CK species [64,70], exogenous addition of CKs to culture media is known to have an effect by altering and increasing the endogenous CKs pool [66,71]. Similarly, reports in Solanum tuberosum [72], Pinus pinea [73], and Pinus radiata [66] found that aromatic CKs accounted for more than 90% of the total endogenous CK pool although isoprenoid forms are generally the most abundant CKs in plant materials that have not been hormonally treated.
High temperatures application overlap with higher endogenous concentrations of oT, cZ types and higher ratios between cZ types and tZ types. Within the CKs identified in response to mistletoe infestation in P. sylvestris, the levels of biologically highly active (tZ, iP) and less active (cZ, DHZ) CKs were also found to be generally enhanced [74]. It should be noted that, despite of the fact that there were no significant differences, the ratio between iP types and Z types also decreased as the temperatures applied rose. Z-type cytokinins are derived from iP-type compounds and not vice versa [22,60,64] and both cell fate and organ formation have been associated with local concentration gradients of these hormones [75]. Despite the fact that oT is present in inferior concentrations comparing to mT (Figure 8; Table 7) it seems to have a stronger effect in stress response as well as in cellular activity since mT did not presented significant variations. Contrary, the results found in Pinus pinea [73] suggest that a higher cellular activity that lead to a stronger callogenesis response was related to higher concentrations of mT as well as BAR and KR that also did not presented significant differences in our case.
Apart from their influence on stress response per se, differences obtained in CKs profiles can explain some of the behaviors seen throughout different SE stages between the different treatments applied. After all, CKs are known to be responsible for the regulation of a number of aspects of plant growth and development, such as cell differentiation and growth [25].
Although there were also no statistically significant differences at proliferation and germination stages, high concentrations of tZ types, tZRMP and iPR of samples from 50 and 60 °C treatments overlays with the highest germination rate achieved during SE, at the same time that the treatments with lower concentrations of these hormones presented lower proliferation rates. In coffee it was reported that the transition to the callus stage was accompanied by significant decrease of Z-type (cis- and trans-) [76]. Experiments carried out in P. pinea [77] indicated that tZR, tZ, and DHZ had a relevant role in the callogenic process. Also, in P. radiata [62] ZR seems to be a key element to further acclimation and the recovery mechanism in plants while iPR and DHZR seems to be highly implied, across time, at the heat stress response.
It must be stressed out that samples from 60 °C and control treatment (23 °C) had a similar endogenous low hormonal concentration of cZ, iP and DHZR, and these are the treatments that were able to induce a significantly higher number of somatic embryos. It was observed in [78] that high concentrations of Z and active CKs in general are important during the initial cell division phase of somatic embryogenesis, but not for the later stages of embryo development and maturation. However, as reported in P. radiata, low levels of iP types leads to higher success in the SE process [24,63]. Additionally, the only CK N-glucoside found in our samples, K9G, presented a significantly higher concentration at 60 °C, the treatment that produced more somatic embryos. In Cocos nucifera [79] the isoprenoid cytokinin profiles showed a predominant pattern of 9-conjugation as a major metabolism route and the detection of high levels of inactive metabolic products has been cited as evidence of high CK turnover.

5. Conclusions

As far as we know, this is the first study developed in Aleppo pine that focus in the initiation of embryonal masses under high temperatures analyzing both the phytohormones involved in the success of the SE process as well as the cytological characterization of embryogenic cultures.
We found that it is possible to improve the efficiency of the somatic embryogenesis process, under high temperatures, strengthening its productivity through the significant increase of somatic embryos obtained at samples induced at 60 °C for 5 min. Different hormonal profiles overlap with the application of temperature stress as lower endogenous concentrations of oT and cZ types cytokinins were found at control. Also, a correlation between high rates at specific steps of the process and higher concentrations of tZ types, tZRMP, and iPR led to higher germination rates.
Further investigations on the effect of temperature stress during induction phase of P. halepensis SE should focus on complementary molecular pathways, as well as the epigenetics involved along the process. Also, the analysis of physiological parameters in somatic embryogenesis-derived plants should be developed in order to confirm if the application of these different treatments allows the production of plants better adapted to the present scenario of climate change.

Author Contributions

Conceptualization, P.M. and J.C.; methodology, P.M., J.C., and I.A.M.; formal analysis, C.P., O.N., A.C.-O., E.D.M.O. and C.P.; investigation, C.P., A.C.-O., I.A.M., A.P., I.P. (Ivan Petřík), I.P. (Iva Pavlović), O.N., M.S., E.D.M.O., H.P.d.F.F., and M.P.G.; data curation, C.P.; writing—original draft preparation, C.P.; writing—review and editing, C.P., J.C., P.M. and I.A.M.; supervision, P.M., J.C. All authors have read and agreed to the published version of the manuscript.

Funding

This research was funded by MINECO (Spanish Government) project (AGL2016-76143-C4-3R), BIOALI-CYTED (P117RT0522), DECO (Basque government, Ayudas de formación a jóvenes investigadores y tecnólogos), Renature: Projecto ReNature (Centro-01-0145-FEDER-000007)—Valorização dos Recursos Naturais Endógenos da Região Centro, and Portuguese Foundation for Science and Technology (FCT), POCH (Programa Operacional Capital Humano) (SFRH/BD/123702/2016)

Acknowledgments

MULTIFOREVER (Project MULTIFOREVER is supported under the umbrella of ERA-NET cofund Forest Value by ANR (FR), FNR (DE), MINCyT (AR), MINECO-AEI (ES), MMM (FI) and VINNOVA (SE). Forest value has received funding from the European Union’s Horizon 2020 research and innovation programmed under agreement N° 773324.

Conflicts of Interest

The authors declare no conflict of interest. The funders had no role in the design of the study; in the collection, analyses, or interpretation of data; in the writing of the manuscript, or in the decision to publish the results.

References

  1. Ne’eman, G.; Goubitz, S.; Nathan, R. Reproductive traits of Pinus halepensis in the light of fireA critical review. Plant. Ecol. 2004, 171, 69–79. [Google Scholar] [CrossRef]
  2. Botella, L.; Santamaría, O.; Diez, J.J. Fungi associated with the decline of Pinus halepensis in Spain. Fungal Divers. 2010, 40, 1–11. [Google Scholar] [CrossRef]
  3. Escudero, A.; Sanz, M.V.; Pita, J.M.; Pérez-García, F. Probability of germination after heat treatment of native Spanish pines. Ann. For. Sci. 1999, 56, 511–520. [Google Scholar] [CrossRef] [Green Version]
  4. Klein, T.; Cohen, S.; Yakir, D. Hydraulic adjustments underlying drought resistance of Pinus halepensis. Tree Physiol. 2011, 31, 637–648. [Google Scholar] [CrossRef] [Green Version]
  5. Mauri, A.; Di Leo, M.; De Rigo, D.; Caudullo, G. Pinus halepensis and Pinus brutia in Europe: Distribution, habitat, usage and threats. In European Atlas of Forest Tree Species; San-Miguel-Ayanz, J., de Rigo, D., Caudullo, G., Houston Durrant, T., Mauri, A., Eds.; Publication Office of the European Union: Luxembourg, 2016; pp. 122–123. [Google Scholar] [CrossRef]
  6. Carnicer, J.; Barbeta, A.; Sperlich, D.; Coll, M.; Penuelas, J. Contrasting trait syndromes in angiosperms and conifers are associated with different responses of tree growth to temperature on a large scale. Front. Plant. Sci. 2013, 4, 409. [Google Scholar] [CrossRef] [Green Version]
  7. Gil, L.; Aránzazu, P. Pines as basic species for restoration of forests in the Mediterranean environment. Ecología 1993, 7, 113–125. [Google Scholar]
  8. Burgos, J.M.; de Montes, P.A. Reforestación y biodiversidad. Líneas metodológicas de planificación y restauración forestal. Montes 1993, 33, 57–76. [Google Scholar]
  9. Lindner, M.; Maroschek, M.; Netherer, S.; Kremer, A.; Barbati, A.; Garcia-Gonzalo, J.; Seidl, R.; Delzon, S.; Corona, P.; Kolström, M.; et al. Climate change impacts, adaptive capacity, and vulnerability of European forest ecosystems. For. Ecol. Manag. 2010, 259, 698–709. [Google Scholar] [CrossRef]
  10. Sarris, D.; Christodoulakis, D.; Körner, C. Impact of recent climatic change on growth of low elevation eastern Mediterranean forest trees. Clim. Chang. 2011, 106, 203–223. [Google Scholar] [CrossRef]
  11. Sánchez-Salguero, R.; Navarro-Cerrillo, R.M.; Camarero, J.J.; Fernández-Cancio, Á. Selective drought-induced decline of pine species in southeastern Spain. Clim. Chang. 2012, 113, 767–785. [Google Scholar] [CrossRef]
  12. Gazol, A.; Ribas, M.; Gutiérrez, E.; Camarero, J.J. Aleppo pine forests from across Spain show drought-induced growth decline and partial recovery. Agric. For. Meteorol. 2017, 232, 186–194. [Google Scholar] [CrossRef]
  13. Bäurle, I. Can’t remember to forget you: Chromatin-based priming of somatic stress responses. Semin. Cell Dev. Biol. 2018, 83, 133–139. [Google Scholar] [CrossRef] [PubMed]
  14. Johnsen, Ø.; Dæhlen, O.G.; Østreng, G.; Skrøppa, T. Daylength and temperature during seed production interactively affect adaptive performance of Picea abies progenies. New Phytol. 2005, 168, 589–596. [Google Scholar] [CrossRef] [PubMed]
  15. Johnsen, Ø.; Fossdal, C.G.; Nagy, N.; MØlmann, J.; Dæhlen, O.G.; SkrØppa, T. Climatic adaptation in Picea abies progenies is affected by the temperature during zygotic embryogenesis and seed maturation. Plant Cell Environ. 2005, 28, 1090–1102. [Google Scholar] [CrossRef]
  16. Mirouze, M.; Paszkowski, J. Epigenetic contribution to stress adaptation in plants. Curr. Opin. Plant Biol. 2011, 14, 267–274. [Google Scholar] [CrossRef]
  17. Mahdavi-Darvari, F.; Noor, N.M.; Ismanizan, I. Epigenetic regulation and gene markers as signals of early somatic embryogenesis. Plant Cell. Tissue Organ. Cult. 2014, 120, 407–422. [Google Scholar] [CrossRef]
  18. Gallusci, P.; Dai, Z.; Génard, M.; Gauffretau, A.; Leblanc-Fournier, N.; Richard-Molard, C.; Vile, D.; Brunel-Muguet, S. Epigenetics for Plant Improvement: Current Knowledge and Modeling Avenues. Trends Plant Sci. 2017, 22, 610–623. [Google Scholar] [CrossRef]
  19. Frébort, I.; Kowalska, M.; Hluska, T.; Frébortová, J.; Galuszka, P. Evolution of cytokinin biosynthesis and degradation. J. Exp. Bot. 2011, 62, 2431–2452. [Google Scholar] [CrossRef]
  20. Fahad, S.; Hussain, S.; Matloob, A.; Khan, F.A.; Khaliq, A.; Saud, S.; Hassan, S.; Shan, D.; Khan, F.; Ullah, N.; et al. Phytohormones and plant responses to salinity stress: A review. Plant Growth Regul. 2015, 75, 391–404. [Google Scholar] [CrossRef]
  21. Ferguson, L.; Grafton-Cardwell, E. Citrus Production Manual; ANR Catalog: Oakland, CA, USA, 2014; pp. 215–227. [Google Scholar]
  22. Sakakibara, H. Cytokinin biosynthesis and metabolism. In Plant Hormones: Biosynthesis, Signal Transduction, Action! Davies, P., Ed.; Springer: Amsterdam, The Netherlands, 2010; pp. 95–114. [Google Scholar] [CrossRef]
  23. Podlešáková, K.; Ugena, L.; Spíchal, L.; Doležal, K.; De Diego, N. Phytohormones and polyamines regulate plant stress responses by altering GABA pathway. N. Biotechnol. 2019, 48, 53–65. [Google Scholar] [CrossRef]
  24. Moncaleán, P.; García-Mendiguren, O.; Novák, O.; Strnad, M.; Goicoa, T.; Ugarte, M.D.; Montalbán, I.A. Temperature and water availability during maturation affect the cytokinins and auxins profile of radiata pine somatic embryos. Front. Plant Sci. 2018, 9, 1–13. [Google Scholar] [CrossRef] [Green Version]
  25. Ciura, J.; Kruk, J. Phytohormones as targets for improving plant productivity and stress tolerance. J. Plant Physiol. 2018, 229, 32–40. [Google Scholar] [CrossRef] [PubMed]
  26. Montalbán, I.A.; Moncaleán, P. Long term conservation at −80 °C of Pinus radiata embryogenic cell lines: Recovery, maturation and germination. Cryo Lett. 2017, 38, 202–209. [Google Scholar]
  27. Eliášová, K.; Vondráková, Z.; Malbeck, J.; Trávníčková, A.; Pešek, B.; Vágner, M.; Cvikrová, M. Histological and biochemical response of Norway spruce somatic embryos to UV-B irradiation. Trees Struct. Funct. 2017, 31, 1279–1293. [Google Scholar] [CrossRef]
  28. Montalbán, I.A.; Setién-Olarra, A.; Hargreaves, C.L.; Moncaleán, P. Somatic embryogenesis in Pinus halepensis Mill.: An important ecological species from the Mediterranean forest. Trees 2013, 27, 1339–1351. [Google Scholar] [CrossRef]
  29. Pereira, C.; Montalbán, I.A.; García-Mendiguren, O.; Goicoa, T.; Ugarte, M.D.; Correia, S.; Canhoto, J.M.; Moncaleán, P. Pinus halepensis somatic embryogenesis is affected by the physical and chemical conditions at the initial stages of the process. J. For. Res. 2016, 21, 143–150. [Google Scholar] [CrossRef]
  30. Pereira, C.; Montalbán, I.A.; Goicoa, T.; Ugarte, M.D.; Correia, S.; Canhoto, J.M.; Moncaleán, P. The effect of changing temperature and agar concentration at proliferation stage in the final success of Aleppo pine somatic embryogenesis. For. Syst. 2017, 26, 3–6. [Google Scholar] [CrossRef] [Green Version]
  31. Montalbán, I.A.; García-Mendiguren, O.; Goicoa, T.; Ugarte, M.D.; Moncaleán, P. Cold storage of initial plant material affects positively somatic embryogenesis in Pinus radiata. New For. 2015, 46, 309–317. [Google Scholar] [CrossRef]
  32. Montalbán, I.A.; de Diego, N.; Moncaleán, P. Enhancing initiation and proliferation in radiata pine (Pinus radiata D. Don) somatic embryogenesis through seed family screening, zygotic embryo staging and media adjustments. Acta Physiol. Plant. 2012, 34, 451–460. [Google Scholar] [CrossRef]
  33. Gupta, P.K.; Durzan, D.J. Plantlet regeneration via somatic embryogenesis from subcultured callus of mature embryos of Picea abies (Norway spruce). Vitr. Cell Dev. Biol. 1986, 22, 685–688. [Google Scholar] [CrossRef]
  34. Walter, C.; Find, J.I.; Grace, L.J. Somatic embryogenesis and genetic transformation in Pinus radiata. In Protocol for Somatic Embryogenesis in Woody Plants; Jain, S.M., Gupta, P.K., Eds.; Springer: Dordrecht, The Netherlands, 2005; pp. 11–24. [Google Scholar]
  35. Quoirin, M.; Lepoivre, P. Improved media for in vitro culture of Prunus sp. Acta Hortic 1977, 78, 437–442. [Google Scholar] [CrossRef]
  36. Aitken-Christie, J.; Singh, A.P.; Davies, H. Multiplication of meristematic tissue: A new tissue culture system for radiata pine. In Genetic Manipulation of Woody Plants; Hanover, J.W., Keathley, D.E., Wilson, C.M., Kuny, G., Eds.; Springer: Boston, MA, USA, 1988; pp. 413–432. [Google Scholar] [CrossRef]
  37. Fraga, H.P.F.; Vieira, L.N.; Puttkammer, C.C.; Oliveira, E.M.; Guerra, M.P. Time-lapse cell tracking reveals morphohistological features in somatic embryogenesis of Araucaria angustifolia (Bert) O. Kuntze. Trees Struct. Funct. 2015, 29, 1613–1623. [Google Scholar] [CrossRef]
  38. Spurr, A.R. A low-viscosity epoxy resin embedding medium for electron microscopy. J. Ultrasructure Res. 1969, 26, 31–43. [Google Scholar] [CrossRef]
  39. Reynolds, E.S. The use of lead citrate at high pH as an electron-opaque stain in electron microscopy. J. Cell Biol. 1963, 17, 208–212. [Google Scholar] [CrossRef] [Green Version]
  40. Svačinová, J.; Novák, O.; Plačková, L.; Lenobel, R.; Holík, J.; Strnad, M.; Doležal, K. A new approach for cytokinin isolation from Arabidopsis tissues using miniaturized purification: Pipette tip solid-phase extraction. Plant Methods 2012, 8, 1–14. [Google Scholar] [CrossRef] [Green Version]
  41. Bieleski, R.L. The problem of halting enzyme action when extracting plant tissues. Anal. Biochem. 1964, 9, 431–442. [Google Scholar] [CrossRef]
  42. Rittenberg, D.; Foster, G. A new procedure for quantitative analysis by isotope dilution, with application to the determination of amino acids and fatty acids. J. Biol. Chem. 1940, 133, 737–744. [Google Scholar]
  43. Castander-Olarieta, A.; Montalbán, I.A.; De Medeiros Oliveira, E.; Dell’aversana, E.; D’amelia, L.; Carillo, P.; Steiner, N.; Fraga, H.P.D.F.; Guerra, M.P.; Goicoa, T.; et al. Effect of thermal stress on tissue ultrastructure and metabolite profiles during initiation of radiata pine somatic embryogenesis. Front. Plant Sci. 2019, 9, 1–16. [Google Scholar] [CrossRef]
  44. Arrillaga, I.; Morcillo, M.; Zanón, I.; Lario, F.; Segura, J.; Sales, E. New approaches to optimize somatic embryogenesis in maritime pine. Front. Plant Sci. 2019, 10, 1–14. [Google Scholar] [CrossRef] [Green Version]
  45. García-Mendiguren, O.; Montalbán, I.A.; Goicoa, T.; Ugarte, M.D.; Moncaleán, P. Environmental conditions at the initial stages of Pinus radiata somatic embryogenesis affect the production of somatic embryos. Trees Struct. Funct. 2016, 30, 949–958. [Google Scholar] [CrossRef]
  46. Fehér, A. Somatic embryogenesis-stress-induced remodeling of plant cell fate. Biochim. Biophys. Acta Gene Regul. Mech. 2015, 1849, 385–402. [Google Scholar] [CrossRef]
  47. Zavattieri, M.A.; Frederico, A.M.; Lima, M.; Sabino, R.; Arnholdt-Schmitt, B. Induction of somatic embryogenesis as an example of stress-related plant reactions. Electron. J. Biotechnol. 2010, 13, 1–9. [Google Scholar] [CrossRef] [Green Version]
  48. Pullman, G.S.; Buchanan, M. Loblolly pine (Pinus taeda L.): Stage-specific elemental analyses of zygotic embryo and female gametophyte tissue. Plant Sci. 2003, 164, 943–954. [Google Scholar] [CrossRef]
  49. Ramarosandratana, A.; Harvengt, L.; Bouvet, A.; Calvayrac, R.; Pâques, M. Influence of the embryonal-suspensor mass (ESM) sampling on development and proliferation of maritime pine somatic embryos. Plant Sci. 2001, 160, 473–479. [Google Scholar] [CrossRef]
  50. Filonova, L.H.; Bozhkov, P.V.; Brukhin, V.B.; Daniel, G.; Zhivotovsky, B.; von Arnold, S. Two waves of programmed cell death occur during formation and development of somatic embryos in the gymnosperm, Norway spruce. J. Cell Sci. 2000, 113, 4399–4411. [Google Scholar]
  51. Abrahamsson, M.; Valladares, S.; Merino, I.; Larsson, E.; von Arnold, S. Degeneration pattern in somatic embryos of Pinus sylvestris L. In Vitr. Cell. Dev. Biol. Plant 2017, 53, 86–96. [Google Scholar] [CrossRef] [Green Version]
  52. Morel, A.; Teyssier, C.; Trontin, J.F.; Eliášová, K.; Pešek, B.; Beaufour, M.; Morabito, D.; Boizot, N.; Le Metté, C.; Belal-Bessai, L.; et al. Early molecular events involved in Pinus pinaster Ait. somatic embryo development under reduced water availability: Transcriptomic and proteomic analyses. Physiol. Plant 2014, 152, 184–201. [Google Scholar] [CrossRef] [Green Version]
  53. Borji, M.; Bouamama-Gzara, B.; Chibani, F.; Teyssier, C.; Ammar, A.B.; Mliki, A.; Zekri, S.; Ghorbel, A. Micromorphology, structural and ultrastructural changes during somatic embryogenesis of a Tunisian oat variety (Avena sativa L. var ‘Meliane’). Plant Cell Tissue Organ. Cult. 2018, 132, 329–342. [Google Scholar] [CrossRef]
  54. de Araújo Silva-Cardoso, I.M.; Meira, F.S.; Gomes, A.C.M.M.; Scherwinski-Pereira, J.E. Histology, histochemistry and ultrastructure of pre-embryogenic cells determined for direct somatic embryogenesis in the palm tree Syagrus oleracea. Physiol. Plant 2020, 168, 845–875. [Google Scholar] [CrossRef]
  55. Joy IV, R.W.; Yeung, E.C.; Kong, L.; Thorpe, T.A. Development of white spruce somatic embryos: I. storage product deposition. In Vitro Cell. Dev. Biol. Plant 1991, 27, 32–41. [Google Scholar] [CrossRef]
  56. Steiner, N.; Farias-Soares, F.L.; Schmidt, É.C.; Pereira, M.L.T.; Scheid, B.; Rogge-Renner, G.D.; Bouzon, Z.L.; Schmidt, D.; Maldonado, S.; Guerra, M.P. Toward establishing a morphological and ultrastructural characterization of proembryogenic masses and early somatic embryos of Araucaria angustifolia (Bert.) O. Kuntze. Protoplasma 2016, 253, 487–501. [Google Scholar] [CrossRef]
  57. Falahi, H.; Sharifi, M.; Maivan, H.Z.; Chashmi, N.A. Phenylethanoid glycosides accumulation in roots of Scrophularia striata as a response to water stress. Environ. Exp. Bot. 2018, 147, 13–21. [Google Scholar] [CrossRef]
  58. Reis, E.; Batista, M.T.; Canhoto, J.M. Effect and analysis of phenolic compounds during somatic embryogenesis induction in Feijoa sellowiana Berg. Protoplasma 2008, 232, 193–202. [Google Scholar] [CrossRef] [PubMed] [Green Version]
  59. Havlová, M.; Dobrev, P.I.; Motyka, V.; Štorchová, H.; Libus, J.; Dobrá, J.; Malbeck, J.; Gaudinová, A.; Vanková, R. The role of cytokinins in responses to water deficit in tobacco plants over-expressing trans-zeatin O-glucosyltransferase gene under 35S or SAG12 promoters. Plant Cell Environ. 2008, 31, 341–353. [Google Scholar] [CrossRef] [PubMed]
  60. Nishiyama, R.; Watanabe, Y.; Fujita, Y.; Le, D.T.; Kojima, M.; Werner, T.; Vankova, R.; Yamaguchi-Shinozaki, K.; Shinozaki, K.; Kakimoto, T.; et al. Analysis of cytokinin mutants and regulation of cytokinin metabolic genes reveals important regulatory roles of cytokinins in drought, salt and abscisic acid responses, and abscisic acid biosynthesis. Plant Cell 2011, 23, 2169–2183. [Google Scholar] [CrossRef] [PubMed] [Green Version]
  61. Liu, C.J.; Zhao, Y.; Zhang, K. Cytokinin transporters: Multisite players in cytokinin homeostasis and signal distribution. Front. Plant Sci. 2019, 10, 1–9. [Google Scholar] [CrossRef]
  62. Escandón, M.; Cañal, M.J.; Pascual, J.; Pinto, G.; Correia, B.; Amaral, J.; Meijón, M. Integrated physiological and hormonal profile of heat-induced thermotolerance in Pinus radiata. Tree Physiol. 2015, 36, 63–77. [Google Scholar] [CrossRef]
  63. Castander-Olarieta, A.; Moncaleán, P.; Pereira, C.; Pěnčík, A.; Petřík, I.; Pavlović, I.; Novák, O.; Strnad, M.; Goicoa, T.; Ugarte, M.D.; et al. Cytokinins are involved in drought tolerance of Pinus radiata plants originating from embryonal masses induced at high temperatures. Tree Physiol. 2020. (accepted). [Google Scholar] [CrossRef]
  64. Spíchal, L. Cytokinins—Recent news and views of evolutionally old molecules. Funct. Plant Biol. 2012, 39, 267–284. [Google Scholar] [CrossRef] [Green Version]
  65. Letham, D.S. Cytokinins as Phytohormones—Sites of biosynthesis, translocation, and function of translocated cytokinin. In Cytokinins: Chemistry, Activity, and Function; Mok, D.W.S., Mok, M.C., Eds.; CRC Press: New York, NY, USA, 1984; pp. 57–80. [Google Scholar] [CrossRef]
  66. Montalbán, I.A.; Novák, O.; Rolčik, J.; Strnad, M.; Moncaleán, P. Endogenous cytokinin and auxin profiles during in vitro organogenesis from vegetative buds of Pinus radiata adult trees. Physiol. Plant. 2013, 148, 214–231. [Google Scholar] [CrossRef] [PubMed]
  67. Vondrakova, Z.; Dobrev, P.I.; Pesek, B.; Fischerova, L.; Vagner, M.; Motyka, V. Profiles of endogenous phytohormones over the course of norway spruce somatic embryogenesis. Front. Plant Sci. 2018, 9, 1–13. [Google Scholar] [CrossRef]
  68. Ghafari, H.; Hassanpour, H.; Jafari, M.; Besharat, S. Physiological, biochemical and gene-expressional responses to water deficit in apple subjected to partial root-zone drying (PRD). Plant Physiol. Biochem. 2020, 148, 333–346. [Google Scholar] [CrossRef]
  69. Hamayun, M.; Hussain, A.; Khan, S.A.; Irshad, M.; Khan, A.L.; Waqas, M.; Shahzad, R.; Iqbal, A.; Ullah, N.; Rehman, G.; et al. Kinetin modulates physio-hormonal attributes and isoflavone contents of soybean grown under salinity stress. Front. Plant Sci. 2015, 6, 1–11. [Google Scholar] [CrossRef] [Green Version]
  70. Liu, W.; Xu, J.; Fu, W.; Wang, X.; Lei, C.; Chen, Y. Evidence of stress imprinting with population-level differences in two moss species. Ecol. Evol. 2019, 9, 6329–6341. [Google Scholar] [CrossRef]
  71. Kumari, A.; Baskaran, P.; Plačková, L.; Omámiková, H.; Nisler, J.; Doležal, K.; Van Staden, J. Plant growth regulator interactions in physiological processes for controlling plant regeneration and in vitro development of Tulbaghia simmleri. J. Plant Physiol. 2018, 223, 65–71. [Google Scholar] [CrossRef]
  72. Baroja-Fernández, E.; Aguirreolea, J.; Martínková, H.; Hanuš, J.; Strnad, M. Aromatic cytokinins in micropropagated potato plants. Plant Physiol. Biochem. 2002, 40, 217–224. [Google Scholar] [CrossRef]
  73. Cuesta, C.; Novák, O.; Ordás, R.J.; Fernández, B.; Strnad, M.; Doležal, K.; Rodríguez, A. Endogenous cytokinin profiles and their relationships to between-family differences during adventitious caulogenesis in Pinus pinea cotyledons. J. Plant Physiol. 2012, 169, 1830–1837. [Google Scholar] [CrossRef]
  74. Hu, B.; Sakakibara, H.; Takebayashi, Y.; Peters, F.S.; Schumacher, J.; Eiblmeier, M.; Arab, L.; Kreuzwieser, J.; Polle, A.; Rennenberg, H. Mistletoe infestation mediates alteration of the phytohormone profile and anti-oxidative metabolism in bark and wood of its host Pinus sylvestris. Tree Physiol. 2017, 37, 676–691. [Google Scholar] [CrossRef]
  75. Frugis, G.; Giannino, D.; Mele, G.; Nicolodi, C.; Chiappetta, A.; Bitonti, M.B.; Innocenti, A.M.; Dewitte, W.; Van Onckelen, H.; Mariotti, D. Overexpression of KNAT1 in lettuce shifts leaf determinate growth to a shoot-like indeterminate growth associated with an accumulation of isopentenyl-type cytokinins. Plant Physiol. 2001, 126, 1370–1380. [Google Scholar] [CrossRef] [Green Version]
  76. Awada, R.; Campa, C.; Gibault, E.; Déchamp, E.; Georget, F.; Lepelley, M.; Abdallah, C.; Erban, A.; Martinez-Seidel, F.; Kopka, J.; et al. Unravelling the metabolic and hormonal machinery during key steps of somatic embryogenesis: A case study in coffee. Int. J. Mol. Sci. 2019, 20, 4665. [Google Scholar] [CrossRef] [Green Version]
  77. Alvarez, J.M.; Bueno, N.; Cuesta, C.; Feito, I.; Ordás, R.J. Hormonal and gene dynamics in de novo shoot meristem formation during adventitious caulogenesis in cotyledons of Pinus pinea. Plant Cell Rep. 2020, 39, 527–541. [Google Scholar] [CrossRef] [PubMed] [Green Version]
  78. de Freitas, H.P.F.; do Nascimento, L.V.; Puttkammer, C.C.; dos Santos, H.P.; de Andrade, J.G.; Guerra, M.P. Glutathione and abscisic acid supplementation influences somatic embryo maturation and hormone endogenous levels during somatic embryogenesis in Podocarpus lambertii Klotzsch ex Endl. Plant Sci. 2016, 253, 98–106. [Google Scholar] [CrossRef] [Green Version]
  79. Sáenz, L.; Jones, L.H.; Oropeza, C.; Vláčil, D.; Strnad, M. Endogenous isoprenoid and aromatic cytokinins in different plant parts of Cocos nucifera (L.). Plant Growth Regul. 2003, 39, 205–215. [Google Scholar] [CrossRef]
Figure 1. Somatic embryo showing how the measurements were performed: (A) Length, (B) width, and (C) the ratio between (A) and (B).
Forests 11 00807 g001
Figure 2. Plant material at different stages of the embryogenic process. (a) Embryonal mass initiation; (b) proliferating embryonal masses; (c) developing plantlets on germination medium.
Forests 11 00807 g002
Figure 3. Light microscopy of embryogenic cultures from P. halepensis (a) proembryogenic masses (PEM) I with four embryogenic cells (ECs) linked to one suspensor cell (SCs), surrounded by some detached tube-like cells (TLCs); (b) PEM II, showing a defined polarization with one pole formed by several ECs, linked to TLCs. Scattered vacuolated cells (SCs) can also be observed; (c) cluster of embryogenic cells without clear polarization, with the presence of starch grains (arrow); (d) detail of starch grains (arrow) that could be detected on samples from all induction treatments; (e) PEM clusters induced at 60 °C for 5 min, without defined polarization, containing phenolic compounds (arrow).
Forests 11 00807 g003
Figure 4. TEM analysis of embryogenic cultures. (a) Densely cytoplasmatic EC from control treatment (23 °C), with a large central nucleus (N) and a prominent nucleolus (Nu), cytoplasmatic provacuoles (PV) and starch grains (S) inside amyloplasts; (b) Detail of the cytoplasm of an embryogenic cell showing a Golgi apparatus (G); (c) EC from 50 °C treatment where some mitochondria (M) and vacuoles containing phenolic compounds (PCs) can be seen; (d) Detail of PCs (arrow) inside a vacuole; (e) EC from cultures at 23 °C with high amount of lipid bodies (LB); (f) TLC from 40 °C treatment with the presence of S and PCs; (g) TLC from 60 °C treatment showing a large vacuole (V) and the regression of the cytoplasm where organelles are scarce and presents smaller provacuoles (PV); (h) detail of the degenerating cytoplasm pressed between the cell membrane and the tonoplast (i) Section of two SCs with a large central V and few degenerated organelles in a thin layer of cytoplasm (arrow).
Forests 11 00807 g004
Figure 5. Effect of different temperatures (23 °C, 9 weeks; 40 °C, 4 h; 50 °C, 30 min; 60 °C, 5 min) at endogenous concentration (pmol g−1 FW ± SE) of isoprenoids CKs (a) Total CKs; (b) CK ribosides; (c) CK bases; (d) CK nucleotides.
Forests 11 00807 g005
Figure 6. Effect of different temperatures (23 °C, 9 weeks; 40 °C, 4 h; 50 °C, 30 min; 60 °C, 5 min) on the endogenous concentration (pmol g−1 FW± SE) of (a) total cZ types; (b) total tZ types; (c) total DHZ types; (d) total iP types cytokinins.
Forests 11 00807 g006
Figure 7. Effect of different temperatures (23 °C, 9 weeks; 40 °C, 4 h; 50 °C, 30 min; 60 °C, 5 min) at endogenous concentration (pmol g−1 FW± SE) of (a) cZ; (b) iP; (c) tZ; (d) DHZRMP; (e) cZRMP; (f) tZRMP; (g) DHZR.
Forests 11 00807 g007
Figure 8. Effect of different temperatures (23 °C, 9 weeks; 40 °C, 4 h; 50 °C, 30 min; 60 °C, 5 min) at the ratios between endogenous concentrations (pmol g−1 FW± SE) of (a) CK bases and CK nucleotides; (b) DHZ and cZ types; (c) [bases + ribosides] and nucleotides; (d) cZ and tZ types.
Forests 11 00807 g008
Figure 9. Effect of different temperatures (23 °C, 9 weeks; 40 °C, 4 h; 50 °C, 30 min; 60 °C, 5 min) at endogenous concentration (pmol g−1 FW± SE) of (a) total BA types; (b) BA; (c) total K types; (d) Kn; (e) K9G; (f) oT.
Forests 11 00807 g009
Table 1. One-way analysis of variance for initiation, proliferation, number of somatic embryos (SES) produced per gram of embryonal mass, and germination of Pinus halepensis megagametophytes induced under different temperature treatments (23 °C, 9 weeks; 40 °C, 4 h; 50 °C, 30 min; 60 °C, 5 min).
Temperature (T)
ANOVAdfF Valuep Value
Initiation30.1301n.s.1
Kruskal–WallisdfX2 testp value
Proliferation32.742n.s.
N° of SES g−1 EM327.9< 0.0001
Germination35.862n.s.
1 not statistically significant.
Table 2. Embryonal mass initiation, proliferation and germination (%) as well as the number of SES produced per gram of embryogenic mass in P. halepensis megagametophytes cultured at different temperature treatments.
Treatment%Initiation%ProliferationSES g−1 EM%Germination
23 °C (9 weeks)51.80 ± 6.1 a76.00 ± 7.0 a176.2 ± 18.0 ab66.58 ± 4.4 a
40 °C (4 h)56.25 ± 5.3 a79.17 ± 5.0 a141.1 ± 18.8 b63.77 ± 4.0 a
50 °C (30 min)56.06 ± 5.7 a71.07 ± 7.1 a135.2 ± 21.47 b76.20 ± 3.7 a
60 °C (5 min)54.09 ± 6.3 a62.79 ± 8.2 a317.4 ± 35.91 a73.29 ± 3.1 a
Data are presented as mean values ± SE. Significant differences at p < 0.05 are indicated by different letters.
Table 3. One-way analysis of variance for length, width, and ratio between length and width of SES produced from P. halepensis megagametophytes induced under different temperature treatments (23 °C, 9 weeks; 40 °C, 4 h; 50 °C, 30 min; 60 °C, 5 min).
Temperature (T)
Kruskal–WallisDfX2 Testp Value
SES length354.03< 0.0001
SES width36.413n.s. 1
SES length / width316.450.0009
1 not statistically significant.
Table 4. Length, width, and ratio between length and width of SES (mm) produced from P. halepensis megagametophytes induced under different temperature treatments.
TreatmentLengthWidthLength/Width
23 °C (9 weeks)2.46 ± 0.05 a0.83 ± 0.02 a2.97 ± 0.11 ab
40 °C (4 h)2.15 ± 0.02 b0.77 ± 0.02 a2.86 ± 0.07 b
50 °C (30 min)2.20 ± 0.03 b0.79 ± 0.02 a2.81 ± 0.05 b
60 °C (5 min)2.58 ± 0.05 a0.82 ± 0.02 a3.17 ± 0.06 a
Data are presented as mean values ± S.E. Significant differences at p < 0.05 are indicated by different letters.
Table 5. One-way analysis of variance for concentration of endogenous isoprenoid cytokinins (pmol g−1 FW) detected in P. halepensis embryonal masses induced under different temperatures (23 °C, 9 weeks; 40 °C, 4 h; 50 °C, 30 min; 60 °C, 5 min).
Temperature (T)
ANOVADfF Valuep Value
CKs bases36.4540.0027
CKs nucleotides316.83< 0.0001
Total cZ types336.85< 0.0001
cZR32.609n.s. 1
Total tZ types314.31< 0.0001
tZ36.9530.0018
tZR30.7032n.s.
tZRMP310.330.0002
Total DHZ types37.7310.001
DHZ32.199n.s.
DHZR35.3760.0063
DHZRMP315.8< 0.0001
Total iP types33.3470.0376
iP35.450.0059
iPR32.484n.s.
iPMP32.829n.s.
Bases ribosides −130.622n.s.
Bases nucleotides −134.2830.0159
iP Z types −131.054n.s.
Kruskal–WallisDfX2 testp value
Total CKs316.150.0011
CKs ribosides38.920.0303
cZ314.870.0019
cZRMP320.40.0001
cZ tZ −1316.30.001
tZ DHZ −130.1n.s.
DHZ cZ −1317.910.0005
(bases + ribosides)nucleotides −1310.020.0184
1 not statistically significant.
Table 6. Concentration of endogenous isoprenoid cytokinins (pmol g−1 FW) of P. halepensis embryogenic masses collected at the end of initiation phase and induced under different temperatures.
Treatment23 °C (9 Weeks)40 °C (4 h)50 °C (30 min)60 °C (5 min)
cZR0.02 ± 0.00 a0.01 ± 0.00 a0.02 ± 0.00 a0.01 ± 0.00 a
tZR0.02 ± 0.01 a0.03 ± 0.01 a0.03 ± 0.00 a0.03 ± 0.02 a
DHZ0.11 ± 0.01 a0.12 ± 0.01 a0.18 ± 0.01 a0.12 ± 0.04 a
iPR0.01 ± 0.00 a0.01 ± 0.00 a0.02 ± 0.00 a0.02 ± 0.00 a
iPRMP0.20 ± 0.03 a0.17 ± 0.02 a0.31 ± 0.03 a0.21 ± 0.04 a
bases ribosides-12.83 ± 0.26 a2.70 ± 0.30 a3.17 ± 0.21 a2.87 ± 0.15 a
iP Z types-10.96 ± 0.09 a0.87 ± 0.17 a0.83 ± 0.08 a0.70 ± 0.08 a
tZ DHZ -11.20 ± 0.06 a1.08 ± 0.17 a1.02 ± 0.05 a2.13 ± 0.42 a
Data are presented as mean values ± SE. Significant differences at p < 0.05 are indicated by different letters.
Table 7. One-way analysis of variance for concentration of endogenous aromatic cytokinins (pmol g−1 FW) detected in P. halepensis embryonal masses induced under different temperatures (23 °C, 9 weeks; 40 °C, 4 h; 50 °C, 30 min; 60 °C, 5 min).
Temperature (T)
ANOVAdfF Valuep Value
Total BA types33.9610.0212
BA33.5310.0316
BAR32.395n.s. 1
oT30.43310.0021
Total mT types30.4012n.s.
mT30.3003n.s.
mTR30.8331n.s.
Total K types311.010.0001
Kn310.810.0001
KR32.749n.s.
Kruskal–WallisdfX2 testp value
K9G315.060.0018
1 not statistically significant.
Table 8. Concentration of endogenous aromatic cytokinins (pmol g−1 FW) of P. halepensis embryogenic masses collected at the end of initiation phase and induced under different temperatures.
Treatment23 °C (9 Weeks)40 °C (4 h)50 °C (30 min)60 °C (5 min)
BAR0.21 ± 0.03 a0.12 ± 0.01 a0.19 ± 0.02 a0.19 ± 0.02 a
Total mT types0.08 ± 0.02 a0.12 ± 0.05 a0.10 ± 0.02 a0.12 ± 0.03 a
mT0.06 ± 0.02 a0.09 ± 0.05 a0.08 ± 0.02 a0.07 ± 0.02 a
mTR0.02 ± 0.00 a0.02 ± 0.00 a0.02 ± 0.00 a0.02 ± 0.00 a
KR27.53 ± 4.19 a20.87 ± 6.68 a45.13 ± 6.91 a34.81 ± 7.15 a
Data are presented as mean values ± SE. a Significant differences at p < 0.05 are indicated by different letters.

