 Qian Zhang1
 Jie Tang2
 Roey Angel3Dong Wang4Xingyi Hu5
 Shenghua Gao1
 Lei Zhang1Yuxi Tang2Xudong Zhang1
 Roger T. Koide6
 Haishui Yang7*Qixiang Sun1*
- 1Research Institute of Forestry, Chinese Academy of Forestry, Beijing, China
- 2Hunan Academy of Forestry, Changsha, China
- 3Soil and Water Research Infrastructure and Institute of Soil Biology, Biology Centre, Czech Academy of Sciences (CAS), České Budějovice, Czechia
- 4Institute of Forest Ecology, Environment and Nature Conservation, Chinese Academy of Forestry, Beijing, China
- 5Hubei Academy of Forestry, Wuhan, China
- 6Department of Biology, Brigham Young University, Provo, UT, United States
- 7College of Agriculture, Nanjing Agricultural University, Nanjing, China
Wetlands are the largest natural source of terrestrial CH4 emissions. Afforestation can enhance soil CH4 oxidation and decrease methanogenesis, yet the driving mechanisms leading to these effects remain unclear. We analyzed the structures of communities of methanogenic and methanotrophic microbes, quantification of mcrA and pmoA genes, the soil microbial metagenome, soil properties and CH4 fluxes in afforested and non-afforested areas in the marshland of the Yangtze River. Compared to the non-afforested land use types, net CH4 emission decreased from bare land, natural vegetation and 5-year forest plantation and transitioned to net CH4 sinks in the 10- and 20-year forest plantations. Both abundances of mcrA and pmoA genes decreased significantly with increasing plantation age. By combining random forest analysis and structural equation modeling, our results provide evidence for an important role of the abundance of functional genes related to methane production in explaining the net CH4 flux in this ecosystem. The structures of methanogenic and methanotrophic microbial communities were of lower importance as explanatory factors than functional genes in terms of in situ CH4 flux. We also found a substantial interaction between functional genes and soil properties in the control of CH4 flux, particularly soil particle size. Our study provides empirical evidence that microbial community function has more explanatory power than taxonomic microbial community structure with respect to in situ CH4 fluxes. This suggests that focusing on gene abundances obtained, e.g., through metagenomics or quantitative/digital PCR could be more effective than community profiling in predicting CH4 fluxes, and such data should be considered for ecosystem modeling.
Introduction
Globally, natural wetlands are the largest source of CH4 emissions, accounting for ∼62% of the (natural) CH4 budget (Nazaries et al., 2013a). Emitted CH4 is almost exclusively microbial in origin, and its magnitude is determined by the balance between methane production and oxidation (Conrad, 1996). Previous studies showed that both methanogenic and methanotrophic microbes can be influenced by a variety of soil variables including soil C/N ratio, pH, temperature and NH4+ concentration (Kolb, 2009; Bodelier, 2011; Yuan et al., 2016; Zu et al., 2016; Wen et al., 2017). Other soil properties, such as water and clay contents and level of compaction, directly affect CH4 fluxes by physically controlling the diffusive transport of CH4 in soils (Kolb, 2009). However, few studies have analyzed the relationships among CH4 fluxes, methanogenic and methanotrophic communities, and these relevant soil properties.
The effects of land-use change on the strengths of CH4 sources and sinks and methanogenic or methanotrophic microbial communities are well documented. Afforestation is frequently examined because forest soils represent a significant sink in the global CH4 budget (Dalal and Allen, 2008). The uptake of atmospheric CH4 by the soil is often reported to increase due to afforestation, which is accompanied by a shift in the microbial community structure from type I to type II methanotrophs (Singh et al., 2007, 2009; Dörr et al., 2010). Studies have also shown that increased CH4 sink strength following afforestation is associated with increased dominance of members of the USC α clade-type-II-related methanotrophs (Nazaries et al., 2011, 2013b; Täumer et al., 2021). However, these studies did not include an analysis of the methanogenic community, which may also have been altered by afforestation and could thus affect the net flux of CH4 flux independent of the methanotrophic community. Thus, the lack of studies that include analyses of both methanogenic and methanotrophic communities strongly limits our understanding of the mechanisms by which CH4 emissions are mitigated by afforestation.
Freshwater marshlands, natural freshwater wetlands, are transitional zones bordering rivers and islands. They frequently experience seasonal flooding and are prone to erosion. In China, a heterogeneous marshland area of >900,000 ha is distributed in the middle and lower reaches of the Yangtze River. This area experiences a subtropical monsoon climate and usually has abundant seasonal rainfall. There is a rainy season (April–July) and a dry season (August–March). An ecologically fragile area, severe land loss and degradation occur due to continuing population growth, extensive land reclamation, and pollution (Jiang et al., 2015). Since the early 1980s, afforestation with poplar trees has been used to restore some of the degraded marshland along the Yangtze (Zhou et al., 2010). Our previous studies showed that poplar afforestation of marshland alters soil structure, increases soil organic matter content, and reduces CH4 emission (Zhou et al., 2010; Gao et al., 2013). However, the mechanism by which this is accomplished remains unknown. In particular, we do not know how afforestation has affected methanogenic and methanotrophic communities, nor do we know how relevant functional genes respond to poplar afforestation.
Methanogenic communities have been characterized using the 16S ribosomal RNA (rRNA) gene or using specific functional genes such as the α-subunit of the methyl-coenzyme M reductase (mcrA), which is involved in the final step of methanogenesis (Luton et al., 2002; Friedrich, 2005). Methanotrophs are usually dominated by methane-oxidizing bacteria (MOB), though anaerobic methane-oxidizing (ANME) archaea sometimes also make a small contribution to methane oxidization (Ettwig et al., 2016). For MOB, the pmoA gene, encoding the α-subunit of pMMO (the particulate form of methane monooxygenase), has a near-universal presence in both aerobic and nitrite-reducing bacterial methanotrophs and has been used as a biomarker for characterizing their communities and activities (Freitag and Prosser, 2009; Seo et al., 2013; Lee et al., 2014; Tate, 2015). Other than targeting a specific molecular biomarker, metagenomics approaches with genome shotgun sequencing open the opportunity to describe the diversity profile functional pathways governing key soil process like C, N and methane metabolism. However, metagenomics has only been used in a few studies of ecosystem restoration and succession. These include changes in functional genes between pre-agricultural tallgrass prairie and modern agricultural soils (Fierer et al., 2013), the impact of engineered soil formulations on microbial functions in restored mine sites (Kumaresan et al., 2017), and how plant-driven changes shape microbial communities during succession post agricultural abandonment (Cline and Zak, 2015). Soil microbial mediated biochemical pathways of methane production-oxidation and nitrogen metabolism were studied through metagenomics approach (Bhattacharyya et al., 2017). In this work, our goal was to expand our understanding of the changes due to afforestation in soil methane-cycling microbial communities and their function in marshland of the Yangtze River by using metagenomics together with 16S rRNA gene sequencing and quantification of specific marker genes. We used shotgun metagenomics to directly measure the changes in abundance of CH4 cycling functional genes, including methane production and methane oxidation. We hypothesized that (1) afforestation decreases the abundance of methanogens and methanogenesis functional genes but increases the abundance of methanotrophs and methane oxidation genes; (2) methane-related microbial communities, functional genes and net CH4 fluxes are influenced by changes in soil physical and chemical properties associated with afforestation; (3) methane related functional gene composition will be more powerful than taxonomic microbial community structure in explaining in situ CH4 flux.
Materials and Methods
Site Description
The field sampling was conducted in a freshwater marshland (28°59′–29°38′ N, 112°43′–113°15′ E) located in Junshan District, Hunan Province. The area of sampling is located at the west of the Yangtze River and northeast of Dongting Lake and possesses a typical subtropical humid climate, with mean annual precipitation of 1,417 mm and mean annual temperature of 16.4-17°C. It is characterized as a type of tidal soil developed from alluvial parent material, with organic matter of 2.43 g kg–1, total nitrogen of 1.26 g kg–1, available nitrogen of 112 mg kg–1 and pH of 7.9. This sampling site is annually immersed in a shallow layer of tidal water from May to August. The natural vegetation is dominated by Cynodon dactylon (L.) Pers. (Scutch grass), Viola verecunda A. Gray., Polygonum flaccidum Meisn. and Clinopodium gracile (Benth.) Kuntze, with vegetation cover of approximately 50%. In contrast, the vegetation cover is less than 1% in eroded areas of the marshland. To restore and prevent land degradation, poplar (Populus deltoides W. Bartram ex Marshall cv. ‘Lux’; Eastern cottonwood) plantations have been established in the past 30 years and were never fertilized.
Soil Sampling
Five land types were selected within a 10 km × 10 km range in the outside-embankment marshland of the Yangtze River, including bare land (BA), natural vegetation (NV), and poplar plantations planted five years ago (PP5), ten years ago (PP10) and 20 years ago (PP20). Natural vegetation refers to the vegetation that develops in a natural state without artificial management. The forest plantations had a density of 318 individuals per ha and an average tree height of 17-20 m at sampling time. The tree height is similar at the sites for plantations of 5, 10, and 20 years. The popular trees grow very fast within the first 5 years after being planted when they can grow to a height of about 17 m (personal observation). After that the height only varies with a small increase of about 2–3 m. The afforested areas of the marshlands continue to be periodically flooded from end of May to August at the same time as the non-afforested areas. The understory plant growth in the plantations had a cover of <10%, which is caused by canopy closure and by the seasonal three-month-long immersion.
For each land type, three replicate sampling sites were selected, and one 10 m × 10 m sampling plot was set up within each sampling site (Supplementary Figure 1). The soil sampling was conducted at the end of August after three months‘ flooding. Five soil cores (40 cm deep and 4 cm inner diameter) were taken from each sampling plot. One sampling point was at the center of each plot, and the other four sampling points were located near each of the four corners of the plot at distances of 3 m to the border. The five soil cores at 0–10 cm, 10–20 cm, 20–30 cm, and 30–40 cm from each plot were first mixed thoroughly, and then an equal amounts of the mixed soil samples were taken and pooled again to form a composite sample, resulting in a total of 15 samples (5 land types × 3 replicates). Sampling was carried out immediately after the three-month flooding in August 2017. Only 1 kg of the pooled soil samples were sealed in plastic bags and refrigerated, immediately transported to the laboratory and sieved to 2 mm to remove root debris and stones. Soil samples were preserved at −80°C for subsequent molecular analysis. Sub-samples from each soil sample were air-dried for physicochemical analysis.
DNA Extraction, PCR and 16S Amplicon Sequencing
Soil genomic DNA was extracted from 0.5 g fresh soil samples using the FastDNA SPIN Kit (MP Biomedicals, Santa Ana, CA, United States) following the manufacturer’s protocol. The extracted DNA was diluted to 10 ng μL–1 with the aid of a NanoDrop ND-1000 spectrophotometer (NanoDrop Technologies). The primer sets 343F/798R and A533F/A934R were used to amplify the bacterial and archaeal 16S rRNA gene, respectively (Table 1). PCR reactions contained 9 μL PCR water (Qiagen), 12.5 μL 2 × Ace Taq Master Mix (Vazyme Biotech), 0.5 μL each of the forward and reverse primers (10 μM each), with 2.0 μL (10 ng) of purified DNA from each sample as the template. Reactions were held at 95°C for 5 min to activate the polymerase, and then 28 cycles were performed at 95°C for 30 s, 55°C for 30 s, and 72°C for 30 s; and a final extension of 7 min at 72°C. Triplicate PCRs were conducted for each sample, and the three PCR products were pooled for high-throughput sequencing. After purification and quantification, 0.01 ug of PCR product from each sample was used for Illumina paired-end library preparation, cluster generation and sequenced on the Miseq Illumina PE 300 platform. Sequencing services were provided by (HanYu Laboratories, Shanghai, China). Raw sequence data are deposited in the BioProject database of the NCBI Short Read Archive under accession number PRJNA787026.
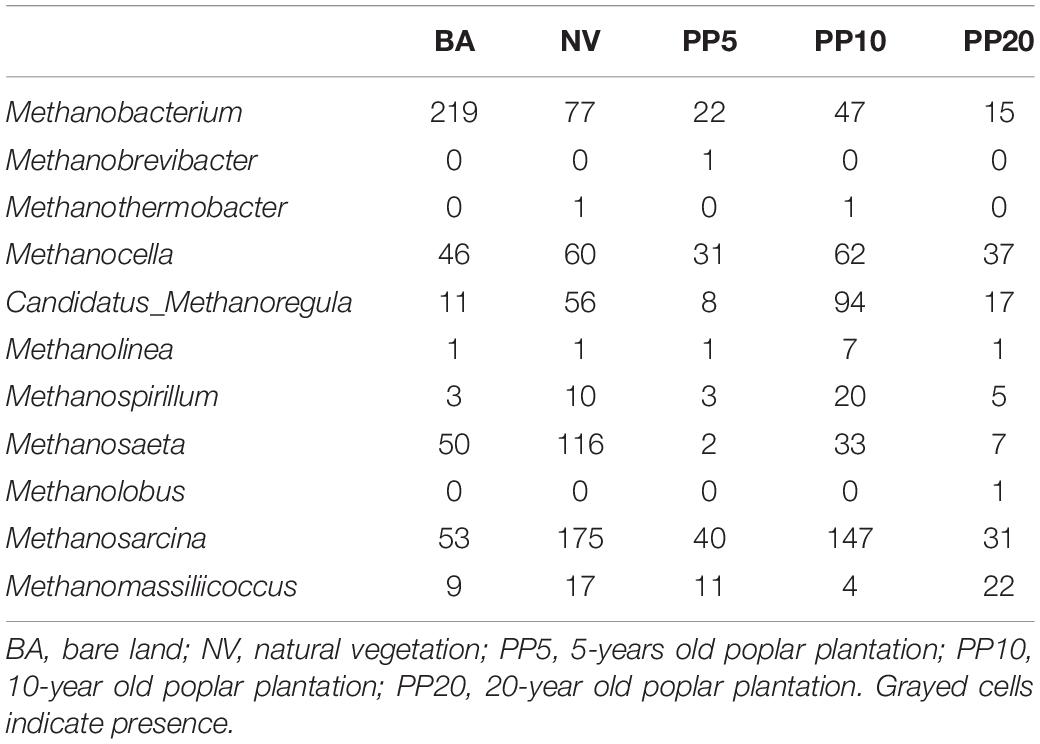
Table 1. Reads abundance of methanogenic genera across different land types from 16S amplicon sequencing. Data are mean reads abundance of samples per vegetation type (n = 3).
Bioinformatics of 16S Amplicon Data
The high throughput sequencing data were processed using QIIME 1.6.0 (Caporaso et al., 2010). The DNA reads were assigned to samples according to unique barcodes. The corresponding paired reads were merged if the overlap was 100% identical using FLASH (v 1.2.7)1. Quality filtering was done using QIIME, with the default settings for Illumina were (r = 3; p = 0.75 total read length; q = 3; n = 0) as recommended by Bokulich et al. (2013). Chimera sequences were removed with UCHIME (Version 4.2) implemented in QIIME (Edgar et al., 2011).
Operational taxonomic units (OTUs) were defined with 97% sequence similarity with Uparse2 (Edgar, 2013) after removal of putative chimera and singletons. The most abundant sequence was selected as the representative of each OTU. The taxonomy of each OTU was assigned through the RDP Classifier (version 2.2)3 (Sul et al., 2011) and trained on the Greengenes reference sequences4 (DeSantis et al., 2006). When OTUs were assigned to taxonomy, only OTUs annotated as bacteria or archaea were maintained. In addition, we also selected the methanogens and methanotrophs at the genus level for further analysis based on the taxonomic information. Two alpha diversity indices, observed species and chao1, were calculated.
Quantitative PCR
Quantifications of soil methanogens were performed by quantitative PCR (qPCR) with primer sets mlas-mod–F/-mcrA-rev-R for the mcrA gene and A189f/mb661r for the pmoA gene. Because some studies reported that the primer set A189f-mb661r for pmoA could also amplify amoA, we did primer evaluation before qPCR. No clone sequenced from clone libraries generated by A189f-mb661r was identified as amoA. This was supported by a previous study which showed that sequences generated with primer set A189f-mb661r all grouped with the gammaproteobacterial pmoA sequences in a neighbor-joining phylogenetic tree (Redmond et al., 2010). The overall bacterial and archaeal abundance were also quantified by qPCR with the primer pairs Ba519F/Ba907R and Ar364F/Ar934R, respectively (Supplementary Table 1). PCR amplifications were carried out in triplicate on a CFX Connect Real-Time PCR Detection System (Bio-Rad) in a final volume of 10 μL containing 1 μL of gDNA, 0.4 μM of each respective primer, 5 μL of 2 × SG Green qPCR Mix (SinoGene). All assays also systematically included positive and negative controls. PCR amplification for bacterial and archa archeael eal 16S rDNA genes followed the procedure described in Angel et al. (2012). For mcrA and pmoA, the PCR thermocycling was initiated at 95°C for 3 min, followed by 40 cycles of 10 s at 95°C, 20 s at 58°C, and 10 s at 72°C. Fluorescence data were collected at the end of each cycle. To assess the specificity of amplification, a melting curve analysis was performed. Standard curves were created by plotting the cycle threshold (CT) values of the qPCRs performed on dilution series of plasmid DNA (104-109 copies/μl). The gene copy number in each analyzed sample was determined by comparing to Ct values/gene copy number of the standard curve.
Metagenomic Analysis
DNA was fragmented to an average size of about 350 bp using Covaris M220 (Gene Company Limited, China) for paired-end library construction. A paired-end library was prepared using the TruSeq DNA Sample Prep Kit (Illumina, San Diego, CA, United States). Adapters containing the full complement of sequencing primer hybridization sites were ligated to the Blunt-end fragments. Paired-end sequencing was performed on Illumina HiSeq 4000 PE150 platform (Illumina Inc., San Diego, CA, United States) using HiSeq 3000/4000 PE Cluster Kit and HiSeq 3000/4000 SBS Kits according to manufacturer instructions. Raw sequence data are deposited in China National Genebank (CNGB) database under accession number CNP0002514.
Raw data were first processed by Trimmomatic 0.36 (Bolger et al., 2014) for adapter removal and moderate-quality trimming to obtain clean data for subsequent data analysis. Sequences containing N base and adapters or a low-quality value (Q value less than 20) were removed. De bruijn-graph-based assembler Megahit (v1.0.6) (Li et al., 2015) was employed to assemble short reads, with mapped ratio between 19.7 and 40.1% across all the samples. Open reading frames (ORFs) from each metagenomic sample were predicted using Prodigal (v2.60) (Hyatt et al., 2012). The predicted ORFs with lengths over 100 bp were retrieved and translated to amino acid sequences using the NCBI translation table.5 All sequences from gene sets with a 95% sequence identity (90% coverage) were clustered as the non-redundant gene catalog by the CD-HIT.6 Non-redundant sequences were mapped with Bowtie 1.1.2, and sam2counts 0.91 was used to convert mapping results to reference sequence counts, generating the gene table which could be used for functional annotation. Kyoto Encyclopedia for Genes and Genomes (KEGG)7 was used to analyze the functional aspects (Kanehisa and Goto, 2000). KOBAS 2.0 software was used for KEGG functional orthologs (KOs) annotation based on the non-redundant gene (Xie et al., 2011). Subsequently, all contig data were mapped against the KEGG pathway (Meyer et al., 2008) to identify tentative metabolic pathways for a specific function. To avoid the sequencing depth bias in comparative analysis, the total sequencing number was normalized to one million reads per sample. Genes relating to methanogenesis and methane oxidation were of particular interest and were selected for more detailed analysis. The pathway, ‘ko00680: Methane metabolism’, was considered as the core pathway related to methane production and consumption. The abundance of metagenomic reads assigned to a particular gene is used as a proxy for gene abundance in a sample.
CH4 Flux Measurement
Data of methane flux was collected with a static dark chamber-FMA (fast methane analyzer) approach (Gao et al., 2013). The chamber was composed of three parts: a stainless steel base (60 cm × 60 cm × 12 cm), a joint chamber (60 cm × 60 cm × 120 cm) and a covering chamber (60 cm × 60 cm × 40 cm). The joint and covering chambers were made of tranparent plexiglass inert to CH4. The base was inserted into the soil at a depth of 10 cm. The covering chamber was equiped with two fans (diamer: 12 cm) to ensure that gas was mixed completely. The dark chamber was made through wrapping a layer of insulation with aluminum foil to minimize the internal temperature changes. The temperature in soils and chambers were measured with a digital thermometer. Gas samples (1.2 L) were collected at 2, 12, and 22 min after the covering chamber being capped, and stored in air-sampling bags (2 L) made of aluminum composite membrane. Gas sample collection was carried out with an interval of 6 h between the two adjacent collections. CH4 flux was then measure with LGR Fast Methane Analyzer (FMA) (Los Gatos Research, Ltd., San Joes, CA, United States). The CH4 flux was calculated as follows:
Here, F refers to the CH4 flux (ug m–2 h–1). dc/dt is the rate of CH4 accumulated in the chamber (PPBV CH4–C h–1). P is the atmospheric pressure (Pa) at the sampling sites. P0 is the standard atmospheric pressure (Pa). T is the air temperature (K) in the chamber at gas sampling. T0 is the air temperature (K) at the standard conditions. M is the molecular weight of CH4. H is the total height (cm) of chambers, including the joint and covering chambers.
Soil Properties
Soil samples were assayed for particle composition, organic matter, total nitrogen, available nitrogen, total phosphorus, extractable phosphorus, total potassium, available potassium, pH and cation exchange capacity (CEC). Soil particle composition was determined using Mastersizer 2000 (Malvern Panalytical, United Kingdom). Organic matter was determined by the standard Walkley-Black potassium dichromate oxidation method (Nelson and Sommers, 1982). Total N concentrations were measured by the Kjeldahl procedure (2200 Kjeldahl Auto Distillation) and available N (AN) by the alkaline hydrolysis diffusion method (Lu, 1999). Total P and extractable P concentrations were measured by spectrophotometry (UV-1600 spectrophotometer, Beijing) (Lu, 1999). Total K and available K (AK) were determined by flame photometry (Lu, 1999). Soil CEC was measured by the ammonium acetate method at pH 7.0 (Lu, 1999). The value of soil pH was determined in 1:1 soil:water slurries with an acidometer (HANNA, Padua, Italy). Soil dry matter was determined by drying samples at 105 ± 2°C until it reached a constant mass as laid out in the Soil Quality ISO Section 3.1 (ISO 11465, 1993).
Oxygen (O2) concentrations were measured by gently pushing a Clark type glass microelectrode (500 μm tip, Unisense A/S Aarhus N, Denmark) into the soil at 20 cm depth. The microelectrode was positioned by micromanipulator, and the sensor current was measured with a picoammeter (PA2000, Unisense A/S). The microelectrode was calibrated with both air-saturated and oxygen-free N2-saturated water at the same temperature as the soil.
Random Forest Analysis
To explore the role of soil properties, abundances of methanogens and methanotrophs, and vital functional genes in driving CH4 fluxes, we used a regression Random Forest (RF) analysis (Breiman, 2001) to identify the main predictors of CH4 flux. In our RF analyses, the soil particle composition, relative abundance of methanogens and methanotrophs at the genus level, quantification of mcrA and pmoA genes, and abundances of key functional genes revealed with metagenomics were included as predictors of CH4 flux. The relative abundance of methanogens and methanotrophs were calculated as follows: first, we selected the genera belonging to the known methanogens and methanotrophs; then using the abundance of these genera to calculate the relative abundance of methanogens with the total abundance of archaeal 16S high-throughput sequencing reads, as well as for methanotrophs with bacterial 16S. The response variable was the mean values of the four measurements of CH4 flux. These analyses were conducted using the RF package (Liaw and Wiener, 2002) for R. The significance of the model and the cross-validated R2 were assessed with 5,000 permutations of the response variable, using the A3 (Fortmann-Roe, 2015) R package. Similarly, the significance of the importance measures of each predictor on the response variable (enzymatic activities) was assessed by using the rfPermute8 package for R.
Structural Equation Model
To identify drivers of CH4 flux, structural equation models (SEM) using Mantel R values as inputs were constructed in AMOS 20.0 (Arbuckle, 2011). We included variables identified to be important predictors in RF analysis to explore direct effects and their interactive effect of these variables. A maximum likelihood estimation method was used to compare the SEM models with observations. The goodness of fit was determined with the criterion of RMSEA (root mean squared error of approximation) < 0.05 and TLI (Tucker-Lewis Index) > 0.95 as suggested by Hu and Bentler (1999).
Statistical Analysis
Anaerobic archaeal methanogens and aerobic bacterial methanotrophs were identified based on the taxonomic information at the genus level with high-throughput 16S amplicon sequencing (see the review of Nazaries et al., 2013a). Non-metric multidimensional scaling (NMDS) analysis was performed based on the relative abundance of each genus to illustrate differences in the structure of the methanogenic and methanotrophic communities among land types. Statistically significant difference was determined with the analysis of similarity (ANOSIM) for methanogenic or methanotrophic communities among different land types (Vegan package in R, Oksanen et al., 2013). Non-parametric Kruskal-Wallis test was performed to test the difference of each genus among land types (Agricolae package in R, de Mendiburu, 2012).
Results
Community Structure of Methanogens and Methanotrophs
High throughput sequencing with primer set A533F/A934R obtained 166,465 sequences after quality filtering. Taxonomy classification identified a total of 96,178 archaeal sequences (5,371 - 7,827 sequences per sample) after deleting singletons. The data set was rarefied to 5,371 sequences per sample, and a total of 1810 OTUs existed in this rarefied OTU table. Then, 124 OTUs (18-867 sequences per samples) from 11 archaeal genera were identified as methanogen (Table 1). The alpha diversity indexes observed species was from 33 to 60 and chao1 from 40 to 84 across vegetation types, but both were not significant different across samples (p > 0.05; Supplementary Figure 2A). The methanogenic communities varied significantly across land types, confirmed by ANOSIM (r = 0.78, p < 0.001) and PERMANOVA (R2= 0.22, p < 0.001) (Figure 1A).
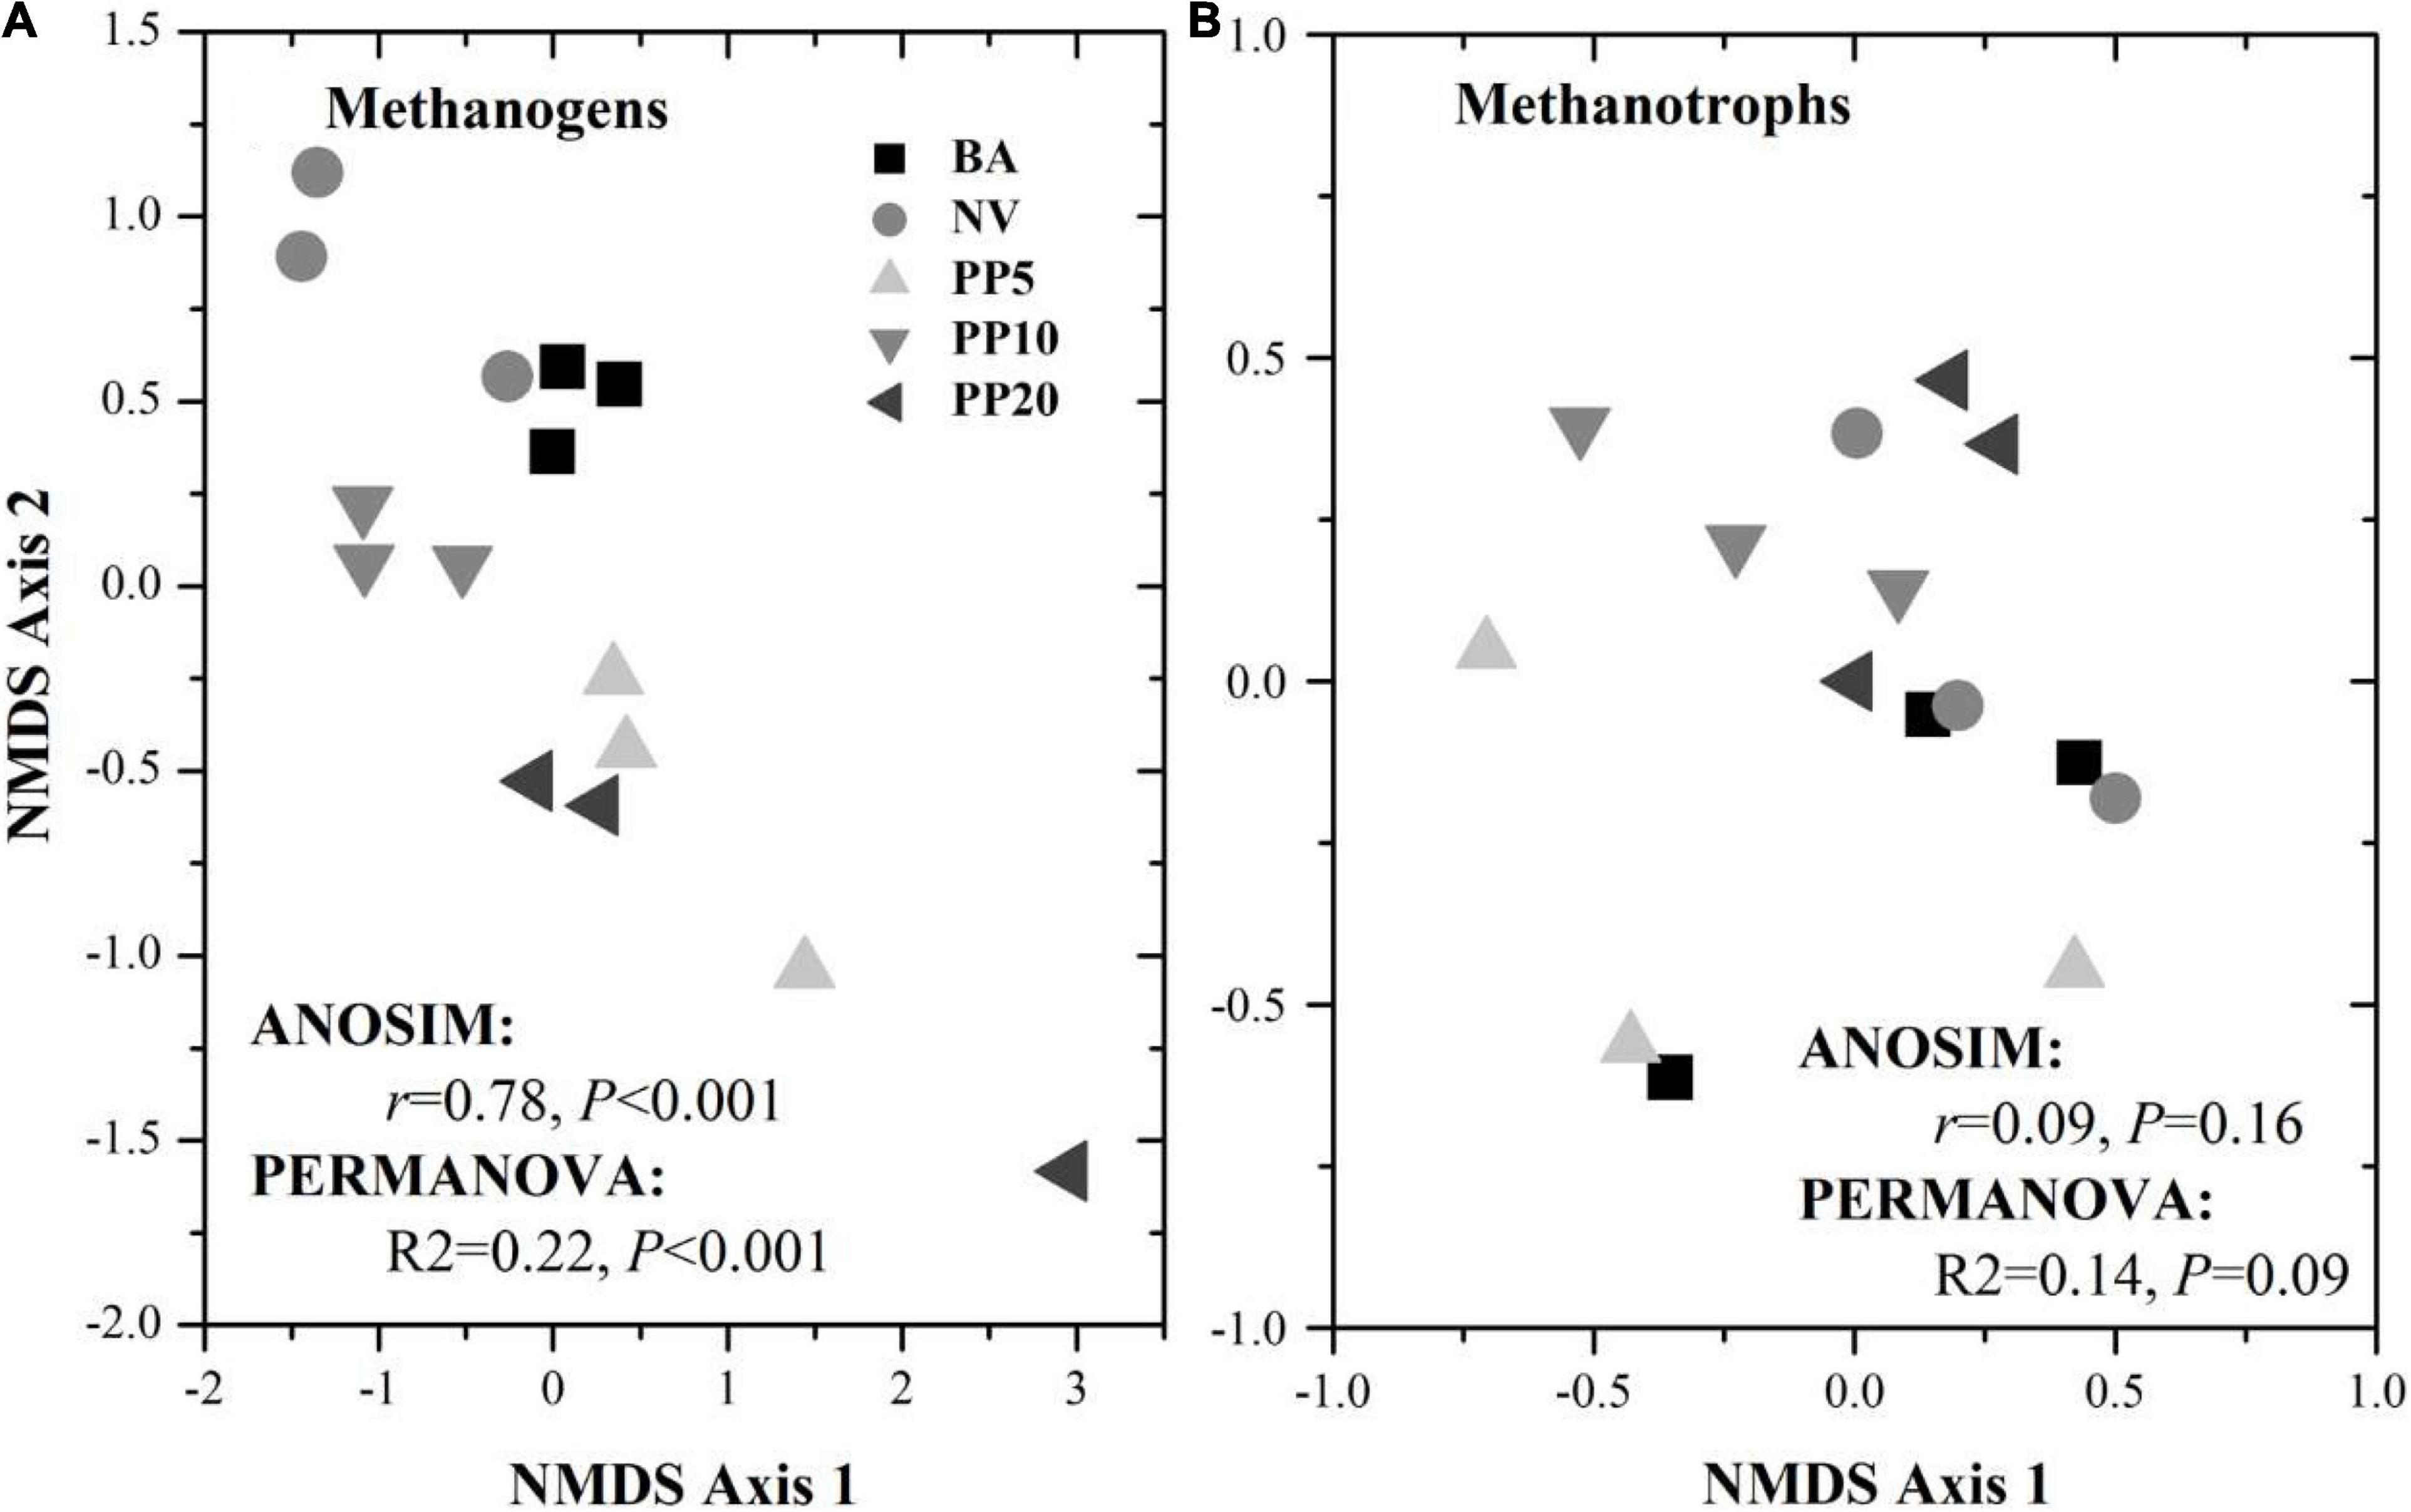
Figure 1. NMDS ordination for methanogenic (A) and methanotrophic (B) communities based on corresponding 16S rDNA sequences across different vegetation types. BA, bare land; NV, natural vegetation; PP5, 5-years old poplar plantation; PP10, the 10-year old poplar plantation; PP20, the 20-year old poplar plantation.
High throughput sequencing with primer set 343F/798R obtained 165,377 sequences after quality filtering. Taxonomy classification identified a total of 142,026 bacterial sequences (8,408 - 10,360 sequences per sample) after deleting singletons. The data set was rarefied to 8,408 sequences per sample, and a total of 9,770 OTUs existed in this rarefied OTU table. Then, 36 OTUs (0-46 sequences per samples) from 6 bacterial genera were identified as methanotrophic (Table 2). The alpha diversity indexes observed species was from 5 to 9 and chao1 from 9 to 11 across vegetation types, but both were not significant different across all samples (p > 0.05; Supplementary Figure 2B). The methanotrophic communities showed a homogeneous spread across land types (ANOSIM: r = 0.09, p = 0.16; PERMANOVA: R2= 0.14, p = 0.09; Figure 1B). Methanotrophs are divided into type-I (gammaproteobacteria) and type-II (alphaproteobacteria), and we found that most of the OTUs belonged to type-I methanotrophs, including Crenothrix, Methylobacter, Methylomicrobium, Methylomonas and Methylosarcina.
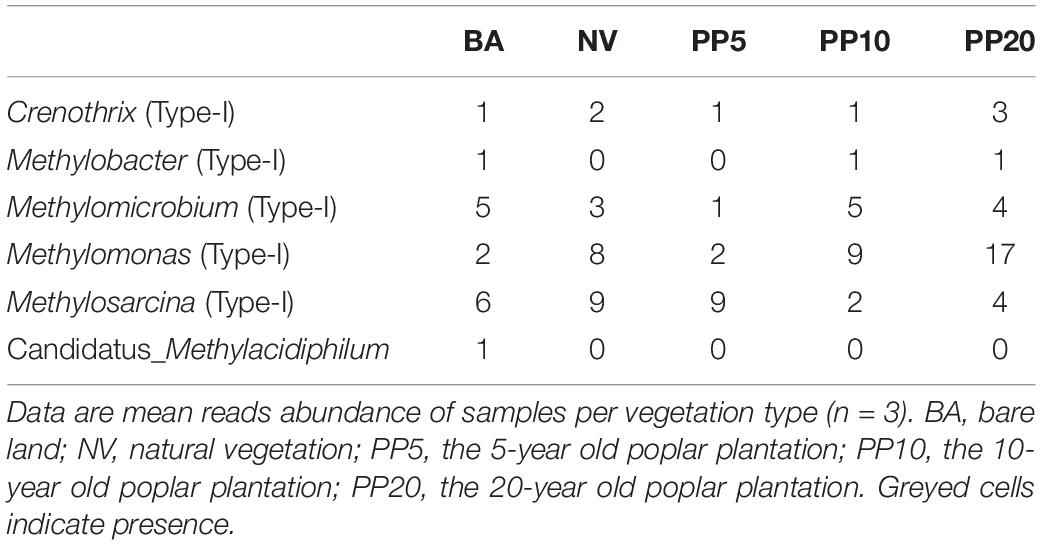
Table 2. Reads abundance of methanotrophic genera across different land types from 16S amplicon sequencing.
Abundance of mcrA and pmoA Genes
Archaeal and bacterial 16S rDNA abundances did not show significant differences across land types (P > 0.05), with archaeal abundance at ∼108 copies g–1 dry soil (Figure 2A) and bacterial abundance at ∼1010 copies g–1 dry soil (Figure 2B) across all the land types.
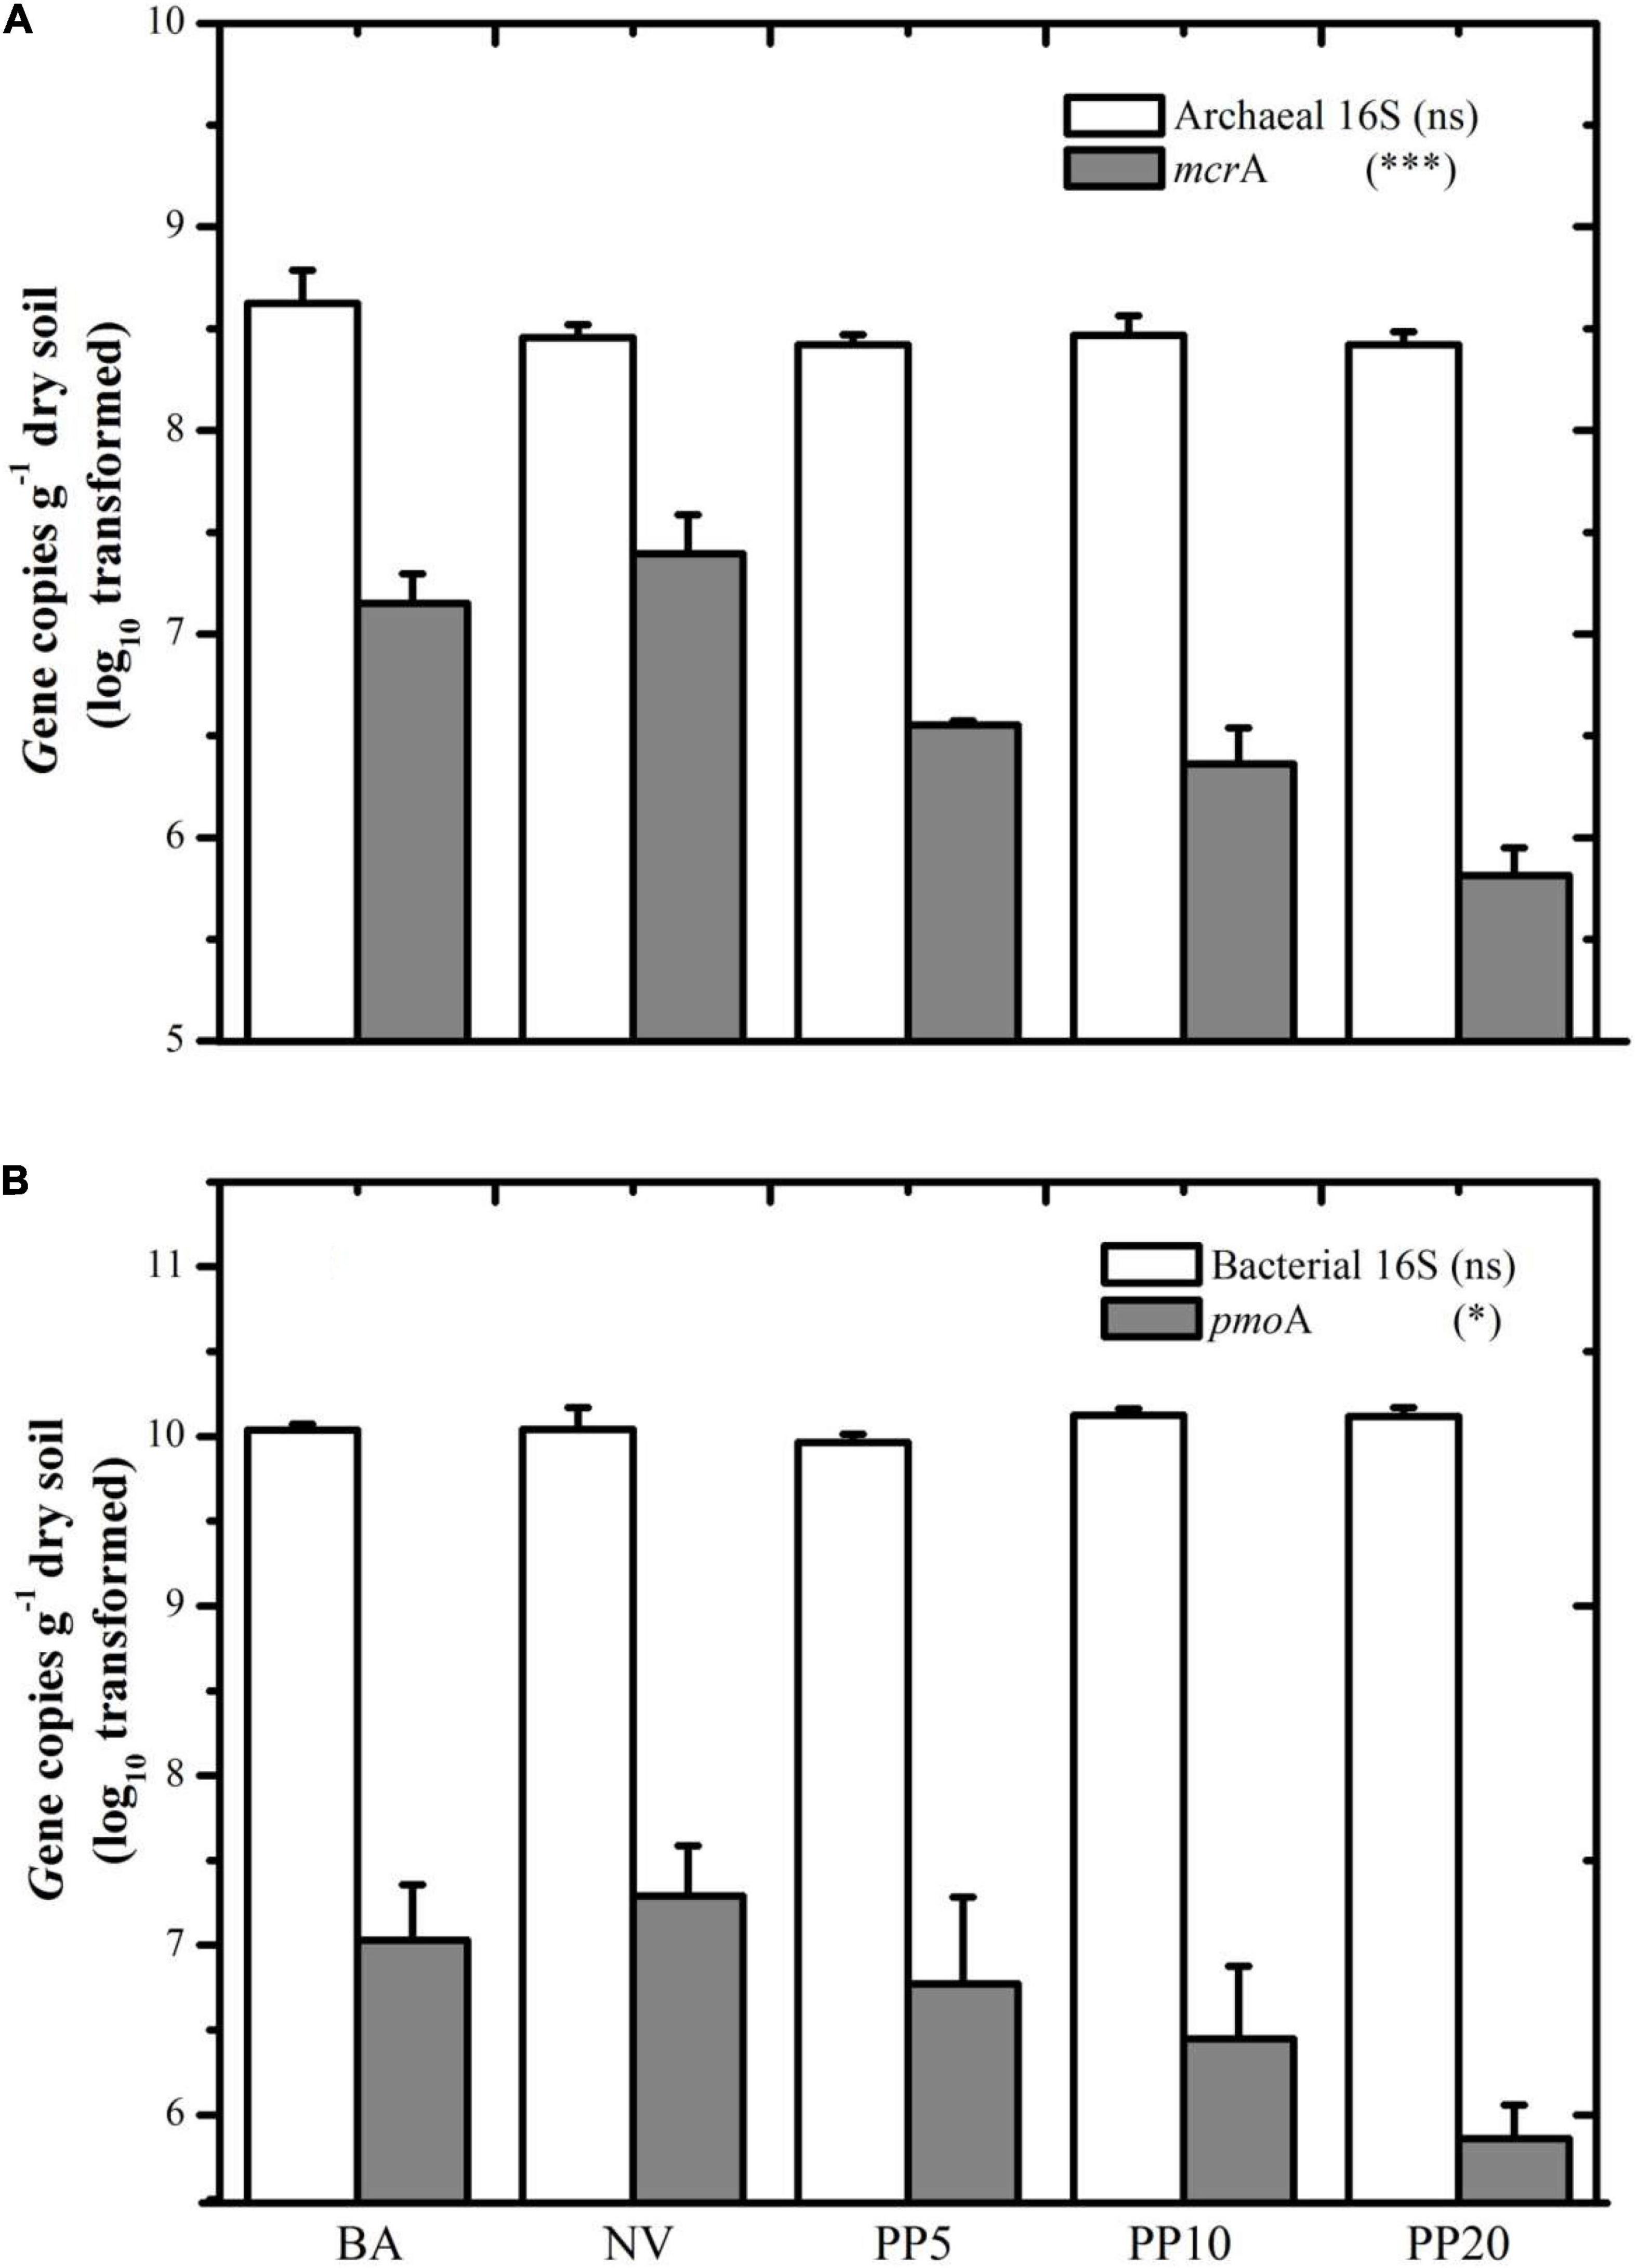
Figure 2. (A) Gene copy number of archaeal 16S and mcrA among different land types. (B) Gene copy number of Bacterial 16S and pmoA among different land types. BA: bare land; NV: natural vegetation; PP5: 5-years old poplar plantation; PP10: 10-years old poplar plantation; PP20: 20-years old poplar plantation. *p < 0.05; ***p < 0.001; ns: p > 0.05.
Both mcrA and pmoA genes were present in all five land types (Figure 2). The mcrA gene copy number was lower in soils of PP5 (3.5 × 10⁶ copies/g dry soil), PP10 (2.3 × 10⁶ copies/g dry soil) and PP20 (6.4 × 10⁵ copies/g dry soil) than BA (1.4 × 10⁷copies/g dry soil) and NV (2.4 × 10⁷copies/g dry soil) (p < 0.001). Quantification of the pmoA gene showed a similar pattern to the mcrA gene, with lower copies in PP5, PP10, and PP20 (lower than 107 copies/g dry soil) when compared to both un-afforested types (higher than 107 copies/g dry soil) (p < 0.05).
Deciphering Methane Metabolism With Metagenomics
A total of 526,742,669 reads (16,618,761 - 58,023,740 reads per sample) were achieved after quality filtering in the meta-genomic analysis. Read abundance of the ko00680 pathway showed significant differences across the five land types (P < 0.05; Figure 3) after normalization to one million reads per sample. NV obtained the highest read number. Reads abundance of the pathway in the PP10 and PP20 were significantly lower than those in both non-afforested BA and NV land types.
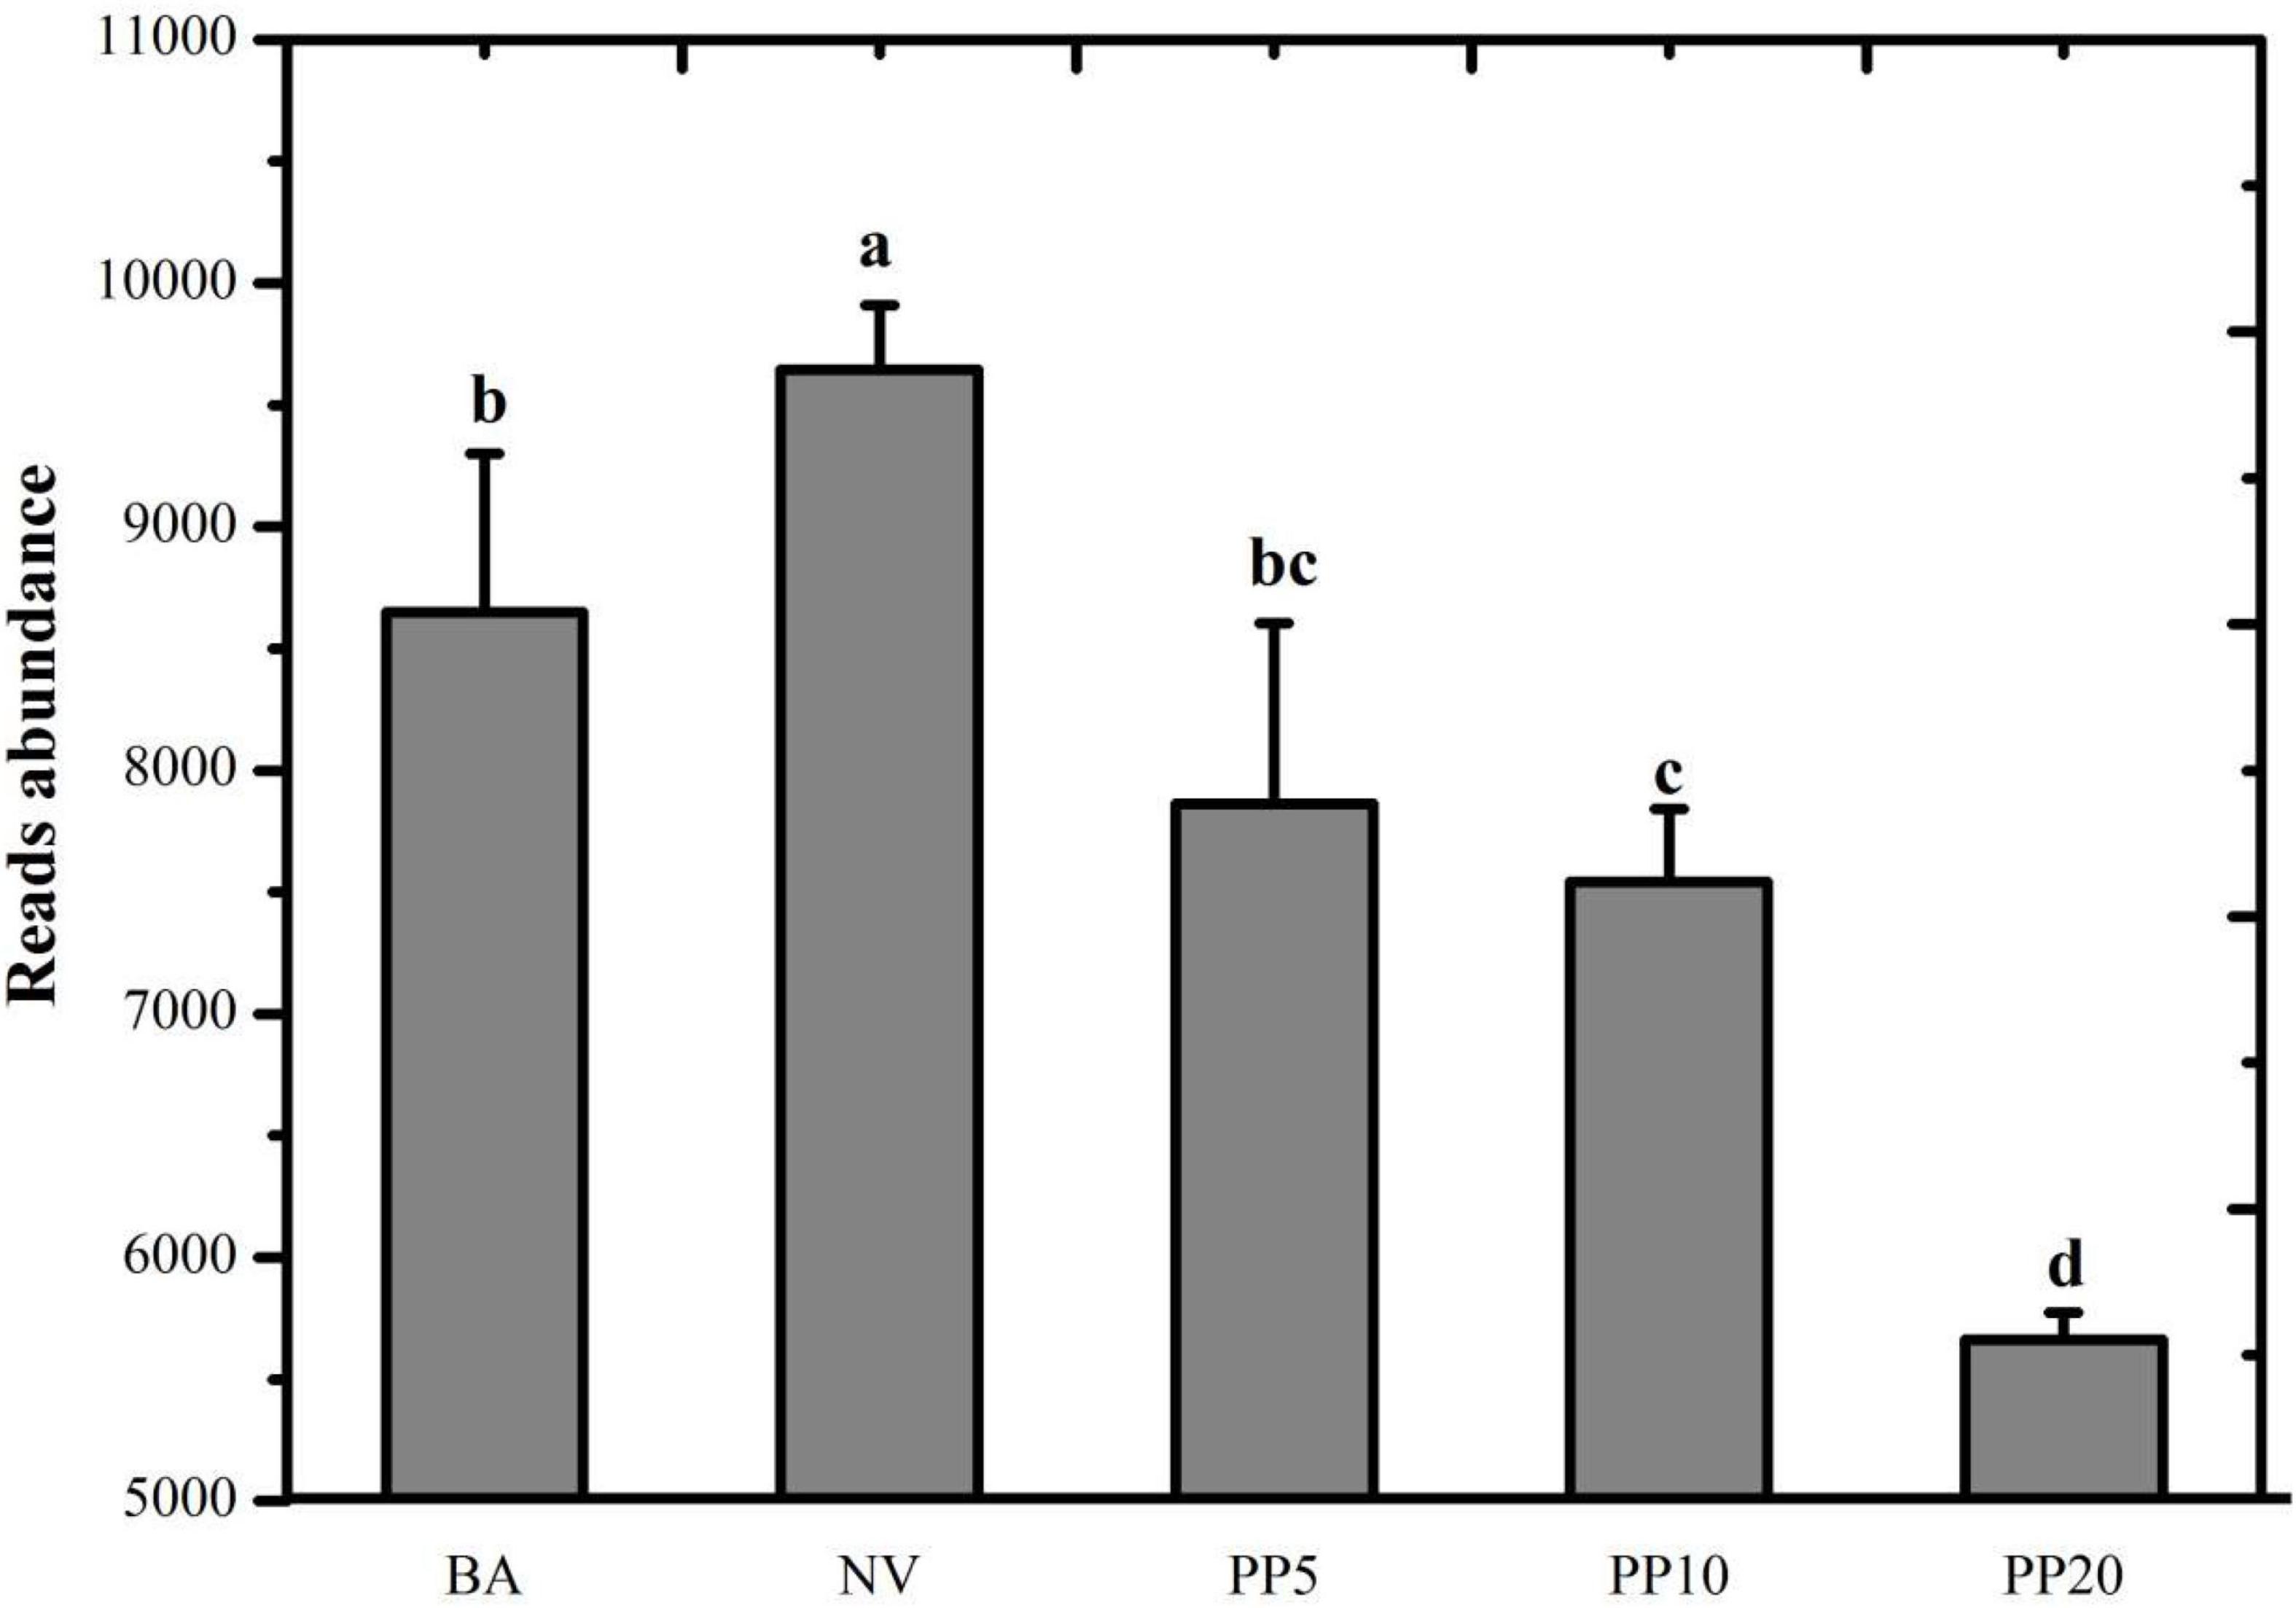
Figure 3. Read abundance of the KEGG pathway: ko00680 Methane metabolism in the soil of different land types. All reads belong to the category of methane metabolism. BA: bare land; NV: natural vegetation; PP5: 5-years old poplar plantation; PP10: the 10-year old poplar plantation; PP20: the 20-year old poplar plantation. Different letters mean significant difference as p < 0.05 in ANOVA.
Two primary biochemical pathways of methanogenesis are CO2 to CH4 (M00567 KEGG Pathway) and acetate to CH4 (M00357 KEGG Pathway) (Supplementary Table 2). Methanogenesis through the acetoclastic pathway involves several enzymes such as acetate kinase, Acetyl-CoA decarboxylase, Acetyl-CoA synthetase, etc. Genes encoding these enzymes were shown significantly lower abundances in the three afforested land types than the two non-afforested types.
The pmoA-gene (EC:1.14.18.3, 1.14.99.39) which catalyze the oxidation of methane to methanol is widely used as a functional gene marker for methanotrophs. Abundances of the pmoA gene detected with metagenomic approach were higher in the PP10 and PP20 than the non-afforested BA and NV land types (Supplementary Table 3). The serine pathway (M00346 KEGG Pathway), the xylulose monophosphate pathway (M00344 KEGG Pathway) and the ribulose monophosphate pathway (M00345 KEGG Pathway) (Supplementary Table 3) are three formaldehyde assimilation pathways in the downstream of methane conversion to formaldehyde, which also are important biochemical pathways of methanotrophs (Bhattacharyya et al., 2017). The total read number of involved enzymes was significantly lower in the three afforested land types than the two non-afforested types for all the three pathways.
In situ CH4 Flux at Sampling Event
Afforestation decreased CH4 emissions compared to the BA and NV land types (One-way ANOVA: F = 2111, p < 0.001; Figure 4). In PP10 and PP20, the soils became a net CH4 sink (Figure 4).
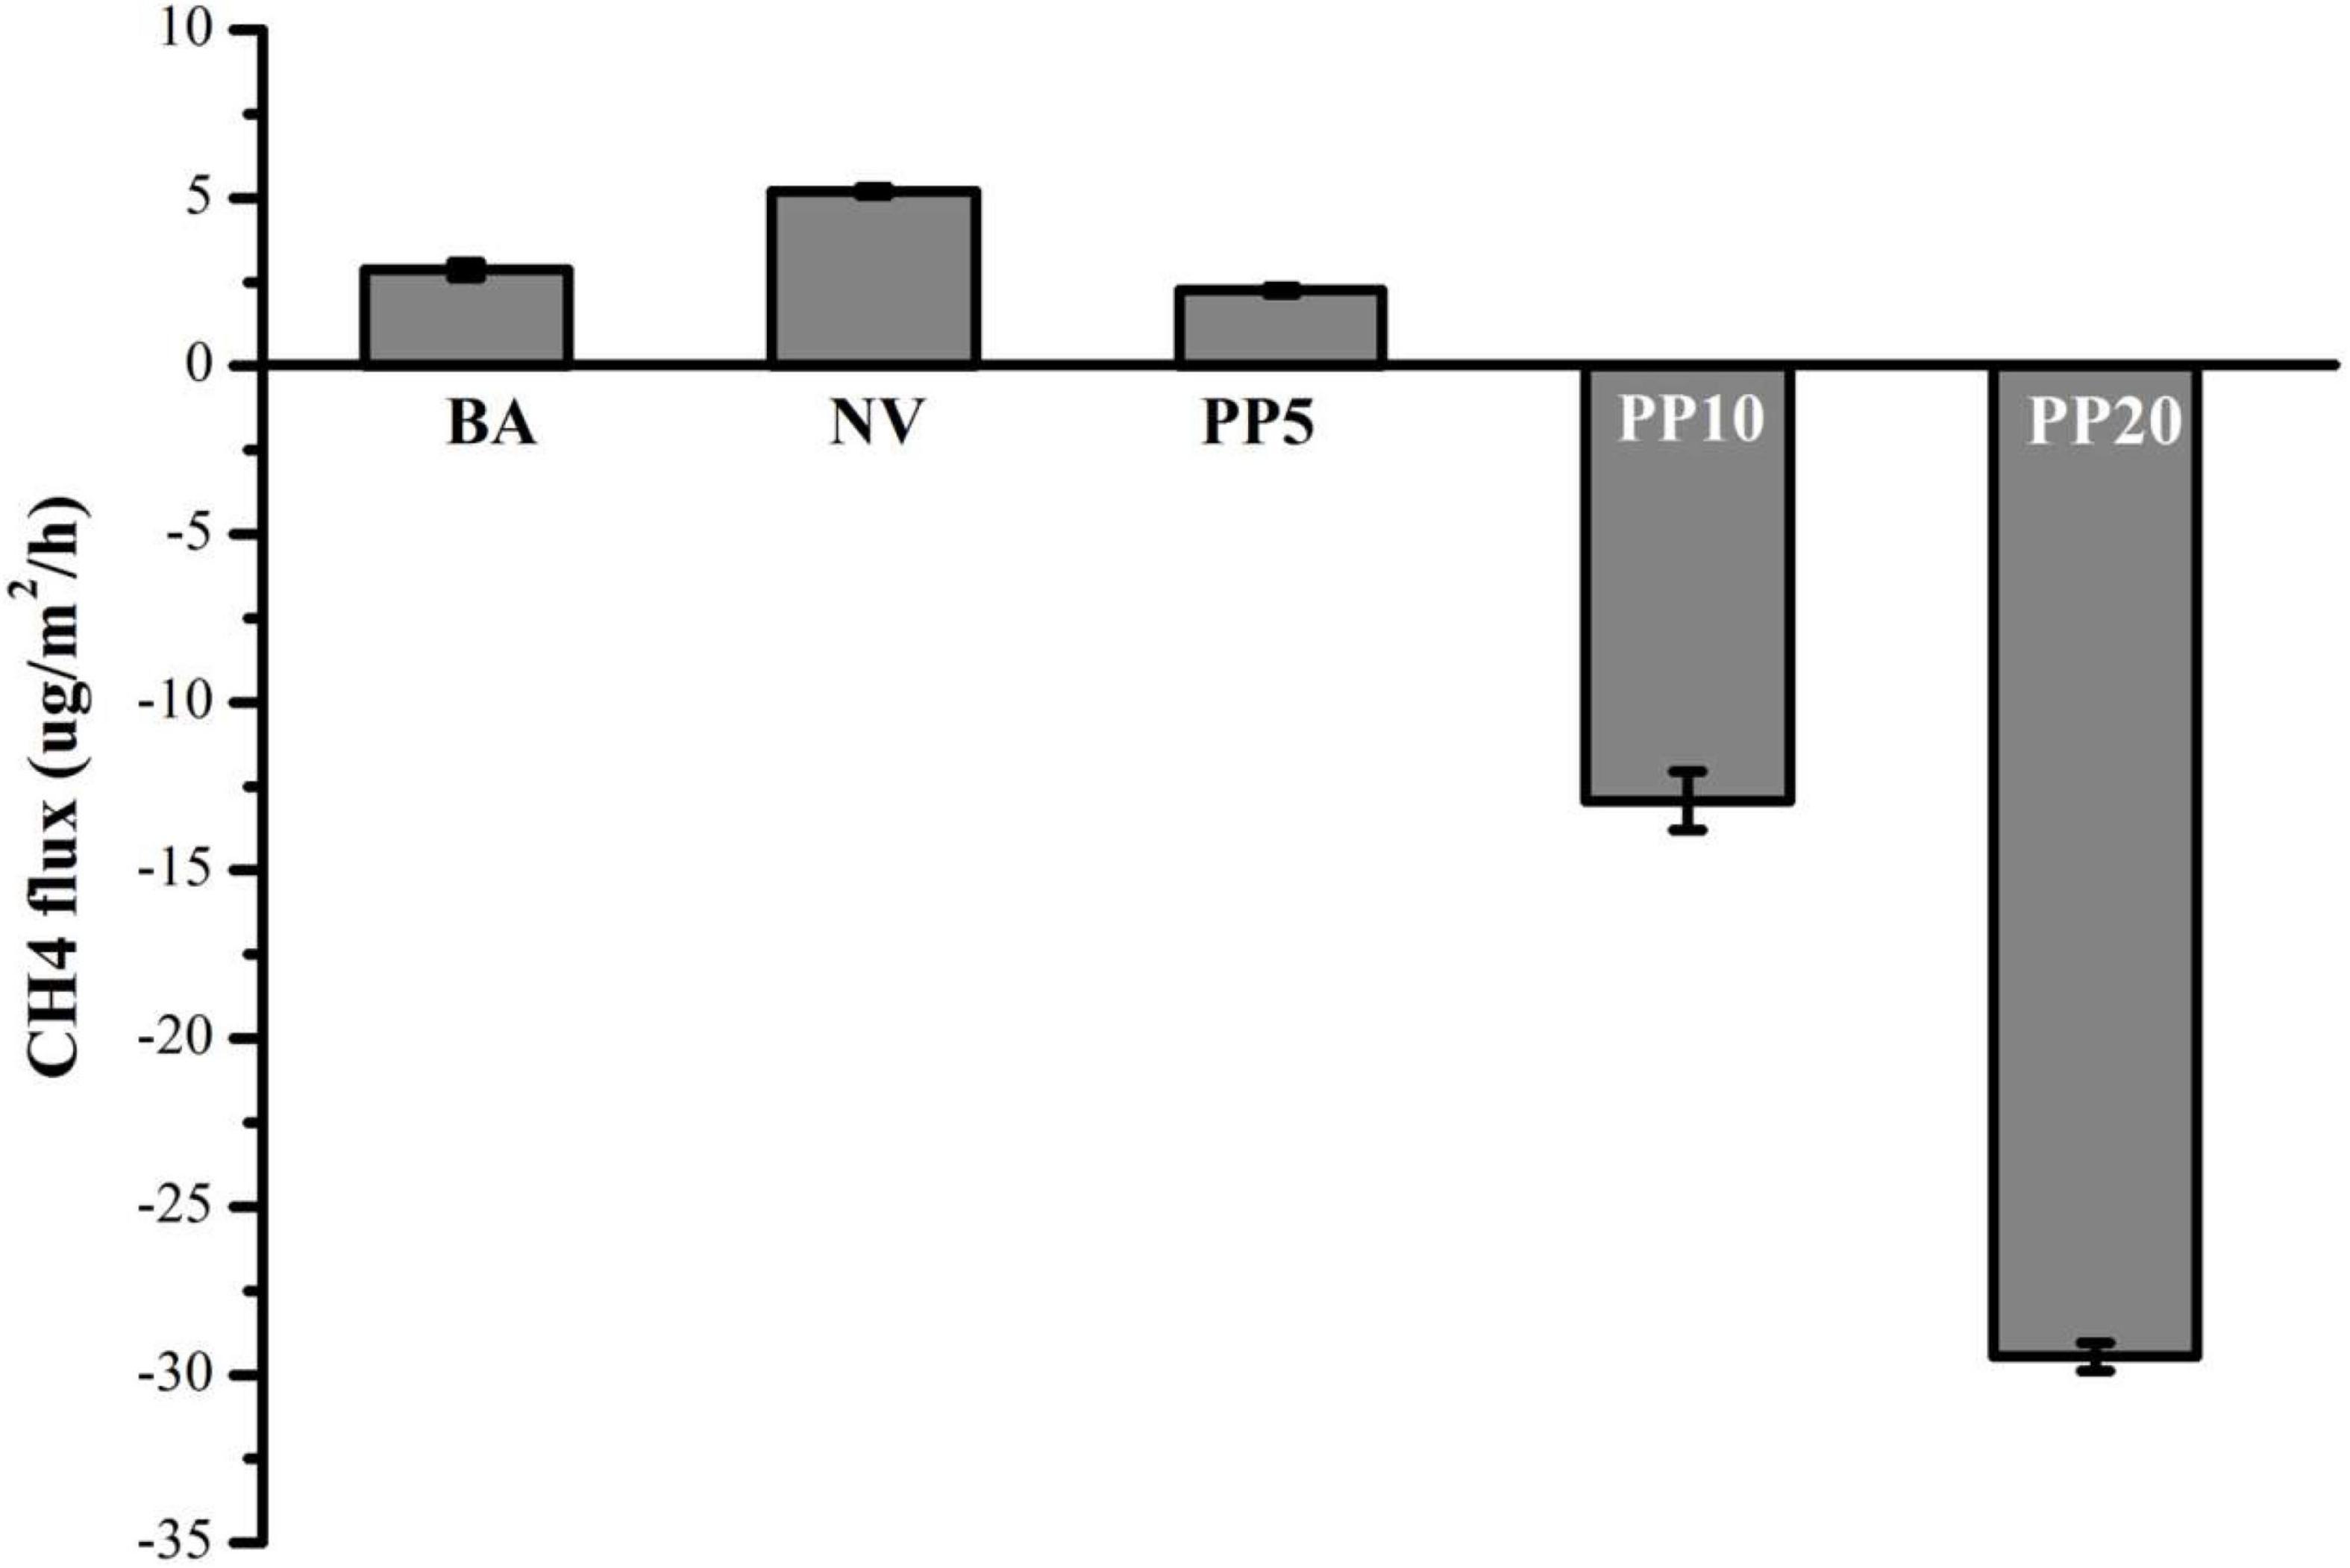
Figure 4. Net CH4 flux across five land types. Mean ± SEM (n = 4).
Random Forest Analysis
Basing on Increase in MSE (%) value, random forest analysis identified that soil particle size composition and functional genes for key enzymes were most important in determining CH4 flux (%) (Figure 5). Increase in MSE (%) represented ‘Increased in mean squared error (%)’ which means the contribution of this independent variable to the prediction accuracy of the dependent variable. Higher Increase in MSE (%) value means higher importance of this independent variable. Soil dry matter and oxygen concentration were not significant in explaining CH4 fluxes. With random forest analysis, five soil particle size components, nine genes involved in methanogenesis and eight genes involved in methane oxidation were shown to be significant for variations in CH4 fluxes (Figure 5). Total K and CEC were significant soil chemical characteristics for variations in CH4 fluxes. Methanothermobacter and Methylococcus were identified, respectively, as methanogenic and methanotrophic genera in explaining variations in CH4 fluxes. Data of all soil properties were listed in Supplementary Table 4.
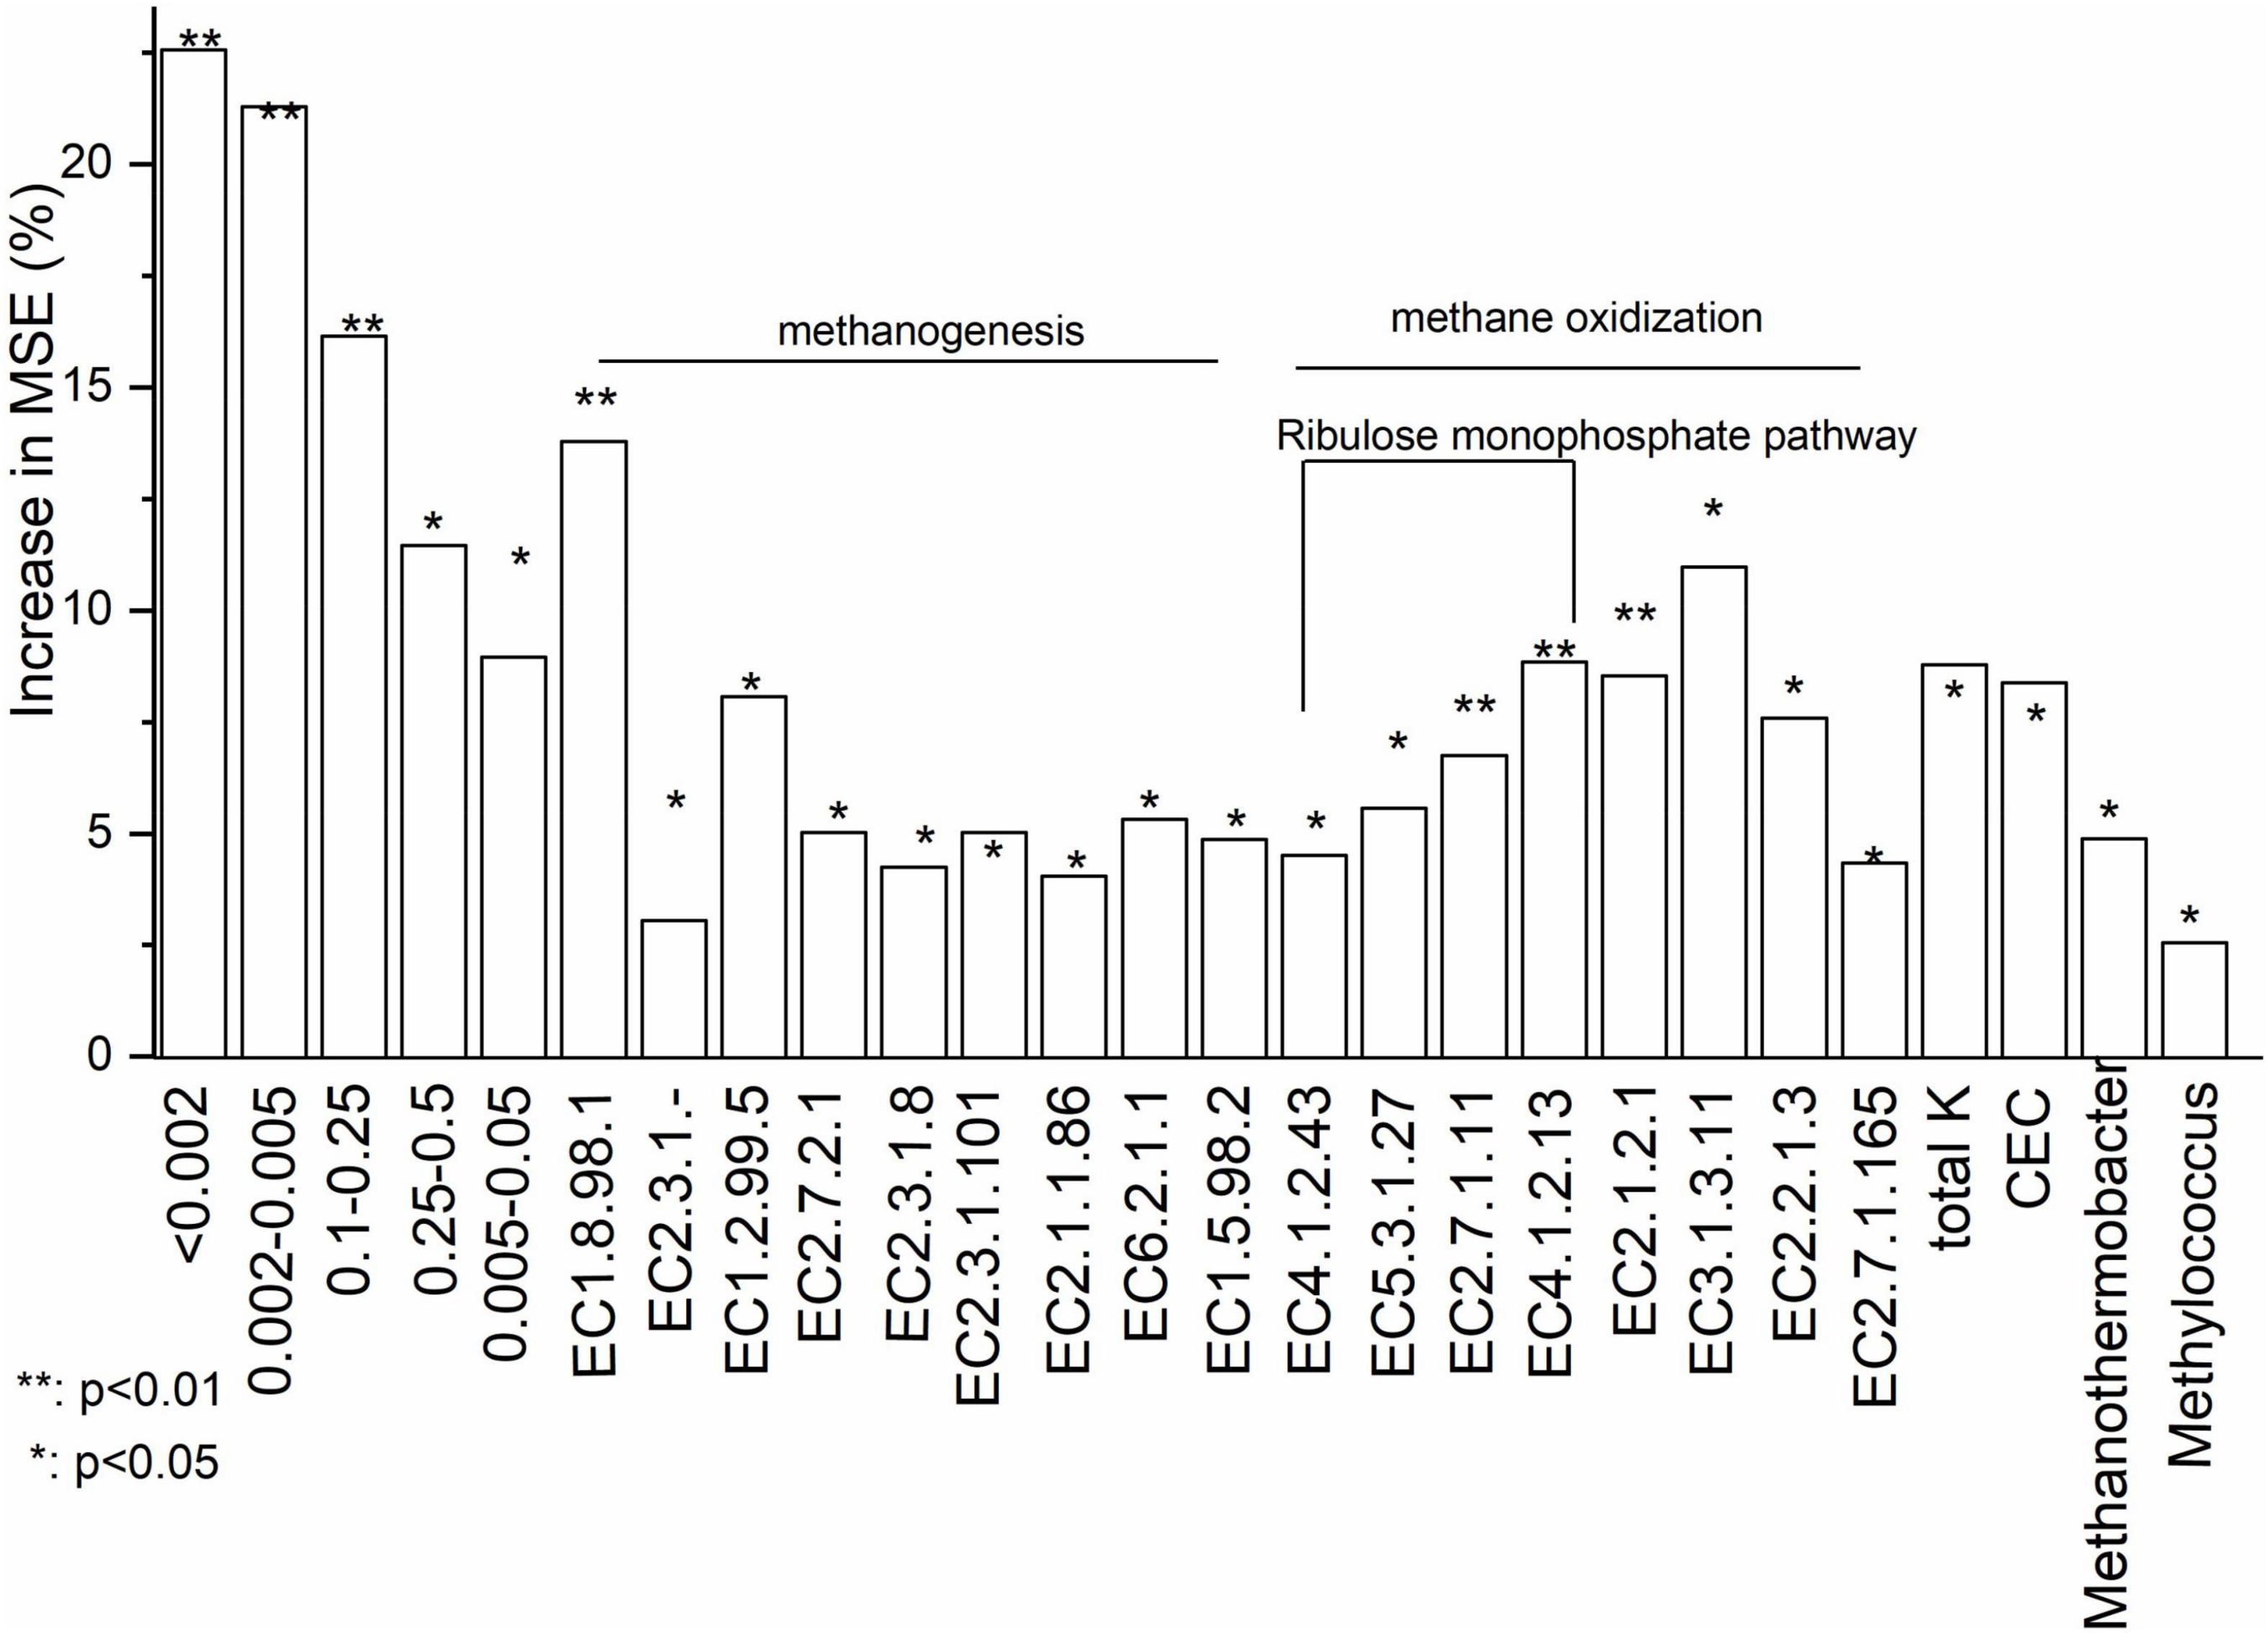
Figure 5. Relative importance of the abiotic and biotic factors in driving CH4 flux based on a Random Forest analysis. Increase in MSE (%) represented ‘Increased in mean squared error (%)‘ which means the contribution of this independent variable to the prediction accuracy of the dependent variable. Higher Increase in MSE (%) value means higher importance of this independent variable. EC 1.8.98.1: Heterodisulfide reductase; EC 2.3.1.-: Acetyl-CoA decarboxylase; EC 1.2.99.5: Formylmethanofuran dehydrogenase; EC 2.7.2.1: Acetate kinase; EC 2.3.1.8: Phosphate acetyltransferase; EC 2.3.1.101: Formylmethanofuran tetrahydromethanopterin-N-formyltransferase; EC 2.1.1.86: Tetrahydromethanopterin-S-methyltransferase (A-H); EC 6.2.1.1: Acetyl-CoA synthetase; EC 1.5.98.2: 5,10-methylenetetrahydromethanopterin reductase; EC 4.1.2.43: 3-hexose-6-phosphate synthase; EC 5.3.1.27: 6-phospho-3-hexoisomerase; EC 2.7.1.11: 6-phophofructokinase; EC 4.1.2.13: Fructose bisphosphate aldolase; EC 2.1.2.1: Glycine hydroxymethyl transferase; EC 3.1.3.11: Fructose bisphosphate; EC 2.2.1.3: Formaldehyde transketolase; EC 2.7.1.165: Glycerate-2-kinase.
Structural Equation Modeling
The direct and indirect effects of soil properties, microbial communities and functional genes on CH4 flux was explored using SEM analysis. Our SEM model adequately fitted the data (Chi-square = 1.249, df = 1, Probability level = 0.264, RSMEA = 0.001, TLI = 1.000) and explained 72% variation of CH4 flux (Figure 6). Soil particle composition, the functional genes related to methanogenesis and CEC were included in the SEM model. Soil particle size and the methanogenic functional genes comprised the two dominant direct effects on CH4 flux (Figure 6). Soil particle size had the highest total effect on CH4 flux, with indirect effects by methanogenic functional genes and CEC. Based on the variables selected from random forest analysis, we constructed several hypothetical models before performing SEM analysis. Any SEM model including methanotrophs can not fit the statistical requirements, e.g., RMSEA < 0.05 and TLI > 0.95.
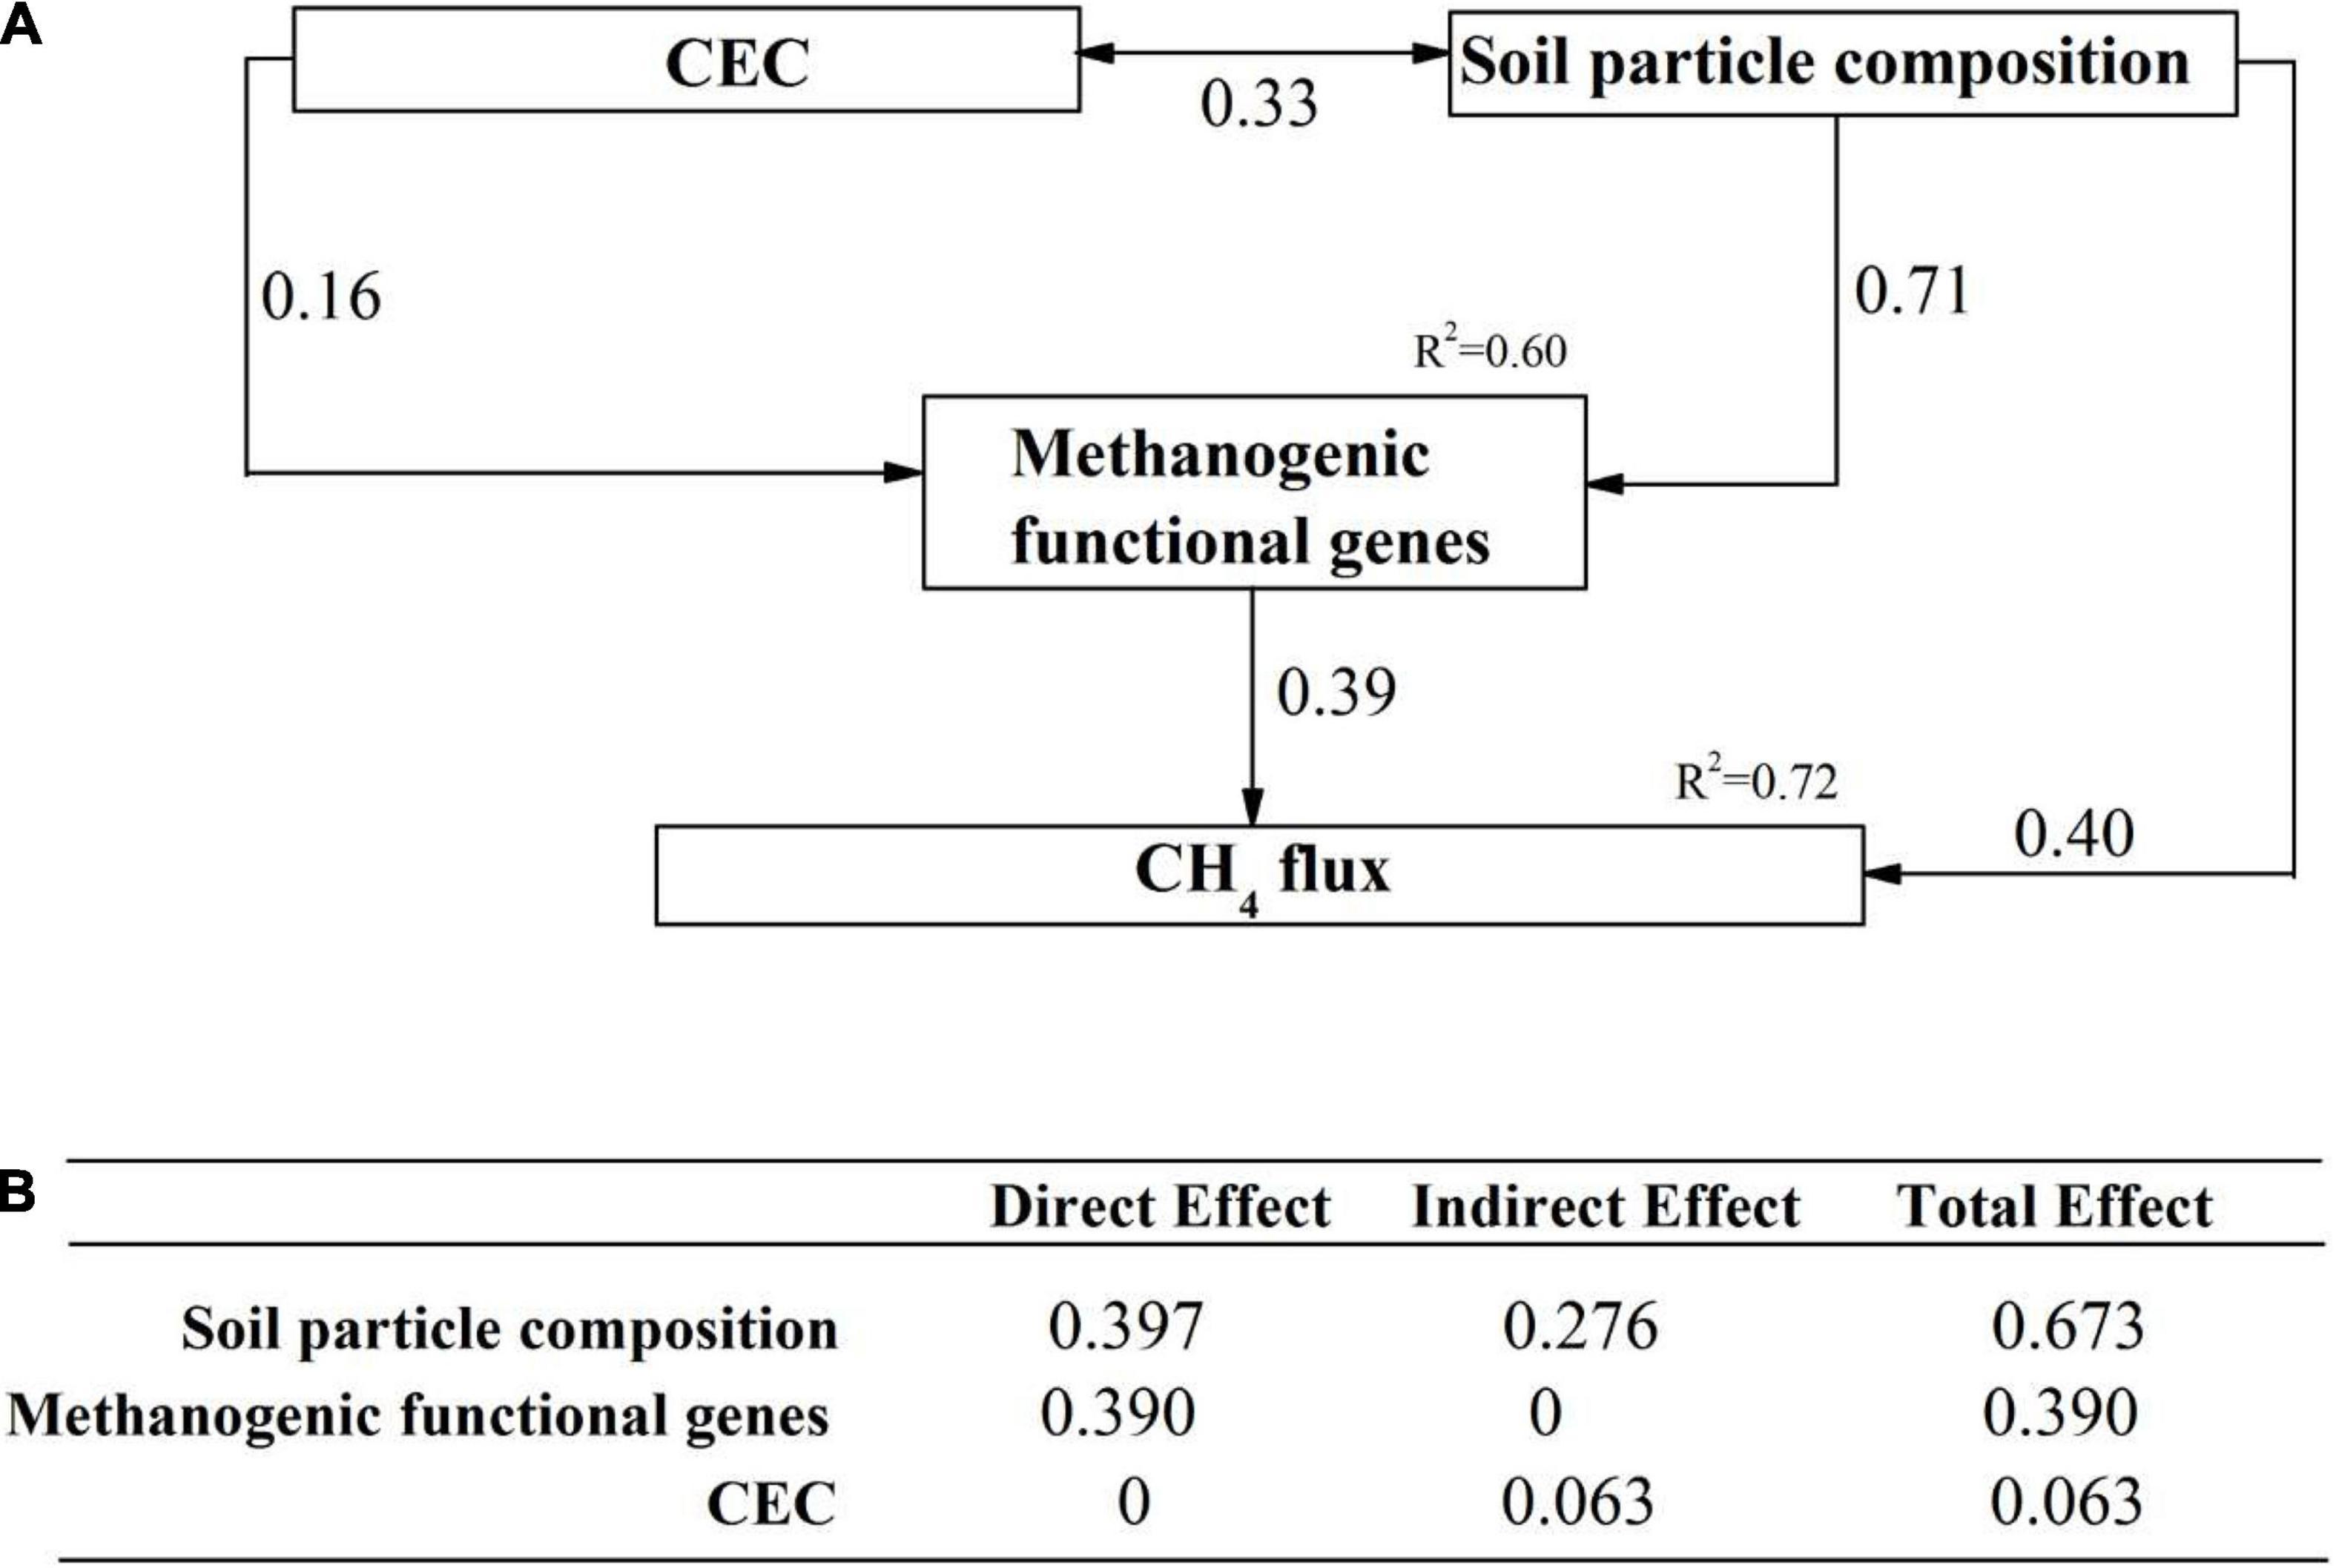
Figure 6. The direct and indirect effects of abiotic and biotic factors on CH4 flux. (A) A structural equation model showing the standardized total effects of soil properties and methanotrophs on CH4 flux; (B) The standardized direct and indirect effects of factors mentioned above on CH4 flux. The numbers above the arrows represented path coefficients. CEC: Cation exchange capacity; methanogenic functional genes: metagenome-based methanogenic gene frequency identified to be important predictors in random forest analysis; soil particle composition: soil particles identified to be important predictors in random forest analysis.
Discussion
Drivers of CH4 Flux
Water-saturated, carbon-rich ecosystems such as wetlands are traditionally classified as net CH4 sources (Tan et al., 2015). Here this study showed that afforestation decreased CH4 emissions compared to the natural marshland, and the soils appeared to become net CH4 sinks 10 years after afforestation. This suggests that afforestation on the degraded marshlands of the Yangtze River could help reduce CH4 emissions. Such was also observed in the conversion to forest from grasslands (Benanti et al., 2014) and croplands (Wu et al., 2018).
Methane emission from the soil is driven by the balance between microbial CH4 production and CH4 consumption, together with soil physicochemical properties that further affect CH4-metabolizing microbes and CH4 diffusion (Conrad, 2002). Studies have attempted to disentangle the various drivers of methane fluxes, such as temperature, moisture, microbial diversity and the abundance of CH4-metabolizing microbial populations (St Pierre et al., 2019; Lang et al., 2020). Such studies have focused on the correlation between CH4 emission and a specific variable. However, the relative importance of such factors was never determined within a comprehensive framework. The primary purpose of our study was to simultaneously consider interactions of abiotic and biotic factors in order to investigate the interplay between methane-cycling microbial communities, functional metabolic pathways and soil properties as they affect CH4 flux in various land types.
By combining random forest analysis and structural equation modeling, our results provide novel evidence of a strong correlation between the CH4 flux and the abundance of functional genes related to both CH4 production and CH4 consumption. Many studies suggest a coupling between microbial community structure and methane production or consumption (e.g., Subhajit et al., 2018; Yu et al., 2020). However, some previous studies suggest that coarse measures of microbial communities based on DNA techniques may be insufficient to understand the functional contributions of such microbial communities (Rocca et al., 2015; Wood et al., 2015). A few examples illustrate this point. First, metaproteomics revealed that perturbations in organic matter affected functional composition over the taxonomic composition of the microbial community (Mikan et al., 2020). Second, grazing clearly changed the overall microbial functional composition, but the overall composition of the CH4-cycling microbial community was unchanged (Ma et al., 2019). Third, some studies have shown that considerable variation in atmospheric CH4 consumption could occur without apparent changes in biomass and composition of the high-affinity methanotrophic community (e.g., Menyailo et al., 2010). Our results also demonstrate that variation in functional gene composition due to land type was more likely responsible for the observed effects on CH4 flux than shifts in taxonomic microbial community structure. One possible explanation for the poor linkage between taxonomic microbial community structure and microbial community function may be sufficient functional redundancy (Paul, 2007) among microbial taxa to obscure the linkage. To our knowledge, this is the first report providing evidence consistent with the hypothesis that functionality is superior to taxonomic community structure in determining in situ CH4 flux.
Several functional genes involved in methanogenic pathways showed strong explanatory strength in CH4 flux (Supplementary Table 2). This was supported by two recent studies which reported metagenomic genes were predictive for CH4 flux in industrial salt ponds (Zhou et al., 2022) and arctic lake sediment (Emerson et al., 2021). Several genes such as genes for EC 2.1.1.86 and EC 2.7.2.1 were identified for significantly correlated with CH4 flux in our study and a previous study (Zhou et al., 2022). The enzyme EC 2.1.1.86 represents tetrahydromethanopterin S-methyltransferase for generation of methyl-CoM, the next to last step in hydrogenotrophic and acetoclastic methanogenesis. The EC 2.7.2.1 metabolize acetate into acetyl-CoA for methanogenesis. However, different from that mcrA gene was predictive for CH4 flux (Emerson et al., 2021; Zhou et al., 2022), mcrA gene wasn’t found to be significant in explaining CH4 flux in our study. This suggested that the limiting step of CH4 production in our study sites were in the upstream steps (e.g., biochemical reaction was catalyzed by EC 2.1.1.86 and EC 2.7.2.1) but not in the terminal step in methanogenesis catalyzed by methyl coenzyme M reductase (mcrA gene).
There existed a strong interactive effect of functional genes and soil properties on CH4 flux. Soil particle size and CEC were the two soil property drivers. Soil particles < 0.002 mm were particularly important in affecting CH4 flux, as shown in random forest analysis. This was supported by a previous study showing that methane production was at a higher rate in clay (size < 0.002 mm) than in coarser particles (e.g., sand, gravel) (Wagner et al., 1999). Small soil particles enhance water retention, promote higher microbial biomass (Wilpiszeski et al., 2019), and reduced oxygen permeability, leading to lower redox potential and even local anoxia. This, in turns, supports higher CH4 production and suppresses CH4 oxidation. Our structural equation modeling also showed that soil particle size could interact with CEC to affect CH4 production, supported by a previous study (Mitra et al., 2002). Clay and humus particles are negatively charged, which significantly influence CEC. CEC was higher in clay than in gravel or sand (Wagner et al., 1999). van Loosdrecht et al. (1987a,b) showed that the hydrophobicity and electrophoretic mobility of microbes could be taken as an indicator for their adhesion properties. Methanogens, e.g., Methanosarcina barkeri, have a hydrophobic cell surface and low electrophoretic mobility, which increases their attachment to soil particles (Grotenhuis et al., 1992).
Community and Abundance of Methanotrophs
Overall, the motivation of this study was not to describe the structures of communities of methanogens and methanotrophs, but result of the methanotrophic community is discussed here because it is inconsistent with our hypothesis.
Copy number of the pmoA gene did not support our hypothesis that afforestation would support growth of the population of methanotrophs; pmoA gene copy number decreased in the afforested plots. In contrast with previous results showing methanotrophic population recovery with plantation age (Nazaries et al., 2011; Sun and Badgley, 2019), our study showed that the metabolic pathway of microbial methanotrophic activity was suppressed with increasing plantation age. These results can probably be best explained by the significant decrease in methanogenic activity with plantation age, as evidenced by the decreasing mcrA gene and methanogenesis pathway abundance in older plantations and the shift to becoming a net CH4 sink.
Our study also showed that afforestation in the Yangtze River marshland did not change the community structure of aerobic bacterial methanotrophs. This, again, is different from previous studies showing a shift in methanotrophic communities following afforestation (Singh et al., 2007, 2009; Nazaries et al., 2011). Previous studies showed that afforestation on pasture or reforestation increased the abundance of type-II methanotrophs but suppressed type-I methanotroph (Nazaries et al., 2011; Sun and Badgley, 2019). It was also found that type-II methanotrophs were dominant (77% of methanotrophs) and mainly drove the changes in methane monooxygenase gene abundances as plantations aged (Sun and Badgley, 2019). Here, bacterial community composition showed that type I methanotroph was dominant, including Methylobacter, Methylomicrobium, Methylomonas, and Methylosarcina. A reasonable explanation for our observations is that our site undergoes periodical flooding and produces high amounts of methane irrespective of plantation age, in contrast to the studies mentioned above. As methanotrophs are aerobic, soil water content may be an important consideration that overrides afforestation as a controlling factor of methanotrophic communities in marshlands (Zhang et al., 2019). This is supported by previous studies that show CH4 oxidation rates decrease in temperate forest when soil water content ranges from 60 to 100% water-filled pore space (Whalen and Reeburgh, 1990; Bender and Conrad, 1995).
Implications, Limitations and Future Directions
The different molecular methods used here (amplicon sequencing, qPCR, and metagenomics) each have their strengths and weaknesses and were used to complement each other. For example, amplicon sequencing provides an excellent taxonomic overview for many samples and allows detecting even very rare members of the community, but is limited to one gene at a time. Metagenomics, on the other hand, enables studying community functions in an untargeted way. However, both methods deliver only compositional data with many limitations. qPCR, therefore, complements these methods by providing absolute gene quantity values. A significant advantage of studying methanogens and methanotrophs, in contrast to some other microbial guilds, is that each is limited to a single energy-yielding process for growth. Therefore, the population sizes of these two guilds serve as a good proxy for the magnitude of gross methane production and consumption. A variety of other studies have demonstrated correlations between methane production and soil properties as well as microbiome features (Emerson et al., 2021; Zhou et al., 2022). Here, our study revealed the relative importance and interactive pathway of soil properties and microbial features in explaining in-situ CH4 flux including various molecular methods into analysis. Thus, we think our findings could, to some extent, provide some new insights into driving mechanism of CH4 flux and cycling. This suggests that functional gene data could be used to predict methane fluxes by advanced modeling. It is important to recognize that, in general, the assumption about microbe — methane flux interaction has been formulated for several times from 2,000 until to date based on limited datasets (Täumer et al., 2021). Here our data set is also limited to make a conclusion that how it can be done. Even so, we still think our findings could at least provide some new insights into driving mechanism of CH4 flux and cycling in the studied ecosystem, i.e., gene abundances obtained through metagenomics or quantitative/digital PCR could be more effective than community profiling in predicting CH4 fluxes. Further, although qPCR abundance of pmoA was previously significantly correlated to methane oxidation activity of methanotrophs in forest soils (Kolb et al., 2005), we here found no relationship between both. Our results showed high abundances of methanotrophs present according to the qPCR data but low abundances of reads that encode for the pmoA in metagenomic analysis (as listed in Supplementary Table 3). This might be originated from rarefaction of abundance data. Rarefaction was done to avoid bias in sequencing depth. Prior to rarefaction, abundances of pmoA gene in metagenomics analysis were from 25 to 173. Basically, our qPCR data showed that ratio of pmoA gene to bacterial 16S rDNA was about 0.01% ∼ 0.1% (106 ∼ 107/1010), meaning that in 107 metagenome reads ca. 100 – 1,000 will be affiliated with a methanotroph. However, that is all the genes, finding a pmoA is still rare. As annotated reads in our metagenomic analysis was at 107 level, we think data of pmoA gene in metagenomic after rarefaction was reasonable, and results of meta-genome and qPCR approaches could support each other.
Our study provides empirical evidence that microbial community function is more important than taxonomic community structure in explaining in situ CH4 fluxes. We first highlight an interactive effect between methanogenic functional genes and soil properties, in particular soil particle size. The results should urge researchers to adopt the use of functional gene analysis through metagenomics to develop a gene-centric approach and to utilize a framework that includes known interactions among factors that can be integrated into simulation models to understand climate change and to inform management policies. One of the key limitations of this study is that sampling was done at only one time on one tree species with only three replicates for each vegetation type, which limited us to make a final conclusion about basic scientific assumptions on microbe-methane flux interaction. Furthermore, besides community composition and functional gene, the activity of all microbes engaged in methane-cycle is also important. Future study should consider to include meta-transcriptome and meta-proteome revealling in-situ microbail activities in prediction of CH4 flux. Third, some soil characteristics such as soil temperature was not recorded here which was thought to be important for CH4 flux and should be included into analysis in future study. Therefore, future work should take more environmental variables and methodological approach into account and include larger temporal and spatial scales across a variety of land use types and climates.
Data Availability Statement
The datasets presented in this study can be found in online repositories. The names of the repository/repositories and accession number(s) can be found here https://www.ncbi.nlm.nih.gov/sra/PRJNA787026.
Author Contributions
QZ: conceptualization, data curation, formal analysis, writing—original draft, and writing—review and editing. JT: methodology and writing—original draft. RA: writing—review and editing. DW: methodology, formal analysis, and writing—review and editing. XH: methodology, writing—original draft, and writing—review and editing. SG: methodology, data curation, and formal analysis. LZ: methodology, data curation, formal analysis, and writing—original draft. YT: re-sources, methodology, and writing—review and editing. XZ: re-sources, methodology, and writing—review and editing. HY: writing—original draft, funding acquisition, and writing—review and editing. QS: conceptualization, methodology, writing—original draft, and funding acquisition. All authors contributed to the article and approved the submitted version.
Funding
Kees Jan van Groenigen provided constructive comments on the manuscript. This work was supported by the Central Public-interest Scientific Institution Basal Research Fund (CAFYBB2017ZF004) and the Natural Science Foundation of China (No. 31870099).
Conflict of Interest
The authors declare that the research was conducted in the absence of any commercial or financial relationships that could be construed as a potential conflict of interest.
Publisher’s Note
All claims expressed in this article are solely those of the authors and do not necessarily represent those of their affiliated organizations, or those of the publisher, the editors and the reviewers. Any product that may be evaluated in this article, or claim that may be made by its manufacturer, is not guaranteed or endorsed by the publisher.
Supplementary Material
The Supplementary Material for this article can be found online at: https://www.frontiersin.org/articles/10.3389/fmicb.2022.830019/full#supplementary-material
Footnotes
- ^ http://ccb.jhu.edu/software/FLASH/
- ^ http://drive5.com/uparse/
- ^ http://sourceforge.net/projects/rdp-classifier/
- ^ https://greengenes.lbl.gov/Download/Taxonomic_Outlines/
- ^ https://www.ncbi.nlm.nih.gov/Taxonomy/taxonomyhome.html/index.cgi?chapter~=~tgencodes#SG1
- ^ http://www.bioinformatics.org/cd-hit/
- ^ http://www.kegg.jp
- ^ http://cran.rproject.org/web/packages/rfPermute/rfPermute.pdf
References
Angel, R., Claus, P., and Conrad, R. (2012). Methanogenic archaea are globally ubiquitous in aerated soils and become active under wet anoxic conditions. ISME J. 6, 847–862. doi: 10.1038/ismej.2011.141
Benanti, G., Saunders, M., Tobin, B., and Osborne, B. (2014). Contrasting impacts of afforestation on nitrous oxide and methane emissions. Agric. For. Meteorol. 198–199, 82–93.
Bender, M., and Conrad, R. (1995). Effect of CH4 concentrations and soil conditions on the induction of CH4 oxidation activity. Soil Biol. Biochem. 27, 1517–1527.
Bhattacharyya, P., Roy, K. S., Nayak, A. K., Shahid, M., Lal, B., Gautam, P., et al. (2017). Metagenomic assessment of methane production-oxidation and nitrogen metabolism of long term manured systems in lowland rice paddy. Sci. Total Environ. 586, 1245–1253. doi: 10.1016/j.scitotenv.2017.02.120
Bodelier, P. L. E. (2011). Interactions between nitrogenous fertilizers and methane cycling in wetland and upland soils. Curr. Opin. Env. Sust. 3, 379–388. doi: 10.1890/09-2185.1
Bokulich, N. A., Subramanian, S., Faith, J. F., Gevers, D., Gordon, J. I., Knight, R., et al. (2013). Quality-filtering vastly improves diversity estimates from Illumina amplicon sequencing. Nat. Methods 10, 57–59. doi: 10.1038/nmeth.2276
Bolger, A. M., Lohse, M., and Usadel, B. (2014). Trimmomatic: a flexible trimmer for Illumina sequence data. Bioinformatics 30, 2114–2120. doi: 10.1093/bioinformatics/btu170
Caporaso, J. G., Kuczynski, J., Stombaugh, J., Bittinger, K., Bushman, F. D., Costello, E. K., et al. (2010). QIIME allows analysis of high- throughput community sequencing data. Nat. Methods 7, 335–336. doi: 10.1038/nmeth.f.303
Cline, L. C., and Zak, D. R. (2015). Soil microbial communities are shaped by plant-driven changes in resource availability during secondary succession. Ecology 96, 3374–3385. doi: 10.1890/15-0184.1
Conrad, R. (1996). Soil microorganisms as controllers of atmospheric trace gases (H2, CO, CH4, OCS, N2O, and NO). Microbiol. Mol. Biol. R. 60, 609–640. doi: 10.1128/mr.60.4.609-640.1996
Conrad, R. (2002). Control of microbial methane production in wetland rice fields. Nutr. Cycl. Agroecosys. 64, 59–69.
Dalal, R. C., and Allen, D. E. (2008). Greenhouse gas fluxes from natural ecosystems. Aust. J. Bot. 56, 369–407.
de Mendiburu, F. (2012). Agricolae: Statistical Procedures for Agricultural Research. R Package Version 1.1-2. Available online at: http://CRAN.R-project.org/package=agricolae (accessed September 1, 2012).
DeSantis, T. Z., Hugenholtz, P., Larsen, N., Rojas, M., Brodie, E. L., Keller, K., et al. (2006). Greengenes, a chimera-checked 16S rRNA gene database and workbench compatible with ARB. Appl. Environ. Microb. 72, 5069–5072. doi: 10.1128/AEM.03006-05
Dörr, N., Glaser, B., and Kolb, S. (2010). Methanotrophic communities in Brazilian Ferralsols from naturally forested, afforested, and agricultural sites. Appl. Environ. Microb. 76, 1307–1310. doi: 10.1128/AEM.02282-09
Edgar, R. C. (2013). UPARSE: highly accurate OTU sequences from microbial amplicon reads. Nat. Methods 10, 996–998. doi: 10.1038/nmeth.2604
Edgar, R. C., Haas, B. J., Clemente, J. C., Quince, C., and Knight, R. (2011). UCHIME improves sensitivity and speed of chimera detection. Bioinformatics 27, 2194–2200. doi: 10.1093/bioinformatics/btr381
Emerson, J. B., Varner, R. K., Wik, M., Parks, D., Neumann, R., Johnson, J. E., et al. (2021). Diverse sediment microbiota shape methane emission temperature sensitivity in Arctic lakes. Nat. Commun. 12:5815. doi: 10.1038/s41467-021-25983-9
Ettwig, K. F., Zhu, B. L., Speth, D., Keltjens, J. T., Jetten, M. S. M., and Kartal, B. (2016). Archaea catalyze iron-dependent anaerobic oxidation of methane. P. Natl. Acad. Sci. U.S.A. 113, 12792–12796. doi: 10.1073/pnas.1609534113
Fierer, N., Ladau, J., Clemente, J. C., Leff, J. W., Owens, S. M., Pollard, K. S., et al. (2013). Reconstructing the microbial diversity and function of pre-agricultural tallgrass prairie soils in the United States. Science 342, 621–624. doi: 10.1126/science.1243768
Fortmann-Roe, S. (2015). Consistent and clear reporting of results from diverse modeling techniques: the A3 method. J Stat. Softw. 66, 1–23.
Freitag, T. E., and Prosser, J. I. (2009). Correlation of methane production and functional gene transcriptional activity in a peat soil. Appl. Environ. Microb. 75, 6679–6687. doi: 10.1128/AEM.01021-09
Friedrich, M. W. (2005). Methyl-coenzyme M reductase genes: unique functional markers for methanogenic and anaerobic methane-oxidizing archaea. Method Enzymol. 397, 428–442. doi: 10.1016/S0076-6879(05)97026-2
Gao, S. H., Zhang, X. D., Tang, Y. X., Zhang, R., Tang, J., Zhang, L., et al. (2013). Short-term effects of clear-cutting of Populus deltoides plantation on methane flux on the beach land of Yangtze River. Sci. Silv. Sini. 49, 7–13.
Grotenhuis, J. T. C., Plugge, C. M., Stams, A. J. M., and Zehnder, A. J. B. (1992). Hydrophobicities and electrophoretic mobilities of anaerobic bacterial isolates from methanogenic granular sludge. Appl. Environ. Microb. 58, 1054–1056. doi: 10.1128/aem.58.3.1054-1056.1992
Hu, L., and Bentler, P. M. (1999). Cutoff criteria for fit indexes in covariance structure analysis: conventional criteria versus new alternatives. Struct. Equat. Model. 6, 1–55. doi: 10.1080/10705519909540118
Hyatt, D., Locascio, P. F., Hauser, L. J., and Uberbacher, E. C. (2012). Gene and translation initiation site prediction in metagenomic sequences. Bioinformatics 28, 2223–2230. doi: 10.1093/bioinformatics/bts429
ISO 11465 (1993). Soil Quality–Determination of Dry Matter and Water Content on a Mass Basis–Gravimetric Method. Geneva: International Organization for Standardization.
Jiang, T. T., Pan, J. F., Pu, X. M., Wang, B., and Pan, J. J. (2015). Current status of coastal wetlands in China: degradation, restoration, and future management. Estuar. Coast. Shelf S. 164, 265–275.
Kanehisa, M., and Goto, S. (2000). KEGG: KYOTO encyclopedia of genes and genomes. Nucleic Acids Res. 28, 27–30.
Kolb, S. (2009). The quest for atmospheric methane oxidizers in forest soils. Environ. Microbiol. Rep. 1, 336–346. doi: 10.1111/j.1758-2229.2009.00047.x
Kolb, S., Knief, C., Dunfield, P. F., and Conrad, R. (2005). Abundance and activity of uncultured methanotrophic bacteria involved in the consumption of atmospheric methane in two forest soils. Environ. Microbiol. 7, 1150–1161. doi: 10.1111/j.1462-2920.2005.00791.x
Kumaresan, D., Cross, A. T., Moreira-Grez, B., Kariman, K., Nevill, P., Stevens, J., et al. (2017). Microbial functional capacity is preserved within engineered soil formulations used in mine site restoration. Sci. Rep. 7:564. doi: 10.1038/s41598-017-00650-6
Lang, R., Goldberg, S. D., Blagodatsky, S., Piepho, H.-P., Hoyt, A. M., Harrison, R. D., et al. (2020). Mechanism of methane uptake in profiles of tropical soils converted from forest to rubber plantations. Soil Biol. Biochem. 145:107796.
Lee, H. J., Kim, S. Y., Kim, P. J., Madsen, E. L., and Jeon, C. O. (2014). Methane emission and dynamics of methanotrophic and methanogenic communities in a flooded rice field ecosystem. FEMS Microbiol. Ecol. 88, 195–212. doi: 10.1111/1574-6941.12282
Li, D. H., Liu, C. M., Luo, R. B., Sadakane, K., and Lam, T. W. (2015). MEGAHIT: an ultra-fast single-node solution for large and complex metagenomics assembly via succinct de Bruijn graph. Bioinformatics 31, 1674–1676. doi: 10.1093/bioinformatics/btv033
Lu, R. K. (1999). The Analysis Method of Soil Agricultural Chemistry. Beijing: China Agricultural Science and Technology Press.
Luton, P. E., Wayne, J. M., Sharp, R. J., and Riley, P. W. (2002). The mcrA gene as an alternative to 16S rRNA in the phylogenetic analysis of methanogen populations in landfill. Microbiology 148, 3521–3530. doi: 10.1099/00221287-148-11-3521
Ma, X., Zhang, Q., Zheng, M., Gao, Y., Yuan, T., Hale, L., et al. (2019). Microbial functional traits are sensitive indicators of mild disturbance by lamb grazing. ISME J. 13, 1370–1373. doi: 10.1038/s41396-019-0354-7
Menyailo, O. V., Abraham, W., and Conrad, R. (2010). Tree species affect atmospheric CH4 oxidation without altering community composition of soil methanotrophs. Soil Biol. Biochem. 42, 101–107.
Meyer, F., Paarmann, D., D’Souza, M., Olson, R., Glass, E. M., Kubal, M., et al. (2008). The metagenomics RAST server-a public resource for the automatic phylogenetic and functional analysis of metagenomes. BMC Bioinformatics 9:386. doi: 10.1186/1471-2105-9-386
Mikan, M. P., Harvey, H. R., Timmins-Schiffman, E., Riffle, M., and Nunn, B. L. (2020). Metaproteomics reveal that rapid perturbations in organic matter prioritize functional restructuring over taxonomy in western arctic ocean microbiomes. ISME J. 14, 1–14. doi: 10.1038/s41396-019-0503-z
Mitra, S., Wassmann, R., Jain, M. C., and Pathak, H. (2002). Properties of rice soils affecting methane production potentials: 1. temporal patterns and diagnostic procedures. Nutr. Cycl. Agroecosys. 64, 169–182.
Nazaries, L., Murrell, J. C., Millard, P., Baggs, E. M., and Singh, B. K. (2013a). Methane, microbes and models: fundamental understanding of the soil methane cycle for future predictions. Environ. Microbiol. 15, 2395–2417. doi: 10.1111/1462-2920.12149
Nazaries, L., Pan, Y., Bodrossy, L., Baggs, E. M., Millard, P., Murrell, J. C., et al. (2013b). Evidence of Microbial regulation of biogeochemical cycles: evidence from a study on methane flux and land-use change. Appl. Environ. Microb. 79, 4031–4040. doi: 10.1128/AEM.00095-13
Nazaries, L., Tate, K. R., Ross, D. J., Singh, J., Dando, J., Saggar, S., et al. (2011). Response of methanotrophic communities to afforestation and reforestation in New Zealand. ISME J. 5, 1832–1836. doi: 10.1038/ismej.2011.62
Nelson, D. W., and Sommers, L. E. (1982). “Dry combustion method using medium temperature resistance furnace,” in Methods of Soil Analysis. Part 2: Chemical and Microbial Properties, 2nd Edn, ed. A. L. Page (Madison, WI: American Society of Agronomy), 539–579.
Oksanen, J., Blanchet, F. G., Kindt, R., Legendre, P., Minchin, P. R., O’hara, R. B., et al. (2013). Vegan: Community Ecology Package. R Package Version 2.0-7. Available online at: http://CRAN.R-project.org/package=vegan (accessed July 1, 2013).
Paul, E. A. (2007). Soil Microbiology, Ecology and Biochemistry, 3rd Edn. London: Academic Press, 532.
Redmond, M. C., Valentine, D. L., and Sessions, A. L. (2010). Identification of novel methane-, ethane-, and propane-oxidizing bacteria at marine hydrocarbon seeps by stable isotope probing. Appl. Environ. Microb. 76:6412. doi: 10.1128/AEM.00271-10
Rocca, J. D., Hall, E. K., Lennon, J. T., Evans, S. E., Waldrop, M. P., Cotner, J. B., et al. (2015). Relationships between proteinencoding gene abundance and corresponding process are commonly assumed yet rarely observed. ISME J. 9, 1693–1699. doi: 10.1038/ismej.2014.252
Seo, J., Jang, I., Gebauer, G., and Kang, H. (2013). Abundance of methanogens, methanotrophic bacteria, and denitrifiers in rice paddy soils. Wetlands 34, 213–223. doi: 10.1007/s13157-013-0477-y
Singh, B. K., Tate, K. R., Kolipaka, G., Hedley, C. B., Macdonald, C. A., Millard, P., et al. (2007). Effect of afforestation and reforestation of pastures on the activity and population dynamics of methanotrophic bacteria. Appl. Environ. Microb. 73, 5153–5161. doi: 10.1128/AEM.00620-07
Singh, B. K., Tate, K. R., Ross, D. J., Singh, J., Dando, J., Thomas, N., et al. (2009). Soil methane oxidation and methanotroph responses to afforestation of pastures with pinus radiata stands. Soil Biol. Biochem. 41, 2196–2205. doi: 10.1016/j.soilbio.2009.08.004
St Pierre, K. A., Danielsen, B. K., Hermesdorf, L., D Imperio, L., Iversen, L. L., and Elberling, B. (2019). Drivers of net methane uptake across Greenlandic dry heath tundra landscapes. Soil Biol. Biochem. 138:107605. doi: 10.1016/j.soilbio.2019.107605
Subhajit, D., Dipnarayan, G., Sabyasachi, C., Abhishek, M., and Tarun, K. D. (2018). Methane flux dynamics in relation to methanogenic and methanotrophic population in the soil of Indian sundarban mangrove. Mar. Ecol. 39:e12493. doi: 10.1111/maec.12493
Sul, W. J., Cole, J. R., Jesus, E. C., Wang, Q., Farris, R., Fish, J. A., et al. (2011). Bacterial community comparisons by taxonomy-supervised analysis independent of sequence alignment and clustering. Proc. Natl. Acad. Sci. U.S.A. 108, 14637–14642. doi: 10.1073/pnas.1111435108
Sun, S., and Badgley, B. D. (2019). Changes in microbial functional genes within the soil metagenome during forest ecosystem restoration. Soil Biol. Biochem. 135, 163–172. doi: 10.1093/femsec/fiaa149
Tan, Z., Zhuang, Q., Henze, D. K., Frankenberg, C., Dlugokencky, E., Sweeney, C., et al. (2015). Mapping pan-Arctic methane emissions at high spatial resolution using an adjoint atmospheric transport and inversion method and process-based wetland and lake biogeochemical models. Atmos. Chem. Phys. 15, 32469–32518.
Tate, K. R. (2015). Soil methane oxidation and land-use change–from process to mitigation. Soil Biol. Biochem. 80, 260–272.
Täumer, J., Kolb, S., Boeddinghaus, R. S., Wang, H., Schöning, I., Schrumpf, M., et al. (2021). Divergent drivers of the microbial methane sink in temperate forest and grassland soils. Glob. Chang. Biol. 27, 929–940. doi: 10.1111/gcb.15430
van Loosdrecht, M. C. M., Lyklema, J., Norde, W., Schraa, G., and Zehnder, A. J. B. (1987b). Electrophoretic mobility and hydrophobicity as a measure to predict the initial steps of bacterial adhesion. Appl. Environ. Microbiol. 53, 1898–1901. doi: 10.1128/aem.53.8.1898-1901.1987
van Loosdrecht, M. C. M., Lyklema, J., Norde, W., Schraa, G., and Zehnder, A. J. B. (1987a). The role of cell wall hydrophobicity in adhesion. Appl. Environ. Microb. 53, 1893–1897. doi: 10.1128/aem.53.8.1893-1897.1987
Wagner, D., Pfeiffer, E. M., and Bock, E. (1999). Methane production in aerated marshland and model soils: effects of microflora and soil texture. Soil Biol. Biochem. 31, 999–1006.
Wen, X., Yang, S., Horn, F., Winkel, M., Wagner, D., and Liebner, S. (2017). Global biogeographic analysis of methanogenic archaea identifies community-shaping environmental factors of natural environments. Front. Microbiol. 8:1339. doi: 10.3389/fmicb.2017.01339
Whalen, S. C., and Reeburgh, W. S. (1990). A methane flux transect along the trans-Alaska pipeline haul road. Tellus B. Chem. Phys. Meteor. 42, 237–249.
Wilpiszeski, R. L., Aufrecht, J. A., Retterer, S. T., Sullivan, M. B., Graham, D. E., Pierce, E. M., et al. (2019). Soil aggregate microbial communities: towards understanding microbiome interactions at biologically relevant scales. Appl. Environ. Microb. 85, e00324–19. doi: 10.1128/AEM.00324-19
Wood, S. A., Bradford, M. A., Gilbert, J. A., McGuire, K. L., Palm, C. A., Tully, K. L., et al. (2015). Agricultural intensification and the functional capacity of soil microbes on smallholder African farms. J. Appl. Ecol. 52, 744–752.
Wu, J., Li, Q., Chen, J., Lei, Y., Zhang, Q., Yang, F., et al. (2018). Afforestation enhanced soil CH4 uptake rate in subtropical China: evidence from carbon stable isotope experiments. Soil Biol. Biochem. 118, 199–204.
Xie, C., Mao, X., Huang, J., Ding, Y., Wu, J., Dong, S., et al. (2011). KOBAS 2.0: a web server for annotation and identification of enriched pathways and diseases. Nucleic Acids Res. 39, W316–W322. doi: 10.1093/nar/gkr483
Yu, X., Yang, X., Wu, Y., Peng, Y., Yang, T., Xiao, F., et al. (2020). Sonneratia apetala introduction alters methane cycling microbial communities and increases methane emissions in mangrove ecosystems. Soil Biol. Biochem. 144:107775.
Yuan, M., Zhu, J., Wang, C., Wu, M., Sun, F., Han, X., et al. (2016). Latitudinal distribution of microbial communities in anaerobic biological stabilization ponds: effect of the mean annual temperature. Microb. Biotechnol. 9, 834–845. doi: 10.1111/1751-7915.12407
Zhang, L. Y., Adams, J. M., Dumont, M. G., Li, Y. T., Shi, Y., He, D., et al. (2019). Distinct methanotrophic communities exist in habitats with different soil water contents. Soil Biol. Biochem. 132, 143–152.
Zhou, J., Theroux, S. M., Bueno de Mesquita, C. P., Hartman, W. H., Tian, Y., and Tringe, S. G. (2022). Microbial drivers of methane emissions from unrestored industrial salt ponds. ISME J. 16, 284–295. doi: 10.1038/s41396-021-01067-w
Zhou, J. X., Sun, Q. X., and Yang, Y. F. (2010). Research onsustainable use of the middle and lower beach land of the Yangtze River. Resourc. Environ. Yangtze Basin 19, 878–883.
Keywords: CH4 flux, soil metagenome, methanogens, methanotrophs, soil particle size composition
Citation: Zhang Q, Tang J, Angel R, Wang D, Hu X, Gao S, Zhang L, Tang Y, Zhang X, Koide RT, Yang H and Sun Q (2022) Soil Properties Interacting With Microbial Metagenome in Decreasing CH4 Emission From Seasonally Flooded Marshland Following Different Stages of Afforestation. Front. Microbiol. 13:830019. doi: 10.3389/fmicb.2022.830019
Received: 06 December 2021; Accepted: 31 January 2022;
Published: 23 February 2022.
Edited by:
Steffen Kolb, Leibniz Center for Agricultural Landscape Research (ZALF), GermanyReviewed by:
Nadine Praeg, University of Innsbruck, AustriaDi Wu, Northeast Forestry University, China
Copyright © 2022 Zhang, Tang, Angel, Wang, Hu, Gao, Zhang, Tang, Zhang, Koide, Yang and Sun. This is an open-access article distributed under the terms of the Creative Commons Attribution License (CC BY). The use, distribution or reproduction in other forums is permitted, provided the original author(s) and the copyright owner(s) are credited and that the original publication in this journal is cited, in accordance with accepted academic practice. No use, distribution or reproduction is permitted which does not comply with these terms.
*Correspondence: Haishui Yang, yanghaishui@njau.edu.cn; Qixiang Sun, eme_caf@126.com