Modes and geometry of crustal-scale detachment folding in hot orogens—Insights from physical modeling
 Ondřej Krýza
 Prokop Závada
 Tan Shu3,4
 - 1Institute of Geophysics, Czech Academy of Sciences, Prague, Czechia
- 2Institute of Petrology and Structural Geology, Charles University, Prague, Czechia
- 3Centre for Lithospheric Research, Czech Geological Survey, Prague, Czechia
- 4State Key Laboratory of Isotope Geochemistry, Guangzhou Institute of Geochemistry, Chinese Academy of Sciences, Guangzhou, China
Detachment folding can be defined as the displacement and buckling of a competent layer above a rheologically weak horizon during tectonic shortening, frequently addressed in the context of salt tectonics. More recent studies have focused on influence of detachments in large-scale lithospheric deformation where the detachment horizon is represented by partially molten lower crust.
This study addresses the geometric, kinematic and dynamic behavior of crustal-scale detachment folds using heated paraffin wax as an analogue for partially molten lower crust. Various thermal and shortening rate scenarios were tested in order to characterize deformation patterns within hot orogens in general, and to find an appropriate range of temperature gradients and shortening rates for the detachment folding regime. Five different regimes of lower crustal deformation were identified: 1. Homogeneous thickening or bulging, 2. Short-wavelength folding, 3. Development of diapir-shape folds or ductile faults, 4. Detachment folding and 5. Formation of lower crustal finger-like protrusions.
Models are compared to various natural prototypes worldwide, in particular a series of metamorphic domes in the Central Asian Orogenic Belt (CAOB). Detailed analysis of the kinematic-dynamic evolution of the detachment folding scenario revealed an asymmetrical evolution of the folds associated with rotation of the limbs, as well as flexural flow of the lower weak mushy crust around the molten core. Pressure gradients in the fold cores saturated by melt controlled the sequential injections and outflows of partially/molten material between folds’ cores and the melt source layer at the base of the system. This resulted in accumulation of melt in the foreland of the accretionary zone, with higher melt absorption potential for newly developed folds. These observations may have significant implications for the development of pseudo-symmetrical metamorphic domes in the CAOB.
1 Introduction
The concept of detachment folding describes the displacement and buckling of a competent layer above a weak, typically low viscosity horizon during tectonic shortening (e.g., Scharer et al., 2004; Poblet et al., 1997; Storti and Poblet, 1997; Rowan, 1997; Mitchell and Woodward, 1988; Wiltschko and Chapple, 1977). By this definition, and based on the Biot-Ramberg theory (Biot, 1961; Ramberg, 1963; Biot, 1965), it is clear that the geometric properties of such folds depend on the rheological contrast between both layers or on a rheological gradient in a complex multilayer. Rheologically anisotropic multilayers were originally studied in relation to thin-skinned deformation and salt tectonics (e.g., Wiltschko and Chapple, 1977; Davis and Engelder, 1985; Bonini, 2003), and recently in association with lithosphere-scale deformation given an anatectic layer at the base of the crust as a weak basal décollement (Schulmann et al., 2008; Maierová et al., 2014; Lehmann et al., 2017; Krýza et al., 2019). The anatectic layer consists of partially molten crust comprised of migmatites, granulites and associated granitic melts at MOHO depths. Formation of the anatectic lower crustal layer may be the consequence of either a) the precursory extension and crustal thinning (typically in back-arc domain), which is followed by the compression stage (e.g., Collins, 2002) (Figure 1A), or b) emplacement/relamination of felsic crust beneath the lower crust of the overriding plate at MOHO depths (Hacker et al., 2011; Kelemen and Behn, 2016; Maierová et al., 2018) (Figure 1B). Scenario a) implies an increased thermal gradient induced by heat flux from the upwelling mantle, while scenario b) suggests that the relaminant which originates from the subducted plate provides a significant amount of radiogenic heat. Both mechanisms can be characterized by different thicknesses of the overriding plate or subduction wedge which leads to a different degree of deceleration during the collisional stage in response to the viscous resistance of the upper plate (Clark, 2012).
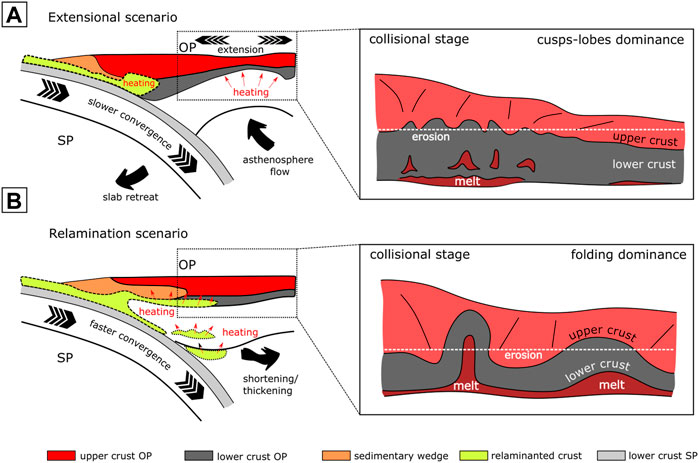
FIGURE 1. Examples of different subduction scenarios leading to building of hot orogens. (A) If the subducting plate (SP) is slower with dominance of roll-back, extension and crustal thinning occur and heat flux from the mantle soften the overriding plate’s (OP) crust. This slower scenario might lead to distributed heating without the development of a sharp detachment horizon. Thus the dominant style of bulk deformation is homogeneous thickening with smaller localized areas of melting rather than crustal-scale buckling. Faster convergence and a weak overriding plate (B) are assumptions for intra-crustal relamination (e.g., Maierová et al., 2018). The radiogenic heat production of the relaminant supports additional weakening of the lowermost crust and melting which is a good assumption for the detachment folding of the lower crust during late stage of collision.
Lehmann et al. (2017) suggest that detachment folding may represent an important regime contributing for vertical differentiation and horizontal amalgamation within the orogenic systems on Earth. In particular, the Central Asian Orogenic Belt (CAOB), the largest accretionary complex on Earth, contains several kilometer-scale migmatitic to granulitic magmatic-metamorphic domes, e.g., the Chandmann dome (Lehmann et al., 2017); Bugat dome (Cai et al., 2015) or Tseel dome (Jiang et al., 2012; Burenjargal et al., 2016; Hong et al., 2021). These structures were initiated in response to the early formative stages (Silurian-Devonian) of the Mongol-Altai zone, and amplified during closing of the Mongol-Okhotsk oceanic domain during development of the Mongol-Hingan orocline in the Permian-Triassic (Jiang et al., 2016; Jiang et al., 2019; Guy et al., 2021; Krýza et al., 2021). These dome-fold structures were interpreted as large buckle folds of the lower anatectic felsic crust enveloped by medium and low grade metasedimentary units. Crustal scale folding was associated with the inflow of partially molten granitic masses from MOHO depths and their redistribution parallel to the axial planes of the large scale dome-shaped folds (Lehmann et al., 2017; Krýza et al., 2019; Sukhbaatar et al., 2022). Similarly, exhumation of mafic rocks from lower crustal levels can be achieved by the same mechanism of compression and detachment folding. For example, in the Roc de Frausa massif in Pyrenees, the gabbro-diorite extrusions represent the core of a large buckle fold, mantled by migmatite and orthogneiss units (Aguilar et al., 2015). In the Holland’s Dome injection complex in Damara belt (South Africa), granitic melts migrated from the basal detachment layer through numerous sheets emplaced along the axial cleavage of a crustal-scale fold (Kruger and Kisters, 2016).
Detachment folding is one example of the effect of melting in orogens, which in general promotes mass transfer and crustal differentiation. Aside from large scale folding (e.g., Maierová et al., 2014; Lehmann et al., 2017), the impact of melt on deformation style in the orogens is also manifested for example by cusp-shaped folding and the development of local zones of vertical fabrics (Kisters et al., 1996), diapirism (Maierová et al., 2012) or ductile faulting (e.g., Hollister and Crawford, 1986; Lee and Lister, 1992).
In our study, we address the role of a mechanically weak partially molten crust on the mode of deformation in accretionary orogens using scaled analogue models. Although the effects of a thermally dependent rheology in accretionary analogues has been addressed in several previous studies (e.g., Chemenda et al., 1995; Wosnitza et al., 2001; Barraud et al., 2004; Luján et al., 2010; Boutelier and Oncken, 2011; Boutelier and Cruden, 2017), only a few studies deal with crustal-scale deformation during the orogenic stage of collision (e.g., Barraud et al., 2004; Luján et al., 2010). Additionally, the effects of different shortening rates and heating, which are critical for the development of various orogenic architectures, was not systematically addressed in the earlier studies. Thus, our experiments were carried out at various initial convergence velocities and initial heat inputs, which are considered to be the primary parameters controlling the development of accretionary systems (e.g., Faccenda et al., 2008) including the basal partially molten layer, represented by strain-rate dependent paraffin wax in our models.
Our study aims to quantify major geometric differences and trends in the architecture of these systems and to perform detailed kinematical analysis of folding in scenarios where melt-cored detachment folds are well-developed. This additional analysis can bring a new insight to the mechanics of large hot orogens where the strain is typically associated with development of magmatic-metamorphic domes in the compressional regime.
2 Model setup
The analogue models were performed using a narrow sandbox with a mobile heating plate confined between two glass walls and a backstop wall (Figure 2). The longitudinal, lateral and vertical dimensions of the model domain were 125 cm, 8 cm, and 3 cm, respectively. This corresponds to a natural prototype of an upper plate at a convergent margin with dimensions of 1,250 km, 80 km, and 30 km. Stratification of the crust corresponds to an upper sedimentary-metasedimentary crust and a lower migmatitic/granitic crust, represented by a 1.5 cm thick sand-fillite granular mixture and a 1.5 cm thick wax layers, respectively (see Supplementary material for the material properties).
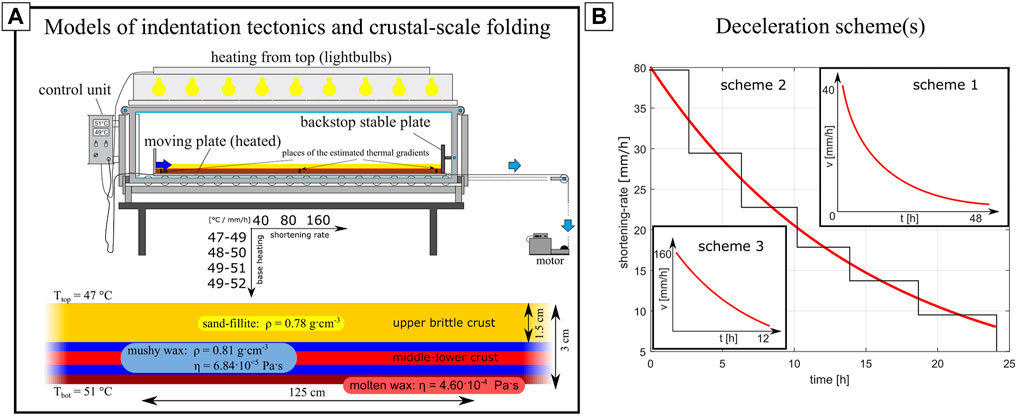
FIGURE 2. The model setup. Experimental apparatus and model properties (A) including dimensions, materials (values correspond to the base heating at 51°C) and strategy of modeling covered by variable thermal and initial shortening rates (T, V). The prefabricated wax prisms (lower crust in the model) were composed of several contrasting layers. Mechanically inert glitter and fluorescent wax particles were superposed at the frontal side of the prisms. The thermal gradients are marked by ∼ 0.07°C–0.1°C/mm at the sides and the center of the model domain, respectively. In the further text, we use a simplified notation as the ratio of averaged temperatures (T) to the melting point of the wax (Tm). Individual shortening schemes (B) as calculated for decelerated systems (see text and Supplementary material for more information). Implementation of deceleration was performed by splitting of curves to segments with constant piston velocities due to limitations of the stepping motor. For further information, follow the main text and see Table 1.
The apparatus is capable of producing thermal gradients in superposed layers before the experimental run. Here, the initial stability depends on temperature oscillation around the upper and lower limits which are adjusted by the thermostat (typical deviation is ± 0.15°C in our models). Basal heat flux is attained by input from the heating plate and surface temperature is maintained by the light bulbs mounted on the top of the apparatus.
2.1 Model thermal scaling
As for the prototype’s thermal gradients, we assume values covering a range of 20°C/km–70°C/km, typical for hot-ultra hot continental collision (Lee et al., 2004; Root et al., 2005; Hyndman, 2010; Gordon et al., 2012; Zhang et al., 2022). The highest values correspond to thinned crust and theoretical rapid fluid percolation which can lead to eventual local gradient of > 100°C/km (e.g., Clerc et al., 2015). These very high gradients may correspond to the hot and thin Archean (e.g., Flament et al., 2011) and Proterozoic (Spencer et al., 2021) orogens. Relaminated felsic material with high radiogenic heating at the thickened base of the crust (e.g., Maierová et al., 2012, 2014) is assumed to provide a slightly colder initial geotherm (< 20°C/km) than in the thinned lithosphere by extension (∼20°C/km–35°C/km with local gradient > 60°C/km; Zhang et al., 2022), but increased (radiogenic) heat input during progressing orogeny results in the later establishment of higher gradients. Due to inherent limitations of our model apparatus, and neglecting the development of an orogenic root at greater MOHO depths, we empirically implemented higher heating which corresponds to ∼600°C–1,000°C temperatures at the MOHO of natural hot orogens (e.g., Maierová et al., 2014; Audet et al., 2019; Puziewicz et al., 2019; Loucks, 2021).
In this study, we carried out a total of 12 models, where heating of the wax and granular sequences corresponds to four different thermal gradients (Figure 2A). These thermal gradients are designated for simplicity as: 1) cold models (T/Tm) ∼0.94, 2) moderately hot models (T/Tm) ∼0.96, 3) hot models (T/Tm) ∼0.98, and 4) very hot models (T/Tm) ∼1, where T is the average temperature [from the min-max temperature (as shown in Figure 2)] of the basal plate adjusted 2 h before the start and during the experimental run duration, and Tm is the melting point of the paraffin wax used as the analog for partially molten lower crust. The initial (idealized) thermal gradient in our models then corresponds to 0.066°C/mm—0.16°C/mm. Each set of thermal conditions is represented by a series of three experiments at different and progressively decelerating convergence rates, with an initial shortening rate at 40 mm/h, 80 mm/h and 160 mm/h (Figure 2B), respectively.
2.2 Model mechanical scaling
The model was scaled according to the principles of geometric and dynamic-rheological similarity (Hubbert, 1937; Sokoutis et al., 2005). The geometric similarity is described by the scaling ratio l*=2 × 10⁶ with respect to the 30 km original crustal thickness prior to the accretion and folding (e.g., in the Chandman dome area, Lehmann et al., 2017). The accuracy of the dynamic scaling was tested by calculating the non-dimensional numbers defined by the ratios between the forces acting on the models. For the ductile lower crustal layer, we calculated the Ramberg number (Supplementary Equation S1), representing the ratio between the gravitational and viscous forces (Rm; Weijermars and Schmeling, 1986; Sokoutis et al., 2005) as presented by Lehmann et al. (2017). Scaling of the brittle deformation in the upper crustal layer substituted by the sand-fillite mixture in the experiments was achieved by calculating the ratio between the gravitational stress and cohesive strength (RS Supplementary Equation S2; Ramberg, 1981; Sokoutis et al., 2005). Details of scaling for each layer and for all prescribed initial conditions are described in the Supplementary material and summarized in Table 1 (including the Ramberg numbers and their ratios).
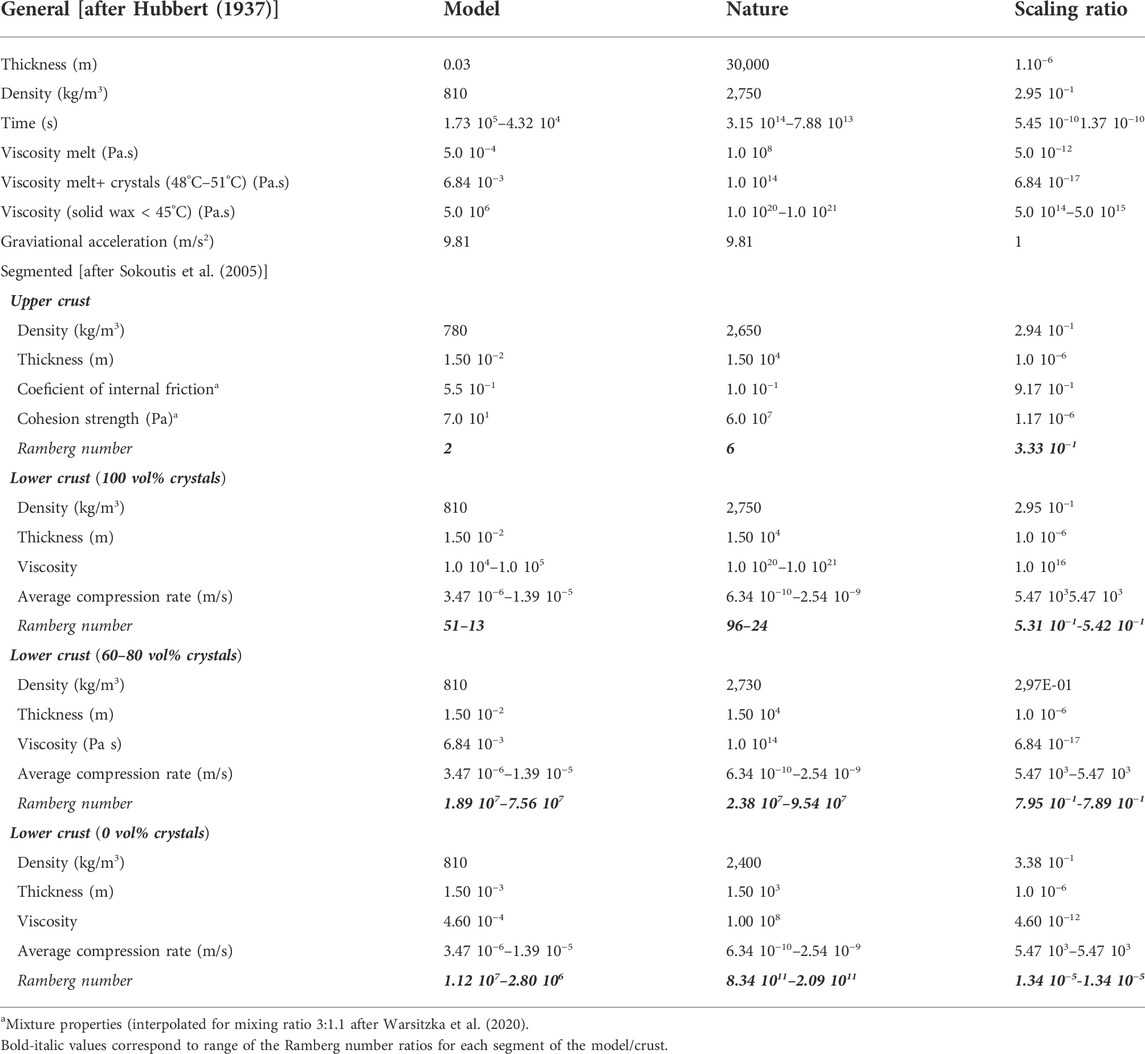
TABLE 1. Model parameters and scaling. General bulk scaling followed Hubbert (1937) while scaling according to individual segments was performed after Sokoutis et al. (2005), Lehmann et al. (2017) and Krýza et al. (2019). The associated Ramberg numbers are shown at the end of each section (for ranges corresponding to varied parameters). Segmented scaling is supposed to describe the model dynamical accuracy in terms of individual layers.
In summary, we can suggest that the rheological stratification of the granular mixture (sand and fillite) and the wax corresponds quite well to the rheological stratification in thermally softened accretionary orogens, where the lower crust is formed by migmatites. The partially molten wax successfully implements a viscosity gradient from the completely molten layer at the bottom of the lower crust to a partially molten layer close to the interface between the weak lower crust and brittle upper crust.
2.3 Deceleration scheme simulating increased coupling with the upper mantle
Natural collisional systems are not defined by constant bulk-strain rates nor bulk stresses. To reflect the response of non-linear (strain rate dependent) materials to deformation, systems maintain actual strains (and equivalently lithospheric strengths). In physical tectonic modelling, constant external forces are often employed to enforce shortening in the model domain, which is not exactly in correspondence with gravity controlled movement of slabs and their internal deformation response. To mimic the appropriate strain rate response (strength) of the model domain, the servo-motors are sometimes employed, as these can control bulk stresses (e.g., as in Wosnitza et al., 2001).
In contrast to the previous analogue approach presented by Krýza et al. (2019), we incorporated a progressive deceleration scheme (Figure 2B). This assumption is supported by work of Clark (2012), based on global marine magnetic data of the plate motions and inverse modeling. Clark assumed that collisional systems progressively decelerate due to the viscous resistance of a thickened plate with the underlying mantle. In our current work, we adapted this relationship for exponential deceleration such that it could be used in our experimental modeling routine (see details in Supplementary material). As a result of this implementation, our models have a complex dynamic evolution, but scaling against natural prototypes is more realistic.
2.4 Experimental procedure and model development
The models were pre-heated at ambient temperatures below the melting point of the paraffin (51°C–52°C) for 15 h–24 h to attain a stable thermal gradient across the thickness of the model domain (top temperature 46°C–47°C and bottom temperature to 47°C–49°C). Then, we superimposed the wax layers by colored layers of sand and fillite mixture heated to 47°C, and let the model domain relax for two hours. Finally, the models were shortened to 45%–50%. The variable parameters were the velocity and initial temperature that resulted in a grid of 12 models (Figure 2A).
2.5 Model post-processing
In order to understand the deformation mechanisms that accommodate the shortening of the models, as well as the role of rheological stratification and local transfer of melt in the models, we aimed to geometrically characterize the folded sequences and the amount of melt. We defined the total melt content, quantified from the model photographs at the end of the experiment, together with interface curvatures and tortuosity of selected particle trajectories. While the interface curvature parameter quantifies the folds’ geometry, tortuosity allowed us to evaluate the relative displacement of markers in equivalent fold limbs and to consider the role of progressive shortening on differential exhumation rates of adjacent points in opposite limbs of one fold, for example.
2.5.1 Content of melt and curvature of layer interfaces
For all experiments, we quantify the amount of the molten material visible below the folded mushy wax layer. We used image analysis tools from the Fiji software (Schindelin et al., 2012) on images with adjusted color contrast, because the melt domains lack the marker particles and stretched fluorescent wax shavings (Figure 3A; Supplementary Figure A2). The melt content values correspond to the areal extent of the melt domains as traced from the frontal side of experiments that contain less than approximately 10 vol% of paraffin crystals.
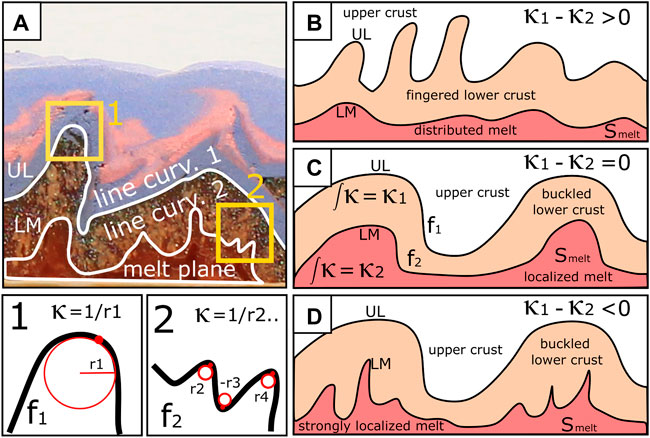
FIGURE 3. Principles of melt distribution and curvature analysis. Interfaces between model layers (UL, LM) are traced using the ImageJ (Fiji software) (A) and their line curvature (
The line curvature of layer interfaces is an important quantifier that characterizes the deformation geometry and reflects the degree of mechanical coupling between the lower crust and melt-rich regions. Here, this coupling means the ability of the melt-rich regions to conform to the distortion of the lower crust. We evaluated the line curvature and the length of curves that represent the folded traces of the model upper-lower crust (UL) and melt lower crustal (LM) interfaces, respectively (Figure 3A). Specific ratios of layer curvatures between both interfaces can reflect the style of folding, fingering or homogeneous thickening of the weak wax layer.
For example, the high (averaged) curvature reflects strain localization and crenulation of the surface or finger-shaped convolutions (Figure 3B). In contrast, low (averaged) curvature reflects the long-wavelength folds or gently deformed surface of layers (Figure 3C). We also define the difference of curvatures between both the sand-fillite (upper crust)–mushy wax (lower crust) interface (UL) and the mushy wax (lower crust)–wax melt layer interface (LM) (Figures 3B–D). High values of differential average curvature indicate a higher degree of convolution of the upper-lower crust interface in contrast to the lower-crust - melt interface. Small values of this parameter can indicate for example fingering of melt rich region into the mushy paraffin-wax and larger wavelength folding of the granular upper layer and mushy wax interface (for details see Supplementary material).
2.5.2 Tortuosity calculation
To quantify the space-time paths (x,y,t) of selected points and how they differ between the individual folds in the system and also within the selected single folds, we investigated paths of virtual markers (for further details see Supplementary material) and their tortuosity. The tortuosity of the particle is defined as the ratio of the absolute and relative distance along which this particle travels in the system
3 Results
The series of analogue models demonstrate the development of accretionary wedges with an array of differently shaped folds, disturbing both interfaces in the three-layer system of the granular layer, mushy wax layer, and wax melt (Figure 4). We first describe and quantify the global characteristics of the models performed at different velocities and thermal regimes that includes the planimetric modal analysis of melt content (Figure 4; Tab. 2) and slope of the accretionary wedge. We also present the folding analysis using the curvature of distorted layer interfaces and the tortuosity of selected particles in the sequence of developed folds for one particular model (model #8) with well-developed folds resembling the sections of natural magmatic-metamorphic dome structures. Although all our models represent hot orogens in terms of the high heat input through the lower crust (which results in widespread melting and ductile flow), we simplify the description of the models as relatively “coldˮ, “moderately hotˮ, “hotˮ, and “very hotˮ that correspond to T/Tm = ∼0.94, ∼0.96, ∼0.98, and ∼1, respectively (as defined in Section 2; Figure 2A).
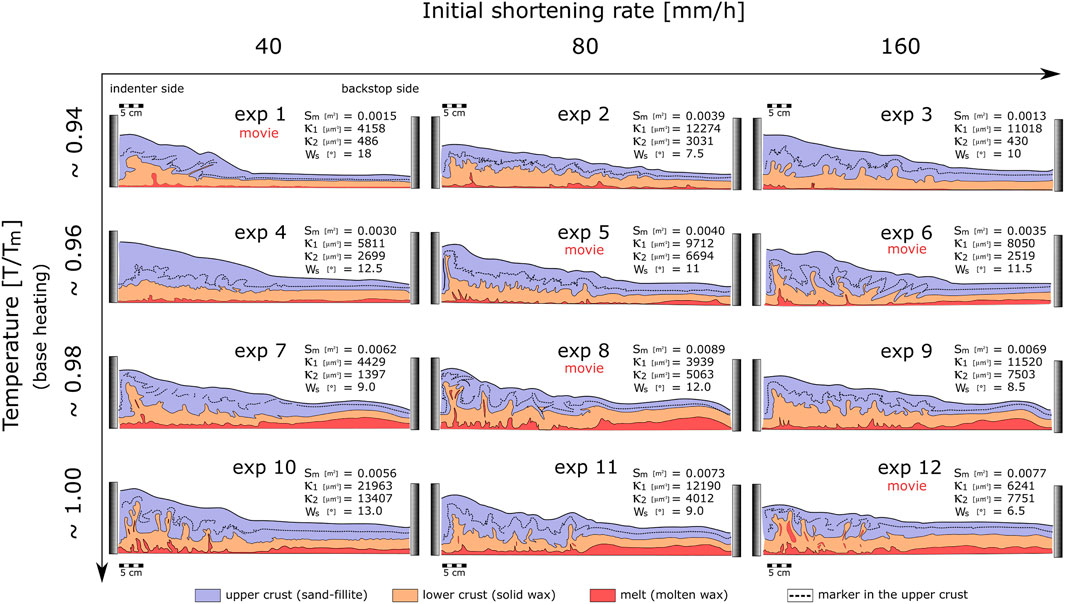
FIGURE 4. The resultant architecture of the performed experiments. Each experiment is associated with unique quantifiers that describe surface area of the melt (Sm), curvature of upper-lower crust boundary (
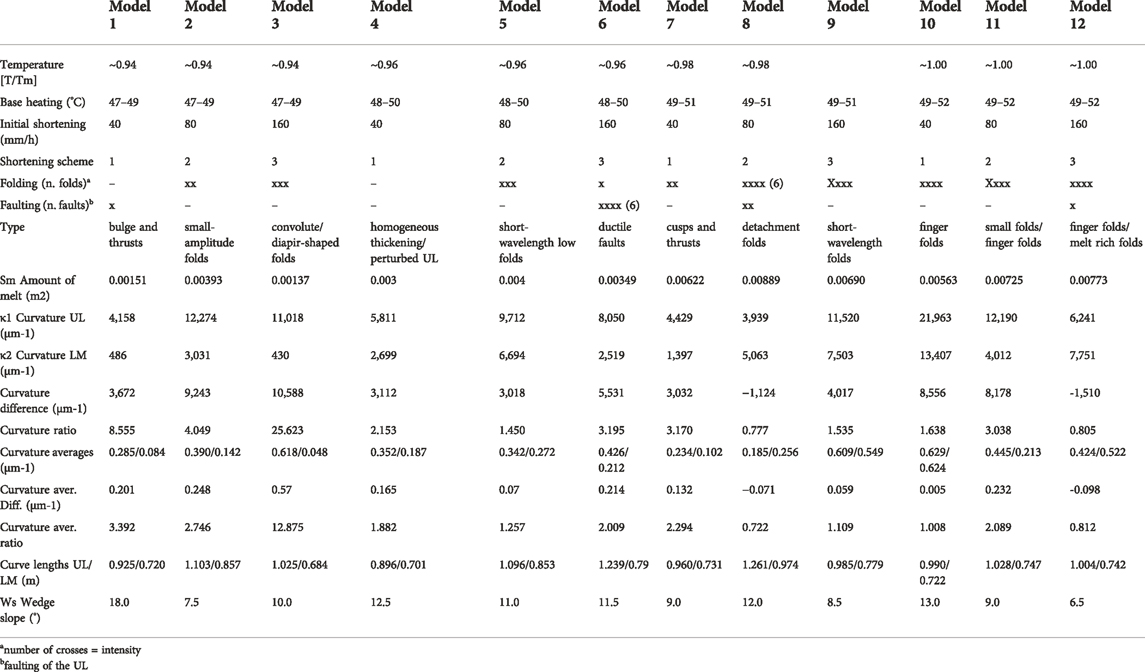
TABLE 2. The quantitative analysis of performed experiments.
3.1 Geometric overview
Models performed at low temperature conditions (T/Tm ∼0.94) and low shortening velocity (40 mm/h) display dominant homogenous shortening of the mushy wax layer (Figure 4; exp #1), forming an irregular bulge which is limited to the first 15 cm in front of the indenter wall. Several fore-thrusts developed in the upper brittle layer, one propagating from the frontal part of the mushy wax bulge was coated with a thin sheet of the mushy wax. The “lower crustalˮ bulge contains one finger-like protrusion of melt. In this sequence of models, the medium and high shortening velocities (exp #2 and #3) display an increased irregularity of the granular and mushy wax layer interface (UL) with local protrusions of melt from the base into the mushy layer. The fast model (160 mm/h; exp #3) reveals slightly longer wavelength (10 mm–60 mm) and higher amplitude (10 mm–20 mm) symmetrical diapir-shape folds of the granular-wax interlayer (UL), in contrast to the medium velocity model (80 mm/h; exp #2). From all three experiments, exp #2 achieved the maximum integrated curvature
The second set of models with various shortening rates at T/Tm ∼ 0.96 (‘moderately hot models; exp #4–#6) are characterized by increasing wavelength and amplitude of the UL perturbations towards the fast shortening conditions (exp #6). While in the slow velocity models (40 mm/h; exp #4), this interface is gently perturbed (typical amplitude of the UL perturbation is below 2 mm, in the medium velocity model (80 mm/h; exp #5), the same plane is disturbed by a series of ∼1 cm long and low amplitude folds and a single backthrust coated by the mushy wax. The internal structure of the high velocity model (160 mm/h; exp #6) is characterized by a ‘V-shape’ structure of mushy wax domes or finger-like protrusions along a series of backthrusts and forethrusts (typically 3 cm–6 cm long). Readily apparent is the bimodal vergence of these structures towards the indenter and backstop, with a transition in approximately the first third of the model length. This deformation style is also partly shown in the high temperature models. Protrusions of the molten wax into the mushy wax are visible in all three models (exps #4–#6) and their wavelength (1 mm–50 mm) and amplitude (< 1 mm–30 mm) is proportional to the scale of the overlying mushy wax folds enveloped by the brittle granular layer. A large pocket of melt underlies the mushy wax layer in the foreland of these models (right side). An increasing scale and complexity of UL features (wavelengths, amplitudes) with increasing shortening rate is also reflected by higher UL curvature (maximum for exp #5; ∼9,712 μm−1) and longer length of the UL (maximum for exp #6; 1.239 m). The slope of the taper wedge is similar for all three experiments (Ws = ∼12°C).
Models performed at “hot conditionsˮ (T/Tm ∼0.98; exp #7–#9) display a distinct and continuous layer of melt at the base of the models and a broad bulge filled with melt in the frontal part of the model domain. A regular array of cusp-like folds marks the “slowˮ model (40 mm/h; exp #7). The first fold in the fold array of this model is identified as a mushy wax protrusion along a backthrust. Moderate velocity shortening (80 mm/h; exp #8) resulted in a development of six domes of mushy wax enveloped by the upper cohesive granular layer. Multiple fingers of melt also intrude into the cores of mushy wax folds at the bottom of the model. Some vertically elongated melt pockets also coat the axial planes of the first two folds in the array. An equivalent model, performed at “slowˮ conditions showed homogeneous thickening of the mushy wax layer decorated with an array of small wavelength cusp or finger shaped folds at the interface with the sand-fillite layer. In this series of models, the UL and LM curvatures have maximum values for exp #10 (
The last sequence of models carried out at “very hotˮ conditions (T/Tm ∼1), displayed a series of narrow finger like protrusions of mushy wax into the brittle upper layer at all compression velocities (models #10–12). Another feature, distinct in models #10 and #12 are numerous protrusions of wax melt into the mushy wax layer. Some pockets of melt also became trapped along the axial zone of the first 1-3 folds in the array in front of the indenter, which is more obvious in faster experiments (exp #11 and #12). For these experiments, it is typical that the UL curvature decreases with increasing shortening rate. The maximum value
Movies of selected experiments in the .avi format (for contrasting evolution styles) are stored in the Supplementary material (“exp1-Style1”, “exp5-Style2”, “exp6-Style3”, “exp8-Style4” and “exp12-Style5”).
3.2 Melt volume and differences in interface curvatures
The amount of melt in the paraffin wax layer is proportional to the degree of heating of the lower crust and thus can be considered as a global model parameter. Another global parameter of the models is the curvature of the interfaces between individual layers. We compare the average curvature values for the upper-lower crust interface with the lower crust-melt interface. Figure 5 displays how the melt amount and difference of curvatures of the layer interfaces varies in the models with respect to their initial temperatures and compression velocities (both parameters are also listed in Table 2). The highest amount of melt is displayed in “hotˮ and “very hotˮ (T/Tm ∼0.98–1) models for moderate and fast average shortening velocities (80 mm/h–160 mm/h). Experiment #8 contains the absolute maximum amount of melt from all experiments, likely promoted by folding of the mushy wax associated with melt inflow along the axial planes of individual folds and by additional melting of the progressively buried limbs of sequential folds (see Section 4 below). Furthermore, the “hot to very hotˮ (T/Tm ∼0.98–1) and “fastˮ (80 mm/h–160 mm/h) experiments contain trapped melt in the isolated finger shaped folds that were pinched-off from their source mushy wax layer (exps #11 and # 12; Figure 4).
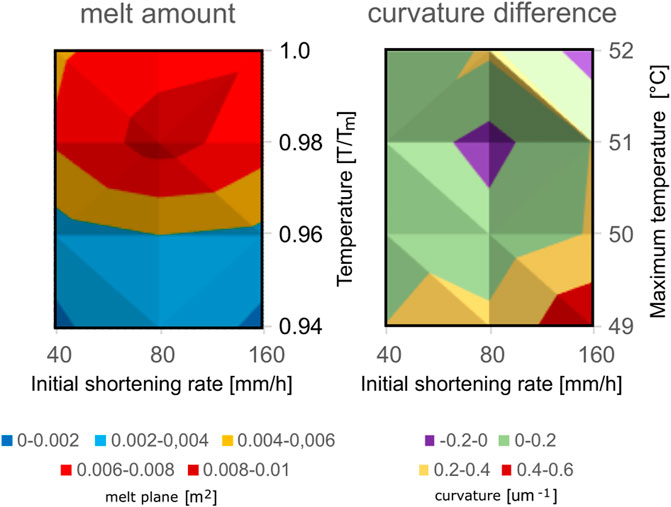
FIGURE 5. The contour plots of the melt amount and curvature difference corresponding to the initial conditions of investigated experiments.
Experiments which are slow (40 mm/h) and warm (T/Tm ∼0.98–1) display relatively small differences in average curvature of both investigated layer boundaries (UL, LM), typically (−0.2 μm−1–0 μm−1) (Figure 5). This reflects ingress of melt along numerous discrete channels in the axial parts of developing folds. In contrast, experiments performed at low heating (T/Tm ∼0.94) and higher compression velocities (80 mm/h–160 mm/h) display high positive values of curvature difference (> 0.4 μm−1). The higher curvature difference is probably attributed to the high degree of mechanical coupling between the upper brittle layer and the lower mushy wax layer. The maximum detachments (30 mm–50 mm uplift of the lower crust from the base of model) and melt inflows to fold cores occur for exp. #8 which is characterized by the minimum negative values of average curvature difference (−0.071 μm−1). Exp #12 is then represented by maximum negative values of UL and LM average curvature difference (∼ 0.1 μm−1).
The relative length of the UL interfaces is one of the parameters that further relates to the balance between the components of folding and homogeneous thickening (see Table 2). If deformation is dominated by folding, the UL is arcuated and maintains a “constantˮ length, while the component of homogeneous thickening prevails when the UL is clearly shortened and only slightly distorted with generally small curvatures. Thus, to distinguish the differences in deformation style, one must consider the UL length together with values of
3.3 Detachment folding–From buckling to vertical stretching promoted by melt
In order to understand the kinematics, deformation partitioning in the layered model and the role of melt in amplification of the melt-cored, crustal scale detachment folds, we analyzed in detail the deformation field of experiment #8, where similar folds cored by molten wax are particularly well developed. We employed the tracing of virtual markers positioned in the soft mushy wax layer at a regular grid of nine points and at four sequential folds (folds F2-F5 in Figures 6, 7). The nine markers (namely M1-M9) symmetrically cover the area where the selected folds start to nucleate and are centered at their axial trace lines. The initial time-step (initiation of markers) was evaluated individually for each fold based on the first significant ascent of the markers. The particles were then traced along all time-frames until the end of the experiment. Individual paths for spatial (x-y) position and time-spatial (t-y) evolution, as well as finite positions in the geometry of the model domain, are displayed at Figures 6, 7. For both types of paths (space, time), associated tortuosity for each marker was calculated.
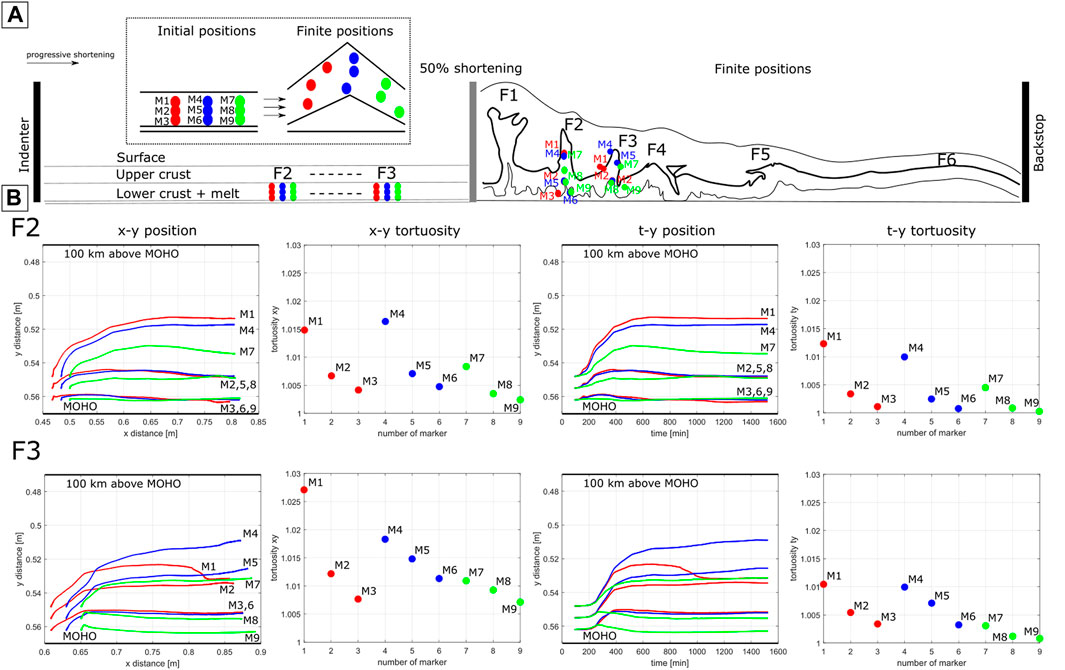
FIGURE 6. Numerical analysis of fold kinematics in Experiment #8 (folds F2 and F3). (A) The predefined positions of traced markers are shown in schematics of the model’s initial and finite state (red-blue-green markers). (B) Diagrams on the left display x-y (space-space) position of selected markers for all time-steps and associated tortuosity for their paths. Diagrams on the right display t-y (time-space) evolution and associated tortuosity for the same markers. Vertical and horizontal space dimensions are shown in [m] and referential origin of coordinates corresponds with position out of displayed area (origin corresponds to the PIV coordinates origin). To illustrate the proportionality with respect to natural systems, we marked the MOHO level and the position 100 km above the MOHO into diagrams (erosion and sedimentation is not simulated in our models). For further information about methodology and results follow the main text and Supplementary material.
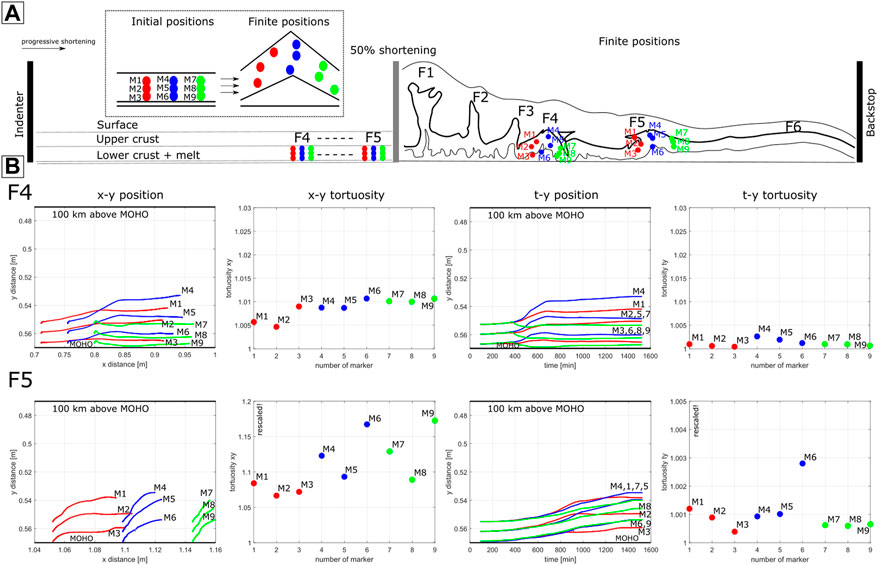
FIGURE 7. Numerical analysis of fold kinematics in Experiment #8 (folds F4 and F5). For details see caption associated to Figure 6 and main text.
Folds situated closer to the indenter (F2 and F3, Figure 6) typically display greater tortuosity for the left limbs and lower tortuosity for the right limbs. This trend is the same for their space positions (x-y) as well as for their degree of translation in vertical direction (t-y). With increasing initial depth of the markers (M3, M6, M9), the tortuosity is smaller. This reflects the increased complexity of the marker paths from bottom to top in the soft wax layer. The middle and bottom markers M8 and M9 in the fold F3 also have the lowest elevation, and the final position is even lower than their original position. In general, right limbs of both folds are first elevated to later subside to the same or lower level than the original position of these markers. This path is also visible for marker M1 of the fold F4 (Figure 6; compare x-y and t-y diagram space-time relation of exhumation-burial).
Folds which are situated closer to the backstop (F4 and F5, e Figure 7) display a slightly different evolution of the marker paths than the F2 and F3 folds because they evolved over a shorter time period. These folds display an opposite symmetry of the tortuosity in both respective limbs than in folds F3 and F4—the tortuosity in their left limbs is generally smaller than the tortuosity of the right limbs and axial traces. Moreover, the minimum values for the x-y evolution correspond to the middle-level positioned markers (M2, M5, M8), and the minimum t-y values are associated with the lower markers M8 and M9 in the right limbs (Figure 7). While the right limb of the F4 fold reveals descent (the final position of markers M7-M9 is even deeper than initial), the corresponding fold axial zone and the left limb progressively rise. Fold F5 is characterized by higher tortuosity of the x-y paths given by decreased difference between x and y displacement (typical for the shorter runs). This trend is also visible in the t-y paths which display relatively simple ascent and thus lower t-y tortuosity (one order difference in the second decimal place against values typical for the folds F2-F4; compare Figures 6, 7).
4 Discussion
The presented experiments illustrate the various deformation modes in crustal scale accretionary wedges deformed at variable thermal conditions (T/Tm) and shortening rates (V). These deformation modes are clearly controlled by the rheological stratification of the paraffin wax and therefore the basal temperature and the heat gradient, because the rheology of paraffin wax is strongly thermally dependent (see Supplementary Material, Section 2). We can expect a transition between elasto-plastic, visco-plastic and purely viscous behavior downwards in the 1.5 cm thick wax layer, depending on the initial temperature of the model. At low heating (T/Tm ∼0.94), the paraffin wax obeys a transition from relatively high viscosity material in the upper part (∼105 Pa·s) to low viscosity mushy layer (∼102−3 Pa·s) containing a small amount of melt at the bottom (∼10−3 Pa·s), with rheology dominated by elasto-plastic and visco-plastic behavior. In contrast, the very hot models (T/Tm ∼1) consist of a homogeneously heated soft mushy wax close to the melting temperature, characterized by visco-plastic to purely viscous behavior. The rheological anisotropy of the wax, dictated by the thermal gradient, clearly controls the dominant style of deformation.
We correlate the dominant deformation styles of the experiments, considering the influence of experiment duration for a given thermal gradient, and compare them with natural prototypes in the context of large orogens. In particular, we discuss the kinematic and dynamic aspects of the detachment folding above the molten lower crustal layer and related geodynamic implications in the context of the Devonian and Permo-Triassic doming in the Central Asian Orogenic Belt (CAOB).
4.1 Geometry of orogens—Role of heat input and convergence velocity
According to the results from the geometrical comparison of the individual experiments (Figure 4), we suggest that the increasing thermal input generally leads to folding during compression, and converges to development of narrow magma fingers enveloped by higher-viscosity mushy lower crust. On the other hand, the increasing speed of shortening promotes buckling of the lower crust and is linked with increased wavelength, or distance between the fold hinges (local maximums and minimums of the UL), thus decreasing the total amount of folds (compare exp #2 and #3 or exp #7 and #8 at Figure 4). From these general observations and based on the curvature and melt distribution analysis (Figure 5), we distinguished 5 major deformation styles (Figure 8): homogeneous thickening (bulge, cusps), homogeneous thickening (short-wavelength folds), ductile faulting, detachment folding and lower crust fingering (movies from representative experiments are in the Supplementary materials).
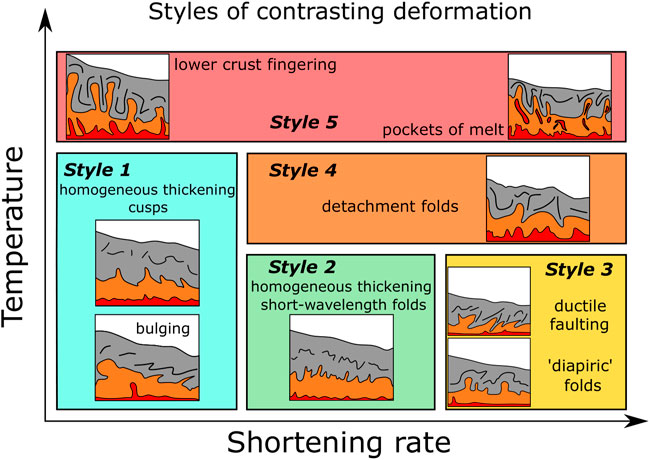
FIGURE 8. Styles of characteristic deformation corresponding to fields in V-T matrix.
Style 1 and 2 (Figures 8, 9A,B) are dominated by bulging and/or homogeneous thickening of the mushy wax (lower crust) for low T/Tm ∼0.94 (exp #1, #2 #4, #5, #7; Figures 5, 8). At a higher degree of heating (T/Tm = 0.98; exp #7), typical cuspate-lobate folds develop at the interface with the upper brittle layer, while bulging behind the indenter typically occurs only for the slow shortening rate (40 mm/h; exp #1) and “coldˮ (T/Tm ∼0.94) scenario. A similar deformation style was manifested in the numerical simulations of Li et al. (2010), where the bulging of crustal material is focused at the contact between the converging plates. This bulge can be associated with development of narrow, parallel shear zones. The result of this style of deformation (as in the exp #1) is geometrically similar to the thick-skinned accretion of the Cordillera Frontal Andean orogeny (e.g., Turienzo, 2010; Dal Zilio et al., 2020). However, in our conditions it would correspond to prototypes with a relatively thicker crustal segment. All experiments of Style 1 (i.e., exp #1, #2, #4, #5 and #7) have only a few (or zero) significant protrusions of partially molten material into the upper brittle layer, and melt layer serves mainly as the décollement. Except for experiment #1, the upper-lower crust interface is characterized by numerous cusp-shaped folds. The wavelength and amplitude of these structures are controlled by thermal-convergence conditions (as is visible with transition to Style 2). Whereas increasing thermal input results in the long wavelengths and high amplitude cusps (exp #7), increasing shortening rate promotes a decrease in the wavelength and amplitude of the folds, which tend to be regularly distributed throughout the deformed sections (exp #5, typical for the Style 2) (e.g., Aerden and Malavieille, 1999; Figure 9A). In contrast, when the bulk strength is lower due to increased temperature, but strain-softening is insufficient due to slow shortening (as in the exp #7; Style 1), instabilities grow to low-amplitude cusp-shaped antiforms. This style is manifested by vertical extrusion of high-grade rocks such as in the Okiep Copper District in South Africa (Kisters et al., 1996; Figure 9B), for example. The UL irregularities in Style 1 and 2 have generally a similar pattern to low-amplitude cuspate-lobate geometry, typical for buckling above a homogeneously thickened weak layer (similar as in Currie et al., 1962). It should be noted that the slope of the accretionary wedge (Ws) is maximized for slow experiments where the components of homogeneous thickening and bulging dominate.
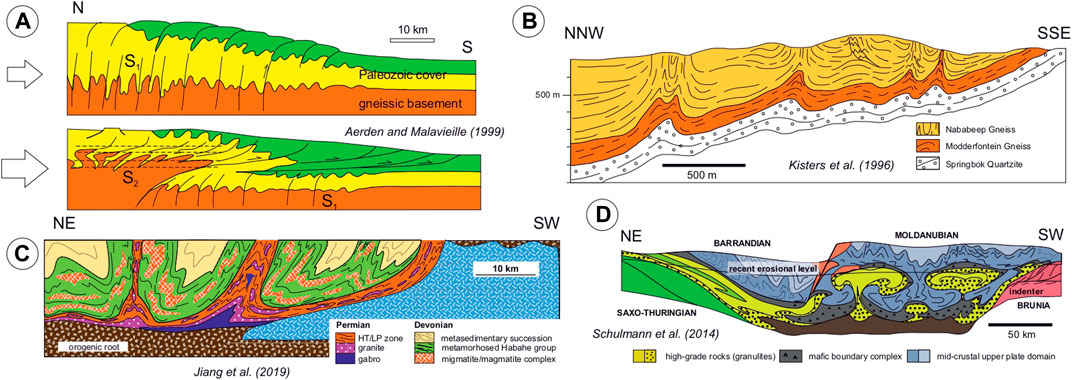
FIGURE 9. Sections through orogens with comparable folding styles to analogue models in this study. All figures are redrawn and simplifed from the original publications. (A) Regular short wave-length folding in the first stage of the Variscan Montagne Noire corresponds to homogeneous thickening Style 2 in Figure 8. High temperature metamorphic conditions culminated in widespread migmatization of the basement during uplift and decompression. Development of the nappe is associated with gravitationally induced spreading of the orogen (Aerden and Malavieille, 1999). (B) Cusp-like folds in the anatectic granite-gneiss sequence folded during granulite facies metamorphism (Kisters et al., 1996), corresponds to Style 1 (Figure 8). (C) In the Chinese Altai, anatectic high-temperature lower crustal rocks with vertical fabrics alternate with metamorphosed metasediments in synclines (similar to Style 4, Figure 8; after Jiang et al., 2019). (D) A section through Bohemian Massif with diapiric fold-like protrusions of the partially molten relaminated lower plate felsic crust into the middle crustal metamorphic rocks of the upper plate (Moldanubian and Teplá-Barrandian; Schulmann et al., 2014). This orogen is linked to the ‘very hot’ Style 5 (Figure 8). All figures are redrawn/modififed after originals from the cited articles.
Style 3 (Figure 8) reflects a specific style of folding and faulting which occurs for fast initial convergence (160 mm/h) and relatively cold to medium temperature gradient conditions (T/Tm ∼0.94–0.96). Folding occurs only for the upper part of the lower crust, which is typical with sequence of diapir-shaped (convolute) folds (exp #3, Figure 4) characterized by longer wavelengths than fold in slower scenarios. This model is linked to a small amount of melt (Figure 5; Table 2) distributed along a very thin layer at the bottom of the lower crust. The low thermal gradient and corresponding rheological stratification suggests transition from a thin, viscous layer at the bottom to a plastic region above which the yield strength will progressively increase towards the interface with the upper crust. Fast shortening then supports isothermal exhumation of the heated lower crust and formation of symmetric diapir-shape folds. A similar geometric and kinematic pattern is typical for convoluted folds described e.g., by Rossetti (1999). In contrast, exp #6 (Figure 4) with higher degree of heating (T/Tm ∼0.96) and increased thermal gradient in the upper part of the lower crust displays elongated protrusions in a fan-like pattern compatible with bimodal vergence of the accretionary system (similar to some models of Smit et al., 2003). This is attributed to the presence of a thin layer of a material with higher yield strength at the top of the lower crust than in its softer bottom part. This thin layer supports the formation of ductile faults that propagate into the upper crust and accommodate the ascent of the compressed weaker and mushy lower crust along these faults. This behavior is caused by a combination of increased bulk strain rate associated with fast initial shortening, and a sharp gradient of strength in the lower crust (due to increased heating of the lower crust). This results in sharp strain gradients and localized strain-softening, which is also typical for microcrystalline waxes (e.g., Neurath and Smith, 1982). Nonetheless, a similar geometry is also visible in simulations of Burg and Schmalholz (2008) which include viscous heating, but for a colder crust. In those models (in contrast to our models), viscous heating supports local thermal perturbations and weakening of the crust, which leads to strain localization along fore-thrusts and back-thrusts (simulations with both plastic and viscous strain rates, contributing to heating). In our models, weakening is also caused by a larger (gently perturbed) layer of the melt at the base which additionally supports thermal weakening and ductile faulting. However, the melt is only sporadically localized in the final shapes of mushy crust protrusions. Increased dominance of detachment folding can be expected for the thermal setting of Style 3, but for a rapidly increased and constant shortening rates (as shown in Krýza et al., 2019 for extremely fast shortening rates–the exps #16 and #17 in the Supplementary materials) where higher yield strength in the upper part of the lower crust supports buckling.
Style 4 (Figures 8, 9C) is characterized by typical large-scale folding above a thicker basal melt layer (for T/Tm ∼0.98 and V = 80 mm/h–160 mm/h). With increasing shortening rate, the typical detachment folding regime results in the development of high-amplitude and long-wavelength folds. High melt content in individual folds and a negative curvature difference between the upper-lower crust and melt-rich lower crust interfaces is controlled by pressure gradients and porous flow in the mushy wax. First, low pressure below the amplifying folds soaks melt into their core zones. Then, during the fold locking stage, the melt is injected upwards along the axial planes of folds and partly evacuated backwards into the melt source layer [similar to the mechanism described by Krýza et al. (2019) and Lehmann et al. (2017)]. Melt injection along the steep limbs of the folds facilitates vertical stretching of the folds during the ongoing horizontal compression. With progressing compression, melt is pushed back to the source layer situated beneath the folds or supports the vertical extrusion of surrounding mushy material. Axial zones of folds enriched in melt mechanically correspond to high-mobility zones with a horizontally increased pressure gradient and vertical stretching promoted by low viscosity melt that serves as a lubricant. This scenario is similar to the tectonic evolution of the Lugian unit in the Bohemian Massif during Variscan orogeny (e.g., Figure 3 in Maierová et al., 2014) where the compressional exhumation was associated with buckling of the orogenic lower crust. Another example is the development of magmatic-metamorphic domes in the CAOB (Figure 9C) where intruded granitic masses are mantled by metasediments that grew in a compressional regime (e.g., Jiang et al., 2016; Lehmann et al., 2017; Sukhbaatar et al., 2022). At the maximum shortening rate, fold architecture is transformed to higher-amplitude, shorter-wavelength folds with smaller content of melt. In this case, the bulk distributed deformation in the upper part of lower crust dominates, and melt transfer into the core zones of the folds is less effective. This is associated with the development of smaller and discontinuous detachment horizons (beneath the anticlines) of the lower crust that results in relatively smaller melt-rich areas. It is possible to speculate that for increasing shortening rate (higher than in our experimental grid), the model domain will converge to behavior of Style 2 with increased dominance of homogeneous thickening and later to Style 3 with development of ductile faults (compare exp #13–#15 in the Supplementary material).
Style 5 (Figures 8, 9D) is typical for very intense heating (T/Tm ∼1) which results in rapid amplification and development of narrow and locally pinched finger-shaped folds containing elongated melt pockets. As the model domain is significantly heated and the lower crust becomes weak and rheologically homogenous, the variation of the amplitude and distribution of the folds is small. This is explained by the primary role of heating, while the effect of shortening rate on finite geometry is secondary for the range of selected initial shortening rates. On the other hand, the importance of the shortening rate is reflected by the increasing amount of isolated melt pockets in the upper parts of the folds. Furthermore, in nature, a combination of the fold geometry (narrow, thin), high content of melt distributed inside the finger-shaped folds (very weak lower crust) and progressively decreased convergence rate can contribute to the crustal-scale diapirism of the lower crust (Figure 9D). However, the diapiric component of bulk deformation based on Rayleigh-Taylor instability is not within the scope of presented models due to limited scaling of gravitational potential and thus is only speculative. An appropriate example of different behavior in contrast to “Style 4” can be seen in the Moldanubian unit in the Bohemian Massif, where such a high heat input could arise from a relaminated felsic lower crust and might induce trans-crustal diapirism (compare Figures 9C,D) leading to exhumation of HP-HT granulites (e.g., Lexa et al., 2011; Schulmann et al., 2014; Maierová et al., 2014).
4.2 Kinematical-dynamic evolution of magmatic-metamorphic domes–Implications for the CAOB
Lehmann et al. (2017) and Krýza et al. (2019) discuss the development of crustal-scale detachment folds as an important mechanism for building the magmatic-metamorphic dome complexes in accretionary orogens, for example in the CAOB. Krýza et al. (2019) distinguished basic evolutionary stages of such folds/domes and linked them to the melt migration style and magnitude of material fluxes inside the individual folds (which depend on fold position in a sequence). The current study further illustrates that the style of buckling and fold amplification is also characteristic only for a limited range of thermal and convergence parameters. We suggest that the kinematics of fold amplification in decelerated systems is more complex than predicted in the previous studies for constant bulk strain rates. The evolutionary stages distinguished by Krýza et al. (2019) are: 1) “Rapid fold amplification”–related to an influx of melt driven by underpressure developed below the folds’ crestal domains, 2) “Upright folding”–and high-temperature vertical fabrics (associated with melt injections), 3) “Fold locking and necking”–linked with vertical stretching of the partially molten material (mushy wax/anatectic crust) and melt flow back to the source region beneath the fold, and 4) “Post-buckle flattening”–marked by minimum migration of melt between axial planes and source at MOHO depth.
In summary, the described evolution of the folds illustrates the progressive transition of the folds from the buckling stage in the foreland part of the model to homogeneous thickening as the folds become incorporated in the thickened domain just behind the indenter. With exp #8 as an example (Figures 6, 7), the first buckling stage is well reflected by the small difference of x-y and t-y tortuosity for opposite limbs of progressing fold F4 (Figure 7). This is in agreement with symmetrical amplification and faster strain-rates (3 times higher than at the beginning of last third model’s duration) and dynamically closer to settings in the experiment described by Krýza et al. (2019). In the case of the fold F5, our analysis revealed asymmetrical amplification of the fold in terms of material migration along the y-direction (left limb migrates faster but elevations are comparable). The second stage of fold development is associated with homogeneous thickening and asymmetrical vertical stretching of the folds in front of the indentor (naturally as a response to slower shortening–also typical for the first stage of exps #1, #4, #7). As a result, the “matureˮ folds (F2 and F3), which are developed first in the sequence, undergo more complex evolution as the verticalized lower crust layer in the limbs progressively “overflowsˮ their hinge zones in clockwise motion. Tortuosity of markers positioned in the upper parts of the soft layer is higher, as their path traces (circumscribe) a larger arc, in contrast to lower situated markers. This illustrates rotation of the whole fold during an extended period of time of their development (Figure 10A). The rotational movement was first observed by Krýza et al. (2019) in the vorticity diagrams, however, without the aforementioned kinematic analysis and reflection of variable bulk strain rates (typically ∼3.6.10−5 s−1–2.2.10−6 s−1 in this study; ∼1.3.10−4 s−1 in Krýza et al., 2019).
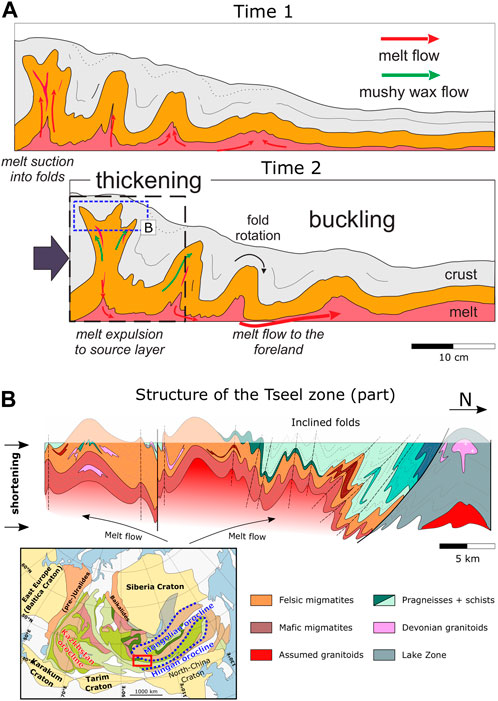
FIGURE 10. (A) Schematics of magmatic-metamorphic dome development for two stages of shortening (Time 1 and Time 2). During the first stages, the amplification and melt intake (pumping-up) to the fold cores dominate while during the later stages, folds are necked and melt is pushed back to the source region (illustrated as ‘Time 1’). With increasing time, the firstly developed folds are squeezed in a massively thickened part of crust (dashed line) and the limbs on the right are buried to the melt source region (‘Time 2’). Blue dashed rectangles mark the areas which are possible to compare with the section in panel (B). (B) Natural example of the magmatic-metamorphic domes in the Tseel region of the Mongol-Altai zone situated in the Central Asian Orogenic Belt. The position of the Tseel zone (and other domes: Bugat, Chandmann) is marked by red rectangle on the global map. Section represents a thin layer of the upper/middle crust, where interface between mafic-felsic migmatites and surrounding metamorphic units geometrically developed fold-dome structures. Inclined folds are typically in the foreland of sequence (for details see text and Sukhbaatar et al., 2022). The global map was modified after Parfenov et al. (2003) and Krýza et al. (2021). A simplified section through the Tseel zone was redrawn after Sukhbaatar et al., 2022 with permission of the authors.
According to this combined kinematic and dynamic analysis we can define an important mechanism for magma transfer, which includes the stages of pressurization and horizontal migration between developed domes. During the buckling stage (Time 1; Figure 10A), when the lower mushy crust is detached from the mantle, the core of the fold is depressurized and melt is pumped-up along an axial trace from the melt source beneath. When horizontal shortening starts to prevail (Time 2; Figure 10A), the fold amplifies, becomes locked and pinched as the portions of melt are pumped back to the source layer where it migrates towards the foreland of the fold sequence. At this moment, the right limb is buried down to a partially molten source while the left limb is exhumed. In the last stage, the fold is shortened and vertically stretched (Figure 10A). This results in accumulation of a larger portion of molten material, which is redistributed towards the foreland of the collisional system along the array of sequential folds, by “fold pumpingˮ. At the same time, the degree of vertical melt transfer is decreasing with progressively increasing distance from the indentor, and the maximum melt content is spatially distributed in the form of horizontally elongated and gently arcuated pools ponding at the base of the models close to the backstop.
These observations are in agreement with some structural and metamorphic patterns of the domes (Chandmann, Bugat, Tseel) developed in Mongol-Altai zone of the CAOB that consist of magmatic-migmatite rocks enveloped by low to medium-grade metasediments (Jiang et al., 2015; Lehmann et al., 2017; Sukhbaatar et al., 2022). Rotation during later stages of dome development, as displayed in our models, might be manifested in the asymmetric zonality of the domes in their horizontal section, with dominantly higher grade rock facies facing the indenter. Such structural patterns can be seen in the S-N section through southern part of the Mongolian-Altai Zone, namely in the Tseel terrane (Sukhbaatar et al., 2022; Figure 10B). However, this zonality is visible in frame of one, polyphase-developed dome which corresponds to the oldest folds in our model (F1 and F2) that undergo both stages described in Figure 10A. Generally, this should be a trend typical for domes developed close to the indenter while domes formed in the foreland should be characterized by more symmetrical P-T-t zonality in map view [e.g., Lake Zone shown at Figure 10B or in profile 2 at Figure 4B in Sukhbaatar et al. (2022)]. Additionally, younger domes (in the foreland of collision) might be associated with the presence of planar-subhorizontal fabrics in the mantling migmatites (with vergence from the axial plane of the dome) while older, amplified and squeezed domes may display dominantly steep structures in the mantling migmatites. Another characteristic feature is that a larger heat input from potentially larger volume of melt, stored in cores of distant folds can locally lead to a higher degree of contact metamorphosis. Finally, the progressive development of domes and melt migration, as shown in our models, suggests a decreasing age of both intrusive bodies and retrograde metamorphic events for mantling rocks along the series of the detachment folds from the collisional front (orogenic core) to the foreland. This can be seen in the spatial distribution of progressively younger domes in the Mongol-Altai Zone along a S-N direction towards the core of the Mongolian orocline (Figures 9D, 10; reader can also compare NE-SW and NW-SE sections at Figures 15 and 16 in Jiang et al., 2019) and can be associated with its early (Devonian) formative stage to Permo-Triassic amplification (Jiang et al., 2019; Guy et al., 2021; Krýza et al., 2021). Here, the gradient of ages for Mongol-Altai domes comprises a sequence of older intrusions (360 Ma–340 Ma) for the Chandmann dome (Lehmann et al., 2017). Meanwhile, younger intrusions are found in the Tseel domain (ca 300 Ma–240 Ma) (Hong et al., 2021; Sukhbaatar et al., 2022; Zhang et al., 2014) and the southern Bugat batholith (300 Ma–275 Ma) (Cai et al., 2015). The youngest ages are in the north Bugat pluton (215 Ma–206 Ma) (Cai et al., 2015). Here, the older intrusions, such as the Chandmann dome, can be associated with the Silurian-Devonian E-W amalgamation of the Mongol-Altai and Trans-Altai zone and partly reactivated during Permian-Triassic oroclinal buckling when younger intrusions were initiated.
5 Conclusion
We performed a unique comparative analysis on a set of scaled analogue experiments covering a selected range of thermal-shortening (T-V) conditions. These original models employ the concept of decelerated convergent systems, which is not often assumed for shortening in analogue models. Additionally, paraffin wax was implemented as a convenient analogue for the lower continental crust, with the potential to simulate thermally dependent rheological layering. This allowed us to understand how thermal-velocity parameters affect the spatial and temporal evolution of the crust in collisional systems. To quantify major differences between individual models, we employed a geometric analysis of melt rich zones and compared their geometric-spatial relationships with deformation of the lower crust on a large scale. In addition, detachment folding of the lower crust, (one of our modeling scenarios), was analyzed in detail using particle image velocimetry (PIV). Here we performed advanced kinematical analysis of individually developed folds and identified an important asymmetry which reflects the vorticity and flexural flow of the lower crust around melt bearing cores situated in the axial traces of the folds. The main outlooks can be summarized in following points:
• Based on initial thermal conditions and shortening scenarios, we delineated five characteristic deformation styles: Style 1) typical for a lower heat input and low rate of shortening with prevailing homogeneous thickening or bulging, Style 2) typical for cold and faster shortening rates which is characterized by dominance of homogeneous thickening and short-wavelength, low amplitude folding, Style 3) typical for low to average heat input and fast shortening with development of small diapir-shape folds or ductile faults, Style 4) with high heat input and average to fast shortening rates typical with detachment folding, Style 5) for very high heat input and slow to fast shortening, associated with the formation of lower crustal finger protrusions.
• Path analysis of markers, implemented in order to trace the individual folds in detachment folding scenario (Style 3), revealed a rotational trend in development of older folds in the sequence. Fold limbs are asymmetrically exhumed and buried, which indicates a flexural flow of the lower crust around the cores of individual folds. This may result in asymmetrical zoning of metamorphic domes.
• Folds that developed in early stages of shortening close to the core of collision are first amplified by buckling, slightly rotated and asymmetrically stretched, while folds that developed during later stages in the frontal parts of the fold arrays grow dominantly by buckling.
• Migration of the melt through a shortened system and sequential “fold pumpingˮ, between progressively developed folds and source layer beneath, suggests progressive accumulation of the melt in folds developed in the foreland of the fold sequence.
• These observations may have significant implications for understanding the development of large magmato-metamorphic complexes related to doming, manifested for example in the Mongol-Altai Zone of the CAOB.
Data availability statement
The raw data supporting the conclusions of this article will be made available by the authors, without undue reservation.
Author contributions
OK led the conception and design of the project. OK and PZ performed the experimental procedures. OK designed and performed numerical post-processing, analyzed models and wrote original draft of the manuscript (including original figures). PZ, TS and JS contributed to discussion and manuscript revisions. JS co-designed and developed model apparatus.
Funding
This work was financially supported by the EXPRO project of the Czech Grant Agency (Grant no. 19-27682X).
Acknowledgments
We thank to Prof. Karel Schulmann for valuable discussions regarding the metamorphic domes complex development in the CAOB and to prof. Alexander Cruden for editorial handling of the manuscript. The manuscript benefited from constructive reviews of Daniele Maestrelli, João Duarte, Giacomo Corti and Eunseo Choi.
Conflict of interest
The authors declare that the research was conducted in the absence of any commercial or financial relationships that could be construed as a potential conflict of interest.
Publisher’s note
All claims expressed in this article are solely those of the authors and do not necessarily represent those of their affiliated organizations, or those of the publisher, the editors and the reviewers. Any product that may be evaluated in this article, or claim that may be made by its manufacturer, is not guaranteed or endorsed by the publisher.
Supplementary material
The Supplementary Material for this article can be found online at: https://www.frontiersin.org/articles/10.3389/feart.2022.965497/full#supplementary-material.
References
Aerden, D. G., and Malavieille, J. (1999). Origin of a large-scale fold nappe in the Montagne Noire, Variscan belt, France. J. Struct. Geol. 21 (10), 1321–1333. doi:10.1016/s0191-8141(99)00098-x
Aguilar, C., Liesa, M., Štípská, P., Schulmann, K., Muñoz, J. A., and Casas, J. M. (2015). P–T–t–d evolution of orogenic middle crust of the Roc de Frausa massif (eastern Pyrenees): A result of horizontal crustal flow and carboniferous doming? J. Metamorph. Geol. 33 (3), 273–294. doi:10.1111/jmg.12120
Audet, P., Currie, C. A., Schaeffer, A. J., and Hill, A. M. (2019). Seismic evidence for lithospheric thinning and heat in the northern Canadian Cordillera. Geophys. Res. Lett. 46 (8), 4249–4257. doi:10.1029/2019gl082406
Barraud, J., Gardien, V., Allemand, P., and Grandjean, P. (2004). Analogue models of melt-flow networks in folding migmatites. J. Struct. Geol. 26 (2), 307–324. doi:10.1016/j.jsg.2003.06.002
Biot, M. A. (1961). Theory of folding of stratified viscoelastic media and its implications in tectonics and orogenesis. Geol. Soc. Am. Bull. 72 (11), 1595–1620. doi:10.1130/0016-7606(1961)72[1595:tofosv]2.0.co;2
Bonini, M. (2003). Detachment folding, fold amplification, and diapirism in thrust wedge experiments. Tectonics 22 (6). doi:10.1029/2002tc001458
Boutelier, D., and Cruden, A. R. (2017). Slab breakoff: Insights from 3D thermo-mechanical analogue modelling experiments. Tectonophysics 694, 197–213. doi:10.1016/j.tecto.2016.10.020
Boutelier, D., and Oncken, O. (2011). 3-D thermo-mechanical laboratory modeling of plate-tectonics: Modeling scheme, technique and first experiments. Solid earth. 2 (1), 35–51. doi:10.5194/se-2-35-2011
Burenjargal, U., Okamoto, A., Tsuchiya, N., Uno, M., Horie, K., and Hokada, T. (2016). Contrasting geochemical signatures of devonian and permian granitoids from the Tseel terrane, SW Mongolia. J. Geosci. 61 (1), 51–66. doi:10.3190/jgeosci.210
Burg, J. P., and Schmalholz, S. M. (2008). Viscous heating allows thrusting to overcome crustal-scale buckling: Numerical investigation with application to the Himalayan syntaxes. Earth Planet. Sci. Lett. 274 (1-2), 189–203. doi:10.1016/j.epsl.2008.07.022
Cai, K., Sun, M., Jahn, B. M., Xiao, W., Yuan, C., Long, X., et al. (2015). A synthesis of zircon U–Pb ages and Hf isotopic compositions of granitoids from Southwest Mongolia: Implications for crustal nature and tectonic evolution of the Altai Superterrane. Lithos 232, 131–142. doi:10.1016/j.lithos.2015.06.014
Chemenda, A. I., Mattauer, M., Malavieille, J., and Bokun, A. N. (1995). A mechanism for syn-collisional rock exhumation and associated normal faulting: Results from physical modelling. Earth Planet. Sci. Lett. 132 (1-4), 225–232. doi:10.1016/0012-821x(95)00042-b
Clark, M. K. (2012). Continental collision slowing due to viscous mantle lithosphere rather than topography. Nature 483 (7387), 74–77. doi:10.1038/nature10848
Clerc, C., Lahfid, A., Monié, P., Lagabrielle, Y., Chopin, C., Poujol, M., et al. (2015). High-temperature metamorphism during extreme thinning of the continental crust: A reappraisal of the north pyrenean passive paleomargin. Solid earth. 6 (2), 643–668. doi:10.5194/se-6-643-2015
Collins, W. J. (2002). Hot orogens, tectonic switching, and creation of continental crust. Geol. 30 (6), 535–538. doi:10.1130/0091-7613(2002)030<0535:hotsac>2.0.co;2
Currie, J. B., Patnode, H. W., and Trump, R. P. (1962). Development of folds in sedimentary strata. Geol. Soc. Am. Bull. 73 (6), 655–673. doi:10.1130/0016-7606(1962)73[655:dofiss]2.0.co;2
Dal Zilio, L., Ruh, J., and Avouac, J. P. (2020). Structural evolution of orogenic wedges: Interplay between erosion and weak décollements. Tectonics 39 (10). doi:10.1029/2020tc006210
Davis, D. M., and Engelder, T. (1985). The role of salt in fold-and-thrust belts. Tectonophysics 119 (1-4), 67–88. doi:10.1016/0040-1951(85)90033-2
Epstein, N. (1989). On tortuosity and the tortuosity factor in flow and diffusion through porous media. Chem. Eng. Sci. 44 (3), 777–779. doi:10.1016/0009-2509(89)85053-5
Faccenda, M., Gerya, T. V., and Chakraborty, S. (2008). Styles of post-subduction collisional orogeny: Influence of convergence velocity, crustal rheology and radiogenic heat production. Lithos 103 (1-2), 257–287. doi:10.1016/j.lithos.2007.09.009
Flament, N., Rey, P. F., Coltice, N., Dromart, G., and Olivier, N. (2011). Lower crustal flow kept Archean continental flood basalts at sea level. Geology 39 (12), 1159–1162. doi:10.1130/g32231.1
Gordon, S. M., Luffi, P., Hacker, B., Valley, J., Spicuzza, M., Kozdon, R., et al. (2012). The thermal structure of continental crust in active orogens: Insight from miocene eclogite and granulite xenoliths of the pamir mountains. J. Metamorph. Geol. 30 (4), 413–434. doi:10.1111/j.1525-1314.2012.00973.x
Guy, A., Schulmann, K., Soejono, I., Holzrichter, N., Lexa, O., and Munschy, M. (2021). Structures and geodynamics of the Mongolian tract of the Central Asian Orogenic Belt constrained by potential field analyses. Gondwana Res. 92, 26–53. doi:10.1016/j.gr.2020.11.016
Hacker, B. R., Kelemen, P. B., and Behn, M. D. (2011). Differentiation of the continental crust by relamination. Earth Planet. Sci. Lett. 307 (3-4), 501–516. doi:10.1016/j.epsl.2011.05.024
Hollister, L. S., and Crawford, M. L. (1986). Melt-enhanced deformation: A major tectonic process. Geol. 14 (7), 558–561. doi:10.1130/0091-7613(1986)14<558:mdamtp>2.0.co;2
Hong, T., Gao, J., Xu, X. W., Wu, C., and Li, H. (2021). Late Palaeozoic magmatism in the eastern Tseel Terrane of SW Mongolia evidenced by chronological and geochemical data. Geol. J. 56 (7), 3415–3447. doi:10.1002/gj.4026
Hubbert, M. K. (1937). Theory of scale models as applied to the study of geologic structures. Geol. Soc. Am. Bull. 48 (10), 1459–1520. doi:10.1130/gsab-48-1459
Hyndman, R. D. (2010). The consequences of Canadian Cordillera thermal regime in recent tectonics and elevation: A reviewThis article is one of a series of papers published in this special issue on the theme lithoprobe — Parameters, processes, and the evolution of a continent.Geological survey of Canada contribution 20090195. Can. J. Earth Sci. 47 (5), 621–632. doi:10.1139/e10-016
Jiang, Y. D., Schulmann, K., Sun, M., Štípská, P., Guy, A., Janoušek, V., et al. (2016). Anatexis of accretionary wedge, Pacific‐type magmatism, and formation of vertically stratified continental crust in the Altai Orogenic Belt. Tectonics 35 (12), 3095–3118. doi:10.1002/2016tc004271
Jiang, Y. D., Schulmann, K., Sun, M., Weinberg, R. F., Štípská, P., Li, P. F., et al. (2019). Structural and geochronological constraints on Devonian suprasubduction tectonic switching and Permian collisional dynamics in the Chinese Altai, Central Asia. Tectonics 38 (1), 253–280. doi:10.1029/2018tc005231
Jiang, Y. D., Štípská, P., Sun, M., Schulmann, K., Zhang, J., Wu, Q. H., et al. (2015). Juxtaposition of barrovian and migmatite domains in the Chinese Altai: A result of crustal thickening followed by doming of partially molten lower crust. J. Metamorph. Geol. 33 (1), 45–70. doi:10.1111/jmg.12110
Jiang, Y., Sun, M., Kröner, A., Tumurkhuu, D., Long, X., Zhao, G., et al. (2012). The high-grade Tseel terrane in SW Mongolia: An early paleozoic arc system or a precambrian sliver? Lithos 142, 95–115. doi:10.1016/j.lithos.2012.02.016
Kelemen, P. B., and Behn, M. D. (2016). Formation of lower continental crust by relamination of buoyant arc lavas and plutons. Nat. Geosci. 9 (3), 197–205. doi:10.1038/ngeo2662
Kisters, A. F., Charlesworth, E. G., Gibson, R. L., and Anhaeusser, C. R. (1996). Steep structure formation in the Okiep copper District, South Africa: Bulk inhomogeneous shortening of a high-grade metamorphic granite-gneiss sequence. J. Struct. Geol. 18 (6), 735–751. doi:10.1016/s0191-8141(96)80008-3
Kruger, T., and Kisters, A. (2016). Magma accumulation and segregation during regional-scale folding: The Holland’s dome granite injection complex, Damara belt, Namibia. J. Struct. Geol. 89, 1–18. doi:10.1016/j.jsg.2016.05.002
Krýza, O., Lexa, O., Schulmann, K., Guy, A., Gapais, D., Cosgrove, J., et al. (2021). Oroclinal buckling and associated lithospheric-scale material flow–insights from physical modelling: Implication for the Mongol-Hingan orocline. Tectonophysics 800, 228712. doi:10.1016/j.tecto.2020.228712
Krýza, O., Závada, P., and Lexa, O. (2019). Advanced strain and mass transfer analysis in crustal-scale oroclinal buckling and detachment folding analogue models. Tectonophysics 764, 88–109. doi:10.1016/j.tecto.2019.05.001
Lee, J., Hacker, B., and Wang, Y. (2004). Evolution of north himalayan gneiss domes: Structural and metamorphic studies in mabja dome, southern tibet. J. Struct. Geol. 26 (12), 2297–2316. doi:10.1016/j.jsg.2004.02.013
Lee, J., and Lister, G. S. (1992). Late Miocene ductile extension and detachment faulting, Mykonos, Greece. Geol. 20 (2), 121–124. doi:10.1130/0091-7613(1992)020<0121:lmdead>2.3.co;2
Lehmann, J., Schulmann, K., Lexa, O., Závada, P., Štípská, P., Hasalová, P., et al. (2017). Detachment folding of partially molten crust in accretionary orogens: A new magma-enhanced vertical mass and heat transfer mechanism. Lithosphere 9 (6), 889–909. doi:10.1130/l670.1
Lexa, O., Schulmann, K., Janoušek, V., Štípská, P., Guy, A., and Racek, M. (2011). Heat sources and trigger mechanisms of exhumation of HP granulites in Variscan orogenic root. J. Metamorph. Geol. 29 (1), 79–102. doi:10.1111/j.1525-1314.2010.00906.x
Li, Z. H., Gerya, T. V., and Burg, J. P. (2010). Influence of tectonic overpressure on P–T paths of HP–UHP rocks in continental collision zones: Thermomechanical modelling. J. Metamorph. Geol. 28 (3), 227–247. doi:10.1111/j.1525-1314.2009.00864.x
Loucks, R. R. (2021). Deep entrapment of buoyant magmas by orogenic tectonic stress: Its role in producing continental crust, adakites, and porphyry copper deposits. Earth-Science Rev. 220, 103744. doi:10.1016/j.earscirev.2021.103744
Luján, M., Rossetti, F., Storti, F., Ranalli, G., and Socquet, A. (2010). Flow trajectories in analogue viscous orogenic wedges: Insights on natural orogens. Tectonophysics 484 (1-4), 119–126. doi:10.1016/j.tecto.2009.09.009
Maierová, P., Čadek, O., Lexa, O., and Schulmann, K. (2012). A numerical model of exhumation of the orogenic lower crust in the Bohemian Massif during the Variscan orogeny. Stud. Geophys. Geod. 56 (2), 595–619. doi:10.1007/s11200-011-0455-x
Maierová, P., Lexa, O., Schulmann, K., and Štípská, P. (2014). Contrasting tectono-metamorphic evolution of orogenic lower crust in the bohemian massif: A numerical model. Gondwana Res. 25 (2), 509–521. doi:10.1016/j.gr.2012.08.020
Maierová, P., Schulmann, K., and Gerya, T. (2018). Relamination styles in collisional orogens. Tectonics 37 (1), 224–250. doi:10.1002/2017tc004677
Mary, H., and Brouhard, G. J. (2019). Kappa (κ): Analysis of curvature in biological image data using B-splines. doi:10.1101/852772
Mitchell, M. M., and Woodward, N. B. (1988). Kink detachment fold in the southwest Montana fold and thrust belt. Geol. 16 (2), 162–165. doi:10.1130/0091-7613(1988)016<0162:kdfits>2.3.co;2
Neurath, C., and Smith, R. B. (1982). The effect of material properties on growth rates of folding and boudinage: Experiments with wax models. J. Struct. Geol. 4 (2), 215–229. doi:10.1016/0191-8141(82)90028-1
Parfenov, L. M., Berzin, N. A., Khanchuk, A. I., Belichenko, V. G., Bulgatov, A. N., Dril, S. I., et al. (2003). A model of orogenic belts formation in Central and Northeast Asia. Tikhookean. Geol. 22, 7–41.
Poblet, J., McClay, K., Storti, F., and Muñoz, J. A. (1997). Geometries of syntectonic sediments associated with single-layer detachment folds. J. Struct. Geol. 19 (3-4), 369–381. doi:10.1016/s0191-8141(96)00113-7
Puziewicz, J., Czechowski, L., Grad, M., Majorowicz, J., Pietranik, A., and Šafanda, J. (2019). Crustal lithology vs. thermal state and moho heat flow across the NE part of the European variscan orogen: A case study from SW Poland. Int. J. Earth Sci. 108 (2), 673–692. doi:10.1007/s00531-018-01674-7
Ramberg, H. (1963). Fluid dynamics of viscous buckling applicable to folding of layered rocks. AAPG Bull. 47 (3), 484–505.
Ramberg, H. (1981). The role of gravity in orogenic belts. Geol. Soc. Lond. Spec. Publ. 9 (1), 125–140. doi:10.1144/gsl.sp.1981.009.01.11
Root, D. B., Hacker, B. R., Gans, P. B., Ducea, M. N., Eide, E. A., and Mosenfelder, J. L. (2005). Discrete ultrahigh‐pressure domains in the western gneiss region, Norway: Implications for formation and exhumation. J. Metamorph. Geol. 23 (1), 45–61. doi:10.1111/j.1525-1314.2005.00561.x
Rossetti, D. D. F. (1999). Soft‐sediment deformation structures in late albian to cenomanian deposits, são luís basin, northern Brazil: Evidence for palaeoseismicity. Sedimentology 46 (6), 1065–1081. doi:10.1046/j.1365-3091.1999.00265.x
Rowan, M. G. (1997). Three-dimensional geometry and evolution of a segmented detachment fold, Mississippi Fan foldbelt, Gulf of Mexico. J. Struct. Geol. 19 (3-4), 463–480. doi:10.1016/s0191-8141(96)00098-3
Schulmann, K., Lexa, O., Štípská, P., Racek, M., Tajčmanová, L., Konopásek, J., et al. (2008). Vertical extrusion and horizontal channel flow of orogenic lower crust: Key exhumation mechanisms in large hot orogens? J. Metamorph. Geol. 26 (2), 273–297. c. doi:10.1111/j.1525-1314.2007.00755.x
Scharer, K. M., Burbank, D. W., Chen, J., Weldon, R. J., Rubin, C., Zhao, R., et al. (2004). Detachment folding in the southwestern tian Shan–tarim foreland, China: Shortening estimates and rates. J. Struct. Geol. 26 (11), 2119–2137. doi:10.1016/j.jsg.2004.02.016
Schindelin, J., Arganda-Carreras, I., Frise, E., Kaynig, V., Longair, M., Pietzsch, T., et al. (2012). Fiji: An open-source platform for biological-image analysis. Nat. Methods 9 (7), 676–682. doi:10.1038/nmeth.2019
Schulmann, K., Lexa, O., Janoušek, V., Lardeaux, J. M., and Edel, J. B. (2014). Anatomy of a diffuse cryptic suture zone: An example from the bohemian massif, European variscides. Geology 42 (4), 275–278. doi:10.1130/g35290.1
Smit, J. H. W., Brun, J. P., and Sokoutis, D. (2003). Deformation of brittle‐ductile thrust wedges in experiments and nature. J. Geophys. Res. 108 (B10). doi:10.1029/2002jb002190
Sokoutis, D., Burg, J. P., Bonini, M., Corti, G., and Cloetingh, S. (2005). Lithospheric-scale structures from the perspective of analogue continental collision. Tectonophysics 406 (1-2), 1–15. doi:10.1016/j.tecto.2005.05.025
Spencer, C. J., Mitchell, R. N., and Brown, M. (2021). Enigmatic mid‐proterozoic orogens: Hot, thin, and low. Geophys. Res. Lett. 48 (16), e2021GL093312. doi:10.1029/2021gl093312
Storti, F., and Poblet, J. (1997). Growth stratal architectures associated to decollement folds and fault-propagation folds. Inferences on fold kinematics. Tectonophysics 282 (1-4), 353–373. doi:10.1016/s0040-1951(97)00230-8
Sukhbaatar, T., Lexa, O., Schulmann, K., Aguilar, C., Štípská, P., Wong, J., et al. (2022). Paleozoic geodynamics and architecture of the southern part of the Mongolian Altai Zone. Tectonics 41, 7498. doi:10.1029/2022tc007498
Turienzo, M. M. (2010). Structural style of the malargüe fold-and-thrust belt at the diamante river area (34 30′–34 50′ S) and its linkage with the Cordillera frontal, andes of central Argentina. J. S. Am. Earth Sci. 29 (3), 537–556. doi:10.1016/j.jsames.2009.12.002
Weijermars, R., and Schmeling, H. (1986). Scaling of Newtonian and non-Newtonian fluid dynamics without inertia for quantitative modelling of rock flow due to gravity (including the concept of rheological similarity). Phys. Earth Planet. Interiors 43 (4), 316–330. doi:10.1016/0031-9201(86)90021-x
Wiltschko, D. V., and Chapple, W. M. (1977). Flow of weak rocks in Appalachian Plateau folds. AAPG Bull. 61 (5), 653–670.
Wosnitza, E. M., Grujic, D., Hoffman, R., and Behrmann, J. H. (2001). “New apparatus for thermomechanical analogue modeling. Memoirs-Geological Society of America,” in Tectonic modeling: A volume in honor of Hans Ramberg. Editors H. A. Koyi, and N. S. Mancktelow. (Geological Society of America), Vol. 193, 245–252.
Zhang, H., Hou, Z., Rolland, Y., and Santosh, M. (2022). The cold and hot collisional orogens: Thermal regimes and metallogeny of the Alpine versus Himalayan-Tibetan belts. Ore Geol. Rev. 141, 104671. doi:10.1016/j.oregeorev.2021.104671
Keywords: detachment folding, analogue modeling, collision tectonics, Central Asian Orogenic Belt, decelerated shortening, paraffin wax, magmatic-metamorphic domes
Citation: Krýza O, Závada P, Shu T and Semerád J (2022) Modes and geometry of crustal-scale detachment folding in hot orogens—Insights from physical modeling. Front. Earth Sci. 10:965497. doi: 10.3389/feart.2022.965497
Received: 09 June 2022; Accepted: 27 September 2022;
Published: 07 November 2022.
Edited by:
Alexander Cruden, Monash University, AustraliaReviewed by:
Eunseo Choi, University of Memphis, United StatesDaniele Maestrelli, National Research Council, Italy
Giacomo Corti, National Research Council (CNR), Italy
Joao C Duarte, University of Lisbon, Portugal
Copyright © 2022 Krýza, Závada, Shu and Semerád. This is an open-access article distributed under the terms of the Creative Commons Attribution License (CC BY). The use, distribution or reproduction in other forums is permitted, provided the original author(s) and the copyright owner(s) are credited and that the original publication in this journal is cited, in accordance with accepted academic practice. No use, distribution or reproduction is permitted which does not comply with these terms.
*Correspondence: Ondřej Krýza, kryza@ig.cas.cz