
Abstract
Studies into the relation between subjective perceptions of individuals and objective economic conditions have usually resulted in ambiguous empirical findings. Whilst most studies perceive subjective welfare as being operationalized by indicators of happiness or life satisfaction, we narrow the approach to an economic domain of subjective well-being—perceptions of poverty. We argue that our approach better reflects the economic dimension, as the former may include numerous non-economic domains. We use a case study of two countries—Czechia and Slovakia—which underwent early economic transition as a common state in 1989–1992, then became independent states in 1993, after the dissolution of Czechoslovakia. We base our findings on three historical data sets covering a period from around the end of the communist era to the early years after the split, and recent data from EU Statistics on Income and Living Conditions (2005–2016). Despite initially small differences in subjective poverty levels in socialist Czechoslovakia, a considerably larger drop in economic performance during the transition period in Slovakia than in Czechia resulted in a sharp widening of the subjective poverty gap. The recent data suggests that, despite a high degree of actual economic convergence of Slovakia and Czechia, the gap in subjective perceptions of poverty is declining at a remarkably slower pace. We argue that relatively fast economic growth is not necessarily associated with a commensurate decline in subjective poverty perceptions. Our results thus support the Easterlin Paradox, although we substitute happiness by an economic dimension of subjective well-being.
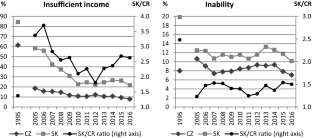
Source: SOCO 1995, EU-SILC 2005–2016. Own computations
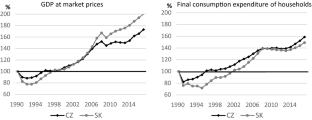
Source: The period 1990–2009 is based on the CZSO (2012) data, the period 2010–2017 is based on Eurostat data (variable nama_10_pc)
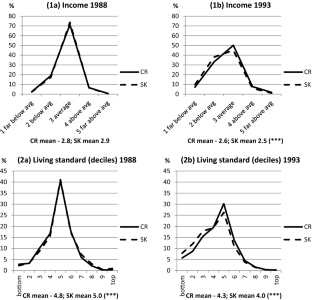
Source: Social Stratification in Eastern Europe 1993. Own computations
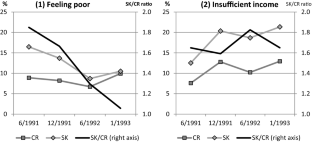
Source: EEA W3–W6. Own computations
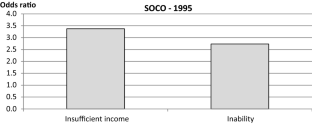
Source: Social Consequences of Transition data (1995). Own computations
Source: EU-SILC 2005–2016. Own computations
Source: EU-SILC 2005–2016. Own computations

Source: EU-SILC 2005–2016. Own computations

Source: EU-SILC 2005–2016. Own computations
Notes
Household Questionnaire, Section 17: “Concerning your family's food consumption over the past 1 month, which of the following is true?” with the following responses: “1: It was less than adequate for your family’s needs; 2: It was just adequate for your family’s needs; 3: It was more than adequate for your family’s needs; 4: Not applicable”. “Adequate” is defined as: “no more nor less than what the respondent considers to be the minimum consumption needs of the family”.
Variable YINC-7990 with the following question: “Which of the following best describes [yours/yours and your spouse's/yours and your partner's] financial condition?” and the corresponding categories: “1—very comfortable and secure; 2—able to make ends meet without much difficulty; 3—occasionally have some difficulty making ends meet; 4—tough to make ends meet but keeping your head above water; 5—in over your head”.
Even today, the subjective approach is regarded as neglected within the welfare concepts, though it remains a conceptually appealing way to define poverty (Ravallion 2014). Although economists have long been skeptical about subjective variables (Bertrand and Mullainathan 2001), their skepticism about subjective data seems, to some extent, to have been overcome today (Deaton and Stone 2013).
Most of the countries joined the survey in 2005.
While a targeted sociological survey on the poor population, ready to be launched by the mid-1980s, was not allowed during the communist era, poverty was opened as a research issue at the beginning of the economic transition.
The first wave did not contain the subjective variables of our interest. The second wave collected information on household disposable income using a single question (as opposed to the next waves) which makes our indicator highly incomparable. The last wave collected data on income only at intervals, which hinders construction of our indicator.
Households reporting that their actual income was absolutely sufficient to get along, consisting of 23% of Czech and 6% of Slovak households, were thus not asked the MIQ. For the rest, the reported minimum income was always higher than or equal to the actual income. Thus, if the respondents’ income was not absolutely sufficient, they were assumed to have reported a higher minimum income needed.
Note that the number of categories of the scale-evaluated questions differs across the data sets used, from four in EEA to six in EU-SILC. This raises comparability issues, which are partly offset by focusing on Slovak–Czech ratios instead on the levels of “feeling poor” or “inability” incidence across the surveys.
EU-SILC variable HY020—as actual income corresponds to annual income, one twelfth of the reported value is taken into account. EU-SILC is usually conducted in spring in Czechia and Slovakia, and the income reference period corresponds to the previous calendar year, while the subjective questions are related to the current situation. We are aware of possible inconsistencies between the current and previous year reference periods. However, the income reference period is considered to provide the best approximation of current income, as suggested by Eurostat (2010a), and it is also used in this sense in official statistics.
The reason for the arbitrarily chosen threshold of 75% was that approximately the same share of the Czech population reported “insufficient income” as the share of persons designated as “at risk of poverty”—the official indicator—in 2015 (documented by Večerník and Mysíková 2016).
Regarding the possible limitations of the “individual” method and the arbitrarily stated poverty line, note that we cannot utilize any model-based estimation of the poverty line (SPL) because a part of the SOCO 1995 survey respondents were not asked the MIQ (almost a quarter of respondents in CZ).
Note that the scale differs in SOCO and in EU-SILC.
The regression results mostly show a statistically insignificant difference between those paying a mortgage and those paying rent; however, if the coefficient is statistically significant, those paying a mortgage are less likely to feel poor.
Our definition of the work intensity indicator is different from the one applied by Eurostat in official statistics (see Ward and Ozdemir 2013). Here we simply add up the number of months worked during the year by all household members aged 16+ and divide it by 12 times the number of household members aged 16+. Our purpose is to control for the share of household members who actively contribute to the household budget, while the Eurostat definition is aimed to identify socially excluded persons.
The NUTS2 level includes 8 Czech and 4 Slovak regions.
Employment rate for population aged 15–64, Eurostat database (variable lfst_r_lfe2emprt).
Eurostat database (variable nama_10r_2gdp).
Data on expenditures stem from Household Budget Surveys, provided by the Czech and Slovak Statistical Offices.
For the sake of space, we do not provide full results of the logistic regressions models or comment on them, but they are available upon request.
As with the official statistics, all computations based on EU-SILC are weighted by the individual weights provided in the datasets.
Indeed, the variance of the two indicators of subjective poverty defined above differs, especially in Slovakia: while the variance of the insufficient income indicator ranges from 0.07 to 0.14 in CZ and from 0.16 to 0.25 in SK throughout the period 2005–2016, the respective figures are 0.06–0.09 and 0.09–0.11 for the inability indicator.
Slovakia suffered from weaker economic performance than Czechia for decades, followed by a rapid convergence with Czechia through the 1980s. Slovakia attained 61% of the Czech GDP in 1948, whereas its GDP reached 88% of that of Czechia at the end of the communist era in 1989 (see, e.g., Vintrová 2008, 2009 for further details).
The consistency of the data on actual household disposable income over survey waves is rather low as the income questions varied in each wave. The reason was to improve the validity of the variable by dividing one original summary question into several asking about individual sources of income. However, as a consequence, the indicator of insufficient income is unstable over time.
The SK dummy shows a relative outcome, meaning that the perceived subjective poverty might have increased in Slovakia, decreased in Czechia, or any combination that might have led to the wider SK–CZ gap in Model B compared to Model A. In order to shed more light on what was happening in each country, we ran a model with pooled data for all years and included year dummies together with their interaction terms with the SK dummy. The results showed that both the Czechs and Slovaks are more likely to perceive their household income as insufficient once the economic conditions are controlled for. However, this difference is substantially greater in Slovakia than in Czechia. Further, this difference is decreasing over time in both countries. Finally, the results of the pooled model with economic controls (Model B) indicate that, in Czechia, the likelihood an individual will perceive his/her income as insufficient (with the last year as a reference point) was decreasing gradually (from relatively low likelihood at the beginning). In Slovakia, the relatively high likelihood at the beginning was sharply decreasing up to 2010.
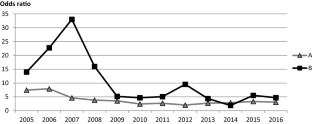
The 2007 jump appears when the regional GDP is added to the regressors. Without the regional GDP, the odds ratio for SK accounts for 10.4 in 2007, and the peak occurs in 2006 (19.5), similarly to Model A.
Finally, we conclude that the fact that the subjective questions are responded to by one household member and attributed to all other household members has only a negligible impact on the results (compare Fig. 6 and the left panel of Fig. 12 for insufficient income, and Fig. 7 and the right panel of Fig. 12 for inability). Apart from a loss in statistical significance in some years, the qualitative results and trends remain the same.
Respondents state the income variables in their national currency, i.e. Slovak crown till 2008 and Euro since 2009 in Slovakia, and Czech crown in the Czech Republic for the whole period. Eurostat converts the income variables into Euros (and provides the exchange rate applied each year). The Czech Republic has not adopted the Euro, and the exchange rate moved from 32 CZK/EUR in 2005 to 25 CZK/EUR around 2012 and to 27 CZK/EUR in 2016. In Slovakia, the exchange rate dropped from 39 SKK/EUR to 34 SKK/EUR between 2005 and 2007, and the Slovak crown was replaced by the Euro at the irrevocably fixed exchange rate of 1 EUR = 30.1260 SKK on 1 January 2009.
References
Bertrand, M., & Mullainathan, S. (2001). Do people mean what they say? Implications for subjective survey data. The American Economic Review (Papers and Proceedings), 91(2), 67–72.
Blanchflower, D., & Oswald, A. (2004). Well-being over time in Britain and the USA. Journal of Public Economics, 88(7–8), 1359–1386.
Bonke, J., & Browning, M. (2009). The distribution of financial well-being and income within the household. Review of Economics of the Household, 7(1), 31–42.
Bradburn, N. M. (1969). The structure of psychological well-being. Chicago: Aldine Publishing Company.
Clark, A. E., D’Ambrosio, C., & Ghislandi, S. (2015). Poverty profiles and well-being: Panel evidence from Germany. In T. I. Garner, K. S. Short (Eds.), Measurement of poverty, deprivation, and economic mobility (Research on Economic Inequality, Vol. 23, pp. 1–22). Bingley: Emerald Group Publishing Limited.
Cracolici, M. F., Giambona, F., & Cuffaro, M. (2011). The determinants of subjective economic wellbeing: An analysis of Italian-Silc data. Applied Research on Quality of Life, 7(1), 17–47.
Cracolici, M. F., Giambona, F., & Cuffaro, M. (2014). Family structure and subjective economic well-being: Some new evidence. Social Indicators Research, 118(1), 433–456.
Cummins, R. A. (1996). The domains of life satisfaction: An attempt to order chaos. Social Indicators Research, 38(3), 303–328.
Deaton, A., & Stone, A. A. (2013). Two happiness puzzles. The American Economic Review (Papers and Proceedings), 103(3), 591–597.
Decancq, K., Goedemé, T., Van den Bosch, K., & Vanhille, J. (2013). The evolution of poverty in the European Union: Concepts, measurement and data. ImPRovE Methodological Paper No. 13/01. Antwerp: Herman Deleeck Centre for Social Policy—University of Antwerp.
Deleeck, H., Van den Bosch, K., & De Lathouwer, L. (1992). Poverty and the adequacy of social security in the EC: A comparative analysis. Aldershot: Avebury.
Di Tella, R., Haisken-DeNew, J. P., & MacCulloch, R. (2010). Happiness adaptation to income and to status in an individual panel. Journal of Economic Behavior & Organization, 76(3), 834–852.
Di Tella, R., MacCulloch, R. J., & Oswald, A. J. (2001). Preferences over inflation and unemployment: Evidence from surveys of happiness. The American Economic Review, 91(1), 335–341.
Diener, E., & Suh, E. M. (1997). Measuring quality of life: Economic, social, and subjective indicators. Social Indicators Research, 40(1–2), 189–216.
Diener, E., Suh, E. M., Lucas, R. E., & Smith, H. L. (1999). Subjective well-being: Three decades of progress. Psychological Bulletin, 125(2), 276–302.
Easterlin, R. A. (1974). Does economic growth improve the human lot? Some empirical evidence. In P. A. David & M. W. Reder (Eds.), Nations and households in economic growth: Essays in honor of Moses Abramovitz (pp. 89–125). New York: Academic Press.
Easterlin, R. A. (2017). Paradox lost? Review of Behavioral Economics, 4(4), 311–339.
Easterlin, R. A., et al. (2010). The happiness–income paradox revisited. Proceedings of the National Academy of Sciences of the United States of America, 107(52), 22463–22468.
Easterlin, R. A., & Plagnol, A. C. (2008). Life satisfaction and economic conditions in East and West Germany pre- and post-unification. Journal of Economic Behavior & Organization, 68(3–4), 433–444.
European Commission. (2005). Standard Eurobarometer 62/Autumn 2004: Public opinion in the European Union. Brussels: European Commission.
European Commission. (2017). Standard Eurobarometer 86/Autumn 2016: Public opinion in the European Union. Brussels: European Commission.
Eurostat. (2010a). Algorithms to compute social inclusion indicators based on EU-SILC and adopted under the open method of coordination (OMC). Doc. LC-ILC/39/09/EN-rev.1 1.
Eurostat. (2010b). Description of target variables: Cross-sectional and longitudinal. 2008 Operation (Version January 2010).
Eurostat. (2016). Methodological guidelines and description of EU-SILC target variables. 2015 Operation (Version August 2016).
Fahey, T., & Smyth, E. (2004). Do subjective indicators measure welfare? Evidence from 33 European societies. European Societies, 6(1), 5–27.
Förster, M., Tarcali, G., & Till, M. (2004). Income and non-income poverty in Europe: What is the minimum acceptable standard in an enlarged European Union?. Vienna: European Centre for Social Welfare Policy and Research.
Frey, B. S., & Stutzer, A. (2002). What can economists learn from happiness research? Journal of Economic Literature, 40(2), 402–435.
Frijters, P., Haisken-DeNew, J. P., & Shields, M. A. (2004). Investigating the patterns and determinants of life satisfaction in Germany following reunification. The Journal of Human Resources, 39(3), 649–674.
Garner, T. I., Shipp, S., Steiger, D. M., & Manieri, T. (1998). Subjective assessments of economic well-being: Cognitive research at the U.S. Bureau of Labor Statistics. Focus: Revising the poverty measure, 19(2), 43–46.
Goedhart, T., Halberstadr, V., Kapteyn, A., & van Praag, B. M. S. (1977). The poverty line: Concept and measurement. The Journal of Human Resources, 12(4), 503–520.
Goedhart, T., van Praag, B. M. S., & Kapteyn, A. J. (1980). The poverty line: A pilot survey in Europe. The Review of Economics and Statistics, 62(3), 461–465.
Goerke, L., & Pannenberg, M. (2015). Direct evidence for income comparisons and subjective well-being across reference groups. Economics Letters, 137(C), 95–101.
Hagerty, M. R., et al. (2001). Quality of life indexes for national policy: Review and agenda for research. Social Indicators Research, 55(1), 1–96.
Helson, H. (1947). Adaptation-level as frame of reference for prediction of psychophysical data. The American Journal of Psychology, 60(1), 1–29.
Kahneman, D., & Tversky, A. (1979). Prospect theory: An analysis of decision under risk. Econometrica, 47(2), 263–292.
Kapteyn, A., Kooreman, P., & Willemse, R. (1988). Some methodological issues in the implementation of subjective poverty definitions. The Journal of Human Resources, 23(2), 222–242.
Kenny, C. (1999). Does growth cause happiness, or does happiness cause growth? Kyklos, 52(1), 3–25.
Lane, R. E. (1991). The market experience. Cambridge: Cambridge University Press.
Likert, R. (1932). A technique for the measurement of attitudes. Archives of Psychology, 22(140), 5–55.
Machonin, P. (1994). K sociologické komparaci české a slovenské společnosti (Towards sociological comparison of Czech and Slovak society). Sociológia, 26(4), 333–345.
Noll, H.-H., & Weick, S. (2010). Subjective well-being in Germany: Evolutions, determinants and policy implications. In B. Greve (Ed.), Happiness and social policy in Europe (pp. 70–90). Cheltenham: Edward Egar.
Ogburn, W. F. (1946). A study of rural society. Cambridge: Riverside Press.
Petrunyk, I., & Pfeifer, C. (2016). Life satisfaction in Germany after reunification: Additional insights on the pattern of convergence. Jahrbücher für Nationalökonomie und Statistik (Journal of Economics and Statistics), 236(2), 217–239.
Pradhan, M., & Ravallion, M. (2000). Measuring poverty using qualitative perceptions of consumption adequacy. The Review of Economics and Statistics, 82(3), 462–471.
Ravallion, M. (2014). Poor, or just feeling poor? On using subjective data in measuring poverty. In A. Clark & C. Senik (Eds.), Happiness and economic growth: Lessons from developing countries (pp. 140–174). Oxford: Oxford University Press.
Ravallion, M. (2016). The economics of poverty: History, measurement, and policy. New York: Oxford University Press. ISBN 978-01-9021-276-6.
Santarelli, E. (2013). A review of the literature on subjective poverty in Europe: A focus on data sources. Sapienza University of Rome, Working paper no. 118.
Steger, M. F., & Samman, E. (2012). Assessing meaning in life on an international scale: Psychometric evidence for the meaning in life questionnaire-short form among Chilean households. International Journal of Wellbeing, 2(3), 182–195.
Stiglitz, J. E., Sen, A., & Fitoussi, J.-P. (2009). Paris: Commission on the measurement of economic performance and social progress. https://ec.europa.eu/eurostat/documents/118025/118123/Fitoussi+Commission+report. Last accessed November 2018.
Stutzer, A. (2004). The role of income aspirations in individual happiness. Journal of Economic Behavior & Organization, 54(1), 89–109.
Thijssen, J., & Wildeboer Schut, J. M. (2005). Armoede in hoofdlijnen. In C. Vrooman, H.-J. Dirven, A. Soede, & R. Trimp (Eds.), Armoedemonitor (pp. 16–52). Den Haag: Sociaal en Cultureel Planbureau.
Van den Bosch, K. (1993). Poverty measures in comparative research. In J. Berghman (Ed.), The European face of social security: Essays in honour of Herman Deleeck (pp. 3–23). Aldershot: Avebury.
van Praag, B. M. S., & Ferrer-i-Carbonell, A. (2004). Happiness quantified. A satisfaction calculus approach. New York: Oxford University Press.
van Praag, B. M. S., & Ferrer-i-Carbonell, A. (2008). A multidimensional approach to subjective poverty. In N. Kakwani & J. Silber (Eds.), Quantitative approaches to multidimensional poverty measurement (pp. 135–154). New York: Palgrave Macmillan.
van Praag, B. M. S., Frijters, P., & Ferrer-i-Carbonell, A. (2003). The anatomy of subjective well-being. Journal of Economic Behavior & Organization, 51(1), 29–49.
Večerník, J., & Mysíková, M. (2016). Poverty in the Czech Republic: A critical look at EU indicators. Prague: SOÚ AV ČR. ISBN 978-80-7330-290-0.
Veenhoven, R. (2002). Why social policy needs subjective indicators. Social Indicators Research, 58(1–3), 33–46.
Vintrová, R. (2008). Česká a slovenská ekonomika 15 let po rozdělení (The Czech and Slovak economy 15 years after the split). Politická ekonomie, 56(4), 449–466.
Vintrová, R. (2009). Lessons from the Czech and Slovak economies split. Prague Economic Papers, 18(1), 3–25.
Vogel, J. (2002). Strategies and traditions in Swedish social reporting: A 30-year experience. Social Indicators Research, 58(1–3), 89–112.
Vrooman, C. J. (2009). Rules of relief; institutions of social security, and their impact. The Hague: The Netherlands Institute of Social Research. ISBN 978-90-3770-218-7.
Vrooman, C., & Hoff, S. (Eds.). (2004). The poor side of the Netherlands; results from the Dutch ‘Poverty monitor’, 1997–2003. The Hague: Social and Cultural Planning Office.
Ward, T., & Ozdemir, E. (2013). Measuring low work intensity—An analysis of the indicator. ImPRovE Methodological Paper No. 13/09. Antwerp: Herman Deleeck Centre for Social Policy—University of Antwerp.
Wong, C. K., Wong, K. Y., & Mok, B. H. (2006). Subjective well-being, societal condition and social policy—The case study of a rich Chinese society. Social Indicators Research, 78(3), 405–428.
Želinský, T. (2014). Poverty and deprivation in Slovakia: Methodological aspects and empirics. Košice: Equilibria. ISBN 978-80-8143-134-0.
Acknowledgements
This work was supported by the European Regional Development Fund—Project “CSDA Research” (No. CZ.02.1.01/0.0/0.0/16_013/0001796) and by the Slovak Scientific Grant Agency (VEGA 2/0002/19). Tomáš Želinský further acknowledges support for visiting the Institute of Sociology of the Czech Academy of Sciences financed within the Protocol on cooperation in the field of education, youth and sports between the Ministry of Education, Science, Research and Sports of the Slovak Republic and the Ministry of Education, Youth and Sports of the Czech Republic. The EU-SILC datasets were made available on the basis of Contract No. 265/14 between the European Commission, Eurostat, and the Institute of Sociology of the Czech Academy of Sciences. Thanks for additional data information go to the Statistical Office of the Slovak Republic and the Czech Statistical Office. The authors especially wish to thank Andrew Clark, who provided valuable comments and ideas as a discussant of this paper at the IARIW 2018 General Conference. The authors would also like to thank the anonymous reviewers for their helpful and constructive comments which substantially contributed to the overall readability of the final version of this paper. Responsibility for all conclusions drawn from the data lies entirely with the authors.
EU-SILC datasets versions
EU-SILC UDB 2005—version 5 of August 2009 | EU-SILC UDB 2011—version 5 of March 2017 |
EU-SILC UDB 2006—version 4 of March 2010 | EU-SILC UDB 2012—version 5 of March 2017 |
EU-SILC UDB 2007—version 6 of August 2011 | EU-SILC UDB 2013—version 4 of March 2017 |
EU-SILC UDB 2008—version 7 of March 2015 | EU-SILC UDB 2014—version 3 of March 2017 |
EU-SILC UDB 2009—version 7 of March 2015 | EU-SILC UDB 2015—version 2 of March 2017 |
EU-SILC UDB 2010—version 6 of March 2015 | EU-SILC UDB 2016—version of October 2017 |
Author information
Authors and Affiliations
Corresponding author
Additional information
Publisher's Note
Springer Nature remains neutral with regard to jurisdictional claims in published maps and institutional affiliations.
Appendix
Appendix
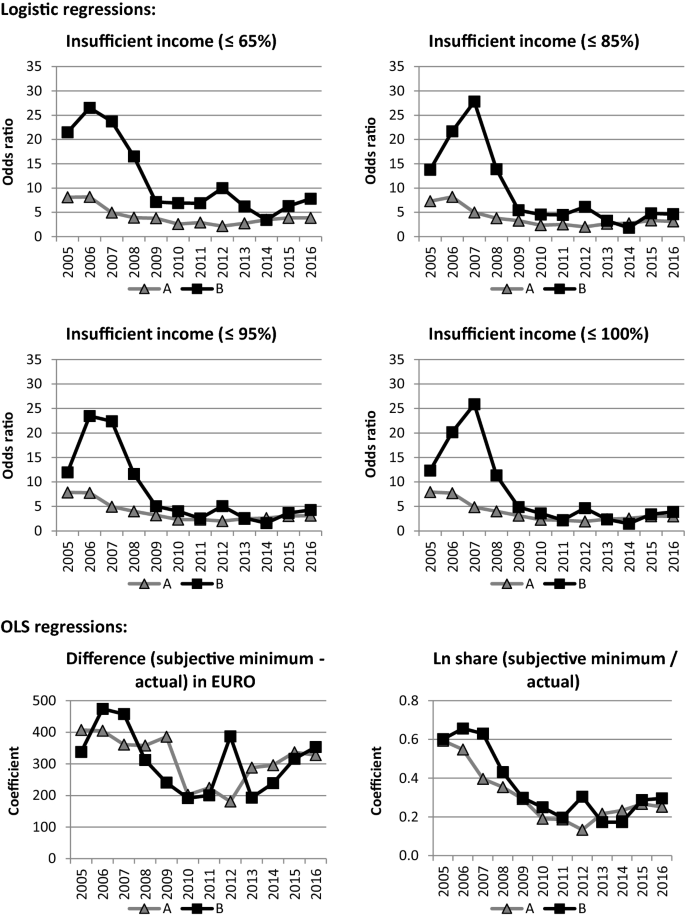
Source: EU-SILC 2005–2016. Own computations
Regression analysis of different definitions of insufficient income indicator as the dependent variable, SK dummy (odds ratio/coefficients), 2005–2016. Notes: Respondents aged 16+. All coefficients of the SK dummy are statistically significant at the 1% level. Model A controls for demographic characteristics. Model B additionally controls for socioeconomic and regional macroeconomic characteristics (see Sect. 3 on the list of control variables). GDP is missing in 2016. (Robust standard errors were used.)
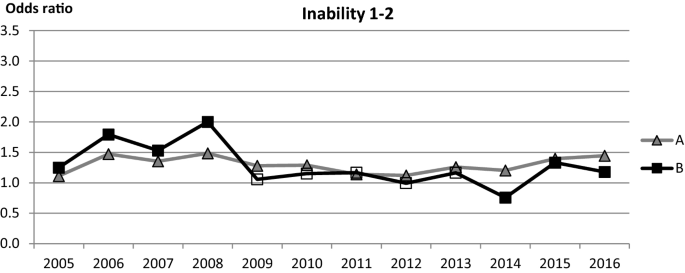
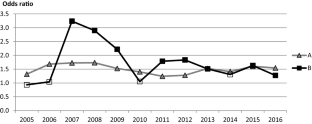
Source: EU-SILC 2005–2016. Own computations
Logistic regression of inability (1–2)—SK dummy (odds ratio), 2005–2016. Notes: Inability indicator (1–2): the dependent variable equals 1 if the answer was “great difficulty” or “difficulty”. Respondents aged 16+. Coefficients in Model A are statistically significant at the 1% level; in Model B, empty marks represent coefficients which are not statistically significant at the 10% level, other coefficients of the SK dummy are statistically significant at least at the 10% level. Model A controls for demographic characteristics. Model B additionally controls for socioeconomic and reginal macroeconomic characteristics (see Sect. 3 on the list of control variables). GDP is missing in 2016. (Robust standard errors were used.)
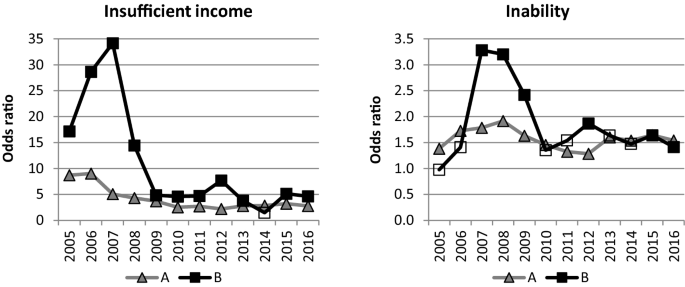
Source: EU-SILC 2005–2016. Own computations
Logistic regression of insufficient income and inability—SK dummy (odds ratio), subsample of respondents answering household questionnaire, 2005–2016. Notes: Only respondents aged 16+ responsible for answering household questionnaire are included. Empty marks represent coefficients which are not statistically significant at the 10% level; all other coefficients of the SK dummy are statistically significant at the 5% level. Model A controls for demographic characteristics. Model B additionally controls for socioeconomic and reginal macroeconomic characteristics (see Sect. 3 on the list of control variables). GDP is missing in 2016. (Robust standard errors were used.)
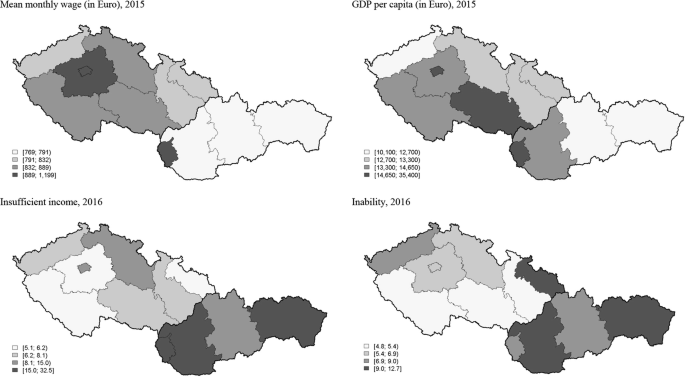
Source: EU-SILC 2015 and 2016 (own computations); Eurostat database for GDP (current prices, Euro per capita—variable nama_10_pc)
Spatial distribution of mean wage, GDP, insufficient income and inability (NUTS2 regions), 2015–2016. Notes: Maps were created using (c) EuroGeographics for the administrative boundaries “NUTS 2013” shapefiles.
Rights and permissions
About this article

Cite this article
Mysíková, M., Želinský, T., Garner, T.I. et al. Subjective Perceptions of Poverty and Objective Economic Conditions: Czechia and Slovakia a Quarter Century After the Dissolution of Czechoslovakia. Soc Indic Res 145, 523–550 (2019). https://doi.org/10.1007/s11205-019-02102-2
Accepted:
Published:
Issue Date:
DOI: https://doi.org/10.1007/s11205-019-02102-2