


Abstract
Electron cyclotron wall condition (ECWC) discharges are characterised in ASDEX Upgrade with full tungsten plasma facing components and X2 polarised waves launched from the equatorial ports, relevant to ECWC conditions in ITER Pre-Fusion Power Operation phase 1. The characterisation of the deuterium plasmas is based on experimental inputs such as electron density measurements, in-vessel pressure measurements, poloidal field maps obtained from the measured coil currents, as well as advanced tomographic methods on camera images filtered at the hydrogen Balmer lines. TOMATOR-1D simulations and collective Thomson scattering radiometer spectra complement the findings. The cold, high density and partially ionized toroidal plasmas show significant levels of stray radiation. The measured radiation includes waves at half of the gyrotron frequency suggesting the occurrence of parametric decay instabilities at 2nd harmonic upper hybrid resonance that locates at the low field side of the resonance. A displacement of the plasma emission along the resonance layer is observed at higher discharge power in discharges with a vertical poloidal magnetic field only. By optimizing the poloidal field pattern, along with the location of the electron cyclotron heating (ECH) resonance, the strongest surface interaction regions for the charged particles can be controlled. Directing plasma flux to inner wall surfaces, and same for the inner divertor apron, is found less effective in ASDEX Upgrade due to magnetic mirror effects and outward convective flows. Modeling however predicts the presence of an intense and uniform flux of low energy atoms produced at the ECH absorption layer that may be effective for conditioning the high field side surfaces after use of the disruption mitigation system.
Export citation and abstract BibTeX RIS

Original content from this work may be used under the terms of the Creative Commons Attribution 4.0 license. Any further distribution of this work must maintain attribution to the author(s) and the title of the work, journal citation and DOI.
1. Introduction
The toroidal magnetic field in ITER, generated by superconducting magnets for which the number of cycles has been reduced to a few 10 s in the ITER lifetime, excludes use of DC glow discharges for fuel removal and wall conditioning during the ITER operations campaigns. To allow wall conditioning in the presence of the toroidal field, ion cyclotron wall conditioning (ICWC) and electron cyclotron wall condition (ECWC) are proposed [1]. It is the question how often such conditioning is necessary. At JET, after the installation of the ITER-like wall, long duration glow discharge conditioning was sufficient to prepare the device for the entire campaign without further need for inter-pulse wall conditioning [2]. However, at ITER ICWC and ECWC may be needed to recondition the device after the use of the ITER disruption system (DMS) [3, 4], assist isotope changes and possibly control the tritium inventory [5].
During ITER PFPO-1 (first pre-fusion power operation), ECWC will be the only available conditioning technique, with up to 20 MW of electron cyclotron heating (ECH) power available from upper and equatorial launchers, mostly operated at the X2 wave polarization (BT = 2.65 T, 170 GHz). The unprecedented levels of ECH power and the sheer size of the ITER vacuum vessel, as well as the limited experience with this technique in present tokamaks call for dedicated experiments aimed at preparing ECWC as a conditioning tool for ITER. Such experiments aim at studying the physics of ECWC as well as demonstrating its safety and effectiveness by focusing on three main themes: (a) the ECH absorption efficiency in the stable ECH plasma including the role of multi-pass absorption, (b) the required ECH power for efficient neutral gas breakdown and (c) the applicability of ECWC for different cleaning purposes. The experiments are especially challenging since most of the tokamak diagnostics are not well adapted to the low density, low temperature and partially ionised ECH plasma.
The here presented experimental and analysis results of ECWC in ASDEX Upgrade focus mostly on the first and the third aspects. ECWC discharges can only be produced in the presence of the electron cyclotron resonance (ECR) layer or its second harmonic. The produced plasma is optically thin with a low absorption efficiency of ECH power per pass even at the fundamental of the ECR frequency. This can be of concern for machine safety with a risk of exposing in vessel componentsor diagnostics to excessive stray radiation. The localized power absorption moreover affects the discharge uniformity and the plasma-wetted area. ECWC relies on plasma-induced hydrogen or impurity desorption and so, the removal from a plasma-facing component (PFC) is determined by the particle fluence to it. It has been shown that both the ECH absorption efficiency as well as the particle flux can be controlled by applying an appropriate poloidal field pattern that gives a small pitch angle to the toroidal field lines of typically less than 1%. A vertical poloidal field of about 0.5% of BT at the resonance layer was shown to maximize the ECH absorption in TCV [6]. The trapped particle configuration (TPC) was shown to increase ionization by enhancing particle confinement through magnetic mirroring in VEST and TST-2 [7, 8]. Finally, quadrupole-like poloidal field maps applied in TCV have shown to improve the plasma wetted area at the high field side (HFS) [9]. The here presented results hence study the ECH power dependency for ECWC in ASDEX Upgrade with estimates of the absorption efficiency, as well as identifying optimal poloidal field maps for ECWC and the mechanism of their improved performance.
2. Experiment and analysis setup
The ECWC plasmas in ASDEX Upgrade are produced in deuterium with an on-axis (R = 1.65 m) toroidal magnetic field ranging from 2.2 to 2.5 T, a power of 0.5–1.5 MW at the extra-ordinary polarisation of the second harmonic ECH wave (X2) and a neutral pressure of 2–30 mPa. Figure 1 shows typical time traces of two discharges with a vertical poloidal field and a 3rd (green) with hexapolar field. The ECH power (figure 1(a)) is applied through the mid-plane launchers by 4 different gyrotrons at 140 GHz. The X2 waves are entering the vessel horizontally with a small toroidal angle, as shown in figure 2, such that the power is dispersed on a tungsten limiter at the low field side (LFS) after a first reflection at the HFS wall. An energy limit of 60 kJ per gyrotron and per pulse is set to protect in vessel components from the ECH radiation in the case of a failed breakdown (which did not happen in the 19 pulses with X2 polarisation at 140 GHz although it could not be ruled out). At 500 kW, this limits the pulse duration per gyrotron to 120 ms and allows e.g. 240 ms long pulses at 1 MW by chaining 2 times two gyrotrons together as in discharge 39 358 (blue in figure 1) which uses first gyrotron G3 and G4, then G1 and G2. This relatively short discharge duration, combined with a low pulse repetition rate of on average one discharge every 20 min (ECWC discharges in ASDEX upgrade are applied with the normal pulse control sequence), has put the focus of these pulses rather on plasma production and discharge characterisation studies than on impurity or fuel removal. The D2 gas injection (figure 1(c)) starts 4 s before applying ECH to obtain a stable pressure at breakdown. The poloidal field is settled as well before the pulse. Coil current ramps are performed (figure 1(d)) during the pulse to assess the role of the poloidal field amplitude and pattern. These currents followed pre-set values at a rate limited by their self-inductance.
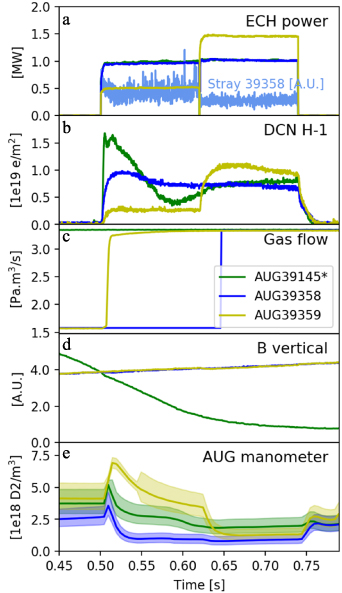
Figure 1. Overview of X2 ECWC discharges 39 145 (* time axis delayed by 0.2 s), 39 358 and 39 359 in ASDEX upgrade: ECH power, line integrated electron density, D2 gas flow, poloidal magnetic field strength and main chamber mid-plane neutral D2 density (manometer 14).
Download figure:
Standard image High-resolution image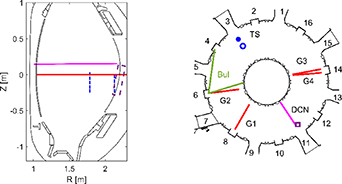
Figure 2. Overview of the ECH beam launch paths (red, first pass only), DCN interferometer (pink, H-1), Thomson Scattering diagnostic locations (blue), MILS (purple) and the viewing range of visible 'Bul' cameras (green).
Download figure:
Standard image High-resolution imageIt is seen that the line integrated density (figure 1(b), with integration path indicated in figure 2) increases approximately linearly with the ECH power, respectively 2.5 × 10¹⁸, 6.5 × 10¹⁸ and 9.3 × 10¹⁸ m−2 at 0.5, 1.0 and 1.5 MW in the pulses with vertical poloidal field. The latter field, varying slightly from 0.47% to 0.68% of the toroidal field on axis between 0.5 s as 0.74 s as shown by magnetic probe measurement at the HFS (figure 1(d)), has less effect on the density. The insignificant drop in the filtered ECH sniffer signal (figure 1(a)) at the beginning of the pulse for the 1 MW pulse illustrates the low (<50%) single pass absorption efficiency in these discharges. The trends of the final key parameter of the ECWC discharges are illustrated in figure 1(e). The D2 density briefly spikes at the plasma breakdown phase due to an intense flux of low energy dissociation neutrals and the subsequent release of surface absorbants from the PFC's, as seen in [10]. Hereafter the gas density drops quickly to reach a steady value where valve and wall fuelling are balanced by vacuum and plasma pumping. Stepping up the gas flow at 0.65 s in the highest power phase was done to prevent a further drop of the neutral density. It is seen to have little immediate effect on the line integrated density.
The following sections present diagnostic developments and modeling results that provide a better plasma characterisation. The efforts are motivated by the fact that most tokamak diagnostics are not well adapted to the low density, low temperature and partially ionised ECH plasma. The plasma characterisation is based on (a) electron density measurements by interferometry [11], Thomson scattering (TS) at R = 1.78 m and 2.12 m [12] and microwave intensity refractometry in the limiter shadow (MILS) at R = 2.19 m [13], (b) in-vessel pressure measurements using the ASDEX gauges [14] (5th plot) and (c) absolute calibrated cameras sharing the same view, three of which filtered on the α, β and γ hydrogen Balmer lines [15]. The diagnostic locations are indicated in figure 2. Tomographic inversions are applied on the camera images as detailed in the next sections. Plasma parameters are estimated from their characteristic line ratios as detailed in [16]. The experimental results are complemented by simulations using the TOMATOR-1D code [6], exploring possible ranges of the plasma parameters. Finally, the poloidal field maps are obtained from the measured coil currents.
3. Results
3.1. Camera observation of ECH absorption locations
Figure 3 summarises the distinct features that are observed with the filtered cameras. The first three frames show the different ECH power phases with a pure vertical magnetic field (figure 1, yellow and blue), the last has curved poloidal field lines (figure 1, green) as further detailed in section 3.6. For reference, the blue arrow in the images indicates the second harmonic electron cyclotron location, identified as the location where the first emission is seen in every discharge. It is observed that the vertical position of the emission at the EC layer moves downward at higher power (figures 3(b) and (c)) in the discharges with a vertical poloidal field. The displacement is absent in the discharge with curved poloidal field lines (figure 3(d)). Secondly, at lower power (0.5 MW, figure 3(a)) there is a faint additional emission ring visible at the LFS of the EC resonance. This feature is clearer in the discharge with curved poloidal field lines shown in figure 3(d) which has in common with figure 3(a), a relatively high D2 density above 2 × 10¹⁸ m−3. At 1.0 MW of launched ECH power, the radial line integrated density of figure 3(d) was similar to that of figure 3(b). Finally, at the HFS of the EC resonance there is a clear vertical emission layer visible in figures 3(b) and (c) and less pronounced in figure 3(d).
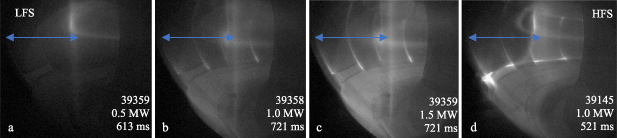
Figure 3. Tangential camera images filtered at the Balmer gamma line for X2 ECWC discharges 39 358, 39 359 & 39 145 in ASDEX upgrade (D2 fuelling and 2.5 T). The blue arrow indicates the second harmonic electron cyclotron location.
Download figure:
Standard image High-resolution imageIn the next sections it is considered that the additional emission ring at the LFS is due to wave absorption at the 2nd harmonic upper hybrid resonance (UHR). The vertical displacement of the emission at the EC resonance may be linked to another process than simple wave refraction near the ECH cut-off as this would imply very high plasma densities. The vertical emission at the HFS may be a recombination front, although this process is highly dependent on electron temperature and unlikely results in a perfect vertical appearance. Therefore, it is considered that the emission is due to wave absorption, potentially at a different frequency than the launched wave. To better understand these different observations, it is necessary to determine the plasma parameters at and around the emission locations, as well as their position in the poloidal plane to identify a possible dependence on the magnetic field strength. The remainder of this results section is dedicated to this.
3.2. Camera tomography to localise the emission origin
Figure 3 showed that visible light imaging of the ECWC discharges allows observing distinct plasma features of interest. However, the projection of the 3D objects onto the camera's 2D chip complicates the interpretation of camera images. To circumvent this, tomographic inversions of the data were realized. For this purpose, the observed features in the vessel, distinct from the emissions at the surfaces, were assumed to be toroidally symmetric. This is a good assumption for the effects that are determined by ECH since (a) the magnetic field was mostly toroidal in these experiments, (b) charged particles move with a high parallel speed along the magnetic field lines and (c) the neutral density is likely to be uniform in the toroidal direction. At the PFCs, however, the symmetry is disputable as sharp edges and nonhomogeneous emission arise, as can be seen in figure 3. These asymmetries produce artefacts in the reconstructions that were either insignificant or very distinguishable, allowing interpretation of the reconstructed emission maps. Another particular challenge for emission inversions are reflections on the PFCs. A reflection model for ASDEX Upgrade has been created previously using the Cherab framework [17]. This model was included in the tomography geometry and inverted using the Gaussian process tomography (GPT) inversion scheme [16]. To assess the influence of reflections on inversions of ECWC plasma, the GPT results were compared to inversions without accounting for reflections. As the reconstructed emissivity showed good agreement in the ECH absorption region, and because the computations are significantly less demanding, the inversions presented in this paper are calculated without considering reflections. Next, several algorithms have been used to perform these inversions [16, 18, 19]. As the results of each are in close agreement, only the ones obtained with the MFR [19] are presented in this article. Finally, the field of view of the cameras was modelled as a pinhole camera using the Calcam software [20], allowing for a precise spatial calibration, important for position estimations.
Figure 4 shows tomographic inversions of the single images shown in figures 3(a), (c) and (d). By mapping the plasma emission to the poloidal plane, quantitative statements can be made about the observations discussed in section 3.1. ECH absorption in the lowest density discharge occurs where ECH waves launched in the mid-plane intersect the vertical 2nd harmonic resonance layer (figure 4(a)). The previously described additional plasma emission location can be seen at about 5 cm to the LFS of the 2nd harmonic resonance, indicated by the inclined white arrow. At higher electron density (and lower neutral density), the brightest absorption zone moves down to about 15 cm below the mid-plane (figure 4(b)). At the HFS of the indicated 2nd harmonic resonance for the 140 GHz waves, the described additional vertical emission line is observed. Its position corresponds to a toroidal field of 2.68 T, as indicated. The strong emission at the lower outer wall results from toroidal uniform recycling light near the tungsten coated tiles. The localized asymmetric emission discussed above results in small artefacts about 40 cm below the mid-plane, which indeed do not interfere with the main observations. In figure 4(c) the additional absorption point can be seen at about 15 cm to the LFS of the 2nd harmonic resonance, indicated by the inclined white arrow. To explain the emission by effects occurring at the 2nd harmonic upper hybrid resonance (UHR) the electron density needs to be 1.25 × 10¹⁹ m−3 at this location.
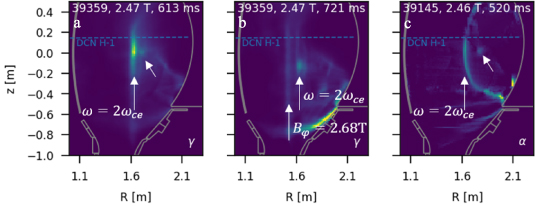
Figure 4. Poloidal emission reconstruction of tangential camera images shown in figures 3(a)–(c) and (d). The path of the interferometry line, location of the 2nd harmonic ECH resonance and additional observations of interest are indicated (see text).
Download figure:
Standard image High-resolution image3.3. Exploring possible plasma parameters with TOMATOR-1D
The 1D transport model TOMATOR-1D was previously used to study X2 ECWC discharges in TCV obtained by vertical interferometry chords [6]. The model reproduced the density profiles of the discharges in helium providing insights on transport in the toroidal plasmas and the fraction of absorbed EC power. It is here used to explore the possible plasma profiles of the hydrogen discharges in ASDEX upgrade shown in figures 3(a)–(c). Simulation results for each of the ECH power phases: 0.5 MW (blue), 1.0 MW (red) and 1.5 MW (yellow) are shown in figure 5. The simulated profiles result from conventional assumptions on anomalous diffusion and outward convection as described in [6]. The numerical coefficient for the anomalous diffusion scaling was set at 1.0 and that for the E × B drift scaling at 5.0, both about 5 times higher than the TCV study of He-ECWC plasmas. The available TS measurements at R = 1.78 m and 2.12 m, averaged over z = [−0.25 to 0] m, are added with their respective error bar. The squares at the LFS corresponds to available MILS data. The coupled power in the simulation is set to match these measurements. The line-integrated density of these profiles is 4%–84% higher than that of the experiments, which can be explained by the off-centre location of the interferometer chord as shown in figure 4. The simulation cases assume that the power is absorbed at the 2nd harmonic resonance only, even though additional mechanisms as hypothesised above affect the density profiles as well. The 1D code assumes the plasma parameters to be parabolic in the vertical dimension. Using a vertical plasma dimension of 1 m, the coupled power in the 3 simulated phases is respectively 280 kW (blue), 285 kW (red) and 310 kW (yellow), in order to match the experimental densities. The experimental molecular hydrogen density, shown in figure 1(e), is imposed at the LFS and HFS wall as seen in figure 5(c) (solid lines). Other principle
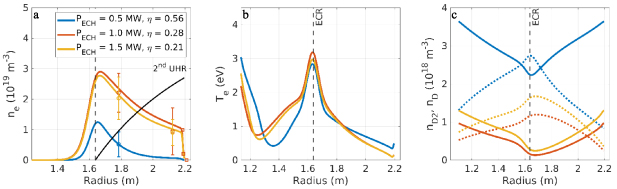
Figure 5. Tomator-1D simulations of electron density, electron temperature and neutral D (dashed) and D2 (solid) densities for ASDEX Upgrade discharges 39 358 and 39 359, shown in figure 1. The simulations reproduce the available density readings by TS and MILS, indicated by circles and squares, respectively. The solid black line shows the density for the 2nd harmonic UHR, the dashed lines the location of the 2nd harmonic ECH resonance.
Download figure:
Standard image High-resolution imageparameters such as the toroidal field of 2.5 T, a poloidal field of 0.6% and the ECH frequency of 140 GHz are set as well in agreement with the experiment. The model assumes charge neutrality in each of its grid points. And finally, in the cases studied here, the molecular ion densities ( ) are negligible compared to the atomic ion density (H+).
Figures 5(a)–(c) shows the simulated radial profiles of electron density, electron temperature and neutral densities, respectively. The pulses with a vertical poloidal field only show a density maximum near the resonance layer, decaying gradually toward the LFS while the density near the HFS PFC is negligible. The outward drift velocity in these simulations is in the range of 8 m s−1 while the diffusion is 0.2–0.6 m2 s−1. The atomic hydrogen flux estimated from the gradient of the atomic hydrogen density towards walls (dashed lines figure 5(c)) is 2–5 times higher at the HFS than at the LFS. The averaged flux of 1–5 × 1017 cm−2 s−1 originates mostly from dissociation or dissociative ionisation of hydrogen molecules upon electron impact around the resonance layer, where the electron temperature peaks at 2.8–3.2 eV. In the higher power cases, this temperature is high enough to almost fully deplete the molecular density at the resonance layer. The 0.5 MW phase with highest hydrogen molecular pressure (and best ECH absorption efficiency, determined within the limits of the model assumptions) presents the highest atomic flux.
Also plotted in figure 5(a) is the density for the 2nd harmonic UHR, or the UHR at 70 GHz (see section 3.4), which in tokamak discharges usually appears on the very LFS of the torus, especially in H-mode scenarios. It occurs here, according to the simulation results, at a distance of 10–27 cm from the EC resonance which corresponds approximately to the distances at which the localised plasma emission is seen in figure 4.
3.4. Possible observations of parametric decay instabilities
The appearance of the 2nd harmonic UHR allows for interesting effects such as parametric decay instabilities (PDI) [21] to occur in the vicinity of the EC resonance. Such instabilities lead to the generation of strong frequency-shifted microwaves near half the gyrotron frequency in the case of second-harmonic X-mode ECH operation. The appearance of waves at half the gyrotron frequency is confirmed by measurements using the collective Thomson scattering (CTS) radiometer. The CTS system measures in a narrow band around 140 ± 1.5 GHz and 70 ± 1.5 GHz of which a close up is shown in figure 6 for discharge 39 145. The left plots show the CTS signal while the right averages the spectra over a 0.1 ms wide time window indicated by the vertical dashed lines. The narrow peaks in the right upper plot correspond to the frequencies of the two operated gyrotrons, the pump waves, those of the lower plot are consistent with typical PDI daughter waves as reported in [21]. The latter peaks near half the gyrotron frequency are wider than the pump wave, with a width of several tens of MHz. To effectively convert the power of the pump wave to daughter waves by PDI, a local density bump must exist that effectively traps the daughter waves in a zone enclosed by the UHR condition. The occurrence of such zone will be further investigated in section 3.5.
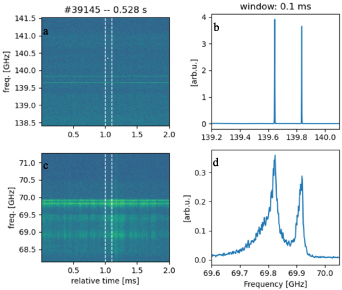
Figure 6. CTS radiometer spectra for ECWC discharge 39 145 in ASDEX upgrade showing the frequencies of the two gyrotrons around 140 GHz, and the potential PDI daughter waves near half the frequency.
Download figure:
Standard image High-resolution imageThe left bottom plot shows that additional waves are detected at the lower frequency of about 69 GHz and 69.5 GHz. In case these signals originate from cyclotron emission (ECE) by energetic electrons in the plasma rather than from PDI, it must be considered that the emission at half the gyrotron frequency may result as well from ECE. In this case, the width of the daughter wave peaks may be representative for the width over which energetic electrons exist.
Finally, an RF absorption layer was observed at the HFS of the 2nd harmonic ECH resonance, the location of which corresponding to a toroidal field of 1.68 T (figure 4(b)). As the CTS radiometer operated in a small band only, there is no data to confirm whether this emission originates from upshifted ECH waves (i.e. 147 or 73.5 GHz). Similarly, no indications of resonant absorption by ions has been seen in the neutral particle analyser, unlike in similar discharges with heating in the ion cyclotron range of frequencies (ICRF) only [22]. The latter waves would result from a secondary decay of the daughter wave into upper hybrid waves with a frequency slightly below 70 GHz and ion Bernstein waves in the ion cyclotron range of frequencies, as observed in tokamak plasma in multiple devices [23, 24].
3.5. Estimates of peak density and temperature through characteristic radiation
A method for estimating the plasma parameters in the 2D poloidal plane using the reconstructed toroidally symmetric distributions of the emitted light was developed and tested on the ECWC images [16]. The method was originally intended for studying the X-point radiator regime where the hydrogen Balmer α, β and γ spectral lines result mostly from excitation of hydrogen atoms and the recombination of ions. It is here applied to ECH absorption zones in ECWC plasma where the brightest Balmer spectral emission is observed and where, according to the simulations of figure 5(c), the molecular density is near depletion. Figure 7(a) shows how the plasma parameters are determined for a single point in the mid-plane at the ECH absorption zone, using the reconstructed emissions from the three filtered and calibrated cameras. It plots for each of the Balmer lines (red: α, green: β and blue: γ) the plasma density that delivers the observed emission intensity as a function of the electron temperature. The atomic density is set to 1018 m−3, in close agreement to the simulation predictions described in section 3.3. The colour bands represent a relative error bar of the emission of 30 %. A consistent combination of temperature and density is found were these bands mix into black. While the range of possible plasma parameters is large, the most probable plasma parameter can be obtained by looking for the minimum in the error function below using the Nelder-Mead method, where  is from the collisional radiative model,
  is from the reconstructions and
  is the maximum of the measured emissions.
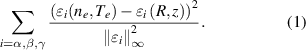
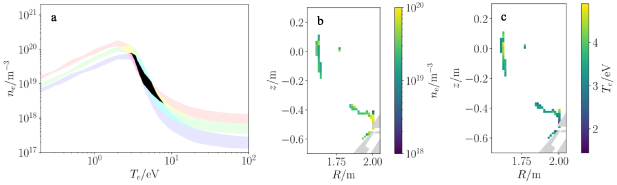
Figure 7. Left: illustration of the method to infer electron density and temperature from Balmer α (red), β (green) and γ (blue) emission intensities for a single voxel in the poloidal plane, assuming an atomic density of 1018 m−3. Cyan is the intersection of β and γ, yellow is the intersection of α and β, black, indicating possible plasma parameters for this voxel, is the intersection of α, β and γ. Right: Inferred 2D electron density and temperature for ECWC discharge 39 145 in ASDEX Upgrade showing absorption at the 2nd harmonic ECH resonance and to the LFS, potentially near densities corresponding to 2nd harmonic UHR resonance. The density and temperature estimates close to the lower LFS wall result likely from inversion artifacts [16].
Download figure:
Standard image High-resolution imageThis procedure is automated and repeated for every grid point. The minimisation starts each time at  and
and  [16]. The resulting electron density and temperature are shown in figures 7(b) and (c) for the voxels where
  such that the emission at this voxel is more than 20% of the maximum emission in the poloidal plane. This resulted in an electron temperature in the range of 2.5–5 eV and an electron density of ∼1–5 × 10¹⁹ m−3 at the ECH resonance, corresponding very well to the simulation results of section 3.3. It should be noted that these values, demonstrating the applicability of the method for ECWC plasmas, are indicative only. It is at this stage impossible to conclude whether the plasma emission in the midplane at the LFS of the resonance corresponds to ECH interaction at the 2nd harmonic UHR (PDI, see section 3.4), although density estimates at this location are shown. Indeed, figure 7(a) shows that electron temperatures up to
  and electron densities in the range of 5 × 10¹⁸ to 1 × 10²⁰ m−3 are compatible with the data. It remains to be explained why this lower limit is above 5 × 10¹⁹ m−3 in another discharge [16]. Thus, further developments are needed to increase accuracy. Table 1 compares finally, the contributions of excitation and recombination to the observed emissions at the density and temperature estimates of figures 7(b) and (c). Excitation accounts for most of these emissions throughout, while recombination gains importance at lower temperatures. Gamma emission has the highest relative contribution from recombination compared to alpha and beta emission, about half of its total emission at 2.5 eV.
Table 1. Contribution of electron impact excitation of H atoms and recombination of H+ ions on the emission intensities at the Balmer alpha (3 → 2), beta (4 → 2) and gamma (5 → 2) transitions at an electron and atomic density of 3 × 10¹⁹ m−3 and 1018 m−3, respectively. The atomic ion density is equal to the electron density. The photon emissivity coefficients are obtained from the ADAS database [25]. Recombination is given as % of the total radiation (exc. + rec.).
| Balmer alpha | Balmer beta | Balmer gamma | ||||
|---|---|---|---|---|---|---|
| Excitation | Recombination | Excitation | Recombination | Excitation | Recombination | |
| 2.5 eV | 178 W m−3 | 5.02% | 17.8 W m−3 | 22.4% | 2.89 W m−3 | 47.4% |
| 5 eV | 1650 W m−3 | 0.191% | 183 W m−3 | 0.871% | 27.6 W m−3 | 2.96% |
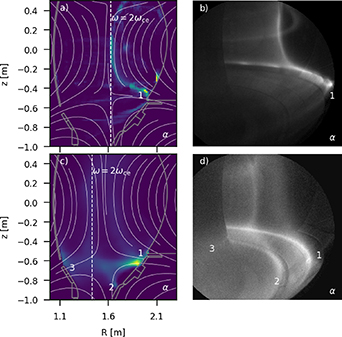
3.6. Directing particle flux to the HFS through optimized poloidal field maps
The discharges with vertical poloidal field lines only do not bring a charged particle flux to the HFS, as needed for wall conditioning. This is seen in the simulations in section 3.3 as well as previously in TCV [9]. It is known from latter experiments that the addition of a radial field component is necessary to expand the discharge to the HFS. To confirm this result on a larger device, the flux optimisation by means of optimised poloidal field maps was further explored in ASDEX Upgrade.
Figure 8(a) shows a 2D α-emission reconstruction overlaid with the poloidal magnetic field map and the location of the 2nd harmonic resonance. The original tangential camera image is given in figure 8(b). The hexapole poloidal field with a strength of about 0.3% at the vessel centre has two field nulls, one above the mid-plane and one below it, at  0.5 and −0.45 m respectively. The EC resonance is located slightly to the LFS of these field nulls. It is clearly seen that this makes the plasma flow from the resonance layer, where it is heated, along the bended field lines to the LFS wall where it marks a bright toroidal strike line. This parallel flow, but also the cross field transport of a quasi-neutral plasma consists of equal amounts of electrons and hydrogen ions. The small discrepancies between the emission map and the field lines can be explained by an inaccurate reconstruction of the poloidal field, imprecision in the camera calibration or by cross-field plasma drifts. Indeed, the ion sound speed, taken as a measure of the plasma velocity along the field lines, projected on the poloidal plane, is only an order of magnitude above the outward drift velocity (estimated in section 3.3).
Figure 8. ECWC discharges 39 145 and 39 228 in ASDEX Upgrade demonstrating localized interaction with the plasma facing components by shaping of the poloidal field map and positioning of the ECH resonance (indicated by vertical dashed line). Right: tangential camera image filtered at the Balmer α line. Left: emission reconstruction in the poloidal plane overlaid by the poloidal field lines.
Download figure:
Standard image High-resolution image
Figure 8(c) shows a discharge with similar poloidal field map but with the EC resonance located at about 10 cm to the HFS from the field null. The corresponding tangential camera image is given in figure 8(d). Instead of guiding the plasma from the resonance, along the field lines, to the HFS, again a clear strike line is seen at the LFS together with a second interaction zone at the outer divertor apron. The first strike line may result of plasma transport, across the magnetic field and outward, followed by a flow along the field lines. The second, as the tangential image suggests, is of plasma flowing along the field lines to the HFS, where it is reflected before reaching the inner wall, to continue along the lower leg of the hexapole field toward the outer divertor apron. A third strike line at the HFS, suggested by the hexapole field map, is not clearly seen in the original camera image (figure 8(d)). Several variations on the field pattern have been tried to conclude that a visible plasma interaction at the HFS can only be obtained if the resonance layer is sufficiently close to the inner wall (which is not the case in the discharges of figure 8). The reconstructed plasma image (figure 8(c)) however does show emissions at the HFS near the 3rd strike point. These may result from an artefact in the inversion and needs to be investigated further.
4. Discussion
Analysis and operation of ECWC is unusual since most of the tokamak diagnostics are not well adapted to the low density, low temperature and partially ionised ECH plasma. Even more, to protect optical and microwave diagnostics from excessive stray radiation, several shutters in ASDEX Upgrade remain closed during ECWC. In the present experiment, the ECWC plasmas are hence characterised by a combination of newly developed camera analysis methods, 1D plasma simulations, density measurements and ASDEX Upgrade neutral density gauges. These combined tools allow a consistent estimate of the plasma parameters in the discharges which is needed to interpret several new observations related to ECH physics and the applied magnetic field pattern.
The TOMATOR-1D simulations provide insight in the plasma parameters and their dependency on the applied discharge parameters. The one-dimensional profiles are simulated in radial direction while the plasma is assumed to be parabolic in vertical dimension. However, it is clear from the camera images that the plasmas have a more complex 2D appearance even in pulses with pure vertical poloidal field. Therefore, to better understand the achievable plasma parameters, plasma transport and EC power requirements, the discharges should be simulated in the poloidal plane. The inversions of filtered tangential camera images into 2D poloidal emissivity maps can be used to validate such 2D simulation tool, comparing experimental with synthetic images from simulations. The collisional radiative model to construct such synthetic images is however fairly complex due to the low electron temperature, the relatively high density of neutral molecules and the wide electron density range with a low ionisation fraction away from the resonance layer. Nevertheless, taking into account excitation and recombination emissions of atomic hydrogen only, plasma parameters could already be reasonably inferred from the emission intensity ratios of the Balmer lines, but only at the highest density locations. The use of an inert seed impurity such as helium and its characteristic lines can improve the accuracy of such an analysis and extend the range of validity to areas of lower density.
The model assumes thermal electrons although the effect of the ECH waves is to accelerate single electrons to higher energies and thus an energetic population must be expected near the resonance layer. The acceleration of electrons by ECH waves can be estimated, ignoring collisions and other effects, using the equations described in [26]. In the case of a 3.2 cm wide Gaussian beam with nearly perpendicular launch angle, representative of our experimental conditions, the electron acceleration is maximum 330 eV for 0.5 MW of launched ECH power. This electron velocity is oriented mostly perpendicular to the field lines and is isotropised within a few passes around the torus by Coulomb collisions between electrons, and thermalized after a few turns more. For comparison, an electron that travels four toroidal turns at the applied field of 0.4% is displaced by 15 cm in the vertical direction, a distance over which the density may have dropped already by a factor 2 according to the diffusion rate estimated in the simulations. The mean free path of these electrons for collisions with the hydrogen molecules is about 100 m which allows most of them to travel more than 50 cm in the poloidal plane, corresponding to the dimensions of the observed effect. It is therefore possible that the plasma reflection effect approaching point 3 at the HFS, seen in figures 7(c) and (d), follows from magnetic mirroring of energetic particles that have escaped the high-density area, as seen in VEST and TST-2 [7, 8]. Nevertheless, as mentioned, the observation may follow additionally from an outward drift that prevents the thermal plasma, flowing along the field lines, to reach the HFS.
The cold X2 resonance layer is located at 5.4 m in ITER, at more than twice the distance to the HFS wall than in the experiments in ASDEX Upgrade. Hence, magnetic mirroring and plasma drifts will make it challenging to condition the HFS surfaces by a charged particle flux, for example to allow robust ITER plasma start-up. Increasing the charged particle flux at the HFS may require reducing the toroidal field, hence moving the resonance close to the HFS, combined with an optimised poloidal field pattern. Such changes to the toroidal field are not foreseen in ITER. It remains to be investigated whether the additional absorption layer observed at the HFS of the resonance in ASDEX Upgrade can be reproduced in ITER and controlled to increase the plasma density near the HFS. Separately, it also remains to be studied if the flux of low-energy atoms in the hydrogen plasma, born near the absorption layers, is effective to deplete the HFS surfaces from DMS gases after a mitigated disruption. When relying on these neutrals rather than on ions for conditioning, one can optimise the poloidal field map to maximise the production of neutrals (and ECH absorption) rather than the charged particle flux. In comparison, ICWC owes its efficiency largely to the uniform flux of energetic charge exchange neutrals originating from collisional and resonant power absorption by ions in the ICRF fields. On the other hand, ICWC discharges in ASDEX Upgrade with the same poloidal field patterns as the studied ECWC pulses form a uniform plasma that clearly reaches the HFS, so that the conditioning by charged particles at the HFS in ICWC cannot be neglected. Moreover, it appears that ICWC discharges are less sensitive to the shape of the poloidal field than ECWC discharges.
Finally, the presented 1D simulations assume that the ECH power is absorbed (directly by thermal electrons or through energetic electrons) at the 2nd harmonic resonance only. Estimates of resonant absorption by optical thickness or 2D ray tracing models predict that elevated levels of stray EC radiation are to be expected in ECWC plasma, even in optimised conditions (shown by the EC sniffer signal in figure 1(a)). It is therefore clear that minimising stray radiation will benefit from an additional mechanism of power absorption that may occur within the physics boundaries of the problem, namely, a partially ionised high density plasma with anomalous transport in a toroidal magnetic field above 1 T with the wave frequency of the order of 100 GHz. Three observations indicate the occurrence of atypical ECH physics in the described pulses with possible influence on the absorption efficiency: (a) the vertical displacement of the plasma emission in case of higher power, lower neutral density and a vertical poloidal field, (b) the possible observation of PDI at the 2nd harmonic UHR located up to 15 cm at the LFS of the EC resonance and (c) the appearance of a possible additional absorption layer up to 10 cm at the HFS of the EC resonance. The importance of these effects on the overall power balance of the ECWC discharges, and whether or not these effects are reproduced with poloidally inclined ECH launch relevant to ECWC in ITER remains to be investigated. Finally, the presence of the primary PDI and possible cascade PDI means that pre-cautions as proposed in [27] need to be taken to protect microwave diagnostics from the ECH daughter waves.
5. Conclusion
ITER will use ECWC after DMS events, to assist fuelling changes and for tritium inventory control in its operational campaigns during which the toroidal magnetic field is continuously present. In PFPO-1, ECWC will operate mostly at the second harmonic X2 ECH wave polarization from upper and equatorial launchers. The here presented experiments in ASDEX Upgrade with full tungsten plasma facing components characterise ECWC discharges with X2 waves launched horizontally from the equatorial ports. The characterisation of the deuterium plasmas is based on experimental inputs such as interferometry, Thomson scattering and MILS densities, in-vessel pressure measurements, poloidal field maps obtained from the measured coil currents, as well as advanced tomographic methods using filtered cameras at the hydrogen Balmer lines. Simulations using the TOMATOR-1D and CTS radiometer spectra complement the findings.
Several distinct features have been observed in camera images, and are confirmed in the reconstructed emission patterns in the poloidal plane. The vertical position of the emission at the EC layer moves downward at higher power and lower neutral pressure in discharges with a vertical magnetic field. Curved poloidal field lines such as in the tested hexapolar pattern avoids this effect while maintaining similar electron density. An additional toroidal emission ring is visible at about 5–15 cm to the LFS of the 2nd harmonic ECH resonance. The simulated density profiles suggest that the 2nd harmonic UHR is located at this position. This would allow for the occurrence of PDI in the vicinity of the EC resonance, leading to the generation of frequency-shifted microwaves at half the gyrotron frequency. The presence of waves at these frequencies is confirmed by CTS radiometer spectra. For PDI to occur, the daughter waves need to remain effectively trapped in a zone enclosed by the UHR condition. This zone is found to be marked by the observed toroidal emission ring. The plasma parameters at this location are inferred in the 2D poloidal plane from the emission intensity ratios of the Balmer lines, using the reconstructed toroidally symmetric distributions of the emitted light. The present method considers atomic excitation and recombination only, and delivers as such estimates at the highest electron density locations where the molecular density is low as shown by the TOMATOR-1D simulations. Despite the high error bars, the analysis places the density at the toroidal emission ring tentatively around the UHR density which then indeed provides the conditions for PDI. The vertical absorption layer observed at the HFS of the 2nd harmonic ECH resonance is at present not understood.
Optimising the poloidal field map allows to direct the charged particles flux to a precise poloidal location on the wall. It is clearly seen that the plasma flows from the resonance layer, where it is heated, along the curved field lines to the wall where it marks a bright toroidal strike line. Placing the resonance at or slightly to the LFS of the field nulls of a hexapolar magnetic field results in a clear toroidal strike line at the LFS surfaces. When the resonance locates at the HFS of the nulls, the same LFS strike line appears with, in addition, a second interaction point at the lower leg of the lower hexapole null. The expected third interaction point at the HFS leg of the same null seems absent, even though the field lines at the ECH resonance are curved towards this HFS location. The flux directed to the HFS mostly returns before reaching the wall due to the magnetic mirror effect and/or due to the outward convective drift. To increase the charged particle flux to the inner wall surfaces it is necessary to position the resonance layer closer to the HFS. In ITER, however, the position of the resonance is determined by the ECH frequency and the toroidal field such that the conditioning of the inner wall surfaces must rely, in part, on the intense source of low energy atoms, produced at the resonance. This may affect the applicability of ECWC for tritium recovery from deposit layers, while the ability for operation recovery after shattered pellet injection was recently shown in KSTAR [28].
The TOMATOR model is a useful tool to explore the possible plasma parameters of the ECWC discharges. The model calculates radial density and temperature profiles for each of the plasma species, while the observed effects in the experiment show that the discharges are essentially 2D. To better predict the EC absorption efficiency at the X2 polarisation in ITER, as well as the role of poloidal field maps on the achievable plasma parameters and the particle fluxes to the plasma facing components, a 2D plasma description for ECWC must be envisaged. The inversions of filtered camera images into poloidal emissivity maps can be used to benchmark such 2D simulation tool, comparing experimental with synthetic images from simulations while diagnostics such as interferometry, Thomson scattering and MILS remain necessary to complement such advanced methods.
The present experiment brings important insights to ECWC discharges in ITER. It shows that more work is needed to understand the propagation and absorption of ECH waves in the high density, partially ionised toroidal plasmas. The poloidal field pattern, together with the location of the ECH resonance, determines the strongest interaction areas for the charged particles. Directing plasma flux to inner wall surfaces, and the same for the inner divertor apron, is counteracted by magnetic mirror effects and outward convective flows. This may make ECWC less attractive for fuel recovery from deposits at the inner divertor, although further optimisation studies are needed. The uniform conditioning by an intense flux of low energy atoms produced at the ECH can however be effective for main chamber conditioning after DMS events.
Acknowledgments
This work has been carried out within the framework of the EUROfusion Consortium, funded by the European Union via the Euratom Research and Training Programme (Grant Agreement No. 101052200—EUROfusion). Views and opinions expressed are however those of the author(s) only and do not necessarily reflect those of the European Union or the European Commission. Neither the European Union nor the European Commission can be held responsible for them. Authors affiliated to the Institute of Plasma Physics of the Czech Academy of Sciences were also supported by the MEYS project number 9D22001. The work of S.K. Nielsen and A.S. Jacobsen was funded by research Grant 15483 from VILLUM FONDEN.