


Abstract
The paper presents an analysis of disruptions occurring during JET-ILW plasma operations covering the period from the start of ILW (ITER-like wall) operation up to completion of JET operation in 2016. The total number of disruptions was 1951 including 466 with deliberately induced disruptions. The average rate of unintended disruptions was 16.1 %, which is significantly above the ITER target at 15 MA. The pre-disruptive plasma parameters are: plasma current Ip = (0.82–3.38) MA, toroidal field BT = (0.98–3.4) T, safety factor q95 = (1.52–9.05), plasma internal inductance li = (0.58–1.86), Greenwald density limit fraction FGWL = (0.04–1.61), with 720 X-point plasma pulses from a subset of 1420 unintended disruption shots. Massive gas injection (MGI) has been routinely used in protection mode both to terminate pulses when the plasma is at risk of disruption and to mitigate against disruption effects. The MGI was mainly triggered by the n = 1 locked mode (LM) amplitude exceeding a threshold or by the disruption itself, namely, either dIp/dt (specifically, a fast drop in Ip) or the toroidal loop voltage exceeding threshold values. For mitigation purposes, only the LM was used as a physics precursor and threshold on the LM signal was used to trigger the MGI prior to disruption. Long lasting LM (≥ 100 ms) do exist prior to disruption in 75% of cases. However, 10% of non-disruptive pulses have a LM which eventually vanished without disruption. The plasma current quench (CQ) may result in 3D configurations, termed as asymmetrical disruptions, which are accompanied by sideways forces. Unmitigated vertical displacement events (VDEs) generally have significant plasma current toroidal asymmetries. Unmitigated non-VDE disruptions also have large plasma current asymmetries presumably because there is no plasma vertical position control during the CQ and so they too are subject to large vertical displacements. MGI is a reliable tool to mitigate 3D effects and correspondingly sideways forces during the CQ. The vessel structure loads depend on the force impulse and force time behaviour, including their rotation. The toroidal rotation of 3D configuration may cause resonance with the natural frequencies of the vessel components in large tokamaks such as ITER. The JET-ILW amplitude-frequency interdependence of toroidal rotation of 3D configurations is presented.
Export citation and abstract BibTeX RIS
1. Introduction
The first non-disruptive tokamak pulse, also known as a magnetohydrodynamical (MHD) stable plasma, was obtained on the TM-2 tokamak in 1962 [1–5]. The TM-2 experiments manifested Shafranov's predictions for MHD stable plasmas [6]. The MHD mode structure during the pulse and prior to disruption was carefully investigated on the T3-A tokamak in 1970 [7]. It revealed a low m mode (m = 2) as a precursor to disruptions. During a major disruption a rapid change of the poloidal mode number from m = 2 to m = 3 was discovered on the T-6 tokamak in 1978 [8]. Later on disruption studies have been made in various tokamaks including JET [9–29].
Nevertheless, the occurrence and behaviour of disruptions remains poorly understood and further studies must be carried out. This paper presents an analysis of disruptions occurring during JET-ILW (all metal wall with ITER-like Be/W composition [30]) plasma operations covering the period from 24/08/2011 (#80 128, first ILW plasma pulse) up to 15/11/2016 (#92 504).
In many tokamaks, massive gas injection (MGI) has become a popular tool to prevent machine damage during disruptions, particularly to eliminate melting of the plasma facing component (PFC) and to mitigate disruption electromagnetic loads [18, 20, 31]. A disruption mitigation system (MGI and shattered pellet injection (SPI)) is intended to be used on ITER [32, 33]. On JET, MGI has been routinely used in protection mode, both to terminate pulses when the plasma is at risk of disruption and to mitigate against disruptions. Given that a high stored energy plasma can damage beryllium tiles in the case of a disruption involving a vertical displacement events (VDE), the use of MGI is mandatory in JET for Ip ≥ 2.0 MA or internal (thermal + poloidal magnetic) plasma energy Wtot ≥ 5.0 MJ [34, 35]. The above criteria for MGI usage were tightened up in 2019. Specifically, in the case of VDEs the use of MGI is mandatory now for Ip ≥ 1.25 MA to prevent melting of Be at the top and W at the bottom-outer part of the machine. The MGI was mainly triggered by the n= 1 locked mode (LM) amplitude when the amplitude (or normalised by Ip amplitude) exceeds the specific threshold or by the disruption itself, specifically by plasma current derivative (dIp/dt, namely, a fast drop in Ip) or by toroidal loop voltage when these quantities exceed their specific thresholds. Hence, on JET only the n = 1 LM was treated as a physics precursor of disruptions for the purposes of triggering the MGI.
The thermal quench (TQ) usually precedes the current quench (CQ) except during VDEs. The TQ may also induce substantial eddy currents in the wall, see simulation for ITER [36] and analytic assessment [37]. However, there is no reliable experimental evidence on JET which indicates that the TQ harms the machine either by forces or heat loads.
The unmitigated plasma CQ usually results in 3D configurations, termed as asymmetrical disruptions, which are accompanied by sideways forces [22, 23, 38–41]. The vessel structure loads depend on the force impulse and force time behaviour including its rotation. The toroidal rotation of 3D configurations is of particular concern because of potential resonance with the natural frequencies of the vessel components in large tokamaks such as ITER. The amplitude-frequency interdependence is important, since a simultaneous increase of amplitude and frequency would potentially create the most challenging load conditions.
Runaway electrons (RE) generated in disruptions, and mitigation of runaways, remain a major issue for ITER. The RE topic is not included in this paper; a recent RE study on JET-ILW can be found in [42].
The comparison of the presented JET-ILW disruption data with other metal-wall devices and with JET prior to the ILW is beyond the scope of this paper. However, some JET-C and JET-ILW disruption comparison can be found in [19–23].
This paper is an extended version of the material presented at FEC18 [28]. The JET-ILW disruption database which is used in this analysis is described in section 2. The composition of the different aspects of MGI usage is given in section 3. An update of the asymmetric vertical displacement event (AVDE) data, which extends the results presented in [22, 23], is outlined in section 4. The n = 1 LM pre-disruptive behaviour is described in section 5. The discussion of the given disruption analyses is in section 6.
2. Disruption database and statistics
2.1. Disruption database
The JET-ILW upgrade was completed in late 2010 [30]. The first commissioning pulse #79 856 was executed on 30/03/2011 with the first plasma pulse #80 128 on 24/08/2011. The total number of JET shots with at least one powered poloidal field (PF) or toroidal field (TF) coil was 12 649 in pulse range #79 856–#92 504. In the present analysis, a shot is treated as a relevant plasma shot if the plasma current |Ip| ≥ 0.8 MA for at least 0.25 s, figure 1. Accordingly, the number of plasma pulses during JET-ILW operation was 9686, which corresponds to 77% of the total number of shots. In this study, we defined disruption criteria based on reliable magnetic diagnostics with simple quantitative criteria, which we then used to build the JET disruption database. The magnetic diagnostic quantities, which are recorded at a 5 kHz sampling rate, have been used to identify the disruptive shots and define the time of disruption (Tdis). The quantities are two toroidally opposite average plasma current measurements (Ip), plasma current vertical centroid position (Zp) and their derivatives, and toroidal loop voltages, which are measured at two poloidal locations on the inner wall of JET vessel, figure 2. In this paper a left-hand coordinate system was chosen for disruption analyses, hence Ip is positive.
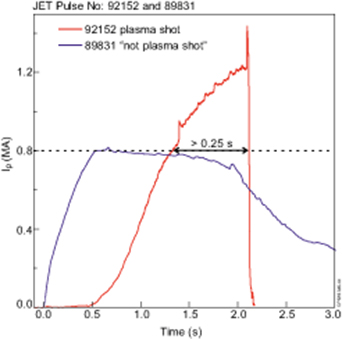
Figure 1. Only shots with plasma current |Ip| ≥ 0.8 MA for at least 0.25 s were used for disruption database.
Download figure:
Standard image High-resolution image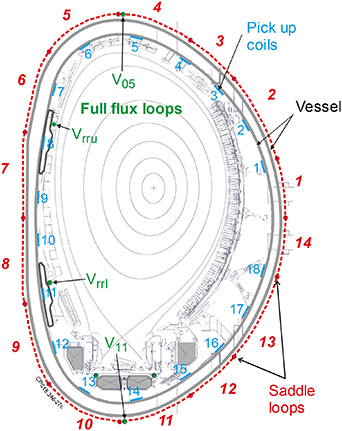
Figure 2. JET magnetic diagnostics used to identify the disruption shots: in-vessel pick up coils for plasma current, pick up coils and ex-vessel saddle loops for plasma current vertical centroid position and toroidal loop voltages.
Download figure:
Standard image High-resolution imageThe loss of the poloidal magnetic flux due to the large MHD events causes the electromagnetic circuit of the plasma to respond with a positive spike in the plasma current. The induced negative current which flows in the vessel manifests itself as a large negative impulse in the toroidal full flux loops, Vrru and Vrrl, see flux loop locations in figure 2. The following disruption criteria have been used to build the disruption shot list:
- (i)Fast drop of the plasma current, d|Ip_2|/dt > 20 MA s−1, so it does not detect the fast Ip spike but only the start of a CQ, where Ip_2 is two toroidally opposite plasma current measurements, which are averaged and ± 2 ms triangular smoothed;
- (ii)Normalised average toroidal voltage VrrAN = (Vrru + Vrrl)/2Ip < −13 V MA−1, figure 3;
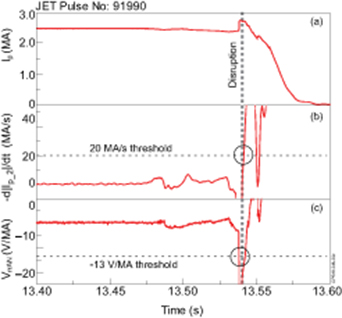
Figure 3. Major disruption must satisfy at least one criterion, −d|Ip_2|/dt > 20 MA s−1 or VrrAN < − 13 V MA−1: (a) plasma current, (b) plasma current derivative (c) normalised toroidal voltage.
Download figure:
Standard image High-resolution imageThe averaging of the two toroidally opposite Ip measurements is necessary to eliminate the n = 1 (i.e. 3D) effect. The smoothing removes fast transient Ip oscillations. Both criteria (i) and (ii) indicate an ongoing disruption. The pulse is treated as a disruption pulse if at least one of the criteria are met. The somewhat arbitrary choice of the numerical criteria has been justified by manual analyses of the numerous disrupted pulses. The adequacy of this disruption criteria is demonstrated in figure 4 which presents each disrupted pulse by a single point on the plane of maximum values of d|Ip_2|/dt derivative and normalised average toroidal voltage VrrAN, where the blue lines indicate the two disruption criteria. A typical non-disruptive pulse has d|Ip_2|/dt ∼ 0.1 MA s−1 with a noise level ∼ ± 0.2 MA s−1 across Ip ramp-down phase. The normalised loop voltage VrrAN is about zero value with a noise level ∼ ± 1 V, (hence a typical safe Ip ramp-down is nearby origin but outside the figure 4 plot area). A special criterion has been used to label a VDE pulse, where the loss of vertical plasma position control will result in a CQ: |ΔZp| > 0.225 m (∼a/4), where ΔZp is displacement respect of the steady-state prior to CQ, a is minor plasma radius.
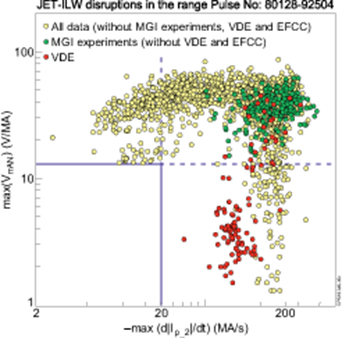
Figure 4. Disrupted pulses on the plane of maximum values of Ip_2 derivative and normalised toroidal voltage. The blue lines indicate the (i)–(ii) disruption criteria.
Download figure:
Standard image High-resolution imageAll MGI deliberately induced disruptions satisfied both criterion (i) and (ii). In case of plasma pulses with multiple subsequent disruptions (which are very common) the maximum presented values of d|Ip_2|/dt and VrrAN correspond to the first major disruption, see the next section for how the first major disruption was defined.
It is worth mentioning that criterion (ii) and the VDE criterion are not used in the real time (RT) JET disruption detection system. The RT disruption detection is outlined in the next section 2.2.
During #80 128–#92 504 JET-ILW operation there were 1951 disruptive shots, including 466 with deliberately induced disruptions. 431 out of the 466 induced disruptions belong either to MGI (massive gas injection), or to VDE and EFCC (error field correction coil) experiments (i.e. intentional disruptions). The rest (35) of the induced disruptions were caused by various human errors or specific hardware/software tests or faults (however, such occurrences could equally be in the 'un-intended' category). Hence the total number of unintended disruption pulses was 1951–466 = 1485 and the average disruption rate of unintended disruption was 1485/(9686–466) = 16.1% overall for JET-ILW pulses, figure 5.
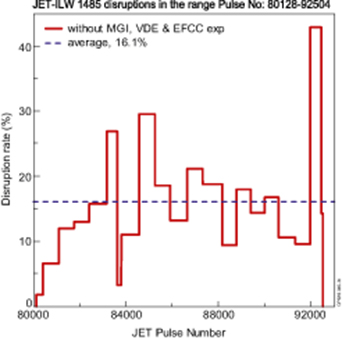
Figure 5. Disruption rate during 2011–2016 JET-ILW campaigns.
Download figure:
Standard image High-resolution imageThe noticeable drop in disruption rate in figure 5 in the range #83 623–#83 794 belongs to a special experiment ('H-mode experiments for wall retention studies and long term sample analysis'), when 149 H-mode nearly identical and reliable pulses were executed [21, 43] (we believe that in [21] and [28], the amount of 'nearly identical plasma discharges' includes erroneously a few faulty plasma pulses). Nevertheless, five shots (3.3%) were disrupted, thus reflecting the lowest disruption rate during JET-ILW exploitation. It can be seen in figure 6 that the total bolometer power (Prad) increases at 11 s and Te max drops from 13 s in one such disrupted pulse. The electron temperature continues to decrease at 14 s after NBI was turned off and the Cu19 line (273.36 Å) emission increases in intensity during this temperature decrease; the plasma passes through the most emissive temperature range for the line (figures 6 and 7). It is thought that the plasma is polluted by copper from NBI. Copper is used in an internal component of the NBI system, hence NBI could deliver the copper to the plasma. The main message from these 149 near identical primitive plasma pulses is that there are some uncontrolled causes which lead to disruptions.
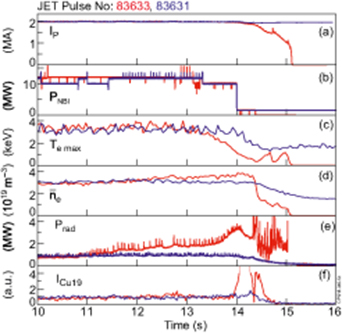
Figure 6. The waveforms of the nearly identical and 'reliable' pulses: (a) plasma current, (b) NBI power, (c) maximum electron temperature, (d) line averaged electron density, (e) total bolometer power, (f) Cu19 line (273.36 Å) emission intensity, horizontal line of sight at middle plane.
Download figure:
Standard image High-resolution image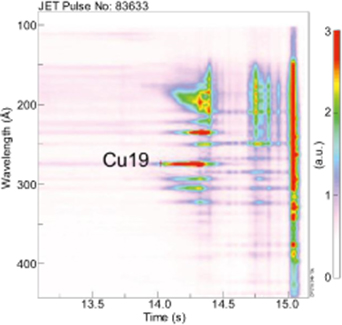
Figure 7. Impurity emission prior to disruption from a VUV spectrometer.
Download figure:
Standard image High-resolution imageThe disruption rate significantly increases in the last group of pulses from #91 960 to #92 442, as shown in figure 5. This can be attributed to exploration of the operational space for high performance plasmas and optimisation in preparation for the upcoming JET DT campaigns going significantly outside the operational boundaries explored so far.
2.2. Disruption time
Disruption criteria (i) and (ii) and the VDE criterion are used to create the disruption shot list. Plasma pulses with multiple subsequent disruptions are very common. A special criterion is used to determine the major disruption in these cases:
If d|Ip|/dt < −1.0 MA s−1 between two sequential voltage spikes with VrrAN < −13 V MA−1, then the disruption is defined to start at the first voltage spike. Should d|Ip|/dt > −1.0 MA s−1 occur for the whole time between two sequential voltage spikes, then the disruption is defined to start at the second voltage spike. If d|Ip|/dt < − 1.0 MA s−1 does not occur between any of the voltage spikes, then the last voltage spike with Ip > 0.8 MA defines the disruption; an example is shown in figure 8. In this example, the plasma re-heats after the first major disruption event at ∼13.3 s.
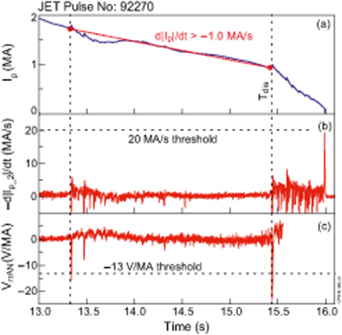
Figure 8. Illustration of the major disruption criterion usage: (a) plasma current, (b) plasma current derivative (c) normalised toroidal voltage. In this case the disruption is defined to start at 15.440 s because of a slow Ip drop after the first major disruption event at 13.336 s.
Download figure:
Standard image High-resolution imageOn JET in RT, the plasma current derivative alone was used to register disruption events and to estimate a disruption time  ) with the condition of 100 kA step in 2 ms (namely −d|Ip|/dt > 50 MA/s). We are almost certain that this
  ) quantity was used to build the early JET disruption database which has been analysed for example in [13]. The use of plasma current derivative alone has a disadvantage, since
  is late with respect to the sharp Ip rises and the toroidal voltage drops (which are manifested the start of the TQ and the MHD phase) by a few milliseconds.
The post pulse analyses can use a more sophisticated and reliable algorithm to build a disruption database. Namely, the Ip_2 (two toroidally opposite plasma current measurements, which are averaged and ±2 ms triangular smoothed), VrrAN (for non-VDE) and ΔZp (for VDE) waveforms are analysed to extract a disruption time, Tdis. The disruption time is defined as when d|Ip_2|/dt is maximum and/or VrrAN < −13 V MA−1 (whichever is sooner). Then the Tdis calculated float value is rounded down to the nearest millisecond and that is what is recorded in the database, see figure 9.
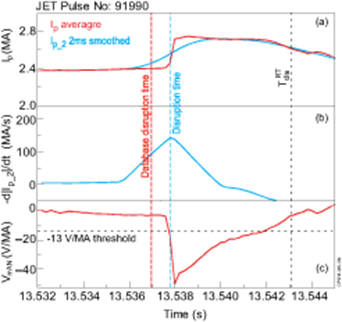
Figure 9. Illustration of Tdis calculation: (a) plasma currents, (b) plasma current derivatives, (c) normalised toroidal voltage.
Download figure:
Standard image High-resolution imageIn the case of VDEs, ΔZp and its derivative are used to calculate Tdis, with conditions |ΔZp| > 0.225 m and |dZp/dt| > 20 m s−1 must be simultaneously satisfied, figure 10. This definition of the Tdis of VDEs was chosen to define the time 'just' before the CQ. Other researchers may consider using other criteria since there is no solid scientific definition of the VDE 'disruption time'. In this study, the selected VDE thresholds were seen to be justified for all detected JET-ILW VDE pulses.
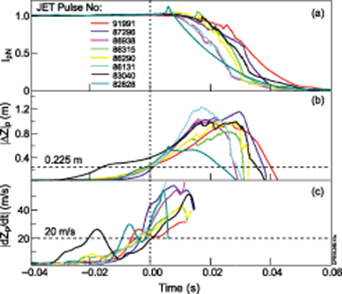
Figure 10. Illustration of Tdis calculation for VDE: (a) normalised plasma currents, (b) normalised plasma vertical displacement, (c) displacement derivative. The time axis is zeroed to Tdis.
Download figure:
Standard image High-resolution image2.3. Disruption classification
The pre-disruptive plasma parameters are as follows: current  ≡ Ip(Tdis) = (0.82–3.38) MA and toroidal field
  ≡ BT (Tdis) = (0.98–3.4) T. The pre-disruptive equilibrium parameters were taken from 5 kHz EFIT [44, 45] data which was available for 1420 out of 1485 unintended disruptive pulses. They are as follows: safety factor q95 = (1.53–9.1); plasma internal inductance li = (0.58–1.77), where dimensionless internal inductance li ≡li(3); normalized beta βN ≤ 2.91 (% · m · T/MA) [46]; poloidal beta βp ≤ 1.27 and plasma configuration (either X-point or limiter). The plasma has an X-point configuration prior to disruption for 720 pulses (∼50%) out of 1420 pulses. EFIT pre-disruptive plasma parameters are calculated as an average in the time window [Tdis − 5 ms: Tdis—1 ms].
In the majority of unintended disruptive pulses (∼96% from 1485 disruptions), the protection system detected an abnormal event such as a LM, impurity radiation, density limit, etc prior to disruption. The majority of the undetected unintended disruptions belong to hollow electron temperature collapse which is followed by disruption.
At disruption the Greenwald density limit fraction FGWL is in the (0.04–1.61) range, where FGWL is the line-averaged density divided by the Greenwald-density,  (
( ) in (MA, m, 1020 m−3) [47]. The line-average density is measured by the Thomson scattering diagnostics (HRTS and LIDAR) and mapped to a horizontal principal chord. The final available measurement of FGWL prior to disruption has been used to plot the distribution of pre-disruptive FGWL which significantly varies across disruption database, figure 11. For normal operation we would expect a Greenwald fraction of 0.4 to 1.0. However, a failure of the gas fuelling system can result in very low Greenwald fractions, and conversely during current ramp-down the Greenwald fraction sometime rises up to 1.6. Figure 11 shows that normalised Greenwald density largely varies over a large range prior to disruption, hence it cannot be used as reliable disruption predictor alone.
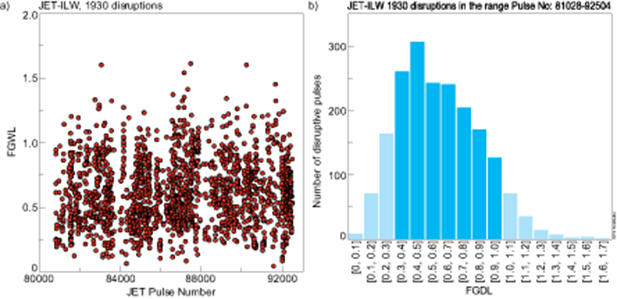
Figure 11. (a) Pre-disruptive fraction of Greenwald density limit varies significantly; (b) its distribution, where 'normal operation' in deep blue.
Download figure:
Standard image High-resolution imageUsing three quantities, dIp/dt, VrrAN and ΔZp, the disruptions were sorted into four categories, specifically:
- i.Fast d|Ip_2|/dt drop (> 20 MA s−1) and large negative toroidal voltage spike (< −13 V/MA), 76.5% of disruptions, such as in figure 3;
- ii.Slow |Ip_2| drop and large negative toroidal voltage spike, 11.7% of disruptions, such as in figure 12 (I);
- iii.Fast |Ip_2| drop and small negative toroidal voltage spike, 5.8% of disruptions, such as in figure 12 (II);
- iv.VDE, 5.9% of disruptions, such as in figure 10.
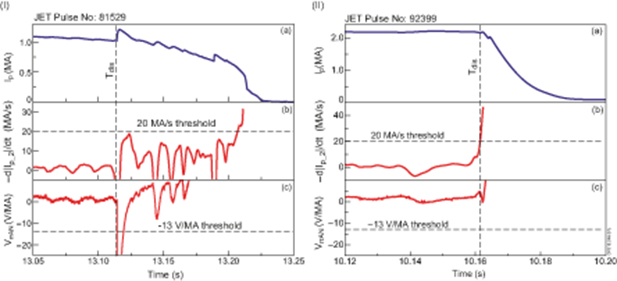
Figure 12. An example of disruption with (I) slow Ip drop and large negative voltage spike and (II) fast Ip drop and small negative voltage spike: (a) plasma current, (b) plasma current derivative, (c) normalised toroidal voltage.
Download figure:
Standard image High-resolution imageThe empirical stability li−q(a) diagram is widely used to present permissible values of li and q(a) [9, 48, 49], usually with the interpretation that the lower bound is due to ideal external kink modes and the upper bound is due to resistive kinks. For example, Cheng concluded that TFTR MHD-stable plasma current profiles tend to maintain itself inside the permissible values of li and q(a) [48]. The JET-ILW dimensionless internal inductance li and safety factor q95 are presented for all disruptions in the database in figure 13, showing a diffused cloud of the pre-disruptive data. From this it follows that that traditional li−q diagram does not specify the non-disruptive domain for JET-ILW. It is worth mentioning that the present definition of internal inductance li ≡li(3) differs from references [9, 48, 49], hence a direct quantitative comparison is not straightforward.
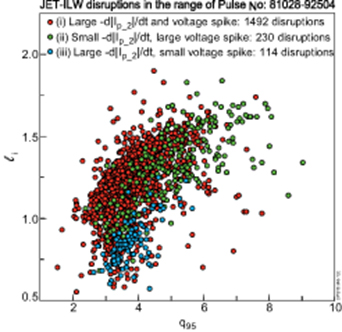
Figure 13. JET-ILW pre-disruptive parameters shown in a li−q95 stability diagram.
Download figure:
Standard image High-resolution imageThere is some separation of the (i)–(iii) disruption categories: category (i) disruption has an extended cloud of points, while category (iii) disruptions are characterised by flat current profile and moderate safety factor. The physical reason for some separation of (i)–(iii) categories is an outstanding issue, which will be the subject of a future study.
3. MGI usage
3.1. MGI triggering statistics
MGI has been routinely used in protection mode both to terminate pulses when the plasma is at risk of disruption, and to mitigate the potentially damaging impact of disruptions on the vessel and the PFC [18, 19, 50, 51]. During JET-ILW plasma operations (from #80 128 up to #92 504), in total 896 shots were ended by MGI, using typically an optimum gas mixture of 90% D2 + 10% Ar (which corresponds to 95.7% D atoms + 4.3% Ar atoms). The amount of injected gas varies from 1.6 bar · l (6.8 · 1022D atoms + 3.8 · 1021 Ar atoms) to 10.7 bar · l (4.5 · 1023D atoms + 2.5 · 1022 Ar atoms) for DMV3 (Disruption Mitigation Valve #3, named 'Top,S' in [51]) and from 1.9 bar · l (2.3 · 1023D atoms + 1.3 · 1022 Ar atoms) to 26.3 bar · l (3.2 · 1024D atoms + 1.8 · 1023 Ar atoms) for DMV2 (Disruption Mitigation Valve #2, named 'Midpl' in [51]). It is worth mentioning that the quantity of injected atoms at 1.6 bar · l exceeds the total number of electrons in pre-disruptive plasma by approximately a factor 2.
In the majority of the mitigated disruptions, the MGI was triggered by a n= 1 LM amplitude exceeding its threshold (523 shots) or by the disruption itself, specifically by dIp/dt (207 shots) or by the toroidal loop voltage (145 shots). There are 21 exceptional cases when a MGI was triggered by other causes including pick up of an n= 2 mode oscillation by the plasma vertical control system (14 shots), and various other tests and faults. Moreover, 249 disruption shots were dedicated for MGI experiments, where MGI was triggered at a pre-programmed time.
The High Voltage (HV) JET systems, which includes the auxiliary heating (NBI, ICRH, LH) and some diagnostics (Li-beam, NPA, VUV spectroscopy, etc) have to be in a safe state when large gas quantities arrive in the vessel, hence the HV systems impose a delay before the MGI is fired. The MGI puts high pressure gas in the vessel where some of the HV systems operate. High voltage in high pressure gas will create breakdown and arcs which must be avoided in the machine.
The initial MGI usage had a conservative HV delay of up to 60 ms; however later the requested HV delay was reduced to as low as ∼10 ms, figure 14. The decrease in delay time is due to the implementation of a check on whether the NBI or RF power supplies have turned off. Figure 14 presents a specific property of the MGI usage on JET, but it also points out that, in general, tokamak HV in-vessel systems require some delay of MGI/SPI firing after triggering MGI/SPI for an emergency pulse suppression.
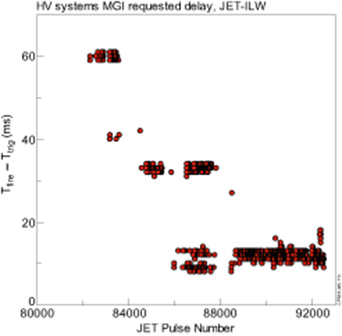
Figure 14. High voltage systems requested MGI delay, which was significantly reduced during of JET-ILW operation.
Download figure:
Standard image High-resolution image3.2. Effect of MGI on CQ duration
MGI increases plasma radiation, which has the effect of reducing both the thermal load and CQ duration, which additionally helps to reduce thermal loads on PFC [20]. The CQ duration is described by τ80-20, which is a time linearly extrapolated from the time taken to quench from 80% to 20% of  . The value of τ80-20 for JET should be in the region of (10–27.5) ms, with the lower threshold given by force loads on the machine [52] and the upper threshold justified by minimisation of thermal loads.
The CQ duration strongly depends on the injected gas amount and pre-disruptive plasma current (figures 15 and 16, where IQAN is the amount of gas in the DMV reservoirs). Also, the two main MGI systems, DMV2 and DMV3 (DMV1 was replaced by SPI during the 2016–18 shutdown) have different geometrical parameters [51] and to deliver the same amount of gas DMV2 must operate at ∼3 times higher pressure than DMV3. Thus, the efficiency of DMV2, in terms of τ80-20, is a factor of ∼2 higher than DMV3, figure 15. The CQ duration increases with the pre-disruptive plasma current, which may reflect the dependence of τ80-20 on the plasma current magnetic energy to be dissipated. The data presented in figures 15 and 16 have been used to justify the gas amount which are needed to achieve the target value of τ80-20 for JET of (10–27.5) ms. In figure 16 the CQ duration for high gas amount, IQAN2 = (23.4–26.5) bar · l shows weak dependence with the increasing Ip, however such gas amount outside the practical interest for JET.
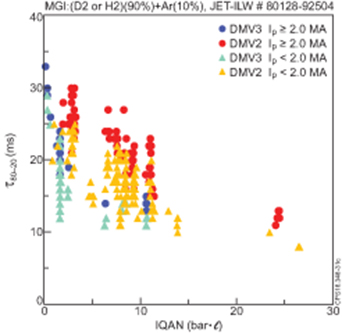
Figure 15. CQ time as a function of amount of injected DMV2 and DMV3 gas. The data presented is for high and low  .
.
Download figure:
Standard image High-resolution image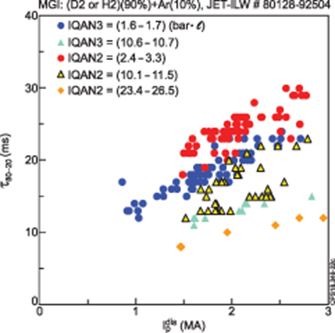
Figure 16. CQ time as a function of pre-disruptive plasma current,  , for various amount of injected gas IQAN for DMV2 and DMV3 and optimum gas mixture.
Download figure:
Standard image High-resolution imageFor MGI-induced disruptions the distribution of measured CQ time is shifted towards low CQ time and is much narrower in comparison with natural disruptions, figure 17; this is consistent with modelling where MGI boosts MHD instabilities, which enhance the penetration of the gas into the plasma [53, 54], and thus the overall rate of the energy loss from the plasma is boosted.

Figure 17. Distribution of measured CQ time with and without MGI applied.
Download figure:
Standard image High-resolution imageThe MGI effect on CQ duration for three different plasma conditions, (i) normal ('healthy') i.e. not prone to disruption, (ii) off-normal (affected by LM) pre-disruptive plasma and (iii) post-disruptive plasma is presented in figure 18. In cases of normal plasma MGI is triggered at a pre-programmed time, named 'MGI experiment' in figure 18. In cases of off-normal pre-disruptive plasma, MGI is triggered by LM amplitude. In cases of post-disruptive plasma, MGI is triggered by dIp/dt, product of the toroidal voltages, Vrru · Vrrl, or LM amplitude, which detect a major disruption. The Vrru · Vrrl product can also detect the start of VDE. It can be seen in figure 18 that there are small differences in the CQ duration; it is surprising that the distribution of measured CQ time shifts slightly towards lower CQ times for MGI experiments, when the gas is fired into normal ('healthy') plasma.

Figure 18. Distribution of measured CQ time for MGI experiments, when firing in normal i.e. not prone to disruption plasma; when MGI fired in post-disruptive plasma and when MGI fired in off-normal (affected by locked mode) pre-disruptive plasma.
Download figure:
Standard image High-resolution image3.3. Impact of MGI on vessel vertical force
Electro-magnetic (EM) loads arise during the CQ when currents are driven in machine conductive structures [20, 22, 23, 39]. It should be noted that the observed large forces on the JET vessel only occur during the CQ. The JET vessel axisymmetric oscillatory deformations and vessel reaction vertical forces mainly depend on  hence deformations and forces are not relevant to the TQ.
Due to the EM loads, the JET vessel experiences oscillatory deformations with main axisymmetric roll and asymmetrical sideways vessel movement modes [55] (see also schematic illustration—figure 14 in [20]), while vessel displacements and vertical reaction forces (FV) are measured. Figure 19 shows three shots: a VDE, a MGI terminated pulse and a central disruption (i.e. a disruption where the TQ appears before any significant vertical motion of the plasma occurs) followed by large plasma displacement during the CQ, where the vertical force waveforms are denoted as FV and peak-to-peak force is denoted as FZ. Figure 19 demonstrates that axisymmetric vessel reaction forces, FV, and axisymmetric vessel motion, Roll, are not affected by MGI. On the other hand, an asymmetrical sideways vessel displacement is significantly lower for the MGI mitigated disruption (see section 4).
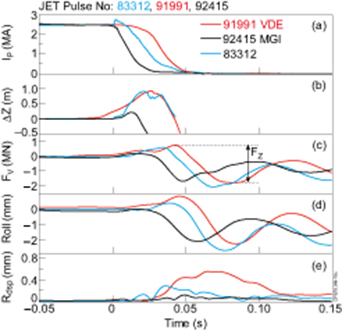
Figure 19. JET vessel reaction on CQ: (a) plasma currents, (b) vertical plasma displacements, (c) vessel reaction vertical forces, (d) vessel roll, (e) vessel horizontal displacements; #83 312 is the centred disruption. The time axis is zeroed to Tdis.
Download figure:
Standard image High-resolution imageThe dependence of FZ on pre-disruptive plasma current is presented in figure 20. In general, the FZ vessel reaction vertical forces for MGI mitigated disruptions (green points in figure 20) are below non-mitigated VDEs (red points) and below the upper bound of non-mitigated disruptions (yellow points). However, there are several non-MGI cases in which FZ is lower than with MGI for the same plasma current. The scatter in each subset of the points (MGI, VDE, neither MGI nor VDE) could be caused by the inappropriate behaviour of the plasma vertical position control system during the CQ or other effects, i.e. variation in plasma shape, which mask the MGI efficiency. We believe that the (33–40)% reduction in FZ due to MGI in [51] was obtained for a very specific subset of the pulses and, in general, a quantitative effect of MGI on FZ is less evident, see figure 20.

Figure 20. Vessel reaction vertical force vs. pre-disruptive plasma current.
Download figure:
Standard image High-resolution image4. Asymmetric VDE
This section is an update of the AVDE data, which extends the results presented in [22, 23]. The plasma CQ may result in 3D configurations, termed 'asymmetrical disruptions', which are accompanied by sideways forces [22, 23, 38–41]. At least three toroidally distributed measurements of Ip are needed for analyses [23]. The 5 kHz magnetics data from four toroidally orthogonal locations has been recorded for 95% of the disruptive pulses [23].
Unmitigated VDEs generally have significant plasma current toroidal asymmetries  , where
  ,
,  with Ip1 = octant 1 plasma current measurement etc figure 21. The development of the toroidal asymmetry
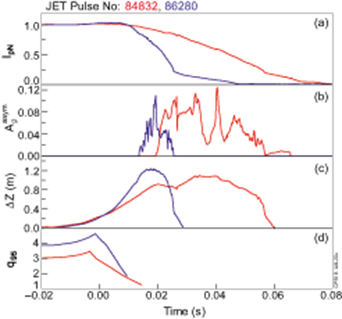
Figure 21. Unmitigated VDEs usually have large Ip asymmetries: (a) normalised plasma currents, (b) Ip asymmetries, (c) plasma vertical displacements, (d) safety factor. The time axis is zeroed to Tdis.
Download figure:
Standard image High-resolution imageis preceded by the drop approximately to unity of q95, see figure 21(d) and [22, 23]. However, MGI is a reliable tool to mitigate 3D non axisymmetric effects and correspondingly sideways forces [23] during the CQ, figure 22. To achieve the mitigation, the MGI, termed 'efficient' in figure 22, with proper pressure and gas composition must be fired in the early phase of the VDE [23]. Unmitigated disruptions also have large plasma current asymmetries, presumably because there is no proper plasma vertical position control during CQ; though the plasma vertical position control system is still active it cannot provide adequate reaction. In figure 22, the large scatter in the blue points which fill the space between the green MGI points and the red VDE (without mitigation) reflects the plasma VDE-like behaviour during the CQ after a 'central' major disruption.
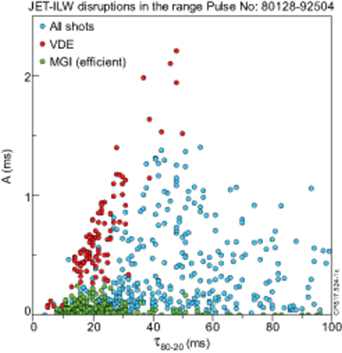
Figure 22. Normalised time integral of plasma current asymmetries vs. CQ time. The MGI efficient pulses are referred to the shots with the optimum pressure and gas mixture, when MGI fired w/o large delay.
Download figure:
Standard image High-resolution imageThe loads on the vessel structure depend on the force impulse and toroidal (azimuthal) motion of magnetic configuration together with the wetting zone, i.e. the part of inner wall surface, where plasma is in contact with the wall. The toroidal rotation of 3D configurations is of particular concern due to the associated rotation of sideways forces and potential resonances with vessel components [56]. The Ip asymmetry amplitude-frequency calculation procedure is illustrated by figure 23. For each disruptive shot, the time window for the calculation must be within the period where  is well above the noise level, i.e.
  > 0.01. During this period, the maximum and minimum toroidal phases (the toroidal phase, Ф, calculated from sine, ∼(
 and cosine, ∼(
 components) define the time window, Δt. The rotational frequency is calculated as
  . The rotational frequency, f is plotted against an average during
  time window of the Ip asymmetry,
  in figure 24.
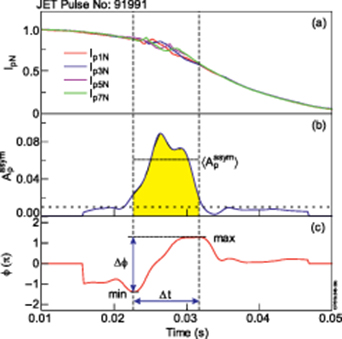
Figure 23. Illustration of calculation of rotational frequency and Ip asymmetry magnitude: (a) normalised plasma currents, (b) Ip asymmetries, (c) Ip asymmetry toroidal phase in π units. The time axis is zeroed to Tdis.
Download figure:
Standard image High-resolution image
Figure 24. Rotation frequencies vs. Ip asymmetry magnitude.
Download figure:
Standard image High-resolution imageThe amplitude-frequency interdependence could be important for ITER, since a simultaneous increase of amplitude and frequency would potentially create the most challenging load conditions. The rotating forces can be in resonance with natural frequencies of the machine in-vessel components which, in general, should have high natural frequencies and less mechanical reinforcement than the whole vessel, thus creating challenging load conditions in ITER and other future reactor scale tokamaks. Fortunately, as was found on JET the amplitude envelope of the plasma current asymmetries decreases with increasing frequency, as in figure 24.
The distribution is not symmetric around zero frequency. The rotation is mainly observed in the electron drift direction, a positive value indicates anticlockwise rotation opposite to the plasma current and toroidal field [23]. Understanding the origin and direction of Ip asymmetry rotation is still an outstanding issue.
5. Locked mode and disruption
This section presents some pre-disruptive LM behaviour. This topic is explored in more detail in [57]. The n = 1 locked mode amplitude and phase are obtained from ex-vessel saddle loops located in 4 octants which are shifted by 90° toroidally to each other [23]. In each octant two saddles near the mid plane of the machine on the low field side are used for the calculation of the locked mode amplitude, Loca, and its normalised equivalent LocaN = Loca/Ip.
In general, disruptions at JET have a locked or slowly rotating mode precursor [17, 49, 58]. The MGI was mainly triggered by the n = 1 locked mode amplitude exceeding a threshold or by the disruption itself, specifically either dIp/dt or the toroidal loop voltage exceeding threshold values. For mitigation purposes, only the locked mode was treated as a precursor (i.e. the cause of disruptions). In these cases, the MGI was triggered by a locked mode threshold, in either Loca or LocaN. On JET, the common threshold to trigger the DMV is LocaN= 0.2 mT MA−1. The locked mode amplitude presented in figure 25 was cleaned from a parasitic offset, while real time LocaN signal usually has a 0.1 mT MA−1 offset.
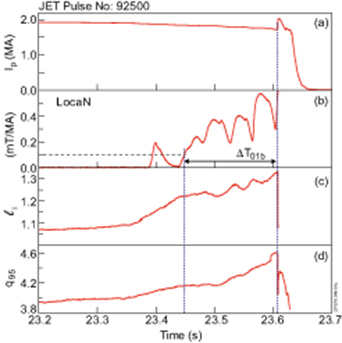
Figure 25. Locked mode precursor: (a) plasma currents, (b) normalised locked mode amplitude; EFIT reconstruction: (c) plasma internal inductance, (d) safety factor.
Download figure:
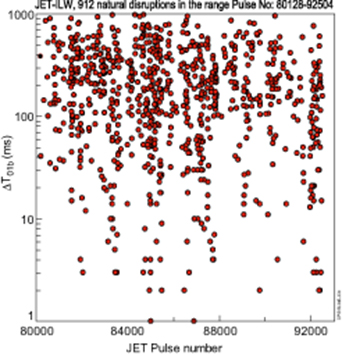
Standard image High-resolution imageThe subset of 913 natural disruptions (in the range of  = (0.84–3.14) MA), which were not affected by special dedicated experiments or MGI protection (i.e. the subset includes shots when MGI was triggered by locked mode amplitude, but does not include shots when MGI was triggered by dIp/dt or loop voltage), was used for analysis of pre-disruptive plasma behaviour. The threshold in normalised locked mode amplitude of 0.1 mT MA−1 was taken on as an indicator of locked mode. The locked mode duration,
  , was defined as the time between this threshold being exceeded for the final time to the disruption time (Tdis), as in figure 25. The
  quantity, presented in figure 26 shows that long lasting locked modes (≥ 100 ms) do exist prior to disruption in 70% of disruptions with a locked mode precursor. Locked modes with
  ≥ 10 ms occur prior to disruption in the majority of cases (94%). The locked mode exists prior to natural disruptions in 98% cases. Only 5% out of 913 disruptions have a locked mode precursor with duration
  ≤ 5 ms or no locked mode precursor at all. On the other hand, 10% of non-disruptive pulses had a locked mode with amplitude greater than 0.1 mT MA−1, which eventually vanished without disruption. The presented data could suggest that the locked mode is not a primary cause of disruptions but that it is a good indicator of unhealthy plasma condition. Further deep analysis is needed to reveal the role of the locked mode in pre-disruptive plasma.
Figure 26. The locked mode duration varies significantly across disruption database.
Download figure:
Standard image High-resolution image
6. Discussion
This paper presents different aspects of the disruptions on JET-ILW for machine operation from 2011 (#80 128) until 2016 (#92 504). Disruption related topics cover many different issues, such as pre-disruptive plasma behaviour, disruption causes, the disruption instability, TQ and CQ, disruption associated forces, RE etc A single journal paper cannot cover all disruption related issues. Furthermore, there is no unique definition of a disruption, although it is commonly accepted that disruption is an extreme MHD event. We believe that whatever disruption criteria is used it must be accurately described prior to conclusions being reached. The results from a disruption analysis and conclusions may depend on the chosen disruption database. It is for this reason that this paper begins with a careful description of the disruption criteria which have been used.
In this study, we defined disruption criteria based on reliable magnetic diagnostics with simple quantitative criteria, which we then used to build the JET-ILW disruption database. According to our criteria, during the 2011 (#80 128)—2016 (#92 504) period of JET-ILW operation 1951 disruptions occurred, including 466 counts from deliberately disrupted pulses. Thus, the average disruption rate of unintended disruptions is 16.1 %, which is significantly above the ITER target for full plasma current operation. Moreover, there is no way to completely avoid disruptions even for near identical primitive plasma pulses (well-prepared H-mode scenario) because there are some uncontrolled causes which lead to disruptions. The lowest achieved JET-ILW disruption rate for such an undemanding plasma was 3.3%, which may be acceptable for present tokamaks, but may not be sufficiently low for the next generation of machines. Furthermore, almost half of JET-ILW pulses disrupted during exploration of operational space for high performance plasmas in preparation for the upcoming JET DT campaigns. We believe that one of the most important unresolved JET-ILW issues is the high disruption rate, particularly for high performance plasmas.
It may be expected that a disruption free space may be defined in the li-q95 empirical stability diagram, assuming that plasma current profiles tend to maintain itself inside the permissible values. In reality, the JET-ILW pre-disruptive plasma equilibrium parameters create a diffused cloud on the li-q95 stability diagram without room for non-disruptive plasmas.
On JET-ILW, MGI has routinely been used to protect the PFC of the JET-ILW mainly to protect Be dump plates (in case of an upwards VDE) and tungsten-coated outer protection tiles (in case of a downwards VDE). MGI is also an effective tool to eliminate plasma current asymmetries during the CQ, i.e. sideways forces followed by large vessel displacement. The main positive effect of MGI is the ability to reduce the CQ duration down to an appropriate magnitude (10–27.5) ms, where the low threshold is given by force loads on the machine and the upper threshold is justified by minimisation of thermal loads. The reduction of the CQ duration allows the uncontrollable large plasma vertical displacement to be eliminated (which is caused by the inappropriate behaviour of plasma vertical position control system during the CQ). The decrease of the CQ duration also reduces vessel reaction forces, however this is a marginal effect.
Without MGI, the plasma CQ may result in 3D configurations, termed 'asymmetrical disruptions', which are accompanied by sideways forces. The toroidal rotation of 3D configurations is of particular concern due to the associated rotation of sideways forces and due to the potential resonance with the natural frequencies of the vessel components in large tokamaks such as ITER. In JET, the amplitude envelope of the plasma current asymmetries decreases as the magnitude of the observed rotation frequency increases. This is a positive result for large tokamaks.
Disruption prediction is a critical requirement for large machines. On JET-C (carbon wall) the locked mode has been observed prior to the majority of disruptions hence it was concluded that 'the main root cause of JET disruptions was due to neo-classical tearing modes that locked' [17]. On JET-ILW the LM also occurs prior to the majority of natural disruptions. The key question is whether LM presence is by causation or correlation. The LM usually exists for a long time before the disruption occurs, which could suggest it is not always a primary cause of disruptions but is a good indicator of unhealthy plasma condition. More data of the LM in the JET-ILW can be found in [57].
Acknowledgments
This work has been carried out within the framework of the EUROfusion Consortium and has received funding from the Euratom research and training programme 2014–2018 and 2019–2020 under Grant Agreement No. 633053 and from the RCUK Energy Programme [EP/P012450/1]. To obtain further information on the data and models underlying this paper please contact PublicationsManager@ukaea.uk. The views and opinions expressed herein do not necessarily reflect those of the European Commission. Partially the work was supported by Grant 14.Y26.31.0008 from Ministry of Education and Science of Russian Federation. The authors are grateful to E. Joffrin for fruitful discussions during the course of this work.