

Abstract
In this study, we present an analysis of the pressure fields developing around nanosecond discharges produced in deionised water by positive high-voltage pulses (+130 and +170 kV) with a fast rise time on a tungsten anode pin. Shockwaves and their associated pressure characteristics were investigated by laser interferometry with a very high spatial resolution of 0.8 μm utilising the concept of a picosecond Mach–Zehnder interferometer based on a Nd:YAG laser (532 nm, 30 ps). Shifts of the fringes in interference patterns due to variations in the refractive index of liquid water produced in the vicinity of the tungsten anode were projected by the interferometer and analysed as a function of the pressure. High spatial resolution combined with the picosecond laser pulse allowed for the examination of frozen interferometric characteristics of cylindrical shockwaves. Consequently, unique results characterising the shockwaves developing around individual discharge filaments were obtained. For easier comparison, the shockwave pressures were normalised to a radius of 0.4 μm, which was found as the most probable maximum of initial radius of primary dark filament. At this radius, the most probable shock pressure was 1.5 GPa, whereas the highest obtained shock pressure reached 11 GPa. We showed that the modified Gaussian distribution fits the obtained results well. Finally, we observed that most of those extraordinary strong shock-fronts were associated with the dark filaments containing strong residual plasma-induced emission. This observation likely provides an indirect evidence of the electrostriction-assisted discharge onset mechanism.
Export citation and abstract BibTeX RIS
1. Introduction
The onset and development of micro-discharges in liquids driven by high-voltage (HV) pulses of nanosecond duration are complex phenomena. Currently, the prevailing opinion is that in the case of polar liquids such as water, the discharge mechanism is linked with the formation of nanoruptures or nanovoids in the bulk liquid. These occur because of the ponderomotive eletrostrictive forces induced by non-uniform time-dependent electric fields [1–7]. Inside such nanovoids, electrons might gain sufficient energy to further ionise and multiply. Clarification of possible microscopic mechanisms is therefore necessary to understand the liquid water-to-plasma transitions occurring on nanosecond timescales.
Recently, we demonstrated the basic characteristics of anode-initiated discharge filaments in liquid deionised water by applying fast-rising HV pulses that produce a transient electric field with a peak strength exceeding several GV/m within a few nanoseconds. By employing time-resolved microscopy, emission spectroscopy, and shadowgraphy techniques, we registered basic fingerprints of the two distinct phases of the discharge with unprecedented resolution [7–11]. In particular, we showed that nanosecond discharge events initiated in the liquid state were clearly composed of two coupled and nearly simultaneous phases: non-luminous and luminous. The non-luminous (dark) phase typically occurs with a delay of ∼2–3 ns after the onset of the HV pulse and subsequently expands with an average velocity of ∼(1–2) × 107 cm s−1, creating very dense bush-like structures made of thin hair-like non-luminous filaments. Delayed by hundreds of picoseconds, the secondary luminous phase develops in the region perturbed by the primary non-luminous filaments; the luminous phase features much simpler filamentary structures and produces characteristic ultraviolet–visible–near-infrared emissions. Spectrometric analysis confirmed that broadband continua extended from UV to NIR wavelengths as a unique signature of the luminous discharge phase. The characteristic dimensions of the structures observed during their expansion ranged from approximately 1 μm (the typical diameter of initial non-luminous filaments) to tens of micrometres (the characteristic diameters of luminous filaments).
Concerning sources of observed optical emission continua, we recently provided an explicit evidence that an overwhelming fraction (>95%) of the total registered photon flux comes from the luminous filaments developing far away from the anode surface and only a minor fraction (<5%) of the aggregate luminosity can be attributed to the anode tip region [11]. Therefore, detailed knowledge of the pressure fields developing around individual microfilaments during the non-luminous discharge phase is of fundamental importance for a better understanding of the secondary luminous phase.
To obtain more precise characteristics of non-luminous dark filaments, we developed the concept of a picosecond Mach–Zehnder (MZ) interferometer using a Nd:YAG laser (532 nm, 30 ps) [9]. The MZ interferometry method is particularly convenient for measuring fast variations in the refractive index. At known values of the shift of the interference fringes, density variations in the optically inhomogeneous medium can be determined. Under filamentary streamer morphology, the evaluation of shifts in fringes of interference patterns obtained from the streamer channel surroundings allows for estimation of the pressure profile caused by the propagating streamer. We demonstrated that changes in the refractive index of bulk water caused by the ns HV pulse produced detectable shifts in the fringes of interference patterns near the anode surface (<1 mm), and these patterns were registered by the interferometer with a sufficient signal-to-noise ratio for further analysis. In [9], we estimated a peak pressure of ∼500 MPa at the shock front with a radius of ∼2 μm, while the generating parent filament was invisible at the early stage. The high spatial resolution of the interferometer combined with the picosecond laser source allows the acquisition of instantaneous interferometric images at required phase of the discharge evolution. Considering that during the first nanoseconds, the dark phase of the discharge (i.e. regions with a perturbed refractive index) develops as a dense bundle of μm thick filaments, high spatial resolution is necessary. If not observed at high resolution (⩽1 μm), the dense bundle of dark filaments could be misinterpreted as a single cavitation bubble evolving from the anode rather than as an ensemble of individual filaments. Therefore, frozen high-resolution interferometric images provide a unique tool that allows the correct characterisation of the pressure fields that develop due to the propagation of dark discharge filaments.
In this study, we analyse two sets of frozen interferometric images acquired with picosecond resolutions in time and micrometre resolutions in space for two HV amplitudes. Time-resolved interferometric images are obtained synchronously with the HV and plasma-induced emission (PIE) waveforms using the methodology described in section 2. Next, in section 3, we analyse the acquired datasets and determine the pressure fields at various time delays with respect to the HV pulse onset. Furthermore, to simplify the comparison of results obtained from different events, we reduce the instantaneous pressure characteristics to one reference radius of the shockwave and perform simple statistical analysis. Finally, we compare the outcomes of the present study with those of recent studies published by other authors.
2. Experimental setup and methods
2.1. Discharge setup
We performed this research using a diagnostic reactor, which is described in detail in [7, 9, 10]. The setup is illustrated in figures 1 and 2. Figure 1(a) shows the compact stainless steel chamber equipped with diagnostic interfaces, optical windows, an inlet and outlet for working liquid filling and degassing, respectively, and a needle anode (figures 1(b) and (c)) powered through a 2.8 m long coaxial HV cable (50 Ω, RG218). The needle anode was made of an electrochemically machined tungsten (tip radius of 25 μm) and inserted into the inner wire of the HV cable (figure 1(d)). The stainless-steel chamber was connected to the coaxial cable shielding (grounding). This solution provided continuity in the characteristic impedance along the transmission line. The pulsed power supply (FPG 150-01NM6, FID Technology GmbH) produced HV pulses (50–90 kV/10 ns; full width at half maximum (FWHM) of 7 ns), which were delivered to the coaxial cable. A single-pulse regime ensured that bubbles, which could otherwise result in bubble-assisted breakdown, completely left the anode area.

Figure 1. Sketch of the reactor chamber design and electrode system geometry for advanced electro-optical diagnostics of nanosecond discharge in water: (a) cross-section view of the reactor chamber; (b) detail of the coaxial cable end; (c) enlarged image of the tungsten needle electrode; (d) photograph of the anode tip.
Download figure:
Standard image High-resolution image
Figure 2. Diagnostic setup for high-resolution picosecond interferometry: (a) schematic of the MZ interferometer with signal paths; (b) example of a reference interferogram from the unperturbed anode region; (c) variations in the laser light intensity in the horizontal direction at locations approximately 25 μm above and below the anode tip.
Download figure:
Standard image High-resolution imageA capacitive probe (CP) designed at IPP labs was used to track the voltage at the end of HV cable inner wire. The position of the probe was 10 mm before the HV cable termination (figure 1(a)). This short distance guaranteed a signal time delay of 50 ps between the probe location and the anode, which is much shorter than the rising and falling edges of the monitored HV pulses. Therefore, the captured voltage waveforms represent the instantaneous electric potential at the anode tip.
As the working liquid, we used pre-degassed deionised water (initial conductivity 1.1 μS cm−1 at 22 °C). Furthermore, the water outlet of the chamber allowed degasification of water directly in the reactor. Degasification was additionally always performed before each discharge to eliminate microbubbles formed in the anode area during previous discharge events. One working cycle typically consisted of application of a vacuum for 10 s followed by aeration of the chamber for 5 s, and finally a single discharge event. Furthermore, after 15 successive working cycles, the discharge chamber content was replaced with 'fresh' pre-degassed deionised water to maintain the chemical purity of the working liquid.
2.2. Picosecond interferometer
The figure 2 illustrates concept of the modified MZ interferometer which was used for the pressure field diagnostics with high spatiotemporal resolution. The Katana 05 laser (Onefive, 532 nm/35 ps/4 nJ) beam was split (beamsplitter BS1) to probe and reference beams (PB and RB). Because the refractive index of water (1.3337 at 25 °C) is much higher than that of air (∼1), the passage through the bulk liquid in the discharge chamber (Ch1) significantly delayed the PB. A second identical chamber (Ch2) with the same content as Ch1 delayed the RB by the same amount of time, and thus, compensated the delay of the PB beam. The PB passed through a bandpass interference filter (IF) (Thorlabs, FLH532-10, centre wavelength of 532 nm, bandwidth of 10 nm FWHM) placed just behind the exit window of the Ch1 chamber, which suppressed most of the disruptive PIE. The interferometric images in the region of interest were magnified using two Canon MP-E 65 mm objective lenses (L1 and L2). Using two objective lenses in both laser paths was necessary because the output beam splitter (BS2) did not fit between the discharge chamber and objective lens L1. In combination with the complementary metal oxide semiconductor (CMOS) detector (Canon 760D, 24 Mpx), the images were captured with a nominal spatial resolution of 0.2 μm px−1. However, real optical resolution is diffraction-limited, and so objects smaller than approximately 0.8 μm cannot be resolved (their contrast is too low). Figure 2(b) shows an example of the reference interferometric image acquired from the unperturbed anode region, i.e. with no HV pulse imposed on the anode. Such reference interferograms can be acquired at an arbitrary phase of the HV pulse and used to verify the initial liquid conditions during the HV onset (for example, the presence or absence of any vapour microbubbles).
Variations in the laser light intensity in the horizontal direction at locations approximately 25 μm above and below the anode tip (indicated by dashed lines X–X and Y–Y, respectively) are shown in figure 2(c). The geometric distance between fringes was 10.5 μm. This distance determines the precision of the 'sampling' of the pressure field; the geometric distance should be significantly smaller than the expected pressure gradient across the fringes. The distance between fringes and the vertical/horizontal orientation of fringes depends on the space angle between the probing and reference beams (this can be adjusted by the relative positions of the mirrors and beam splitters). The orientation of the fringes in figure 2(b) is vertical, which is suitable for sampling filaments that propagate horizontally. Several filaments propagating perpendicularly to the anode pin axis were investigated; however, the majority of the analysed interferograms were acquired using a horizontal fringe orientation. This was because of the natural propensity of the filaments to propagate mainly in the axial direction, i.e. upwards.
Optical emission spectra produced by the discharge itself and/or scattered laser light can be acquired and analysed using either a photomultiplier or intensified charge coupled device spectrometer through the side window. A fast photomultiplier tube (PMT) detector (Photek, PMT210) placed in the perpendicular path of the beam splitter (BS2) detected the laser pulse. The waveforms from the PMT and capacitive voltage probe were recorded by the oscilloscope (DSO) (Keysight DSOX6004A, 6 GHz). Finally, after checking all cables and the optical path delays and considering the time response of a diode photodetector (FDS015 PIN with a rise time of 35 ps), we precisely determined the delay between the PB beam and the HV waveform at the tip anode.
2.3. Analysis of interferograms
The interferograms were processed by applying a two-step procedure. In the first step, we used the recursive process of the discrete Abel inversion as described in detail in [9]. After obtaining radial profiles of the refractive index, in the second step, the pressure distribution was then determined. We used empirical relationship [12]:

where the pressure p is in MPa, δn represents deviation of the refractive index provided by the Abel inversion, namb is the refractive index of liquid H2O at normal conditions and the given laser wavelength (532 nm), and empirical constants are a0 = 0.1057, a1 = 341.5902 MPa. The reliability of equation (1) is limited; the uncertainty was <0.1% at pressures <250 MPa [12]. However, the equation was derived from a dependence of water dielectric constant on pressure, whose precision is <0.1% at pressures less than 500 MPa [13]. Finally, a spurious signal originating in the CMOS noise (inevitable in experiments based on single-shot data) was source of considerable phase error. The phase changes obtained from interferograms were smoothed by employing the moving average over four neighbouring pixels, which corresponds to the optical system resolution of 0.8 μm (nominal resolution is 0.2 μm px−1). Difference between the abovementioned noisy data and the averaged data gave the estimated error [9].
An empirical relationship between water density and pressure is [13]:
where ρ(T0, p0) is the unperturbed water density (at 298 K and atmospheric pressure 0.1 MPa), p is the given pressure in MPa, and the constants are b0 = 0.214 kg m−3, b1 = 476.693 MPa, b2 = b1 + 0.1 MPa. The precision is <0.1% at pressures <956 MPa. The shockwave propagation speed is [14]:
where ps is the shock pressure, p0 is the hydrostatic pressure of unperturbed liquid, and the water density ρ is given by equation (2). The shockwave spends between radii rA (initial) and rB (final, captured in interferograms) time:

where ps is taken to be ps(r) ∼ r−1, although it is not perfect at shock pressures in the order of 10 GPa or more [15]. Because the initial filament radius, rA, is unknown due to limited resolution of the optical system, a sufficiently small value of rA is defined. The condition is that the error of tp is considerably shorter than the falling edge of the HV pulse.
3. Results and discussion
3.1. Opto-electrical characteristics
HV waveforms with two different amplitudes (70 and 90 kV at the FPG 150-01NM6 output) were used in the experiments. Owing to the reflection of pulses at the unmatched cable termination, the amplitude of the forward HV pulse that arrives at the needle anode superposes with the reflected wave [7] and its amplitude is nearly doubled in comparison with the FPG output voltages. The anode peak voltages used in this study thus reached 130 and 170 kV, respectively (figure 3). By applying HV pulses with these amplitudes on the anode tip of a given curvature, the discharge events develop through coupled non-luminous and luminous phases [7, 10].

Figure 3. Voltage waveforms captured by the CP near the tip anode. Two different amplitudes were used in the experiments for comparison: 130 and 170 kV (red and blue lines, respectively). The photodetector signal indicating the PIE and probing laser pulse position with respect to the HV pulse is also shown (black line).
Download figure:
Standard image High-resolution imageIn figure 3(a), time t= 0 corresponds to the moment the anode voltage reaches 5% of the peak value. In previous studies, the energy dissipated during the primary pulse of a nanosecond discharge was determined by means of current shunt mounted at the HV coaxial cable. Difference of energies of the forward and reflected pulse yielded the energy dissipated in the load [8, 16, 17]. An average energy of 100 ±10 mJ is dissipated in the anode region at the HV amplitude of 160 kV (liquid conductivity = 1.1 μS cm− 1 at 22 °C).
Figure 3 also plots a typical signal produced by the photomultiplier. It captures the delay of the PIE onset with respect to the HV (ΔtPIE) as well as the delay of the probing laser pulse (Δtlas) used to produce the interferogram/shadowgraph at the required phase of the discharge evolution. The insets in figure 3(c) illustrate very tiny initial filamentary dark phase structures captured for the position of the laser pulse close to the onset of the PIE. Interferograms at different stages of the discharge were captured by variation of the delay, Δtlas, over the HV waveform. The precisions of the laser delay, Δtlas, and plasma emission onset delay, ΔtPIE, were on the order of hundreds of picoseconds. This precision was achieved by careful calibration of all electrical signals (coaxial cables) and optical signals (PMT and optical cables) [10]. Consequently, the distribution of the Δtlas delays for all the captured interferograms was determined, as shown in figure 4.

Figure 4. Frequency counts for the time delays at which the interferograms were captured with respect to the HV pulse onset.
Download figure:
Standard image High-resolution imageMost of the interferograms analysed in this work were acquired for delays Δtlas > 6 ns, i.e. after the peak of the anode voltage at 5 ns (see figure 3(a)). The reason for this is illustrated through a sequence of shadowgraph images acquired at various delays, Δtlas, operating the discharge in the single-shot regime, as shown in figure 5. The Δtlas value for each image is shown in the bottom-right corner. Images (a)–(e) were captured during the main HV pulse, while image (f) comes from the first reflected HV pulse. At the HV onset (image (a)), unperturbed liquid is clearly observed. At later times (4, 6, and 8 ns), progressively expanding perturbation (with a velocity of 1–2 × 10⁵ m s−1) of the refractive index made of very thin filaments can be seen [7, 10]. Shadowgraph (e) shows that the extension of the region with a perturbed refractive index remains approximately the same as in case (d); however, thicker tips and clear envelopes on the filaments indicate departed shockwaves. As a result of the technique used, the sequence is clearly not from one particular discharge event. Although the images in the sequence come from subsequent discharge events, they can effectively illustrate the progressive expansion of the filaments and the discharge development. The shadowgraph in image (f) captures an advancement of the expansion due to the reflected HV waveform, which occurs at the anode side approximately 30 ns after the primary HV pulse. The perturbation of the bulk liquid caused by the primary pulse, as captured by images (b)–(e), results in completely different initial conditions for the reflected pulse in comparison with that in image (a). Therefore, further expansion of the dark filaments occurs despite the much lower amplitude of the reflected HV pulse. This is effectively captured (see the structures in the black and white circle) in image (f).

Figure 5. Characteristic shadowgraph images of the discharge development acquired at various delays, Δtlas (indicated in the lower-right corner of each figure), using the single-shot regime of the discharge.
Download figure:
Standard image High-resolution image3.2. Signatures from the anode tip region (Δtlas < 5 ns)
The onset of the non-luminous primary discharge starts at ∼3.4 ns after the voltage onset. It begins as a single straight filament followed by the formation of well-branched structures emanating from the initial single filament (see the inset in figure 3(c)) within ∼500 ps [10]. The extension of the dense structure increases approximately proportionally with time. An interval of 600–800 ps (independent of the HV amplitude) after the dark discharge onset is necessary to develop high-energy electrons to facilitate radiative processes, after which the luminous phase is observed in the area perturbed by the non-luminous filaments (figures 5(c)–(f)). Each image in figure 5 shows some residual PIE due to photons at wavelengths passing through the IF, i.e. close to 532 nm. Because the camera exposure time was much longer (1 s) than the discharge duration, this emission was integrated over the entire discharge pulse, including discharge events formed due to reflections.
However, for Δtlas < 5 ns, the extension of dark filaments is quite small (<200 μm), and thus the separation of individual tips remains at the limit of the resolution of the present shadowgraphic/interferometric setup. Consequently, no envelopes indicating the onset of shockwaves due to propagating dark filaments can be resolved. Therefore, the system did not allow for the capture of interferograms with resolved fringe shifts that might be suitable for further analysis. Shockwave signatures (if any are present during this phase) cannot be resolved from the parent primary filaments.
3.3. Signatures from expanded filaments (Δtlas > 5 ns)
The consequence of the progressive expansion of the primary discharge is a notable increase in the separation of the tips of the individual filaments (figure 5(d)). Furthermore, not all of the initial dark filaments continue to elongate equally. Thus, shockwaves surrounding the longest individual filaments of the primary discharge can finally be recognised. These shockwaves already occur in figure 5(e) as rounded shadows, and their typical interferogram equivalent is shown in figure 6 through the shift of fringes. If the HV at the anode tip does not drop, highly luminous secondary filaments develop from several filaments of the primary discharge (figure 5(f)). Shockwaves around separated primary filaments, as in the case of figure 5(e), were mainly analysed and presented in this paper. However, in several cases, shockwaves produced by the dark filaments associated with PIE originating from subsequent luminous filaments were also captured and analysed.

Figure 6. Example of an interferogram depicting discharge filaments and surrounding shockwaves. The needle electrode in the picture was out of the camera view.
Download figure:
Standard image High-resolution imageThe interferograms in figure 7 depict examples of two separate discharges with no time relationship driven by different voltage pulses. It should be emphasised that only in those images captured with Δtlas ⩾ 9 ns (approximately after 3 ns of the dark phase onset) developing shockwaves can be clearly recognised. Several hundred interferograms were captured during the HV pulse. Due to the limited depth of field of the optical system, only 50 of these captured well-resolved (isolates) and sharp (focused) filaments with shock envelopes unperturbed by superposition with neighbouring filaments. The proximity of the filaments surrounded by shocks critically disturbs the projection of single shocks produced by a single filament. Superposition of shockwaves results in the formation of an envelope, which is typically observed owing to insufficient spatial resolution. The interferograms in figure 7 depict cylindrical shockwaves produced by thin filaments, which are either invisible (figure 7(a), dark filament only, captured early—9.2 ns after the voltage pulse onset) or visible (figure 7(b), region marked by luminous filament, captured later—22.4 ns after the voltage pulse onset). Because the filament propagation speed is significantly higher (∼10 km s−1) than the shock radial speed (∼km s−1), the shockwave imprints in the interferogram long (>10 μm) thin (∼μm) inhomogeneity, which can be recognized as a sharp fringe shift at its boundary. Early shockwaves surround every formed filament, no matter when the filament appears. There is no interference pattern in the filament area in figure 7(b), because the filament as a strong optical inhomogeneity is opaque. Typically, filaments are invisible inside very early shockwaves in figure 7(a), probably owing to the resolution limit of 0.8 μm of the system. This means that the diameter of the filaments was smaller than 0.8 μm.

Figure 7. Examples of shockwaves in the captured interferograms: (a) shockwave around an invisible primary filament (captured 9.2 ns after the voltage pulse onset); (b) shockwave in region marked by residual luminosity (captured 22.4 ns after the voltage pulse onset). Pressure radial profiles were determined along the fringes (radially with respect to the axis of the cylindrical inhomogeneities marked with the black dash-dot-dot line). Shock-front is marked with the white dash-dot line.
Download figure:
Standard image High-resolution imageRadial profiles of the liquid pressure were determined along the fringes in the interferograms, as illustrated in figure 7 (radially with respect to the axis of the cylindrical inhomogeneities marked with the black dash-dot-dot line in places of shock-front marked with the white dash-dot line). The sections of interferograms most suitable for analysis were chosen according to two requirements for easy fringe shift determination: (a) the fringe must be perpendicular to the shock-front (see the white dashed-dot line in figure 7(b)), and (b) there are no apparent disturbances (superpositions) from neighbouring filaments.
According to data displayed in figures 5–7, all captured filaments can be grouped into the two basis categories: the dark filaments with and without the presence of the residual PIE luminosity originating from the luminous discharge phase produced during the primary and reflected HV pulses [11]. It has been clearly demonstrated that the dark discharge phase composed of many tiny non-luminous filaments (bush-like morphology) precedes and conditions the onset of the luminous discharge phase made of few luminous discharge channels (tree-like morphology) [7, 8, 10]. It is therefore quite reasonable to expect different parameters characterizing PIE illuminated dark filaments (IDFs) and non-illuminated dark filaments (NIDF). One important difference between the IDFs and NIDFs is the observed length. Within a given interferometric image reflecting given event, the NIDFs are systematically shorter in comparison with all IDFs, which means that the dissipated discharge energy was preferentially 'injected' into few strong channels. In order to understand the difference, we analyse in detail two interferograms containing well-isolated IDF and NIDF suitable for the pressure analysis (i.e. well-focused filament perpendicular to the interference fringes). The results related to selected IDF and NIDF produced under equal conditions (figure 3) are illustrated in figure 8.
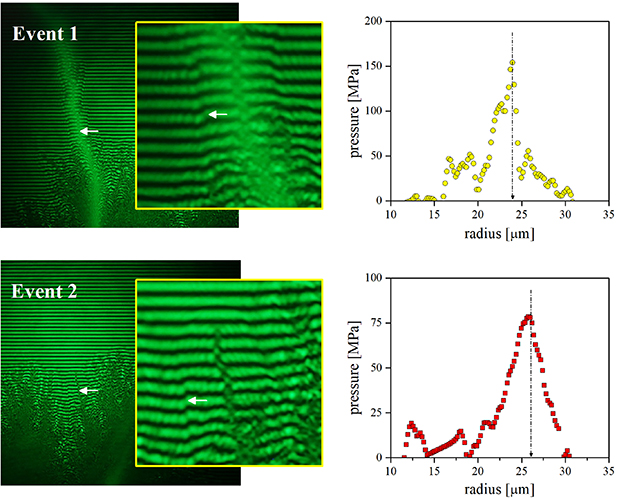
Figure 8. Interferograms with corresponding pressure profiles of an illuminated dark filament (event 1) and a non-illuminated dark filament (event 2). The event 1 shock-wave was initiated at the anode voltage of 30.1 kV (11.2 ns after the voltage pulse onset), and the distance of the analysed area from the anode was 597 μm. The event 2 shock-wave was initiated at the anode voltage of 14.2 kV (17 ns after the voltage pulse onset), and the distance of the analysed area from the anode was 468 μm. White arrows indicate areas of interferograms selected and used for the pressure analysis.
Download figure:
Standard image High-resolution imageEvent 1 from figure 8 captures one strong IDF. Event 2 contains one NIDF particularly suitable for pressure analysis. Both filaments and segments used for the pressure analysis are indicated by white arrows in both interferometric images (image with corresponding zoom) in left part of the figure. Extension of the captured shock-wave fronts reached comparable values (about 24 and 26 μm for IDF and NIDF, respectively), however the peak pressures obtained at the two shock fronts differ roughly by a factor of 2. This ratio is nearly invariant during the shocks expansion (see the next text), which means, that also initial pressures differed roughly by a factor of 2. Furthermore, central (parent) filaments are quite well visualized in both cases and their diameters can be estimated as 2.4 and 2.2 μm in the case of the event 1 and 2, respectively.
Considering liquid water as a very weakly compressible fluid, stronger peak pressure at the shock front of the IDF compared with the NIDF implies certain consequences for conditions at the axis of the parent filament (both at the instant of formation and at the moment of capturing the image). The area of positive pressure surrounding the filament indicates compressed liquid with an increased density. Applying the principle of mass conservation in diverging shock-waves, an increase in density of compressed fluid during shock-wave front propagation results in dilution at the axis of the cylindrical shock [18]. This effect is clearly visible in the magnified sections of the two events 1 and 2 interferograms. The fringes captured inside the central dark filament areas are steeply shifted in opposite direction compared to the compression wave. Unfortunately, we were not able to quantitatively analyse these fringe shifts, because there is no known relation between water refractive index and density/pressure in a dilution state. Nevertheless, we can make a rough estimation based on the principle of conservation of mass. From the known positive pressure waveforms in figure 8 and using the equation (2), the increment of mass in the compression part of the cylindrical shock-wave was calculated. The inner volume of the parent dark filament, which produced the compression wave by its expansion, must contain diluted matter whose mass deficit (compared to unperturbed state) equals to the positive mass increment in the region occupied by the compression wave. In the case of the event 1 (figure 8), the density of liquid water in the compression wave area increased by ∼0.057 kg m−3, which must be compensated by an average density decrease of ∼1.35 kg m−3 inside the parent dark filament area. The same estimation performed in the case of event 2 (figure 8) yields density of liquid water increased by ∼0.028 kg m−3 in the compression wave area, which is compensated by the average density decrease of ∼1.05 kg m−3 inside the parent dark filament area. However, considering a very steep dependence of liquid pressure on density, the density decrease of ∼1.35 kg m−3 in event 1 case will produce significantly higher negative pressures compared with event 2 case. This means that event 1 dark filament must show, compared with event 2 case, a significantly higher propensity to form ruptures and cavitations in the liquid.
Figure 9 plots results for the shock pressure and corresponding shock-front radius at the moment of detection. The data were categorised into several groups. The amplitude of the driving voltage (130 or 170 kV) was the first criterion; it is differentiated by the symbol colours (yellow, blue and black, respectively). It should be emphasised that the waveform amplitude differs from the instantaneous anode voltage at which each of the analysed filaments were initiated. This is discussed in greater detail in the following paragraph. The shockwaves with pressures higher than 500 MPa (at the moment of detection) are also distinguished in the plot (black symbols), as the validity of equation (1) above 500 MPa is unknown. All of the data points marked with yellow/blue symbols represent measurements of shockwaves produced by well-isolated primary dark filaments, which was the most common situation. However, in few cases, shockwaves developing around filaments, which were later source of the luminous filaments, were detected. These were observable only at the HV amplitude of 170 kV; they are marked with the yellow rectangles with black dot inside in the plot. Because the pressure of a cylindrical wave decreases inversely to the increase in radius, a curve of r−1 was fitted to the measured data. This phenomenon is evident when inspecting the points with the lowest radii. Furthermore, the many obtained points include significant errors, which increase with decreasing radius. Although the noise level in the interferograms is constant everywhere (CMOS noise), its presence has larger impact for smaller analysed structures. The noise actually represents phase noise in interferograms. At smaller scale, a certain change in phase is induced by larger change in liquid refractive index (i.e. pressure), because the phase change arises at shorter path. As it is impossible to distinguish noise from real phase changes, the noisy nature of the data must be considered as potential phase signal, thus producing large errors at the μm scale. To avoid confusion due to large error bars, only the data with the estimated error bars not exceeding 50% are displayed in the graph, even though regarding the smallest radii (with estimated error bars exceeding 100%) correspond well with the r−1 trend-line.

Figure 9. Pressure and corresponding shock-front radius data at the moment of detection. Yellow/blue symbols: voltage waveform amplitude (130 or 167 kV); black symbols: shockwaves with pressures higher than 500 MPa (at the moment of detection). Yellow rectangles and blue circles: shockwaves produced by non-illuminated primary filaments, yellow rectangles with black dot inside: shockwaves around dark filaments illuminated with residual discharge emission. Black dashed curve: fitted function ∼r−1. Only the points with the estimated error bar not exceeding 50% displayed.
Download figure:
Standard image High-resolution imageBecause the interferograms of shockwaves were captured at different delays with respect to HV pulse onset, their comparison is not straightforward. We have first of all used instantaneous anode potential to sort all captured events. Then, to compare results obtained at various anode potentials, the shockwave pressures were re-calculated with respect to a common initial radius. Because the initial diameter of primary discharge filaments (immediately after their formation) is in fact unknown (owing to the diffraction limit), the initial pressure at the very beginning of the shockwave formation cannot be precisely determined using the present detection system. Nevertheless, as discussed previously, the maximum filament initial diameter must be smaller than 0.8 μm (spatial resolution limit). Therefore, all shockwave pressures were recalculated by selecting the initial radius of 0.4 μm and using the relation p(r) ∼ r−1. These results are plotted in figure 10, where the shock pressure normalised to the common radius of 0.4 μm is plotted as function of the filament initiation voltage. The points are marked in the same way as in figure 9. The initiation voltage was determined using the time position of the probing laser pulse with respect to the voltage waveform captured by the CP and equation (4). The plot shows no obvious simple dependence of the shock peak pressure on the initiation voltage in the investigated range. Certainly, the peak pressure does not increase monotonically with increasing voltage.

Figure 10. Dependence of the pressure normalised to a radius of 0.4 μm on the filament initiation voltage. Yellow/blue symbols: voltage waveform amplitude (130 or 170 kV), black symbols: shockwaves with pressures higher than 500 MPa (at the moment of detection). Yellow rectangles and blue circles: shockwaves produced by non-illuminated primary filaments, yellow rectangles with black dot inside: shockwaves around dark filaments illuminated with residual discharge emission. Only points with the estimated error bar not exceeding 50% displayed.
Download figure:
Standard image High-resolution imageFigure 11 shows shockwaves pressure after normalisation to the radius of 0.4 μm as function of radius which the shockwaves had at the moment of detection. The points are marked in the same way as in figure 9. The distribution of normalised pressure is obviously nearly invariant in along the radius axis. This serves as a proof that the measurements performed on shockwaves of small radii are equivalent to those of large radii, i.e. the measurement method is dimension-independent. The only issue is large error at small radii, which complicates the measurement at the μm scale.

Figure 11. Dependence of the normalised pressure on the radius of the shockwaves at the moment of detection. Yellow/blue symbols: voltage waveform amplitude (130 or 170 kV), black symbols: shockwaves with pressures higher than 500 MPa (at the moment of detection). Yellow rectangles and blue circles: shockwaves produced by non-illuminated primary filaments, yellow rectangles with black dot inside: shockwaves around dark filaments illuminated with residual discharge emission. Only points with the estimated error bar not exceeding 50% displayed.
Download figure:
Standard image High-resolution imageFigure 12 depicts the frequency counts of the shock pressure normalised to a radius of 0.4 μm. Shockwaves with a normalised pressure of approximately 1.5 GPa were the most commonly detected.

Figure 12. Frequency counts of shockwave pressures normalised to a radius of 0.4 μm.
Download figure:
Standard image High-resolution image
3.4. Comparison with other studies
The advantage of the method applied in this study, i.e. picosecond laser interferometry, is that the shockwave pressure profiles can be obtained from a single image (interferogram), whose exposition is determined by the pulse width of the laser used. A temporal resolution of 30 ps, determined by the duration of the probing laser pulse, together with a typical expansion velocity of 100–200 μm ns−1, implies an increment of 3–6 μm in the length of the growing filament during the probing laser pulse. This represents approximately 1% of the uncertainty in determining the length of the parent filament. Furthermore, considering the sonic expansion velocity of the developing shockwave, cylindrical shock envelopes detected around parent filaments can be considered as perfectly frozen. The exposition due to the probing laser pulse is much shorter than the minimum gate time of the camera; therefore, an ordinary CCD or CMOS camera with very high resolution can be used.
A short exposure time (35 ps) in combination with a high-resolution camera (24 Mpx) allows acquisition of information about shockwave pressures at the μm scale. In all of the interferograms, only the filamentary form of the discharge was observed. We should also emphasise that no initial bubbles emitting sound waves were observed on the tip in this work. This is in contrast with a previous study conducted at significantly lower voltages (14–26 kV) and with tips of comparable dimensions [19]. In this study, the initial bubble produced a sound wave with a pressure of tens of GPa, which was analysed 44 ns after the discharge ignition. The minimum camera gate time was 2 ns. The only decisive factor for the creation of the initial bubble was the voltage, as the probability of formation of the discharge filamentary structure at a given voltage increased in a certain range with the liquid conductivity [20], which was similar in our experiments.
The peak shock pressures on the order of GPa detected around luminous filaments in the present study are comparable to those reported by Marinov et al [21], where the Hugoniot relation was applied to determine the pressure of shockwaves with radii on the order of μm, which were registered around filaments approximately 6 ns after the voltage onset. The minimum camera gate time was 2 ns. Although the shock pressures and radii were comparable, the authors observed a strong dependence of the shock pressure on the driving voltage, which disappeared in the statistical data in our case.
An et al [22], who also used optical interferometry for pressure analysis, obtained comparable results after normalisation of the shockwave radius. Shockwaves of 45 and 120 MPa with radii of 35 and 20 µm were detected around stagnating and propagating filaments (referred to as inactive and active in that study). The initial shock pressure of 2–3 GPa at a radius of ∼1 μm was determined by numerical regression using the captured pressure profiles as the final state. The anode voltage was only 18 kV, which is nearly one order of magnitude less than the voltage used in the present experiments. The analysis was reported for only a few interferograms. Furthermore, the minimum camera gate time was 3 ns, which produced a minimum optical resolution of worse than 4.5 μm (shock propagation speed higher than the speed of sound in water). Thus, a detailed study of the shocks induced by fine dark filaments was not possible.
It is worth noting that in the present experiments, many shock pressure profiles were detected directly at μm-scale radii. Therefore, no sophisticated regression was needed to obtain the normalised data. Katsuki et al [23] used the Schlieren method and a streak camera with a slit of 100 μm at the camera entrance. Analysis of individual dark filaments was completely excluded; a very early discharge stage was integrated in the film records. A positive pulsed voltage with an amplitude of 40 kV drove a needle anode. Applying the Hugoniot relation to the differentiated shock traces in the streak camera records, pressures exceeding 1 GPa for shock waves with a diameter larger than approximately 10 μm were calculated for the early discharge stage (approximately the beginning of the optical inhomogeneity registered by the streak camera, the exact time is unknown) in water with a conductivity of 1 μS cm−1. Because the shock pressure decreases rapidly with distance from the initiating filament (∼r−1, figure 9), the observed shockwaves were likely the superposition of many partial shocks induced by individual dark filaments, which were indistinguishable owing to limited optical resolution. It was also possible that the boundary of a whole bundle of propagating dark filaments (typically observed with a high-resolution system) was considered to be the shock-front of the expanding shockwave.
Owing to limited spatial resolution, it is clear that all of the previous discussed above dealt with shock waves induced by long filaments (as can be seen here in figure 7(b)), which are highly supersonic at an initial length of up to approximately 7 mm, after which their propagation slows and stops [24]. They produce peak pressure shocks, as can be seen in figures 9–11 (in this article), where they are marked with dots.
This study focused mainly on the dark primary filaments constituting the initial bush-like structure, which could be clearly recognised in the interferograms. The average normalised pressure of the shocks produced by dark filaments was apparently weaker compared with several shocks occurring in regions marked by residual luminosity (filaments), although the propagation speed of the dark filaments (1–2 × 10⁵ m s−1 [10]) is comparable to that of luminous filaments (105 m s−1). This indicates that a smaller diameter of dark filaments causes a faster pressure decline of the expanding cylindrical shock waves and these filaments, for certain reason, do not provide conditions for formation of luminous filaments. This statement is supported by the captured interferograms, in which no residual luminous filaments can be observed in shocks induced by dark filaments, as their diameter is smaller than the resolution of the optical system. On the other hand, the region of the strong shockwave in figure 7(b) is marked by residual luminosity; therefore, its parent dark filament certainly creates pressure condition suitable for subsequent evolution of the main luminous filament.
4. Conclusions
To investigate the characteristics of non-luminous discharge filaments, a modified MZ interferometer with a very high spatial resolution close to the diffraction limit was employed. In the present configuration, interferometric images were registered with a spatial resolution (diffraction-limited) of approximately ∼0.8 μm (nominal spatial resolution of 0.2 μm px−1) and a temporal resolution of approximately 30 ps (given by the FWHM of the probing laser pulse). This allowed very thin filamentary structures (with radii of as small as ∼0.4 μm) to be captured and resolved along with the shockwaves developing around individual parent dark discharge filaments.
We analysed the interference patterns of 49 cylindrically shaped shockwaves utilising a well-known relation between the refractive index and pressure in bulk liquid water. The analysis was performed using carefully selected sections of captured filaments (sections of well-focused and isolated dark filaments perpendicular to fringes). The analysed shockwaves were of different radii and therefore normalised to the shock-front radius of 0.4 μm. After normalisation, corresponding peak pressures of shock-fronts ranged from 0.4 to 11 GPa. The obtained results can be described by the modified Gaussian distribution, and the most probable normalised shock pressure was 1.5 GPa. This normalised pressure very likely characterises majority of dark filaments forming hemispherical bush-like structures developing from the anode pin.
We also did not observe any significant dependence of the shockwave peak pressures on the instantaneous anode potential. This might reflect the fact that, after reaching certain threshold conditions (the amplitude of the HV pulse), the dark phase developing in the electrostricted anode region proceeded via dark filaments expanding with various parameters (initial radius, local velocity and direction of expansion), leading to an asymmetric bell-shaped Gaussian distribution of the shock-front pressures (after normalization). The asymmetry of the distribution is caused by the presence of extraordinary strong shock-fronts characterised by peak pressures between 6 and 12 GPa.
It is worth noting that most of those extraordinary strong shock-fronts were associated with the dark filaments containing strong residual PIE (originated from the subsequent luminous phase). It is very likely that the main luminous filaments developed only from those dark filaments that were characterised by notably higher pressures at the corresponding shock front (∼10 GPa at r = 0.4 μm), while majority of dark filaments (characterised by ∼1.5 GPa at r = 0.4 μm) did not create conditions suitable for developing strong luminous filaments. Considering that, an increased pressure at the shock-front implies significantly decreased (i.e. negative) pressure at the axis of the cylindrical shock-wave we believe that observation of extraordinary strong shocks associated with appearance of luminous filaments provides an indirect evidence of the electrostriction-assisted discharge onset mechanism.
Understanding the pressure waves developing in the anode region due to the dark phase seems to be of fundamental importance because the dark phase conditions determine the characteristics of the subsequent luminous phase. The results of this study add another important piece to the 'nanosecond discharge in liquid water' puzzle and will help improve the analysis of the radiative characteristics of the coupled luminous discharge phase.
Acknowledgment
This work was supported by the Czech Science Foundation (Project No. 18-04676S).
Data availability statement
All data that support the findings of this study are included within the article (and any supplementary files).