

Abstract
Polycrystalline Nd1−xSrxFeO3−δ (0.1 ≤ x ≤ 0.9) samples exhibit a single-phase perovskite-type crystal structure and G-type antiferromagnetism with small ferromagnetic order. Assuming that the Fe site is in the mixed-valence state, the spin state of Fe changes from a low-spin (LS) or intermediate spin Fe3+-dominant state at x ≤ 0.5 to a LS Fe4+ dominant state at x ≥ 0.6. This strongly suggests that the charge carriers change from holes to electrons. In fact, at temperatures less than 500 K, these samples show a p-type Seebeck coefficient for 0.1 ≤ x ≤ 0.5 and an n-type Seebeck coefficient for 0.6 ≤ x ≤ 0.9. However, for 0.6 ≤ x ≤ 0.9, Fe4+ is reduced to Fe3+ because of an oxygen deficiency in the 500–600 K temperature range. In particular, Nd0.7Sr0.3FeO2.99(1) shows the largest p-type ZT = 0.025 at 765 K, whereas compositions with high n-type ZT could not be identified.
Export citation and abstract BibTeX RIS
Corrections were made to this article on 1 June 2023. Affiliations 1 and 2 were corrected.
1. Introduction
Bi2Te3, 1) PbTe, 2) Si–Ge alloys, 3) skutterudites, 4,5) and β-FeSi2 6,7) are known to be semiconductor materials with significant Seebeck coefficients, low electrical resistivity, and low thermal conductivity. However, there is a strong demand for thermoelectric materials composed of more environmentally friendly and naturally abundant elements because many contain toxic and rare metals. In recent years, various oxides have attracted attention as candidates for next-generation thermoelectric materials that are chemically stable in the air at high temperatures, environmentally friendly, and composed of abundant elements.
The thermoelectric properties of oxides have attracted attention because of the high p-type thermoelectric properties of Nax CoO2 discovered by Terasaki et al. in 1997. 8) In addition, a series of misfit layered Co oxides 9–20) represented by [Ca2CoO3]0.62CoO2 exhibited good p-type thermoelectric properties. Thermoelectric oxides that exhibit good n-type thermoelectric properties include Al-doped ZnO, 21–23) which is a wide-bandgap degenerate semiconductor, and the strongly correlated electron system CaMnO3 with partially substituted cation sites. 24–32) No oxide with the same composition has shown p-type and n-type thermoelectric properties, as observed in the cases of Bi2Te3, PbTe, the Si–Ge alloy, skutterudites, and β-FeSi2. 1–7) However, some perovskite-type oxides in which transition-metal ions are in a mixed-valence state of trivalent and tetravalent ions (e.g. n-type perovskite type oxides such as SrTiO3 33–40) or CaMnO3 24–32) and p-type perovskite-type oxides such as LaFeO3 41–45) or LaCoO3 46–54)) potentially have both good p-type and n-type thermoelectric properties.
In particular, Fe3+ ions can exhibit a low-spin (LS) (t2g 5, g3 = 6), intermediate-spin (IS) (t2g 4 eg 1, g3 = 24), or a high-spin (HS) (t2g 3 eg 2, g3 = 6) configuration, and Fe4+ ions can have a LS (t2g 4, g4 = 9) or a HS (t2g 3 eg 1, g4 = 10) configuration, where g3 and g4 are the spin–orbital degrees of freedom for the 3d electrons in the trivalent and tetravalent Fe ions, respectively. In addition, using the high-temperature limit equation for the Seebeck coefficient for Fe oxides, which is an extension of the Heikes formula derived by Koshibae et al. 55) given by
the thermoelectric characteristics tend to be p-type (S∞ > 0 because g3/g4 = 6/9 < 1) when Fe3+ and Fe4+ are predominantly LS at x ≤ 0.5, whereas they tend to be n-type (S∞ < 0 because g3/g4 = 24/9 > 1) when Fe3+ and Fe4+ are predominantly IS and LS at x > 0.5, respectively. In Eq. (1), kB is the Boltzmann constant, e is the elementary charge, and x is the concentration of tetravalent ions. Therefore, Eq. (1) suggests that perovskite-type Fe oxides with the same composition can exhibit p-type or n-type thermoelectric properties. We prepared polycrystalline Pr1−x Srx FeO3 (0.1 ≤ x ≤ 0.7) samples and confirmed that Fe3+ is in an LS or IS spin state and Fe4+ is in an LS spin state. In particular, p-type thermoelectric behavior with a figure of merit (ZT) of 0.024 (T = 850 K) was observed for x = 0.1, and n-type thermoelectric behavior with a ZT = 0.002 (T = 850 K) was observed for x = 0.7. 56) Because the ZT for the n-type composition is lower than that for the p-type composition of Pr1−x Srx FeO3 (0.1 ≤ x ≤ 0.7), the development of other perovskite-type Fe oxide systems that exhibit similar n-type and p-type thermoelectric properties is desired.
The present study aims to identify perovskite-type Fe oxides whose n-type and p-type compositions exhibit similar thermoelectric properties to confirm the feasibility of fabricating pn devices using oxides of the same system. We prepared polycrystalline samples of Nd1−x Srx FeO3−δ (0.1 ≤ x ≤ 0.9) and characterized both their crystal and magnetic structures at 500 K, RT, and low temperature (10 K ≤ T ≤ 15 K) using powder neutron diffraction (PND) measurements. The motivation for selecting Sr2+ as a substituent for Nd3+ is that the ionic radius is comparable to that of Nd3+ for Ca2+ and too large for Ba2+ compared to Nd3+. Although the chemical balance of each cation (Nd3+, Sr2+, Fe3+, and Fe4+) becomes unstable when Nd3+ is replaced by Sr2+, the electro-neutrality condition between each cation and anion (O2−) is always maintained. The oxygen deficiency δ for all the samples was determined by iodometric titration. The electrical resistivity ρ, Seebeck coefficient S, and thermal conductivity κ were measured under an Ar atmosphere below 800 K. However, oxygen-deficiency-induced changes in the electrical resistivity and Seebeck coefficient at temperatures above 500 K were found for the composition range 0.6 ≤ x ≤ 0.9. Thus, δ for 0.6 ≤ x ≤ 0.9 was determined again by iodometric titration. In addition, the magnetic susceptibility χ for each sample was measured below 700 K to confirm the spin states of Fe3+ and Fe4+ in the mixed-valence state. The ZT values derived from the thermoelectric characteristics strongly suggest that Nd1−x Srx FeO3−δ (0.2 ≤ x ≤ 0.4) might exhibit good p-type thermoelectric properties at high temperatures. However, good n-type thermoelectric properties at high temperatures are not possible.
2. Experimental
Polycrystalline Nd1−x Srx FeO3−δ (0.1 ≤ x ≤ 0.9) was synthesized using a general solid-state reaction method. The compounds were prepared from stoichiometric mixtures of Nd2O3 (99.9%, Fuji Film Wako Pure Chemical Industries), SrCO3 (99.99%, Fuji Film Wako Pure Chemical Industries), and Fe2O3 (99.9%, Fuji Film Wako Pure Chemical Industries) ground in an agate mortar with ethanol (20 mL) for 1 h and then calcined at 1273 K for 24 h in air. The calcined powder samples were pressed into pellets under a uniaxial pressure of 16 MPa and sintered at 1473 K for 48 h in an O2 atmosphere to synthesize polycrystalline samples. The oxygen deficiency δ for the Nd1−x Srx FeO3−δ (0.1 ≤ x ≤ 0.9) samples was determined from the average value obtained from three iodometric titrations. The chemical compositions of each sample were Nd0.9Sr0.1FeO3.00(3), Nd0.8Sr0.2FeO2.996(4), Nd0.7Sr0.3FeO2.99(1), Nd0.6Sr0.4FeO2.989(8), Nd0.5Sr0.5FeO3.00(2), Nd0.4Sr0.6FeO2.99(1), Nd0.3Sr0.7FeO2.991(9), Nd0.2Sr0.8FeO2.965(5), and Nd0.1Sr0.9FeO2.952(3).
PND data for the Nd1−x Srx FeO3−δ (0.1 ≤ x ≤ 0.9) samples were collected using the medium-resolution neutron powder diffractometer (MEREDIT) at the Nuclear Physics Institute, reactor LVR-15, Czech Republic. Approximately 8 g of each sample was loaded into a cylindrical vanadium sample holder with a diameter of 10 mm for data collection at 500 K, RT, and low temperature (10 K ≤ T ≤ 15 K). Monochromatic neutrons with a wavelength λ of 1.875039 Å were obtained using a Si(311) monochromator. Intensity data were collected in the range 4° ≤ 2θ ≤ 143.95° in steps of 0.05°. All Rietveld refinements were carried out using the RIETAN-FP program 57) for crystal structures, and the GSAS-II programs 58) for magnetic structures. Both the crystal and magnetic structures were drawn using the VESTA program. 59)
The magnetic susceptibility χ was measured using an S700X-R SQUID magnetometer (Cryogenic) in the temperature range from 5 to 300 K and an MPMS SQUID magnetometer (Quantum Design) in the temperature range from 300 to 700 K; in both measurements, an external magnetic field of 1 T was applied. The DC four-terminal method measured the electrical resistivity ρ using a ResiTest8300 apparatus (TOYO) at temperatures below 395 K and using a custom-made apparatus with the sample in an Ar atmosphere in the temperature range from 400 to 800 K. The Seebeck coefficient S was measured by a steady-state method using a ResiTest8300 apparatus (TOYO) at temperatures below 395 K and using the custom-made apparatus with the sample in an Ar atmosphere in the temperature range from 400 to 800 K. The steady-state method measured the thermal conductivity κ using a power generation efficiency characteristics evaluation system (PEM-2, ADVANCE RIKO) with the sample under an Ar atmosphere in the temperature range from 300 to 540 K. The linear thermal expansion coefficients for the x = 0.1 and 0.8 samples were measured using a thermomechanical analyzer (TMA8310, Rigaku) with the sample under air.
The measurements of the oxygen-deficiency-induced changes in the electrical resistivity and Seebeck coefficient at temperatures above 500 K were confirmed for samples with compositions 0.6 ≤ x ≤ 0.9. Thus, after the high temperature measurement, the oxygen deficiency δ for the Nd1−x Srx FeO3−δ (0.6 ≤ x ≤ 0.9) samples was again determined from the average value of three iodometric titrations. The chemical compositions of each sample were Nd0.4Sr0.6FeO2.824(2), Nd0.3Sr0.7FeO2.769(6), Nd0.2Sr0.8FeO2.71(1), and Nd0.1Sr0.9FeO2.62(1). After the high temperature measurement, the magnetic susceptibility χ for the Nd1−x Srx FeO3−δ (0.6 ≤ x ≤ 0.9) samples was also measured again using a SQUID magnetometer.
3. Results and discussion
Figure 1 shows PND patterns (5° ≤ 2θ ≤ 140°) for Nd1−x Srx FeO3−δ (0.1 ≤ x ≤ 0.9) samples obtained at (a) 500 K, (b) RT, and (c) low temperature (10 K ≤ T ≤ 15 K). The PND patterns for all the samples indicate a single perovskite phase. The crystal and magnetic structures at both 500 K and RT were analyzed using the monoclinic P21/m space group for x = 0.1 and 0.2 and the orthorhombic Pnma space group for x ≥ 0.3. The crystal and magnetic structures at low temperatures were analyzed using the P21/m space group for x = 0.1 and 0.2, the Pnma space group for x = 0.3 and 0.4, and the monoclinic C2/c space group for x ≥ 0.5. The crystal-structure parameters and magnetic moments at 500 K, RT, and low temperature were refined by Rietveld analysis using the RIETAN-FP program 57) and the GSAS-II programs 58); the results are summarized in Tables I(a)–I(c), respectively. In the present study, the isotropic atomic displacement parameter B in the analysis was fixed at 0.5 Å2 for cations and at 1.0 Å2 for oxygen ions, and Tratani's split pseudo-Voigt function was used as a profile function for fitting Bragg peak shapes for the Rietveld analysis using the RIETAN-FP program. 57) The magnetic moments for Fe sites aligned in the a-, b-, and c-axis directions were assumed to be (Mx /μB, 0, 0), (0, M y /μB, 0), and (0, 0, Mz /μB), respectively, where Mx , My , and Mz are orthogonal coordinate components of the magnetic moment and μB is the Bohr magneton. The magnetic structure was determined as the magnetic moment for the Fe site with the lowest reliability factor in the weighted diffraction pattern Rwp for the Rietveld analysis using the GSAS-II programs. 58) The BO6 oxygen octahedron in the ABO3 perovskite structure is a Fe1O12O24 type in the orthorhombic (Pnma) and monoclinic (C2/c) compounds with x ≥ 0.3. A combination of Fe1O22O32O42 and Fe2O12O32O42 types in the monoclinic (P21/m) compounds with x ≤ 0.2 because two kinds of Fe sites [i.e. Fe1: 2b (0.5, 0, 0) and Fe2: 2c (0, 0, 0.5)] exist in P21/m monoclinic crystals. Two Fe sites also exist in the magnetic structures (C2'/n') of monoclinic (C2/c) crystals. Here, O1 for the orthorhombic crystals (Pnma), O1 for the monoclinic crystals (C2/c), or O1 and O2 for monoclinic crystals (P21/m) are oxygen atoms along the central axis direction, and O2 for the orthorhombic crystals (Pnma), O2 for monoclinic crystals (C2/c), or O3 and O4 for monoclinic crystals (P21/m) are oxygen atoms along the direction perpendicular to the central axis.
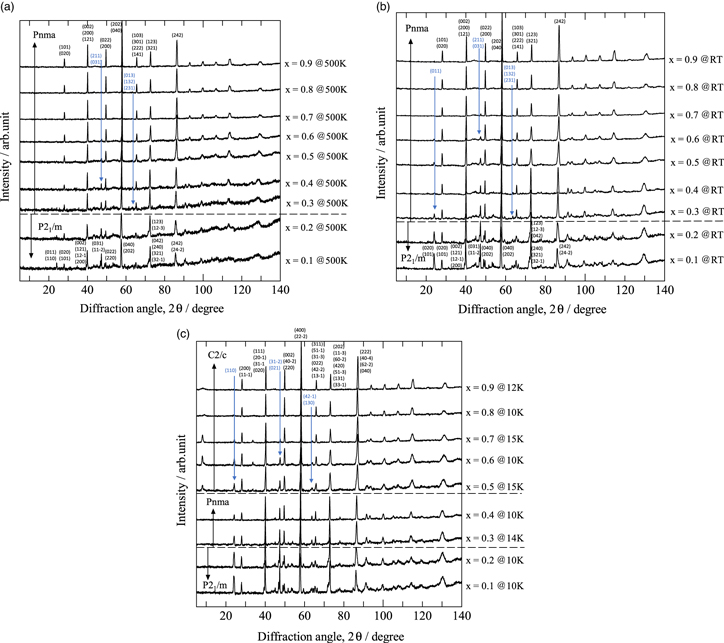
Fig. 1. (a) PND patterns for Nd1−x Srx FeO3−δ (0.1 ≤ x ≤ 0.9) at high temperature (500 K). (b) PND patterns for Nd1−x Srx FeO3−δ (0.1 ≤ x ≤ 0.9) at RT (300 K). (c) PND patterns for Nd1−x Srx FeO3−δ (0.1 ≤ x ≤ 0.9) at low temperatures (10 K ≤ T ≤ 15 K).
Download figure:
Standard image High-resolution imageTable I. (a) Crystal and magnetic structure parameters Nd1−x Srx FeO3−δ (0.1 ≤ x ≤ 0.9) at 500 K. (b) Crystal and magnetic structure parameters for (c) Crystal and magnetic structure parameters for Nd1−x Srx FeO3−δ (0.1 ≤ x ≤ 0.9) at 10–15 K.
| Samples | Nd1−x Srx FeO3−δ | |||||||||
|---|---|---|---|---|---|---|---|---|---|---|
| Composition, x | 0.1@500 K | 0.2@500 K | 0.3@500 K | 0.4@500 K | 0.5@500 K | 0.6@500 K | 0.7@500 K | 0.8@500 K | 0.9@500 K | |
| Space group | P21/m | P21/m | Pnma | Pnma | Pnma | Pnma | Pnma | Pnma | Pnma | |
| average ionic radius of A site (Å) | 1.29(5) | 1.30(7) | 1.32(8) | 1.34(8) | 1.36(8) | 1.37(8) | 1.39(8) | 1.41(7) | 1.42(5) | |
| average ionic radius of B site (Å) | 0.64(2) | 0.63(2) | 0.63(3) | 0.62(3) | 0.62(3) | 0.61(3) | 0.60(3) | 0.60(2) | 0.59(2) | |
| Goldschmidt tolerance factor | 0.93 | 0.94 | 0.95 | 0.96 | 0.97 | 0.98 | 0.98 | 0.99 | 1.00 | |
| polyhedral volume of A site VA (Å3) | 50.774 | 50.867 | 50.448 | 50.024 | 49.550 | 49.139 | 49.316 | 49.291 | 48.447 | |
| polyhedral volume of B site VB (Å3) | 10.888 | 10.668 | 10.298 | 10.097 | 9.883 | 9.753 | 9.815 | 9.800 | 9.773 | |
| polyhedral volume ratio VA/VB | 4.663 | 4.768 | 4.899 | 4.954 | 5.014 | 5.039 | 5.025 | 5.029 | 4.957 | |
| a (Å) | 5.591(2) | 5.574(2) | 5.522(3) | 5.502(1) | 5.493(1) | 5.482(1) | 5.4857(8) | 5.4766(9) | 5.484(2) | |
| b (Å) | 7.807(2) | 7.790(2) | 7.805(3) | 7.795(2) | 7.767(2) | 7.753(1) | 7.755(1) | 7.7695(9) | 7.770(1) | |
| c (Å) | 5.494(1) | 5.494(1) | 5.507(2) | 5.506(1) | 5.509(1) | 5.496(1) | 5.497(1) | 5.4922(7) | 5.483(2) | |
| a/√2 (Å) | 3.953 | 3.941 | 3.905 | 3.891 | 3.884 | 3.876 | 3.879 | 3.873 | 3.878 | |
| b/2 (Å) | 3.904 | 3.895 | 3.903 | 3.898 | 3.884 | 3.877 | 3.878 | 3.885 | 3.885 | |
| c/√2 (Å) | 3.885 | 3.885 | 3.894 | 3.893 | 3.895 | 3.886 | 3.887 | 3.884 | 3.877 | |
| V (Å3) | 239.9(1) | 238.6(1) | 237.3(2) | 236.1(1) | 235.1(1) | 233.64(8) | 233.91(6) | 233.69(5) | 233.7(1) | |
| α (deg.) | 90.0000 | 90.0000 | 90.0000 | 90.0000 | 90.0000 | 90.0000 | 90.0000 | 90.0000 | 90.0000 | |
| β (deg.) | 90.08(1) | 90.12(2) | 90.0000 | 90.0000 | 90.0000 | 90.0000 | 90.0000 | 90.0000 | 90.0000 | |
| γ (deg.) | 90.0000 | 90.0000 | 90.0000 | 90.0000 | 90.0000 | 90.0000 | 90.0000 | 90.0000 | 90.0000 | |
| Nd1/Sr1 (P21 /m) | x | 0.520(5) | 0.511(8) | — | — | — | — | — | — | — |
| y | 1/4 | 1/4 | — | — | — | — | — | — | — | |
| z | 0.494(6) | 0.50(1) | — | — | — | — | — | — | — | |
| B (Å2) | 0.5 | 0.5 | — | — | — | — | — | — | — | |
| g | 1.0 | 1.0 | — | — | — | — | — | — | — | |
| Nd2/Sr2 (P21/m) | x | 0.050(5) | 0.028(7) | 0.009(7) | −0.011(3) | −0.003(4) | −0.001(3) | −0.022(1) | 0.025(1) | 0.005(1) |
| Nd1/Sr1 (Pnma) | y | 1/4 | 1/4 | 1/4 | 1/4 | 1/4 | 1/4 | 1/4 | 1/4 | 1/4 |
| z | 0.972(5) | 0.98(1) | 0.991(4) | 1.010(8) | 0.999(5) | 0.996(4) | 1.006(2) | 0.991(2) | 0.986(2) | |
| B (Å2) | 0.5 | 0.5 | 0.5 | 0.5 | 0.5 | 0.5 | 0.5 | 0.5 | 0.5 | |
| g | 1.0 | 1.0 | 1.0 | 1.0 | 1.0 | 1.0 | 1.0 | 1.0 | 1.0 | |
| Fe1 (P21/m) | x | 1/2 | 1/2 | — | — | — | — | — | — | — |
| y | 0 | 0 | — | — | — | — | — | — | — | |
| z | 0 | 0 | — | — | — | — | — | — | — | |
| B (Å2) | 0.5 | 0.5 | — | — | — | — | — | — | — | |
| g | 1.0 | 1.0 | — | — | — | — | — | — | — | |
| Fe2 (P21/m) | x | 0 | 0 | 0 | 0 | 0 | 0 | 0 | 0 | 0 |
| Fe1 (Pnma) | y | 0 | 0 | 0 | 0 | 0 | 0 | 0 | 0 | 0 |
| z | 1/2 | 1/2 | 1/2 | 1/2 | 1/2 | 1/2 | 1/2 | 1/2 | 1/2 | |
| B (Å2) | 0.5 | 0.5 | 0.5 | 0.5 | 0.5 | 0.5 | 0.5 | 0.5 | 0.5 | |
| g | 1.0 | 1.0 | 1.0 | 1.0 | 1.0 | 1.0 | 1.0 | 1.0 | 1.0 | |
| O1 (P21/m) | x | 0.029(7) | 0.03(1) | — | — | — | — | — | — | — |
| y | 1/4 | 1/4 | — | — | — | — | — | — | — | |
| z | 0.438(7) | 0.44(1) | — | — | — | — | — | — | — | |
| B (Å2) | 1.0 | 1.0 | — | — | — | — | — | — | — | |
| g | 1.0 | 1.0 | — | — | — | — | — | — | — | |
| O2 (P21/m) | x | 0.432(6) | 0.433(9) | 0.50(1) | 0.483(5) | 0.471(4) | 0.473(3) | 0.495(2) | 0.493(2) | 0.527(2) |
| O1 (Pnma) | y | 1/4 | 1/4 | 1/4 | 1/4 | 1/4 | 1/4 | 1/4 | 1/4 | 1/4 |
| z | 0.084(8) | 0.05(1) | 0.030(3) | 0.01(1) | 0.080(2) | 0.065(1) | 0.035(1) | 0.009(2) | −0.008(8) | |
| B (Å2) | 1.0 | 1.0 | 1.0 | 1.0 | 1.0 | 1.0 | 1.0 | 1.0 | 1.0 | |
| g | 1.0 | 1.0 | 1.0 | 1.0 | 1.0 | 1.0 | 1.0 | 1.0 | 1.0 | |
| O3 (P21/m) | x | 0.282(5) | 0.325(7) | 0.294(5) | 0.270(3) | 0.263(4) | 0.25(1) | 0.268(2) | 0.271(2) | 0.26(1) |
| O2 (Pnma) | y | 0.053(4) | 0.021(4) | 0.044(1) | 0.048(1) | 0.004(2) | 0.002(2) | 0.004(1) | 0.012(1) | 0.002(3) |
| z | 0.693(5) | 0.701(6) | 0.722(3) | 0.713(3) | 0.738(4) | 0.75(1) | 0.735(3) | 0.737(2) | 0.73(1) | |
| B (Å2) | 1.0 | 1.0 | 1.0 | 1.0 | 1.0 | 1.0 | 1.0 | 1.0 | 1.0 | |
| g | 1.0 | 1.0 | 1.0 | 1.0 | 1.0 | 1.0 | 1.0 | 1.0 | 1.0 | |
| O4 (P21/m) | x | 0.194(5) | 0.204(7) | — | — | — | — | — | — | — |
| y | 0.955(4) | 0.950(3) | — | — | — | — | — | — | — | |
| z | 0.220(5) | 0.228(6) | — | — | — | — | — | — | — | |
| B (Å2) | 1.0 | 1.0 | — | — | — | — | — | — | — | |
| g | 1.0 | 1.0 | — | — | — | — | — | — | — | |
| Fe1–O2 (Å) (P21/m) | 2.04(1) | 2.00(1) | — | — | — | — | — | — | — | |
| Fe1–O3 (Å) (P21/m) | 2.11(3) | 1.91(3) | — | — | — | — | — | — | — | |
| Fe1–O4 (Å) (P21/m) | 2.12(3) | 2.10(4) | — | — | — | — | — | — | — | |
| Fe2–O1 (Å) (P21/m) | 1.988(7) | 1.977(9) | — | — | — | — | — | — | — | |
| Fe2–O3 (Å) (P21/m) | 1.95(3) | 2.13(4) | — | — | — | — | — | — | — | |
| Fe2–O4 (Å) (P21/m) | 1.91(2) | 1.91(4) | — | — | — | — | — | — | — | |
| Fe1–O1 (Å) (Pnma) | — | — | 1.958(2) | 1.952(2) | 1.998(3) | 1.976(2) | 1.946(1) | 1.9435(5) | 1.949(1) | |
| Fe1–O2 (Å) (Pnma) | — | — | 2.06(3) | 2.05(2) | 1.95(2) | 1.95(3) | 1.96(2) | 1.98(1) | 1.94(9) | |
| Fe1–O2 (Å) (Pnma) | — | — | 1.93(3) | 1.93(2) | 1.93(2) | 1.92(3) | 1.92(2) | 1.90(1) | 1.93(9) | |
| Fe2–O1–Fe2 (deg.) (P21/m) | 158(2) | 160(3) | — | — | — | — | — | — | — | |
| Fe1–O2–Fe1 (deg.) (P21/m) | 145(2) | 152(2) | — | — | — | — | — | — | — | |
| Fe2–O3–Fe1 (deg.) (P21/m) | 148(1) | 150(1) | — | — | — | — | — | — | — | |
| Fe2–O4–Fe1 (deg.) (P21/m) | 152(1) | 153(1) | — | — | — | — | — | — | — | |
| Fe1–O1–Fe1 (deg.) (Pnma) | — | — | 170(1) | 172(2) | 152.6(7) | 157.4(5) | 168.5(6) | 176.1(8) | 170.7(9) | |
| Fe1–O2–Fe1 (deg.) (Pnma) | — | — | 154.3(5) | 154.6(6) | 173(1) | 178(2) | 172.1(4) | 170.1(3) | 172.7(5) | |
| Rwp (%) for RIETAN-FP program | 3.416 | 3.025 | 3.813 | 4.296 | 3.545 | 4.078 | 3.854 | 4.106 | 4.040 | |
| RP (%) for RIETAN-FP program | 2.674 | 2.383 | 3.008 | 3.417 | 2.809 | 3.193 | 2.995 | 3.183 | 3.135 | |
| RR (%) for RIETAN-FP program | 60.072 | 62.279 | 64.657 | 58.939 | 51.540 | 42.196 | 35.250 | 36.003 | 33.828 | |
| Re (%) for RIETAN-FP program | 2.134 | 2.045 | 2.480 | 2.232 | 2.301 | 2.495 | 2.468 | 2.461 | 2.470 | |
| RB (%) for RIETAN-FP program | 27.851 | 31.715 | 29.933 | 24.589 | 20.524 | 15.789 | 14.000 | 15.299 | 12.509 | |
| RF (%) for RIETAN-FP program | 17.203 | 19.932 | 18.460 | 16.005 | 13.830 | 11.692 | 10.364 | 11.886 | 10.388 | |
| S = Rwp/Re | 1.601 | 1.479 | 1.538 | 1.925 | 1.541 | 1.634 | 1.562 | 1.668 | 1.636 | |
| Rwp (%) for GSAS-II suite programs | 3.40 | 3.13 | 4.03 | 4.41 | 3.93 | 4.27 | 3.96 | 4.32 | 4.18 | |
| Fe1: [mx (μB), my (μB), mz (μB)] (P21/m) | [0, 0, 2.1(6)] | [0, 0, 1.8(6)] | — | — | — | — | — | — | — | |
| Fe2: [mx (μB), my (μB), mz (μB)] (P21/m) | [0, 0, −2.6(6)] | [0, 0, −2.0(6)] | — | — | — | — | — | — | — | |
| Fe1: [mx (μB), my (μB), mz (μB)] (Pnma) | — | — | — | — | — | — | — | — | — | |
| (b) | ||||||||||
| Samples | Nd1−x Srx FeO3−δ | |||||||||
| Composition, x | 0.1@RT | 0.2@RT | 0.3@RT | 0.4@RT | 0.5@RT | 0.6@RT | 0.7@RT | 0.8@RT | 0.9@RT | |
| Space group | P21 /m | P21 /m | Pnma | Pnma | Pnma | Pnma | Pnma | Pnma | Pnma | |
| Average ionic radius of A site (Å) | 1.29(5) | 1.30(7) | 1.32(8) | 1.34(8) | 1.36(8) | 1.37(8) | 1.39(8) | 1.41(7) | 1.42(5) | |
| Average ionic radius of B site (Å) | 0.64(2) | 0.63(2) | 0.63(3) | 0.62(3) | 0.62(3) | 0.61(3) | 0.60(3) | 0.60(2) | 0.59(2) | |
| Goldschmidt tolerance factor | 0.93 | 0.94 | 0.95 | 0.96 | 0.97 | 0.98 | 0.98 | 0.99 | 1.00 | |
| Polyhedral volume of A site VA (Å3) | 50.048 | 50.080 | 49.550 | 49.440 | 48.529 | 48.352 | 48.350 | 48.465 | 48.447 | |
| Polyhedral volume of B site VB (Å3) | 10.688 | 10.387 | 10.147 | 10.069 | 9.794 | 9.680 | 9.678 | 9.594 | 9.596 | |
| Polyhedral volume ratio VA/VB | 4.683 | 4.821 | 4.883 | 4.910 | 4.955 | 4.995 | 4.996 | 5.051 | 5.049 | |
| a (Å) | 5.568(1) | 5.556(2) | 5.488(2) | 5.478(1) | 5.453(1) | 5.450(1) | 5.4519(9) | 5.462(2) | 5.4545(8) | |
| b (Å) | 7.765(2) | 7.759(3) | 7.755(2) | 7.754(1) | 7.708(2) | 7.707(1) | 7.713(1) | 7.710(1) | 7.732(1) | |
| c (Å) | 5.465(1) | 5.472(2) | 5.478(2) | 5.480(1) | 5.478(2) | 5.472(1) | 5.471(1) | 5.457(1) | 5.458(1) | |
| a/√2 (Å) | 3.937 | 3.929 | 3.881 | 3.874 | 3.856 | 3.854 | 3.855 | 3.862 | 3.857 | |
| b/2 (Å) | 3.883 | 3.880 | 3.878 | 3.877 | 3.854 | 3.854 | 3.857 | 3.855 | 3.866 | |
| c/√2 (Å) | 3.864 | 3.869 | 3.874 | 3.875 | 3.874 | 3.869 | 3.869 | 3.859 | 3.859 | |
| V (Å3) | 236.3(1) | 235.9(1) | 233.2(1) | 232.7(1) | 230.2(1) | 229.8(1) | 230.07(7) | 229.8(1) | 230.21(7) | |
| α (deg.) | 90.0000 | 90.0000 | 90.0000 | 90.0000 | 90.0000 | 90.0000 | 90.0000 | 90.0000 | 90.0000 | |
| β (deg.) | 90.18(1) | 90.18(1) | 90.0000 | 90.0000 | 90.0000 | 90.0000 | 90.0000 | 90.0000 | 90.0000 | |
| γ (deg.) | 90.0000 | 90.0000 | 90.0000 | 90.0000 | 90.0000 | 90.0000 | 90.0000 | 90.0000 | 90.0000 | |
| Nd1/Sr1 (P21 /m) | x | 0.511(3) | 0.503(4) | — | — | — | — | — | — | — |
| y | 1/4 | 1/4 | — | — | — | — | — | — | — | |
| z | 0.501(5) | 0.506(6) | — | — | — | — | — | — | — | |
| B (Å2) | 0.5 | 0.5 | — | — | — | — | — | — | — | |
| g | 1.0 | 1.0 | — | — | — | — | — | — | — | |
| Nd2/Sr2 (P21 /m) | x | 0.073(2) | 0.065(3) | 0.011(4) | 0.013(3) | 0.017(2) | −0.013(2) | −0.018(1) | −0.022(2) | 0.000(1) |
| Nd1/Sr1 (Pnma) | y | 1/4 | 1/4 | 1/4 | 1/4 | 1/4 | 1/4 | 1/4 | 1/4 | 1/4 |
| z | 0.984(4) | 0.980(5) | 0.989(2) | 0.998(4) | 0.986(2) | 0.996(3) | 1.000(2) | 1.002(6) | 1.00(1) | |
| B (Å2) | 0.5 | 0.5 | 0.5 | 0.5 | 0.5 | 0.5 | 0.5 | 0.5 | 0.5 | |
| g | 1.0 | 1.0 | 1.0 | 1.0 | 1.0 | 1.0 | 1.0 | 1.0 | 1.0 | |
| Fe1 (P21 /m) | x | 1/2 | 1/2 | — | — | — | — | — | — | — |
| y | 0 | 0 | — | — | — | — | — | — | — | |
| z | 0 | 0 | — | — | — | — | — | — | — | |
| B (Å2) | 0.5 | 0.5 | — | — | — | — | — | — | — | |
| g | 1.0 | 1.0 | — | — | — | — | — | — | — | |
| Fe2 (P21 /m) | x | 0 | 0 | 0 | 0 | 0 | 0 | 0 | 0 | 0 |
| Fe1 (Pnma) | y | 0 | 0 | 0 | 0 | 0 | 0 | 0 | 0 | 0 |
| z | 1/2 | 1/2 | 1/2 | 1/2 | 1/2 | 1/2 | 1/2 | 1/2 | 1/2 | |
| B (Å2) | 0.5 | 0.5 | 0.5 | 0.5 | 0.5 | 0.5 | 0.5 | 0.5 | 0.5 | |
| g | 1.0 | 1.0 | 1.0 | 1.0 | 1.0 | 1.0 | 1.0 | 1.0 | 1.0 | |
| O1 (P21 /m) | x | 0.023(5) | 0.047(6) | — | — | — | — | — | — | — |
| y | 1/4 | 1/4 | — | — | — | — | — | — | — | |
| z | 0.418(6) | 0.456(6) | — | — | — | — | — | — | — | |
| B (Å2) | 1.0 | 1.0 | — | — | — | — | — | — | — | |
| g | 1.0 | 1.0 | — | — | — | — | — | — | — | |
| O2 (P21 /m) | x | 0.442(4) | 0.432(6) | 0.495(6) | 0.489(4) | 0.502(5) | 0.499(5) | 0.505(3) | 0.497(3) | 0.524(1) |
| O1 (Pnma) | y | 1/4 | 1/4 | 1/4 | 1/4 | 1/4 | 1/4 | 1/4 | 1/4 | 1/4 |
| z | 0.081(6) | 0.067(6) | 0.031(2) | 0.031(3) | 0.080(2) | 0.065(1) | 0.045(1) | −0.021(4) | 0.00(1) | |
| B (Å2) | 1.0 | 1.0 | 1.0 | 1.0 | 1.0 | 1.0 | 1.0 | 1.0 | 1.0 | |
| g | 1.0 | 1.0 | 1.0 | 1.0 | 1.0 | 1.0 | 1.0 | 1.0 | 1.0 | |
| O3 (P21 /m) | x | 0.292(3) | 0.299(5) | 0.293(3) | 0.297(2) | 0.265(3) | 0.265(3) | 0.267(2) | 0.274(2) | 0.250(4) |
| O2 (Pnma) | y | 0.061(2) | 0.047(2) | 0.046(1) | 0.042(1) | 0.011(1) | 0.006(1) | 0.009(1) | 0.002(6) | 0.006(2) |
| z | 0.699(4) | 0.701(4) | 0.720(2) | 0.728(2) | 0.725(2) | 0.735(3) | 0.739(3) | 0.743(4) | 0.729(1) | |
| B (Å2) | 1.0 | 1.0 | 1.0 | 1.0 | 1.0 | 1.0 | 1.0 | 1.0 | 1.0 | |
| g | 1.0 | 1.0 | 1.0 | 1.0 | 1.0 | 1.0 | 1.0 | 1.0 | 1.0 | |
| O4 (P21 /m) | x | 0.211(3) | 0.219(5) | — | — | — | — | — | — | — |
| y | 0.963(2) | 0.963(2) | — | — | — | — | — | — | — | |
| z | 0.214(4) | 0.219(4) | — | — | — | — | — | — | — | |
| B (Å2) | 1.0 | 1.0 | — | — | — | — | — | — | — | |
| g | 1.0 | 1.0 | — | — | — | — | — | — | — | |
| Fe1–O2 (Å) (P21 /m) | 2.017(9) | 2.010(8) | — | — | — | — | — | — | — | |
| Fe1–O3 (Å) (P21 /m) | 2.06(2) | 2.00(3) | — | — | — | — | — | — | — | |
| Fe1–O4 (Å) (P21 /m) | 2.00(2) | 1.98(3) | — | — | — | — | — | — | — | |
| Fe2–O1 (Å) (P21 /m) | 1.996(8) | 1.971(6) | — | — | — | — | — | — | — | |
| Fe2–O3 (Å) (P21 /m) | 2.01(2) | 2.02(3) | — | — | — | — | — | — | — | |
| Fe2–O4 (Å) (P21 /m) | 1.98(2) | 1.98(2) | — | — | — | — | — | — | — | |
| Fe1–O1 (Å) (Pnma) | — | — | 1.946(1) | 1.946(1) | 1.977(2) | 1.960(1) | 1.944(1) | 1.931(1) | 1.937(1) | |
| Fe1–O2 (Å) (Pnma) | — | — | 2.04(2) | 2.07(1) | 1.97(2) | 1.93(2) | 1.96(1) | 2.00(2) | 2.00(1) | |
| Fe1–O2 (Å) (Pnma) | — | — | 1.93(2) | 1.88(1) | 1.90(2) | 1.93(2) | 1.90(2) | 1.86(2) | 1.85(1) | |
| Fe2–O1–Fe2 (deg.) (P21 /m) | 152(1) | 159(1) | — | — | — | — | — | — | — | |
| Fe1–O2–Fe1 (deg.) (P21 /m) | 148(1) | 149(1) | — | — | — | — | — | — | — | |
| Fe2–O3–Fe1 (deg.) (P21 /m) | 145.6(9) | 149(1) | — | — | — | — | — | — | — | |
| Fe2–O4–Fe1 (deg.) (P21 /m) | 156(1) | 158(1) | — | — | — | — | — | — | — | |
| Fe1–O1–Fe1 (deg.) (Pnma) | — | — | 169.8(8) | 169(1) | 154.1(6) | 158.8(5) | 165.2(6) | 173(1) | 171.8(8) | |
| Fe1–O2–Fe1 (deg.) (Pnma) | — | — | 153.2(4) | 155.3(4) | 169.4(6) | 172.5(6) | 172.4(5) | 172.7(9) | 174(1) | |
| Rwp (%) for RIETAN-FP program | 5.898 | 5.940 | 5.682 | 5.390 | 4.670 | 4.592 | 4.518 | 6.220 | 5.653 | |
| R P (%) for RIETAN-FP program | 4.078 | 4.295 | 4.298 | 4.018 | 3.431 | 3.436 | 3.440 | 5.031 | 4.234 | |
| R R (%) for RIETAN-FP program | 36.678 | 37.662 | 39.963 | 35.671 | 28.917 | 27.467 | 26.210 | 34.160 | 30.397 | |
| Re (%) for RIETAN-FP program | 2.419 | 2.304 | 2.327 | 2.339 | 2.303 | 2.303 | 2.308 | 2.323 | 2.317 | |
| RB (%) for RIETAN-FP program | 16.743 | 15.638 | 17.436 | 16.688 | 11.629 | 12.174 | 12.006 | 11.252 | 16.320 | |
| RF (%) for RIETAN-FP program | 8.406 | 7.853 | 9.287 | 10.412 | 6.596 | 7.914 | 9.174 | 8.555 | 11.825 | |
| S = Rwp/Re | 2.438 | 2.578 | 2.442 | 2.304 | 2.028 | 1.994 | 1.958 | 2.678 | 2.440 | |
| Rwp (%) for GSAS-II suite programs | 5.03 | 6.46 | 6.15 | 5.48 | 6.51 | 5.96 | 4.83 | 6.64 | 5.60 | |
| Fe1: [mx (μB), my (μB), mz (μB)] (P21 /m) | [0, 0, 2.9(3)] | [0, 0, 2.5(4)] | — | — | — | — | — | — | — | |
| Fe2: [mx (μB), my (μB), mz (μB)] (P21 /m) | [0, 0, −3.5(3)] | [0, 0, −2.9(4)] | — | — | — | — | — | — | — | |
| Fe1: [mx (μB), my (μB), mz (μB)] (Pnma) | — | — | [0, 0, 1.97(9)] | [0.8(1), 0, 0] | [1.3(1), 0, 0] | [0.9(1), 0, 0] | [0.2(2), 0, 0] | [0.5(1), 0, 0] | [0, 0, 0.2(2)] | |
| (c) | ||||||||||
| Samples | Nd1−x Srx FeO3−δ | |||||||||
| Composition, x | 0.1@10 K | 0.2@10 K | 0.3@14 K | 0.4@10 K | 0.5@15 K | 0.6@10 K | 0.7@15 K | 0.8@10 K | 0.9@12 K | |
| Space group | P21 /m | P21 /m | Pnma | Pnma | C2/c | C2/c | C2/c | C2/c | C2/c | |
| Average ionic radius of A site (Å) | 1.29(5) | 1.30(7) | 1.32(8) | 1.34(8) | 1.36(8) | 1.37(8) | 1.39(8) | 1.41(7) | 1.42(5) | |
| Average ionic radius of B site (Å) | 0.64(2) | 0.63(2) | 0.63(3) | 0.62(3) | 0.62(3) | 0.61(3) | 0.60(3) | 0.60(2) | 0.59(2) | |
| Goldschmidt tolerance factor | 0.93 | 0.94 | 0.95 | 0.96 | 0.97 | 0.98 | 0.98 | 0.99 | 1.00 | |
| polyhedral volume of A site VA (Å3) | 49.688 | 49.661 | 48.844 | 48.898 | 47.591 | 47.503 | 47.486 | 47.760 | 47.451 | |
| Polyhedral volume of B site VB (Å3) | 10.546 | 10.295 | 9.957 | 9.994 | 9.704 | 9.646 | 9.604 | 9.563 | 9.494 | |
| Polyhedral volume ratio VA/VB | 4.711 | 4.824 | 4.905 | 4.893 | 4.904 | 4.924 | 4.944 | 4.994 | 4.998 | |
| a (Å) | 5.560(1) | 5.549(1) | 5.483(2) | 5.474(1) | 9.435(8) | 9.411(6) | 9.405(4) | 9.450(4) | 9.433(3) | |
| b (Å) | 7.745(1) | 7.741(1) | 7.737(1) | 7.735(1) | 5.470(2) | 5.467(1) | 5.461(1) | 5.451(2) | 5.439(1) | |
| c (Å) | 5.451(1) | 5.458(1) | 5.467(1) | 5.4690(6) | 5.447(5) | 5.438(3) | 5.437(2) | 5.448(2) | 5.435(1) | |
| a/20.5 (Å) (Pnma, P21 /m), (a2–c2)0.5/2 (C2/c) | 3.932 | 3.924 | 3.877 | 3.871 | 3.852 | 3.840 | 3.837 | 3.861 | 3.855 | |
| b/2 (Å) (Pnma, P21 /m), (b2 + c2)0.5/2 (C2/c) | 3.873 | 3.871 | 3.869 | 3.868 | 3.860 | 3.856 | 3.853 | 3.853 | 3.845 | |
| c/20.5(Å) (Pnma, P21 /m), (b2 + c2)0.5/2 (C2/c) | 3.854 | 3.859 | 3.866 | 3.867 | 3.860 | 3.856 | 3.853 | 3.853 | 3.845 | |
| V (Å3) | 234.77(8) | 234.5(1) | 231.9(1) | 231.58(6) | 229(9) | 228(5) | 228(3) | 229(5) | 227(2) | |
| α (deg.) | 90.0000 | 90.0000 | 90.0000 | 90.0000 | 90.0000 | 90.0000 | 90.0000 | 90.0000 | 90.0000 | |
| β (deg.) | 90.180(7) | 90.15(1) | 90.0000 | 90.0000 | 125.40(6) | 125.23(3) | 125.16(2) | 125.23(3) | 125.23(1) | |
| γ (deg.) | 90.0000 | 90.0000 | 90.0000 | 90.0000 | 90.0000 | 90.0000 | 90.0000 | 90.0000 | 90.0000 | |
| Nd1/Sr1 (P21 /m) | x | 0.508(2) | 0.501(3) | — | — | — | — | — | — | — |
| y | 1/4 | 1/4 | — | — | — | — | — | — | — | |
| z | 0.514(3) | 0.510(3) | — | — | — | — | — | — | — | |
| B (Å2) | 0.5 | 0.5 | — | — | — | — | — | — | — | |
| g | 1.0 | 1.0 | — | — | — | — | — | — | — | |
| Nd2/Sr2 (P21 /m) | x | 0.076(2) | 0.073(2) | 0.023(3) | 0.021(2) | 0 | 0 | 0 | 0 | 0 |
| Nd1/Sr1 (Pnma, C2/c) | y | 1/4 | 1/4 | 1/4 | 1/4 | 0.257(2) | 0.258(2) | 0.257(2) | 0.245(5) | 0.24(3) |
| z | 0.976(3) | 0.971(3) | 0.980(1) | 0.982(1) | 1/4 | 1/4 | 1/4 | 1/4 | 1/4 | |
| B (Å2) | 0.5 | 0.5 | 0.5 | 0.5 | 0.5 | 0.5 | 0.5 | 0.5 | 0.5 | |
| g | 1.0 | 1.0 | 1.0 | 1.0 | 1.0 | 1.0 | 1.0 | 1.0 | 1.0 | |
| Fe1 (P21 /m) | x | 1/2 | 1/2 | — | — | — | — | — | — | — |
| y | 0 | 0 | — | — | — | — | — | — | — | |
| z | 0 | 0 | — | — | — | — | — | — | — | |
| B (Å2) | 0.5 | 0.5 | — | — | — | — | — | — | — | |
| g | 1.0 | 1.0 | — | — | — | — | — | — | — | |
| Fe2 (P21 /m) | x | 0 | 0 | 0 | 0 | 1/4 | 1/4 | 1/4 | 1/4 | 1/4 |
| Fe1 (Pnma, C2/c) | y | 0 | 0 | 0 | 0 | 1/4 | 1/4 | 1/4 | 1/4 | 1/4 |
| z | 1/2 | 1/2 | 1/2 | 1/2 | 0 | 0 | 0 | 0 | 0 | |
| B (Å2) | 0.5 | 0.5 | 0.5 | 0.5 | 0.5 | 0.5 | 0.5 | 0.5 | 0.5 | |
| g | 1.0 | 1.0 | 1.0 | 1.0 | 1.0 | 1.0 | 1.0 | 1.0 | 1.0 | |
| O1 (P21 /m) | x | 0.031(3) | 0.039(4) | — | — | — | — | — | — | — |
| y | 1/4 | 1/4 | — | — | — | — | — | — | — | |
| z | 0.416(4) | 0.450(4) | — | — | — | — | — | — | — | |
| B (Å2) | 1.0 | 1.0 | — | — | — | — | — | — | — | |
| g | 1.0 | 1.0 | — | — | — | — | — | — | — | |
| O2 (P21 /m) | x | 0.434(3) | 0.416(4) | 0.503(4) | 0.494(4) | 0 | 0 | 0 | 0 | 0 |
| O1 (Pnma. C2/c) | y | 1/4 | 1/4 | 1/4 | 1/4 | 0.672(2) | 0.682(2) | 0.695(1) | 0.75(1) | 0.75(3) |
| z | 0.061(4) | 0.050(4) | 0.032(1) | 0.034(1) | 1/4 | 1/4 | 1/4 | 1/4 | 1/4 | |
| B (Å2) | 1.0 | 1.0 | 1.0 | 1.0 | 1.0 | 1.0 | 1.0 | 1.0 | 1.0 | |
| g | 1.0 | 1.0 | 1.0 | 1.0 | 1.0 | 1.0 | 1.0 | 1.0 | 1.0 | |
| O3 (P21 /m) | x | 0.292(2) | 0.307(3) | 0.258(4) | 0.273(3) | 0.244(2) | 0.243(1) | 0.241(1) | 0.240(4) | 0.243(3) |
| O2 (Pnma, C2/c) | y | 0.063(1) | 0.058(1) | 0.0496(7) | 0.0444(6) | 0.028(2) | 0.017(2) | 0.007(4) | 0.01(1) | 0.00(2) |
| z | 0.708(3) | 0.721(3) | 0.716(1) | 0.720(1) | 0.264(5) | 0.262(4) | 0.253(4) | 0.25(1) | 0.25(1) | |
| B (Å2) | 1.0 | 1.0 | 1.0 | 1.0 | 1.0 | 1.0 | 1.0 | 1.0 | 1.0 | |
| g | 1.0 | 1.0 | 1.0 | 1.0 | 1.0 | 1.0 | 1.0 | 1.0 | 1.0 | |
| O4 (P21 /m) | x | 0.216(3) | 0.235(3) | — | — | — | — | — | — | — |
| y | 0.958(1) | 0.960(1) | — | — | — | — | — | — | — | |
| z | 0.214(3) | 0.212(3) | — | — | — | — | — | — | — | |
| B (Å2) | 1.0 | 1.0 | — | — | — | — | — | — | — | |
| g | 1.0 | 1.0 | — | — | — | — | — | — | — | |
| Fe1–O2 (Å) (P21 /m) | 1.998(5) | 2.009(5) | — | — | — | — | — | — | — | |
| Fe1–O3 (Å) (P21 /m) | 2.02(1) | 1.90(1) | — | — | — | — | — | — | — | |
| Fe1–O4 (Å) (P21 /m) | 1.99(2) | 1.90(1) | — | — | — | — | — | — | — | |
| Fe2–O1 (Å) (P21 /m) | 1.997(6) | 1.967(4) | — | — | — | — | — | — | — | |
| Fe2–O3 (Å) (P21 /m) | 2.03(1) | 2.13(1) | — | — | — | — | — | — | — | |
| Fe2–O4 (Å) (P21 /m) | 1.99(2) | 2.06(1) | — | — | — | — | — | — | — | |
| Fe1–O1 (Å) (Pnma, C2/c) | — | — | 1.9427(9) | 1.9431(8) | 1.969(3) | 1.957(2) | 1.945(1) | 1.930(1) | 1.926(3) | |
| Fe1–O2 (Å) (Pnma, C2/c) | — | — | 2.07(1) | 1.99(1) | 1.97(2) | 1.93(2) | 1.94(2) | 1.9(1) | 1.9(1) | |
| Fe1–O2 (Å) (Pnma, C2/c) | — | — | 1.88(2) | 1.95(1) | 1.90(2) | 1.92(2) | 1.91(2) | 1.9(1) | 1.9(1) | |
| Fe2–O1–Fe2 (deg.) (P21 /m) | 151(1) | 159(1) | — | — | — | — | — | — | — | |
| Fe1–O2–Fe1 (deg.) (P21 /m) | 151(1) | 148(1) | — | — | — | — | — | — | — | |
| Fe2–O3–Fe1 (deg.) (P21 /m) | 146.2(7) | 147.4(7) | — | — | — | — | — | — | — | |
| Fe2–O4–Fe1 (deg.) (P21 /m) | 155.6(8) | 158.5(8) | — | — | — | — | — | — | — | |
| Fe1–O1–Fe1 (deg.) (Pnma, C2/c) | — | — | 169.3(5) | 168.7(4) | 154.9(6) | 158.2(6) | 162.2(6) | 177(3) | 178(12) | |
| Fe1–O2–Fe1 (deg.) (Pnma, C2/c) | — | — | 155.6(4) | 156.6(3) | 168.7(5) | 171.0(5) | 173.8(7) | 173.3(6) | 175(2) | |
| Rwp (%) for RIETAN-FP program | 5.808 | 5.453 | 5.721 | 4.194 | 5.503 | 6.271 | 6.758 | 4.736 | 4.837 | |
| RP (%) for RIETAN-FP program | 3.797 | 3.738 | 4.206 | 3.166 | 4.014 | 4.100 | 4.063 | 3.629 | 3.751 | |
| RR (%) for RIETAN-FP program | 37.779 | 35.937 | 40.600 | 32.776 | 36.659 | 34.982 | 31.083 | 31.504 | 29.274 | |
| Re (%) for RIETAN-FP program | 2.932 | 2.946 | 2.887 | 2.856 | 2.860 | 2.869 | 2.890 | 2.903 | 2.841 | |
| RB (%) for RIETAN-FP program | 14.162 | 12.485 | 10.968 | 10.745 | 9.437 | 10.872 | 7.985 | 7.449 | 7.720 | |
| RF (%) for RIETAN-FP program | 5.958 | 5.599 | 5.256 | 5.886 | 4.203 | 5.169 | 4.791 | 5.364 | 6.251 | |
| S = Rwp/Re | 1.981 | 1.851 | 1.982 | 1.468 | 1.924 | 2.186 | 2.338 | 1.631 | 1.703 | |
| Rwp (%) for GSAS-II suite programs | 4.51 | 5.54 | 5.63 | 3.84 | 5.80 | 5.34 | 4.53 | 4.84 | 5.21 | |
| Fe1, Fe1_2: [mx (μB), my (μB), mz (μB)] (P21 /m, C2'/n') | [0, 0, 4.0(1)] | [0, 0, 3.0(4)] | — | — | [0, 3.29(6), 0] | [0, 3.54(5), 0] | [0, 2.89(5), 0] | [0, 0.9(1), 0] | — | |
| Fe2, Fe1_3: [mx (μB), my (μB), mz (μB)] (P21 /m, C2'/n') | [0, 0, −3.2(1)] | [0, 0, −3.3(4)] | — | — | [0, −0.01(9), 0] | [0, −0.96(7), 0] | [0, −1.87(6), 0)] | [0, −0.2(1), 0] | — | |
| Fe1: [mx (μB), my (μB), mz (μB)](Pnma) | — | — | [0, 0, 2.96(5)] | [2.37(3), 0, 0] | — | — | — | — | — | |
The Fe1–O1 or Fe1–O2 distances and Fe1–O1–Fe1 or Fe1–O2–Fe1 angles indicate the degree of distortion of the orthorhombic (Pnma) or monoclinic (C2/c) oxygen octahedra Fe1O12O24. By contrast, the Fe1–O2, Fe1–O3, Fe1–O4, Fe2–O1, Fe2–O3, or Fe2–O4 distances and Fe2–O1–Fe2, Fe1–O2–Fe2, Fe2–O3–Fe1, or Fe2–O4–Fe1 angles indicate the degree of distortion of the monoclinic (P21/m) oxygen octahedra Fe1O22O32O42 and Fe2O12O32O42. The Goldschmidt tolerance factors (rA + rO)/√2(rB + rO) and the polyhedral volume ratio VA/VB are summarized in Tables I(a)–I(c). Here, rA, rB, and rO are the average ionic radii of the cations at the A and B sites and the radius of the oxygen ions, respectively, and VA and VB are the volumes of the oxygen dodecahedron AO12 and oxygen octahedron BO6, respectively. The value of rA increases, and that of rB decreases with increasing x, and the Goldschmidt tolerance factor increases from 0.93 (x = 0.1) to 1.00 (x = 0.9) with increasing x. This tendency suggests that the strain in the FeO6 oxygen octahedron is relaxed and that the crystal structure approaches the ideal perovskite structure. The polyhedral volume ratio VA/VB also increases with increasing x. The Howard–Stokes diagram for disordered ABO3 perovskites 60) suggests that the crystal structure undergoes a phase transition from the monoclinic P21/m structure to the orthorhombic Pnma or monoclinic C2/c structure as VA/VB increase.
Figure 2 shows the x dependence of the lattice constants for the quasi-cubic monoclinic (P21/m), orthorhombic (Pnma), and monoclinic (C2/c) structures at (a) 500 K, (b) RT, and (c) low temperature. A significant difference was found between a/√2 and b/2 in monoclinic crystals (P21/m) with x ≤ 0.2; however, a/√2 and b/2 became almost equal in orthorhombic (Pnma) crystals with x ≥ 0.3 at both 500 K and RT. In addition, c/√2 was the shortest in monoclinic crystals (P21/m) with x ≤ 0.2 but longest in orthorhombic crystals (Pnma) with 0.5 ≤ x ≤ 0.7 at both 500 K and RT. However, two lengths of √(a2 − c2)/2 and √(b2 + c2)/2 are observed for monoclinic crystals (C2/c) with x ≥ 0.5, where the latter is larger than the former in crystals with 0.5 ≤ x ≤ 0.7 at low temperatures. The reversal of this lattice constant's magnitude affects the magnetic moment's alignment direction in each sample. The magnetic structure shows G-type antiferromagnetism with small ferromagnetic order 61–63) in the c-axis direction for x ≤ 0.3 and the a- or b-axis directions at RT or low temperature for 0.4 ≤ x ≤ 0.8. However, as shown in Tables I(a)–I(c), the Fe–O–Fe angle at 500 K, RT, and low temperature tends to increase with increasing x. At x ≥ 0.8, both the Fe1–O1–Fe1 and Fe1–O2–Fe1 angles reach 170°–180°, which suggests that the strain in the FeO6 oxygen octahedron tends to be relaxed with increasing x. As shown in Table I(c), the unit cell volume at low increases from 228(3) Å3 for x = 0.7 to 229(5) Å3 for x = 0.8 because the lattice constant a increases from 9.405(4) Å for x = 0.7 to 9.450(4) Å for x = 0.8. However, the increase in unit cell volume is within the standard deviation.

Fig. 2. Lattice constants for pseudo-cubic Nd1−x Srx FeO3−δ (0.1 ≤ x ≤ 0.9) at (a) 500 K, (b) 300 K, and (c) 10 K ≤ T ≤ 15 K.
Download figure:
Standard image High-resolution imageFigure 3 shows the x dependence of the absolute value of the magnetic moment ∣M∣ for the Fe site at (a) 500 K, (b) RT, and (c) low temperature, plotted as a solid line. The x dependence of the effective magnetic moment μeff at the Fe site, estimated from the Curie constant obtained from the temperature dependence of the reciprocal magnetic susceptibility (χ—χ0)−1 in the paramagnetic region, is shown by a broken line. Because the magnetic moments at the Fe1 site and the Fe2 site differ for the monoclinic crystals (P21/m) at 500 K, RT, and low temperature, the ∣M∣ value for the Fe1 site is plotted as solid circles, and that for the Fe2 site is plotted as open circles. In the orthorhombic crystal (Pnma) at 500 K, ∣M∣ is not plotted because we could not observe sufficient magnetic peaks to analyze the magnetic structure. For orthorhombic crystals (Pnma) at room and low temperatures, the value of ∣M∣ for the Fe1 site is plotted as solid squares. Because the magnetic moments at the Fe1_2 site and the Fe1_3 site also differ for the monoclinic crystals (C2/c) at low temperature, the value of ∣M∣ for the Fe1_2 site is plotted as solid squares, and that of ∣M∣ for the Fe1_3 site is plotted as solid triangles. The μeff per Fe site estimated from the measurement of χ is plotted as open squares for all x. As x increases, ∣M∣ tends to decrease; however, the μeff remains almost constant at ∼2.8 μB. At low temperatures, a good match is observed between ∣M∣ and μeff at x ≤ 0.7; however, at 500 K and RT, a significant discrepancy is observed between ∣M∣ and μeff, especially at RT for the samples with x ≥ 0.3. This suggests that the vector sum of the magnetic moments, which should be reflected in the antiferromagnetism with small ferromagnetic order 61–63) at low temperatures, is offset by thermal scattering in the paramagnetic region at temperatures above RT.
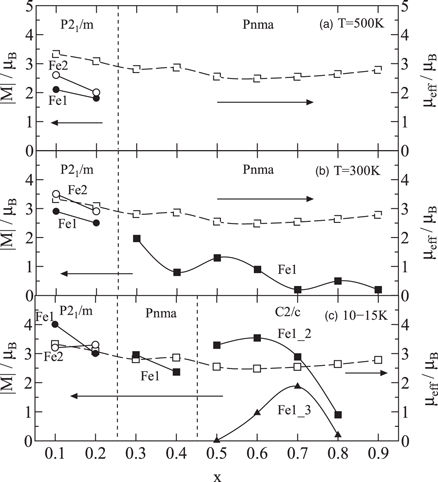
Fig. 3. Magnetic moments obtained from PND measurements at (a) 500 K, (b) 300 K, and (c) 10 K ≤ T ≤ 15 K, and the effective magnetic moments obtained from Eq. (2) for Nd1−x Srx FeO3−δ (0.1 ≤ x ≤ 0.9).
Download figure:
Standard image High-resolution imageAs shown in Fig. 4(a), the crystal-structure analysis of the PND pattern for Nd0.9Sr0.1FeO3.00(3) at 10 K using the RIETAN-FP program, 57) which was performed before magnetic-structure analysis using the GSAS-II programs, 58) indicates a monoclinic (P21/m) perovskite-type single phase. As shown in Table I(c), the reliability factor Rwp is 5.808% for the crystal-structure analysis and 4.51% for the magnetic-structure analysis; thus, Rwp was improved by the Rietveld analysis of the magnetic structure. The crystal-structure analysis in Fig. 4(a) is insufficient to fit the diffraction patterns; however, the magnetic-structure analysis in Fig. 4(b) shows the fitting results for all the diffraction patterns. The magnetic moments are aligned in G-type antiferromagnetic order in the c-axis direction, where ∣M∣ for the Fe1 site is 4.0(1) μB and ∣M∣ for the Fe2 site is 3.2(1) μB.

Fig. 4. (a) PND pattern and crystal structure, and (b) PND pattern and magnetic structure for Nd0.9Sr0.1FeO3.00(3) at 10 K.
Download figure:
Standard image High-resolution imageAs shown in Fig. 5(a), the crystal-structure analysis based on the PND pattern for Nd0.5Sr0.5FeO3.00(2) at 15 K, as performed using the RIETAN-FP program, 57) which was carried out before the magnetic-structure analysis using the GSAS-II suite programs, 58) shows that it is a single-phase monoclinic (C2/c) perovskite. As shown in Table I(c), the reliability factor Rwp is 5.503% in the crystal-structure analysis and 5.80% in the magnetic-structure analysis; thus, the reliability factors are similar. The crystal-structure analysis in Fig. 5(a) is insufficient to fit the diffraction patterns; however, the magnetic-structure analysis in Fig. 5(b) shows the fitting results for all the diffraction patterns. The space group of the magnetic structure is C2'/n', and the magnetic moment is mainly aligned in the b-axis direction of the Fe1_2 site, where ∣M∣ for the Fe1_2 site is 3.29(6) μB and ∣M∣ for the Fe1_3 site. is 0.01(9) μB.

Fig. 5. (a) PND pattern and crystal structure, and (b) PND pattern and magnetic structure for Nd0.5Sr0.5FeO3.00(2) at 15 K.
Download figure:
Standard image High-resolution imageFigures 6(a) and 6(b) show the temperature dependence of (a) the magnetic susceptibility χ − χ0 in both warm-up and cool-down processes and (b) the inverse of the magnetic susceptibility (χ − χ0)−1 in the warm-up process for Nd1−x Srx FeO3−δ (0.1 ≤ x ≤ 0.9) samples measured in the temperature range from 5 to 700 K under a magnetic field of 1 T, where the contribution of temperature-independent magnetic susceptibility χ0 is estimated by extrapolation in the high-temperature limit from the relationship between χ and T−1. Figure 6(c) shows the temperature dependence of the magnetic susceptibility χ − χ0 in both warm-up and cool-down processes and the inverse of the magnetic susceptibility (χ − χ0)−1 in the warm-up process for Nd1−x Srx FeO3−δ (0.6 ≤ x ≤ 0.9) samples after high-temperature measurement measured in the temperature range from 5 to 700 K under a magnetic field of 1 T. As shown in Fig. 6(a), the magnetic susceptibility anomalies around 200 K for x = 0.6 and x = 0.7 are considered to be the boundary between G-type antiferromagnetism with small ferromagnetic order on the low temperature side and paramagnetism on the high temperature side, i.e. the antiferromagnetic transition. Therefore, the inverse of the magnetic susceptibility around 200 K for x = 0.6 and x = 0.7 shows a maximum of around 150 K, as shown in Fig. 6(b). Since we have measured the magnetic susceptibility above 300 K in both warm-up and cool-down processes, the temperature dependence of the magnetic susceptibility in both warm-up and cool-down processes is shown in Figs. 6(a) and 6(c). We observed no significant change in the temperature dependence of the magnetic susceptibility above 300 K in both warm-up and cool-down processes. As is clear from the iodine titration results, samples with x > 0.6 show a progressive oxygen deficiency at 550–600 K after the high temperature measurement. In other words, due to oxygen deficiency, LS Fe4+ is reduced to IS Fe3+ or LS Fe3+ in samples for x > 0.6, and the conduction carrier changes from electron to hole, increasing resistivity. It strongly suggests that the effective magnetic moment μeff formed by the mixed valence states of the Fe sites (i.e. LS Fe4+, IS Fe3+, and LS Fe3+) remains constant even with progressive oxygen deficiency in samples for x > 0.6.

Fig. 6. (a) Temperature dependence of magnetic susceptibility, χ − χ0 in both warm-up and cool-down processes, for Nd1−x Srx FeO3−δ (0.1 ≤ x ≤ 0.9) under zero-field cooling conditions in a magnetic field of 1 T, where the temperature-independent term, χ0, is evaluated from χ (T → ∞), as shown in the inset. (b) Temperature dependence of inverse magnetic susceptibility, (χ − χ0)−1 in the warm-up process, for Nd1−x Srx FeO3−δ (0.1 ≤ x ≤ 0.9). The straight lines represent the Curie–Weiss law at temperatures above 650 K. (c) Temperature dependence of magnetic susceptibility, χ − χ0, in both warm-up and cool-down processes, and temperature dependence of inverse magnetic susceptibility, (χ − χ0)−1, in warm-up process for Nd1−x Srx FeO3−δ (0.6 ≤ x ≤ 0.9) after high-temperature measurement. The straight lines represent the Curie–Weiss law at temperatures above 650 K.
Download figure:
Standard image High-resolution imageAs shown in Fig. 6(a), in all the samples, a decreasing tendency of χ − χ0 is shown with increasing temperature, and the magnetic phase transition from low temperature G-type antiferromagnetism to high-temperature paramagnetism is confirmed. The tangents to each plot in Fig. 6(b) represent the high-temperature paramagnetic region for each sample. In general, the temperature dependence of paramagnetic susceptibility follows the Curie–Weiss law: χ − χ0 = C(T − Θ)−1; thus, (χ − χ0)−1 is proportional to T, where the slope of the tangent is C−1 and (χ − χ0)−1 at T = 0 K is −ΘC−1, where C is the Curie constant and Θ is the Curie temperature. By calculating C from the slope of the tangent, we can estimate the effective magnetic moment μeff at the Fe site from
where s, kB, and NA are the spin quantum number, Boltzmann constant, and Avogadro's number, respectively. As shown in Figs. 3(a) and 3(b), the results for the samples with x ≤ 0.2 at RT and those with x ≤ 0.7 at low temperature show a good agreement between ∣M∣ and μeff. In addition, as shown in Table II, because the spin quantum number at the Fe site is in the range 0.82 ≤ x ≤ 1.24, the Fe site in Nd1−x Srx FeO3−δ is considered to be in the mixed-valence state of (IS Fe3+ 1−y LS Fe3+ y )1−(x−2δ) LS Fe4+ x−2δ , and the ratios among LS Fe3+, IS Fe3+, and LS Fe4+ can be determined. Table II summarizes χ0, Θ, C, μeff, s, and the mixed-valence-state ratios for LS Fe3+, IS Fe3+, and LS Fe4+. As x increases, the spin state of Fe changes from the LS or IS Fe3+-dominant state at x ≤ 0.5 to the LS Fe4+-dominant state at x ≥ 0.6. The increase in the amount of t2g or eg holes of LS Fe4+ with increasing x. This suggests that the major carriers change from t2g or eg holes in LS Fe4+ to t2g electrons in LS Fe3+ or eg electrons in IS Fe3+ as x increases.
Table II. Temperature-independent magnetic susceptibility χ0, paramagnetic Curie temperature Θ, Curie constant C, effective magnetic moment μeff, spin quantum number s, ionic ratio for Fe ions, Seebeck coefficient at high-temperature limit S∞ obtained from Eq. (3), and Lorentz number L0 for Nd1−x Srx FeO3−δ (0.1 ≤ x ≤ 0.9).
| >Samples | Nd1−x Srx FeO3−δ | ||||||||
|---|---|---|---|---|---|---|---|---|---|
| Composition, x | 0.1 | 0.2 | 0.3 | 0.4 | 0.5 | 0.6 | 0.7 | 0.8 | 0.9 |
| δ | 0 | 0.004 | 0.01 | 0.011 | 0 | 0.01 | 0.009 | 0.035 | 0.048 |
| χ0 (emu mol−1) | 0.000 04 | 0.000 56 | 0.000 93 | 0.001 62 | 0.002 05 | 0.001 73 | 0.001 84 | 0.001 56 | 0.001 03 |
| Θ(K) | 584 | 404 | 299 | 228 | 119 | 24 | 13 | 22 | 64 |
| C (emu K mol−1) | 1.382 | 1.198 | 0.983 | 1.021 | 0.811 | 0.753 | 0.805 | 0.867 | 0.961 |
| μeff (μB) | 3.325 | 3.095 | 2.804 | 2.857 | 2.547 | 2.453 | 2.537 | 2.633 | 2.772 |
| Spin quantum number, s | 1.24 | 1.13 | 0.99 | 1.01 | 0.87 | 0.82 | 0.86 | 0.91 | 0.97 |
| LS Fe3+ (s = 0.5) (%) | 21.4 | 27.8 | 37.1 | 29.7 | 38.2 | 38.5 | 29.6 | 22.7 | 12.5 |
| IS Fe3+ (s = 1.5) (%) | 68.6 | 53.0 | 34.9 | 32.5 | 11.8 | 3.5 | 2.2 | 4.3 | 7.1 |
| LS Fe4+ (s = 1.0) (%) | 10.0 | 19.2 | 28.0 | 37.8 | 50.0 | 58.0 | 68.2 | 73.0 | 80.4 |
| S∞ (μV K−1) | 133.23 | 80.34 | 58.48 | 15.52 | 6.72 | −2.73 | −39.25 | −69.80 | −130.15 |
| L0 (V2 K−2) | 1.67 × 10⁻⁸ | 2.15 × 10⁻⁸ | 1.99 × 10⁻⁸ | 2.33 × 10⁻⁸ | 2.43 × 10⁻⁸ | 2.44 × 10⁻⁸ | 2.43 × 10⁻⁸ | 2.42 × 10⁻⁸ | 2.43 × 10⁻⁸ |
Because the Seebeck coefficient at the high-temperature limit is estimated based on Eq. (1), S∞ in the mixed-valence state of (IS Fe3+ 1−y LS Fe3+ y )1−(x−2δ) LS Fe4+ x−2δ is expressed as
As shown in Table II, S∞ is estimated to be 133 μV K−1 from Eq. (3) for Nd0.9Sr0.1FeO3.00(3) (y = 0.238 and δ = 0.0). However, S∞ is estimated to be 130 μV K−1 for Nd0.1Sr0.9FeO2.952(3) (y = 0.636 and δ = 0.048). Therefore, as shown in Fig. 7, S∞ is expected to change from positive (p-type) to negative (n-type) with increasing x for calculation purposes. However, the oxygen-deficiency-induced changes in the electrical resistivity and Seebeck coefficient were confirmed at temperatures above 500 K in the samples with 0.6 ≤ x ≤ 0.9. As shown in Fig. 6(c) and Table III, the results of (χ − χ0)−1 for Nd1−x Srx FeO3−δ (0.6 ≤ x ≤ 0.9) samples after high-temperature measurement show a substantial decrease in the ratio of LS Fe4+ and an increase in the ratio of LS Fe3+ and IS Fe3+. This strongly suggests that Fe4+ is reduced to Fe3+ by the formation of an oxygen deficiency. Although the magnitude of the effective magnetic moment μeff has not substantially changed, the ratios of LS Fe3+, IS Fe3+, and LS Fe4+ have changed, resulting in S∞ showing a positive (p-type) value, as represented by the open squares in Fig. 7.
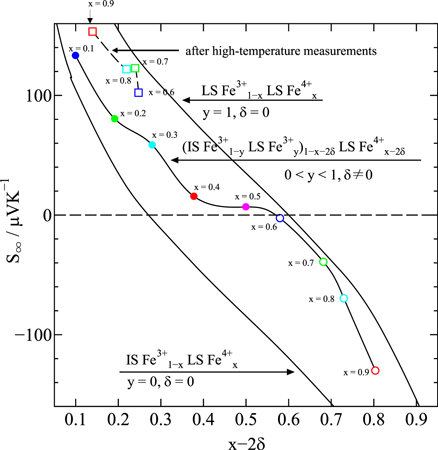
Fig. 7. Seebeck coefficient in the high-temperature limit, S∞ , for Nd1−x Srx FeO3−δ (0.1 ≤ x ≤ 0.9), where two solid curves, five solid circles , four open circles, and four open squares represent the relationship in Eq. (3).
Download figure:
Standard image High-resolution imageTable III. Temperature-independent magnetic susceptibility χ0, paramagnetic Curie temperature Θ, Curie constant C, effective magnetic moment μeff, spin quantum number s, ionic ratio for Fe ions, Seebeck coefficient at the high-temperature limit S∞ obtained from Eq. (3), and Lorentz number L0 for Nd1−x Srx FeO3−δ (0.6 ≤ x ≤ 0.9) after high-temperature measurement.
| Samples | Nd1−x Srx FeO3−δ | |||
|---|---|---|---|---|
| Composition, x | 0.6 | 0.7 | 0.8 | 0.9 |
| δ | 0.176 | 0.231 | 0.29 | 0.38 |
| χ0 (emu mol−1) | 0.001 22 | 0.001 07 | 0.000 97 | 0.000 89 |
| Θ(K) | 23 | 9 | 16 | 52 |
| C (emu K mol−1) | 0.724 | 0.589 | 0.663 | 0.780 |
| μeff (μB) | 2.406 | 2.169 | 2.302 | 2.497 |
| spin quantum number, s | 0.80 | 0.69 | 0.75 | 0.84 |
| LS Fe3+ (s = 0.5) (%) | 57.3 | 68.6 | 63.4 | 58.5 |
| IS Fe3+ (s = 1.5) (%) | 17.9 | 7.4 | 14.6 | 27.5 |
| LS Fe4+ (s = 1.0) (%) | 24.8 | 24.0 | 22.0 | 14.0 |
| S∞ (μV K−1) | 102.12 | 122.57 | 121.71 | 153.20 |
| L0 (V2 K−2) | 1.74 × 10⁻⁸ | 2.36 × 10⁻⁸ | 2.02 × 10⁻⁸ | 2.25 × 10⁻⁸ |
Figure 8 shows the temperature dependence of the electrical resistivity ρ for Nd1−x Srx FeO3−δ (0.1 ≤ x ≤ 0.9) samples in the temperature range from 80 to 800 K. All the samples show semiconducting behavior over the entire temperature range, and ρ tends to decrease as x increases. In particular, ρ tends to decrease with increasing x until the composition Nd0.5Sr0.5FeO3.00(2) is reached; Nd0.4Sr0.6FeO2.99(1) shows an increasing trend, and Nd0.3Sr0.7FeO2.991(9), Nd0.2Sr0.8FeO2.965(5), and Nd0.1Sr0.9FeO2.952(3) show a decreasing tendency again with increasing x. However, oxygen deficiencies formed in Nd0.4Sr0.6FeO2.99(1), Nd0.3Sr0.7FeO2.991(9), Nd0.2Sr0.8FeO2.965(5), and Nd0.1Sr0.9FeO2.952(3) in the temperature range 500–600 K; their compositions therefore changed to Nd0.4Sr0.6FeO2.824(2), Nd0.3Sr0.7FeO2.769(6), Nd0.2Sr0.8FeO2.71(1), and Nd0.1Sr0.9FeO2.62(1;/), respectively. As a result, the electrical resistivity ρ increased by double digits and showed an irreversible temperature dependence because of the change of carriers from t2g electrons in LS Fe3+ or eg electrons in IS Fe3+ to t2g holes or eg holes in LS Fe4+ (Fig. 8).
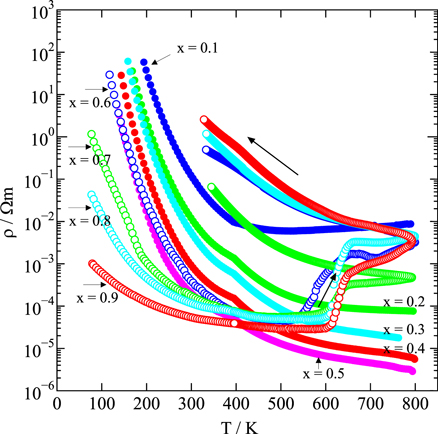
Fig. 8. Temperature dependence of electric resistivity, ρ, for Nd1−x Srx FeO3−δ (0.1 ≤ x ≤ 0.9).
Download figure:
Standard image High-resolution imageFigure 9 shows the temperature dependence of S for Nd1−x Srx FeO3−δ (0.1 ≤ x ≤ 0.9) samples in the temperature range 170–800 K. p-type thermoelectric properties are observed for samples with x ≤ 0.5, where ∣ S ∣ decreases with increasing x. However, n-type thermoelectric properties are observed for samples with x ≥ 0.6, where ∣ S ∣ increases slightly with increasing x. By comparison with the x dependence of S∞ calculated from Eq. (3), both Figs. 7 and 9 show that the thermoelectric characteristics change from p-type to n-type at x = 0.6 with increasing x. However, the results for Nd0.4Sr0.6FeO2.99(1), Nd0.3Sr0.7FeO2.991(9), Nd0.2Sr0.8FeO2.965(5), and Nd0.1Sr0.9FeO2.952(3) show that Fe4+ is reduced to Fe3+ in the temperature range 500–600 K. Thus, the Seebeck coefficient S changes from negative (n-type) to positive (p-type) at temperatures greater than 600 K. As shown in Fig. 9, the Seebeck coefficient S for 0.6 ≤ x ≤ 0.9 shows an irreversible temperature dependence and does not return to negative values (n-type) with decreasing temperature.

Fig. 9. Temperature dependence of the Seebeck coefficient, S, for Nd1−x Srx FeO3−δ (0.1 ≤ x ≤ 0.9).
Download figure:
Standard image High-resolution imageFigure 10 shows the temperature dependence of the total thermal conductivity κ (=κL + κe) and the carrier thermal conductivity κe for Nd1−x Srx FeO3−δ (0.1 ≤ x ≤ 0.9) samples in the temperature range 250–850 K, where κL is the lattice thermal conductivity and κe is calculated using the Wiedemann–Franz law (κe = L0 σT). The Lorentz number L0 is defined as 64):

by assuming acoustic phonon scattering, where EF is the Fermi energy,  and the function
  is given by

where  The Seebeck coefficient S can be defined as
thus, η is determined by fitting the experimental value of S at RT. The L0 values calculated based on Eq. (4) are summarized in Tables II and III. As shown in Fig. 10, κe increases monotonically with increasing temperature; however, the ratio of κe to κ is relatively tiny compared with that of κL to κ. In particular, the oxygen deficiency is believed to have reduced LS Fe4+ to IS Fe3+ or LS Fe3+ for samples with x > 0.6, changing the conduction carriers from electrons to holes, and then increasing the resistivity with increasing temperature. κe of samples with x > 0.6 falls between 550 and 600 K due to the increase in the resistivity. Therefore, κ of the samples with x > 0.6 is expected to change to a decreasing trend above 550 K. However, for all the samples, κL plays a more critical role than κe, i.e. κ is mainly dominated by κL so that the value of κ remains relatively small for all the samples (κ ≤ 2.5 Wm−1 K−1) over the whole temperature range.
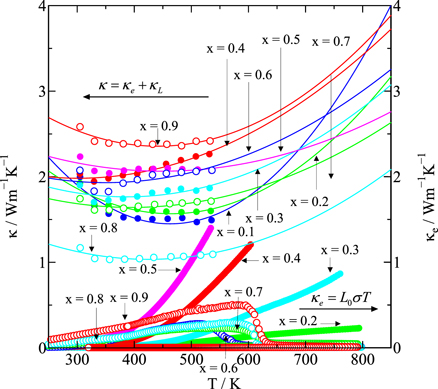
Fig. 10. Temperature dependence of the total thermal conductivity, κ = κL + κe (left axis), and the temperature dependence of the carrier thermal conductivity according to the Wiedemann–Franz law, κe = L0 σT (right axis), at temperatures greater than RT for Nd1−x Srx FeO3−δ (0.1 ≤ x ≤ 0.9).
Download figure:
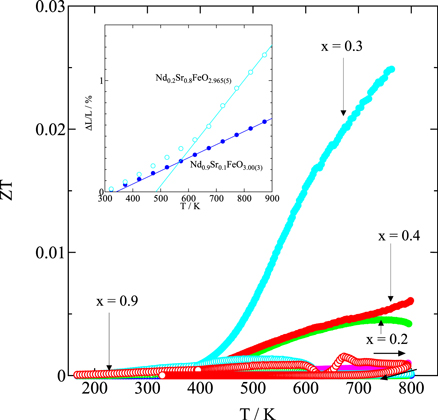
Standard image High-resolution imageFigure 11 shows the temperature dependence of the dimensionless figure of merit ZT = S2 σTκ−1 for Nd1−x Srx FeO3−δ (0.1 ≤ x ≤ 0.9) samples in the temperature range 170–800 K. In particular, Nd0.7Sr0.3FeO2.99(1) shows the highest p-type ZT value (i.e. ZT = 0.025 at 765 K). Nd0.8Sr0.2FeO2.996(4) and Nd0.6Sr0.4FeO2.989(8) also exhibit p-type ZT values (i.e. ZT = 0.004 at 800 K and ZT = 0.006 at 800 K, respectively). By contrast, Nd0.4Sr0.6FeO2.99(1), Nd0.3Sr0.7FeO2.991(9), Nd0.2Sr0.8FeO2.965(5), and Nd0.1Sr0.9FeO2.952(3) show a reduction of Fe4+ to Fe3+ in the temperature range 500–600 K, and the electrical resistivity ρ increases by double digits. In addition, because S changes from n-type to p-type at temperatures above ∼600 K, Fe oxide compositions showing high n-type ZT values could not be identified. As shown in the inset of Fig. 11, the coefficients of linear thermal expansion at T ≥ 600 K for Nd0.9Sr0.1FeO3.00(3) and Nd0.2Sr0.8FeO2.965(5) are 11.8 × 10⁻⁶ K−1 and 28.9 × 10⁻⁶ K−1, respectively. These results strongly suggest that Nd0.2Sr0.8FeO2.965(5) exhibits an increased linear thermal expansion coefficient because of the formation of oxygen deficiencies in the temperature range of 500–600 K, even under air. Therefore, fabricating a thermoelectric module that operates at high temperatures with pn elements requires the development of additional perovskite-type Fe oxides that exhibit similar linear thermal expansion coefficients and thermoelectric properties without forming oxygen deficiencies in the temperature range of 500–600 K.
Fig. 11. Temperature dependence of the dimensionless figure of merit, ZT, for Nd1−x Srx FeO3−δ (0.1 ≤ x ≤ 0.9); the insets show the temperature dependence of the coefficients of linear thermal expansion for Nd0.9Sr0.1FeO3.00(3) and Nd0.2Sr0.8FeO2.965(5).
Download figure:
Standard image High-resolution image
4. Conclusions
The present study prepared polycrystalline Nd1−x Srx FeO3−δ (0.1 ≤ x ≤ 0.9) samples using a conventional solid-state reaction method. All the samples exhibited a typical single-phase perovskite structure. At 500 K and RT, the crystal structure corresponded to the monoclinic phase (P21/m) for x = 0.1 and 0.2, and the orthorhombic phase (Pnma) for x ≥ 0.3. At low temperatures (10 K ≤ T ≤ 15 K), the monoclinic phase (P21/m) for x = 0.1 and 0.2, the orthorhombic phase (Pnma) for x = 0.3 and 0.4, and the monoclinic phase (C2/c) for x ≥ 0.5 were identified. With increasing x, the Goldschmidt tolerance factor increases from 0.93 (x = 0.1) to 1.00 (x = 0.9) and the Fe–O–Fe angle also increases, reaching approximately 170°–180° at x ≥ 0.8. These results strongly suggest that the strain in the FeO6 oxygen octahedron tends to be relaxed with increasing x. However, the magnetic structure shows G-type antiferromagnetism with small ferromagnetic order in the c-axis direction for x ≤ 0.3 and the a- or b-axis direction for 0.4 ≤ x ≤ 0.8 at room or low temperature. Assuming that the Fe site is in the mixed-valence state of (IS Fe3+ 1−y LS Fe3+ y )1−x−2δ LS Fe4+ x−2δ , the spin state of Fe changes from the LS or IS Fe3+-dominant state at x ≤ 0.5 to the LS Fe4+-dominant state at x ≥ 0.6. This change suggests that the charge carriers change from t2g or eg holes in LS Fe4+ at x ≤ 0.5 (p-type) to t2g electrons in LS Fe3+ or eg electrons in IS Fe3+ at x ≥ 0.6 (n-type). In fact, at temperatures below 500 K, these samples show a p-type Seebeck coefficient when 0.1 ≤ x ≤ 0.5 and an n-type Seebeck coefficient when 0.6 ≤ x ≤ 0.9. However, for the 0.6 ≤ x ≤ 0.9 samples, Fe4+ is reduced to Fe3+ because of oxygen deficiencies in the 500 to 600 K temperature range. The Seebeck coefficient for 0.6 ≤ x ≤ 0.9 changes from negative (n-type) to positive (p-type) at temperatures greater than 600 K, and the electrical resistivity increases by two orders of magnitude and shows an irreversible temperature dependence. By contrast, the thermal conductivity remains relatively small, at 2.5 Wm−1 K−1 or less for all the samples. As a result, Nd0.7Sr0.3FeO2.99(1) showed the highest p-type ZT value (i.e. ZT = 0.025 at 765 K), although Fe oxide compositions with high n-type ZT values could not be identified. In addition, the coefficients of linear thermal expansion at T ≥ 600 K for Nd0.9Sr0.1FeO3.00(3) and Nd0.2Sr0.8FeO2.965(5) are 11.8 × 10⁻⁶ K−1 and 28.9 × 10⁻⁶ K−1, respectively. These results strongly suggest that the coefficient of linear thermal expansion for Nd0.2Sr0.8FeO2.965(5) increased because of oxygen deficiency in the temperature range of 500–600 K, even under air. Therefore, the fabrication of a thermoelectric module that operates at high temperatures with pn elements composed of perovskite-type Fe oxides will require the further development of perovskite-type Fe oxide compositions that exhibit similar linear thermal expansion coefficients and show p-type and n-type thermoelectric properties without becoming oxygen deficient in the temperature range 500–600 K.
Acknowledgments
This work was partly supported by a Grant-in-Aid for Scientific Research (19K04986). In addition, the magnetization measurement experiment below RT was carried out using the S700X-R equipment of the Yokohama National University Instrumental Analysis and Evaluation Center. The magnetization measurement experiments above RT were carried out using the MPMS equipment in the electromagnetic measurement room as a joint use of the University of Tokyo Physical Institute Laboratory. The PND measurements at 500 K, room, and low temperatures were carried out using the MEREDIT at the Nuclear Physics Institute, reactor LVR-15, Czech Republic.