

Abstract
Repetitive melting of tungsten by power transients originating from edge localized modes (ELMs) has been studied in the tokamak experiment ASDEX Upgrade. Tungsten samples were exposed to H-mode discharges at the outer divertor target plate using the Divertor Manipulator II system. The exposed sample was designed with an elevated sloped surface inclined against the incident magnetic field to increase the projected parallel power flux to a level were transient melting by ELMs would occur. Sample exposure was controlled by moving the outer strike point to the sample location. As extension to previous melt studies in the new experiment both the current flow from the sample to vessel potential and the local surface temperature were measured with sufficient time resolution to resolve individual ELMs. The experiment provided for the first time a direct link of current flow and surface temperature during transient ELM events. This allows to further constrain the MEMOS melt motion code predictions and to improve the validation of its underlying model assumptions. Post exposure ex situ analysis of the retrieved samples confirms the decreased melt motion observed at shallower magnetic field line to surface angles compared to that at leading edges exposed to the parallel power flux.
Export citation and abstract BibTeX RIS
Corrections were made to this article on 28 November 2017. Copyright line was updated.
1. Introduction
The use of tungsten as material for the divertor target plates of large scale nuclear fusion devices such as the International Thermonuclear Experimental Reactor (ITER) introduces the risk of melt damage by excessive heat loads. Even with optimized surface shaping to prevent exposure of leading edges to the full parallel power flux, edge localized modes (ELMs) in ITER-sized devices could still deliver sufficient energy to the divertor plates to cause transient local melting [1]. A tungsten surface exposed to an incident heat pulse with power density q⊥ and a duration time ttrans will melt if the corresponding heat flux factor, FHF = q⊥ is larger than 50 MJ m−2 s–1/2 [2]. Extrapolation from current devices to ITER shows that uncontrolled ELMs can exceed the threshold value even for standard operation scenarios [3, 4]. This can occur repeatedly over a succession of subsequent ELMs with corresponding progression of surface damage. During each melt event, molten tungsten may be redistributed by electro-magnetic, hydrodynamic and gravitational forces acting on the fluid phase. The relocation of molten material leads to increasing surface corrugation which degrades in turn the power handling capability of the affected target plate. Moreover, there are risks to plasma operation by released melt droplets during the melt event as well as by potential spallation of larger masses of re-solidified material piled up in regions of low power flux exposure. The potentially severe consequences of melt events for ITER operation have motivated detailed investigations using both predictive computer simulations and experiments at current tokamak devices.
The main tool for modelling of melt motion at metallic plasma facing components is the 3D MEMOS (Melt Motion at Surfaces) code described in [5, 6]. To validate the MEMOS code model for tokamak conditions, simulations of tungsten melting and resulting melt motion were compared to experiments in TEXTOR [7, 8] on sustained melting and experiments in JET and ASDEX Upgrade on transient melting at special target tiles equipped with a leading edge [9–13]. In all cases the main driving force for melt motion was identified as the j × B force originating from thermionic electron emission at the hot surface. The thermionic emission drives a so-called replacement current flowing from plasma to vessel ground through the plasma facing component with its liquid surface, which by interaction with the plasma confining magnetic field creates the j × B force acting on the melt. However, whereas during sustained melting over a timescale of seconds the melt zone can extend to mm depths, transient melting occurs on a time scale of milliseconds leading to a typical melt layer thickness in the 10–100 μm range and rapid re-solidification on a similar time scale [6]. This was reproduced by MEMOS simulations of the JET leading edge transient melt experiment which showed lateral melt transport occuring in incremental steps during repeated transients [10]. The code used as input the ELM resolved parallel power flux along the JET leading edge lamella as function of time, which was derived from infrared (IR) thermography measurements. From that the incident surface power flux and the resulting temperature evolution of the exposed sample were computed. The surface temperature was in turn used to compute the local thermionic emission current density and from that the resulting electromotive force acting on the melt layer [14]. The main observables to be matched against the simulations were the measured lamella surface temperature and the final morphology of melt zone and of re-solidified melt debris. Direct validation of the thermionic emission model used in MEMOS was, however, not possible because in JET the melt sample was part of the target plate structure so that the replacement current through the sample could not be directly measured. This leaves significant uncertainties resulting from the range of published data for the tungsten work function and from assumptions on the possible attenuation of the emission current by space charge effects and locally returning electrons [1, 15]. To overcome this limitation, a corresponding experiment was carried out in ASDEX Upgrade with samples designed to allow direct measurement of the thermionic emission current [12]. The replacement current flowing through the samples as result of thermionic emission and other effects, such as secondary electron emission and local gyro-orbit effects, could be measured during transient melting. First MEMOS simulations [13] already match for the sample geometry with a leading edge the measured current evolution although there are still a number of uncertainties owing in particular to the fact that in the experiments the surface temperature could not be directly measured but had to be computed in the MEMOS simulations from the parallel power flux, which was measured by the ASDEX Upgrade thermography diagnostic at another toroidal location [16]. To overcome this deficiency a follow-up experiment was executed after installation of a new IR camera viewing the exposed melt samples. Main objective of the experiment was to provide a direct correlation of measured replacement current and surface temperature distribution.
2. Experimental set up
2.1. Sample arrangement and instrumentation
Experiments, which involve deliberate melting of plasma facing components, are hampered by the requirement that the damaged components must not interfere with subsequent plasma operation. To avoid this, in JET the special lamella samples were installed at the innermost ring of the segmented bulk tungsten divertor plate, which is generally not used in standard plasma configurations. In the ASDEX Upgrade experiment melt samples can instead be exposed using its Divertor Manipulator II system [17] for a dedicated experimental session and retrieved immediately after the experiment for ex situ materials analysis. The divertor manipulator allows exposing two adjacent standard sized target tiles at the outer target plate as shown in figure 1. Probe exchange is possible by retracting the entire tile assembly mounted on the manipulator arm behind the vessel port valve. With closed valve the system can then be vented without breaking the vessel vacuum. Because of the time required to pump down the external volume, sample exchange is only possible in between experiment days.

Figure 1. Poloidal cross-section of ASDEX Upgrade vessel with divertor manipulator II structure and flux surfaces of reference H-mode discharge configuration used in the experiment with the outer strike point at the position just before sample exposure.
Download figure:
Standard image High-resolution imageBy default the manipulator is equipped with two standard bulk tungsten target tiles. For the melt experiment these were replaced by instrumented tiles (see figure 2) designed with electrically insulated holding fixtures for small bulk tungsten sample inserts with a thickness of 9 mm and a plasma facing surface area of 9 mm in toroidal and 39 mm in poloidal direction (figure 2). The samples are connected to shunt resistors on air side with a resistance of 0.1 Ω to measure the current flowing to vessel potential from the corresponding voltage drop. In addition each sample is equipped with a type-K mantle thermo couple pressed to the sample's rear side by a coil spring. The thermo voltage was recorded over a time interval of 240 s during and after discharges for calorimetric quantification of the total energy input to the sample, which will provide an additional constraint for the planned MEMOS simulations of the experiment. The outer jacket of the thermo-couples was also electrically insulated to not interfere with the sample current measurement.
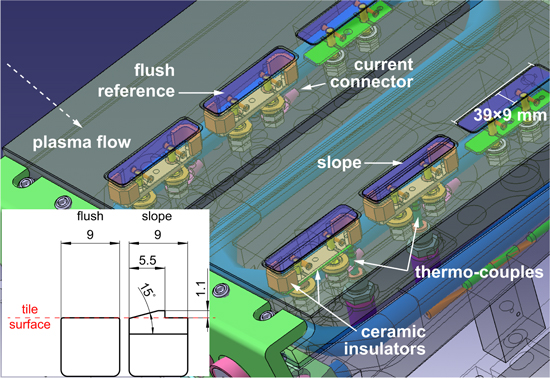
Figure 2. CAD view of the two instrumented tiles mounted on the DIM-II probe head with installed samples, ceramic insulation, electrical contact points and mantle thermo couples. The inset shows the toroidal cross-section of the sloped melt sample and the flush mounted reference sample.
Download figure:
Standard image High-resolution imageFor the experiment presented here, the melt sample geometry was chosen with an exposure area sloped against the target tile surface at an angle of 15° with a maximum elevation of 1.1 mm above the divertor tile surface (see inset in figure 2). The samples were installed in the second slot from the lower tile edge, which is closest to the typical position of the outer strike point (OSP) for standard ASDEX Upgrade plasma operation scenarios. For the typical magnetic field line geometry at the outer divertor plate, this results in an approximately factor of 6 increase of the local surface power load compared to the divertor tile surface. The elevated melt sample was installed in the right-hand tile of the probe head (seen from plasma side) and a flat sample was installed flush to the tile surface at the left hand side as reference for the replacement current measurements.
For observation of the divertor manipulator tile surface an image guide has been installed with an objective mounted behind two customized tiles at the lowest tile row of the inner heat shield of ASDEX Upgrade. Figure 1 shows the geometry of the corresponding camera viewing cone. The image guide extends to a flange window with a camera mount for observing the exit window of the image guide from air side. As the image guide is made of glass fibre strands, IR transmission is restricted to the near-IR range with a cut-off at 2 μm. Therefore, standard thermography cameras operating around 5 μm cannot be used for this view. Instead a dedicated near-IR camera system of type SCD Cardinal is used, which has a detector sensitive in the wavelength range of 0.9–1.7 μm [18]. To prevent saturation of the camera by the expected intense IR emission and to facilitate absolute calibration, an additional interference filter was used with a narrow transmission window around 1.6 μm.
2.2. Discharge scenario
To achieve repetitive transient tungsten melting by ELMs one needs sufficient exposure time to pre-heat the samples to a suitable base temperature. In between ELMs the surface temperature must be sufficiently close to the melting temperature of tungsten at 3695 K that melting will occur by the additional temperature excursion due to the transient ELM power load. At the same time the average power input to the samples in the exposure time interval must be low enough to avoid sustained bulk melting. Therefore, the optimal conditions will be met by an H-mode discharge tailored for maximal type-I ELM parallel power flux (≈1 GW m−2) and low ELM frequency. However, for the melt experiment an additional boundary condition is the stability of the plasma configuration against sweeps of the OSP because these are required to control the plasma exposure of the melt samples. Taking into account these conditions, the melt experiment was performed using H-mode discharges in deuterium with a plasma current of Ip = 0.8 MA, a toroidal field of Bt = −2.5 T, i.e. q95 = 4.6 and a heating power of 5 MW by neutral beam injection (NBI) and 2 MW by electron cyclotron resonance heating (ECRH). With a pedestal top pressure of 5.5–6 kPa one expects from the ASDEX Upgrade ELM scaling [19] a typical ELM energy density of ε∣∣ = 0.8 MJ m−2, which will initiate transient melting once the inter-ELM base temperature is sufficiently high. The ELM frequency was on average 70 Hz, corresponding to 14 ms cool down time after each ELM. With typical re-solidification times in the range of a few ms [10], this provides a time window where the surface is only subject to transient melting and solid in the inter-ELM phases.
Figure 3(a) shows time traces of plasma current, line averaged density and auxiliary heating power by NBI and ECRH at 140 GHz. The position of the OSP is shown in figure 3(b). Once the divertor configuration was established, the OSP was rapidly moved above the sample position. In the plasma flat-top phase exposure was initiated by positioning the OSP onto the sample for a pre-selected time interval.

Figure 3. H-mode discharge scenario used for the melt exposures. The time traces are for discharge #33 948 and show in (a) plasma current, Ip, line averaged density, ne, and auxiliary heating powers, PNBI and PECRH of NBI and ECRH systems respectively. The time trace in (b) shows the position of the outer strike point with the y-axis extending over the poloidal s-coordinate range of the outer target plate. The shaded interval represents the position of the exposed samples.
Download figure:
Standard image High-resolution image3. Results
3.1. Post-exposure melt pattern
The first exposure extended over a time of 0.6 s, which was in subsequent discharges increased to 1.2, 2.0, 3.0 s and in the final exposure to 3.4 s. After each discharge the manipulator probe head was retracted to the illuminated sample exchange air lock chamber where the probe head surface was inspected visually using a CCD video camera. As can be seen in figure 4(a), the sample surface appeared still pristine after 3 s exposure in discharge 33 948. After the last exposure over 3.4 s in discharge 33 950 a melt zone had formed at the position of highest power load (figure 4(b)). By comparing the time evolution of both exposures one can therefore already narrow down the possible melt time to the final 0.4 s time interval in the last exposure.
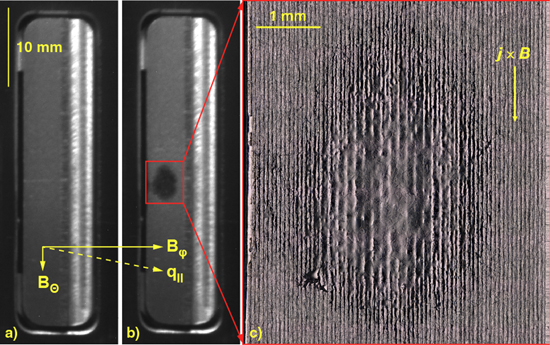
Figure 4. Inspection camera views of the sloped melt sample after discharge 33 948 (a) and the final discharge 33 950 (b). A magnified view of the melt area after discharge 33 950 is shown in (c).
Download figure:
Standard image High-resolution imageAfter the last exposure the sample was retrieved for ex situ analysis. Optical microscopy revealed a melt zone with a diameter of ≈2 mm as shown in figure 4(c). The morphology suggests that the melt layer had a depth of at most 65 μm, which is the width of the surface machining grooves visible in the magnified photo. One can see that except for the very centre the elevated ridges of the machining grooves are still visible with the melt filling the grooves only partly. Compared to the previous ASDEX Upgrade transient melt experiment [12] the post-exposure melt pattern shows much weaker directed melt motion, which can be explained by the fact that the melt events occurred only in the final 0.4 s time interval of the experiment corresponding to at most 25–30 ELM transients. The magnified view shows still unmolten elevated ridges in the periphery of the melt zone with melt filling the grooves in between. Furthermore melt was spreading along the machining grooves in both poloidal directions. This indicates that the melt motion was to some extent driven by surface capillary forces. While capillary forces are only expected for the special case of machined surfaces a similar mechanism would also be expected for smooth surfaces, in that case due to surface wetting. The melt pattern suggests that both mechanisms need to be taken into account in addition to the electromotive forces for the modelling of melt motion with surface wetting already implemented in the MEMOS code.
3.2. Melt sample surface temperature and replacement current
The SCD Cardinal camera used for local thermography provides in full frame operation a frame rate of 300 Hz. This is not sufficient to resolve the temperature time evolution on the typical millisecond time scale of individual ELM transients. To overcome this limitation the camera was operated with a smaller region of interest (ROI) of 128 × 128 pixels to reduce the CCD read out time. In the ROI acquisition mode the frame rate could be increased to 1 kHz.
Figures 5(a) and (b) shows examples of the temperature distribution at the local area of the melt sample from discharge 33 948 for an ELM peak (a) and 8 ms later in the subsequent inter-ELM phase (b). One can clearly see the localized maximum of the temperature, which reflects the profile of the incident power flux. In toroidal direction the temperature is decreasing towards the flat area at the top of the slope because the projected power flux is by a factor ≈6 smaller due to the smaller field line to surface incidence angle and further due to the adjacent shadowed surface part, which receives no power flux at all. The frames are chosen from close to the end of the exposure interval and one can see that the temperature maximum in the ELM peak was already getting close to the tungsten melt temperature of 3695 K whereas the inter-ELM peak temperature was still about 400 K lower. This is highlighted by figure 5(c), which shows the distribution of the temperature excursion between ELM peak and inter-ELM frames in (a) and (b) together with a transparent overlay of the post-exposure sample surface. The overlay is perfectly matching the position of maximal transient temperature excursions. Moreover one can clearly see the much lower temperature excursion at the flat area adjacent to the upper edge of the slope due to the reduced power flux and the on that time scale constant temperature of the shadowed part of the sample. The temperature excursion visible in the gap between the upstream sample edge at x = 0 and the surrounding tile edge at x = −0.5 mm, which is also extending to the adjacent tile surface area, can be attributed to imperfect shadowing of the upstream edge, which lead also to slight melting of the sample edge as can be seen in the magnified view of figure 4(c).
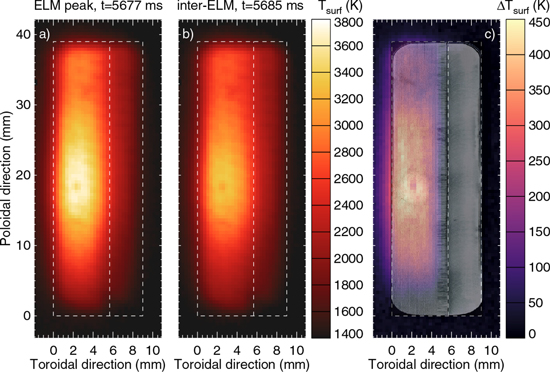
Figure 5. Lateral distribution of surface temperature across the melt sample surface at an ELM peak (a) and in the subsequent inter-ELM phase (b). The temperature was computed from the light emission intensity recorded by the IR camera. The right image (c) shows an overlay of the post-exposure melt sample over the temperature difference between the two temperature images in (a) and (b). The dashed white lines denote the sample outer contour and the separation between elevated surface feature and the shadowed part flush to tile surface.
Download figure:
Standard image High-resolution imageUnfortunately the IR camera suffered from a technical failure right before the onset of melting in the final exposure so that the actual transition to a transiently molten surface could not be studied in the IR emission. Still, the measured spatial and temporal evolution of the surface temperature in the preceding discharge provides the necessary data to compute the thermionic emission current according to the Richardson–Dushman equation and compare the model prediction to the simultaneously measured replacement current flowing through the sample. The replacement current includes a fraction originating from the thermo-electric current flowing between inner and outer target plate because of the generally lower plasma temperature at the inner target [20]. Its value was obtained from the current measured at the flush reference sample at the same position in the left divertor manipulator tile, taking also into account the ratio of effective plasma wetted area of both sample geometries. The time evolution of the resulting net current through the melt sample for the last two discharges is shown in figure 6(a). The overlay of the time traces from both discharges demonstrates the very good reproducibility of exposure conditions. Right from the point where the OSP is moved onto the sample area, as indicated in figure 6(c), one finds a net replacement current signal with pronounced ELM transients of approximately constant peak values and a small, also approximately constant, inter-ELM value. From about 4.9 s both the inter-ELM current value and the ELM peaks start to increase linearly until the OSP is moved away from the sample location at the end of the exposure time interval. The increase of the inter-ELM current level shows that despite rising surface temperature the replacement current reverts to almost zero over short transient phases of ≈4 ms. This is attributed to suppression of electron emission from the sample surface by temporary detachment at the outer target plate, which is caused by the dense neutral recycling cloud following the ELM ion flux excursion [21]. Once detachment subsides, the replacement current reverts to its actual inter-ELM value.
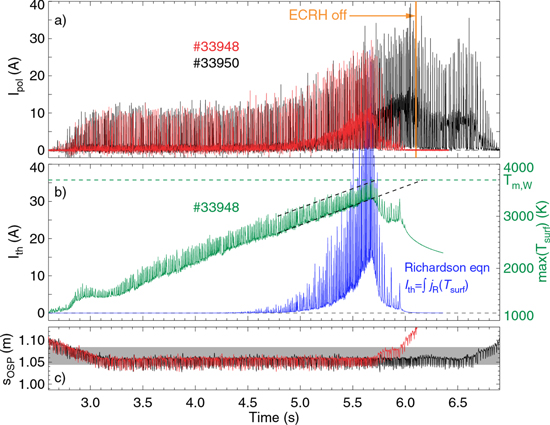
Figure 6. (a) Time traces of measured net replacement current through the sloped melt sample in the exposure phase of discharges 33 948 (red) and 33 950 (black). (b) Time evolution of maximum sample surface temperature (green) and thermionic emission current derived by integrating the Richardson–Dushman equation as function of local surface temperature over the sample area (blue). (c) Time traces of OSP during melt exposures in discharges 33 948 (red) and 33 950 (black). The shaded area denotes the position and extent of the melt sample along the poloidal divertor contour coordinate.
Download figure:
Standard image High-resolution image
The maximum surface temperature recorded in discharge 33 948 is shown in figure 6(b). One can see that in contrast to the replacement current the sample surface temperature increases approximately linearly over the entire time interval where the OSP resided stationary at the same position on the sample. In that time interval also the temperature excursions due to the ELMs remain at a constant level with small variations in line with corresponding variations of ELM power transients. For the last 0.4 s of the longest exposure in discharge 33 950 the dashed lines indicate the extrapolated evolution according to the IR measurements in the preceding exposure before the camera malfunction. One can see that the ELM transients are expected to exceed tungsten melt temperature shortly after the time point where the exposure was terminated in the second last discharge. Moreover, the extrapolation of the inter-ELM maximal surface temperature shows that the onset of local sustained melting in between ELMs was avoided just by chance in the last discharge because the auxiliary ECRH heating power of 2 MW was terminated before that time point (figure 6(a)), which is also reflected in the replacement current of the last discharge. This shows that in order to reliably avoid sustained melting the experiments require local surface temperature measurements to adjust the exposure time window accordingly starting at values well below melt temperature would be reached. Figure 6(b) shows also the predicted thermionic emission current according to the Richardson–Dushman equation with the measured surface temperature distribution as input, similarly to the discussion in [13] where the surface temperature was taken from thermal modelling of the sample response to the incident power flux. Because the measured replacement current is the integral current through the sample, the thermionic emission current fraction was computed accordingly by integrating the Richardson current density as function of local surface temperature over the entire sample surface. The resulting time trace shows that the computed thermionic emission sets in at the same time where the measured replacement current begins to increase from its initial constant phase. Taking into account uncertainties in work function and Richardson constant for tungsten one finds a remarkable quantitative agreement with both inter-ELM and ELM transients of the measured replacement current. A closer look reveals, however, significant discrepancies. The initial constant level of the replacement current cannot be attributed to thermionic electron emission. This shows that other effects need to be considered, such as secondary electron emission due to the incident ion flux and gyro orbit effects leading to a larger effective current collection area of the samples for ions versus electrons in flux tubes just passing the top surface of the elevated sample. Both effects would lead to an additional net replacement current fraction independent of surface temperature. Further experiments are necessary to clarify if these additional current fractions are a universal feature, which needs to be taken into account for the melt motion modelling.
Apart from the temperature independent replacement current fraction another discrepancy between expected thermionic emission current fraction and measured replacement current is the predicted increase of the ELM-related current excursions due to the strong dependency of the Richardson current on temperature. This is not found to the predicted extent in the measured net current. A possible explanation for the observed approximately constant current excursions is the saturation of thermionic emission current predicted by PIC simulations due to formation of a virtual cathode in the near surface plasma at increasing current density [15]. As the effect is strongly increasing at lower magnetic field line to surface angles, one expects a higher saturation level for the sample geometry with a leading edge facing the full parallel plasma flux. This is supported by previous studies of sustained tungsten melting in TEXTOR where the replacement current through a melting tungsten limiter was compared to the Richardson current computed from measured surface temperatures [22]. Along the same line, the previous ASDEX Upgrade transient melt study [12] showed an ongoing increase of the ELM-related current excursions for the leading edge sample in contrast to the observations for the sloped sample.
4. Summary
The exposure of a dedicated tungsten melt sample in the outer divertor of ASDEX Upgrade with an elevated slope allowed increasing the ELM local power transients to an ITER relevant level. This allowed studying transient melting by ELMs to further validate the physics model implemented in the MEMOS code, which is the main predictive tool to assess the potential consequences of transient melting by temporary loss of ELM power load suppression during ITER operation. The experiment was intended as an extension of the previous first ASDEX Upgrade transient melting experiment to directly compare the measured replacement current expected from thermionic electron emission with the local surface temperature of the exposed sample. The newly installed near-IR thermography camera system provided strong evidence that the observed melt layer morphology was indeed a result of repetitive transient melting. Moreover, the measured surface temperature distribution on an ELM resolved time scale allowed to compute the expected thermionic emission current for direct comparison to the measured replacement current through the melt sample. The comparison showed on the one hand that the replacement current value and time evolution agree well on a general level at elevated surface temperatures. On the other hand, there are significant current contributions independent of surface temperature, which indicate additional processes driving an electron current out of the plasma exposed sample surface. Further experiments are required to clarify if these effects are merely a consequence of the different sample geometry, in particular due to the surface features elevated above the divertor tile surface. As the temperature independent current fraction is most significant below tungsten melt temperature, no significant influence on the melt motion over the contribution of the thermionic emission current is expected. Still, comparison with MEMOS simulations are required to assess if the observed melt motion patterns can be reproduced with thermionic emission induced j × B force as the only electromotive melt motion driver.
Acknowledgments
The authors would like to thank the engineering and technical team, particularly Messrs P Leitenstern and Ch Pfleger, for their support in preparing and running the experiment. This work has been carried out within the framework of the EUROfusion Consortium and has received funding from the Euratom research and training programme 2014–2018 under grant agreement No. 633053. The views and opinions expressed herein do not necessarily reflect those of the European Commission or of the ITER Organization.