Patterns and Failure Modes of Fractures Resulting From Forced Folding of Cohesive Caprocks – Comparison of 2D vs. 3D and Single-vs. Multi-Layered Analog Experiments
 Michael Warsitzka
 Nina Kukowski
 Franz May
- 1Institute of Geophysics of the Czech Academy of Sciences, Prague, Czech Republic
- 2Institute of Geosciences, Friedrich Schiller University Jena, Jena, Germany
- 3Federal Institute for Geosciences and Natural Resources, Hannover, Germany
Knowledge of the formation mechanisms and geometries of fracture systems in sedimentary rocks is crucial for understanding local and basin-scale fluid migration. Complex fracture networks can be caused by, for instance, forced folding of a competent sediment layer in response to magmatic sill intrusion, remobilisation of fluidized sand or fluid overpressure in underlying porous reservoir formations. The opening modes and geometries of the fractures mainly determine the bulk permeability and sealing capacity of the folded layer. In this study, we carried out laboratory analog experiments to better comprehend patterns and evolution of the fracture network during forced folding as well as differences of the fracture patterns between a 2D and 3D modelling approach and between a homogenous and a multi-layered cover. The experimental layering consisted of a lower reservoir layer and an upper cover, which was either a single high-cohesive layer or an alternation of low- and high-cohesive layers. The two configurations were tested in an apparatus allowing quasi-2D and 3D experiments. Streaming air from the base of the model and air injected through a needle valve was used to produce a regional and a local field of fluid overpressure in the layers. The experimental outcomes reveal that the evolution of the fracture network undergoes an initial phase characterized by the formation of a forced fold associated with dominantly compactive and tensile fractures. The second phase of the evolution is dominated by fracture breakthrough and overpressure release mainly along shear fractures. Structures observed in 2D cross sections can be related to their expressions on the surface of the 3D respective experiments. Furthermore, the experiments showed that the intrusion network is more complex and laterally extended in the case of a multi-layered cover. Our results can be instructive for detecting and predicting fracture patterns around shallow magmatic and sand intrusions as well as above underground fluid storage sites.
1 Introduction
The formation of forced folds associated with fracture systems and saucer-shaped intrusions can be caused by a variety of processes such as fluid overpressuring, intrusion of magma, or sand injection. These processes commonly occur in systems of an overpressured reservoir layer underneath a low-permeable and relatively competent caprock. Fluid overpressure and resulting fracturing in the reservoir can be provoked by for example undercompaction, generation of hydrocarbons, phase transformation of minerals, and fluid influx from a source underneath or from magmatic intrusions (e.g. Brooke et al., 1995; Huuse et al., 2005; Frey-Martnez et al., 2007; Mourgues et al., 2011). At excessive fluid overpressure, the caprock is often uplifted into a forced fold leading to fracturing at the crest and along the hinges of the fold (Cosgrove and Hillier, 2000; Shoulders and Cartwright, 2004; Frey-Martnez et al., 2007; Jackson et al., 2011; Mourgues et al., 2012; Haug et al., 2018; Warsitzka et al., 2019; Meng and Hodgetts, 2020). Depending mainly on the cohesion and the thickness of the cover, these fractures fail in a tensile, shear or hybrid tensile-shear mode (e.g. Muirhead et al., 2014; Wilson et al., 2016; Haug et al., 2018; Meng and Hodgetts, 2020).
An important process leading to forced folding is, for instance, the intrusion of magma, which can propagate horizontally in shallow-level, stratified sedimentary rocks and transitions into inclined dykes (Figure 1A) (Burchardt, 2008; Polteau et al., 2008; Galland et al., 2014; Magee et al., 2014; Magee et al., 2017b; Cruden et al., 2017; Montanari et al., 2017; Haug et al., 2018; Reeves et al., 2018; Schmiedel et al., 2019). Sill emplacement causes elastic bending of the overburden host rocks (Pollard and Johnson, 1973; Hansen and Cartwright, 2006; Polteau et al., 2008; Galland et al., 2018c). At the tips of the propagating sill, fractures open in different modes depending on the effective stress, the shape of the intrusion as well as thickness, rheology and stratification of the host rock (Thomson and Schofield, 2008; Haug et al., 2018). If the cover is relatively weak (low cohesion), mainly normal and reverse faults develop at the crest, whereas sub-vertical shear zones occur at the outer margins of the fold (Acocella et al., 2001; Haug et al., 2018). In contrast, if the cover is competent (high cohesion), inclined magma-intruded tensile fractures are typically induced at the tips of the sill (e.g. Haug et al., 2018; Schmiedel et al., 2019).
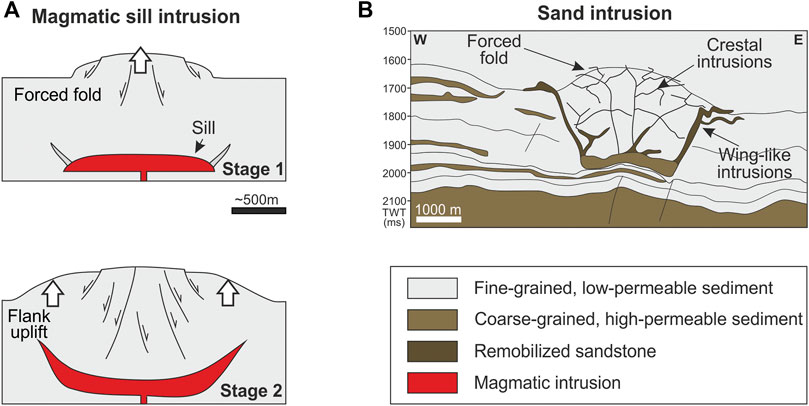
FIGURE 1. Examples of processes leading to forced folding and associated fracture patterns. (A) Two-stage evolution of overburden deformation patterns during a magmatic sill-to-inclined dyke transition of a shallow level magmatic intrusion (modified from Hansen and Cartwright, 2006). Stage 1: Formation of a forced fold associated with tensile fractures at the periphery of the sill. Stage 2: Sill intrusions into peripheral fractures. (B) Crestal fractures and wing-like intrusions above an isolated sand body, which is surrounded by low-permeable fine-grained sediments (modified from Huuse et al., 2007).
Another process for forced folding is the remobilization and injection of sand above isolated, overpressured parent sand layers, for instance sub-marine channels and fan deposits, surrounded by fine-grained sediments (e.g. Shoulders and Cartwright, 2004; Huuse et al., 2007; Jackson et al., 2011). Outcrop studies and high-resolution 3D seismic data reveal that large-scale (hundreds of meters) sand intrusions and their associated forced folds are often bounded by sand-filled, inclined wing fractures and a network of faults and fractures at their crests (Figure 1B) (Duranti and Hurst, 2004; Huuse et al., 2004; Briedis et al., 2007; Huuse et al., 2007; Cartwright et al., 2008; Szarawarska et al., 2010; Vigorito and Hurst, 2010; Jackson et al., 2011). The fracture network is often complex and variable in terms of orientation, aspect ratio and connectivity, which is attributed to different depths and rheological anisotropies in the overburden (e.g. Parize et al., 2007; Shoulders et al., 2007; Surlyk et al., 2007; Monnier et al., 2015).
Although the dynamics of these folding mechanisms as described above and physical properties of the fluids (density and viscosity of water, hydrocarbons and magma) are different, they share some similarities in the structural evolution and the basic physics of the fracture formation (Mandl, 2000). Nevertheless, fracture formation and their opening modes in cohesive, stratified sediments during uplift of forced folds are poorly understood. The conductivity of such fractures is mainly influenced by their opening mode so that it is important to evaluate patterns and strain partitioning in the fracture system. The aim of this study is to better elucidate the complexities and strain patterns of fracture networks emerging during forced folding of a high-cohesive overburden layer above an overpressured reservoir layer. In physical laboratory experiments, we built a simplified stratigraphy of a high-permeable, dry granulate layer representing the reservoir layer overlain by a cover consisting of a low-permeable, high-cohesive powder. Streaming air was used as the pore fluid equivalent injected into dry granular materials to provoke overpressure driven deformation of the cover layer.
In previous analog modelling studies using brittle granulates to simulate host rocks, 2D experimental (narrow) apparatuses have be applied to monitor fracture patterns and intrusion processes through glass side walls (e.g. Rodrigues et al., 2009; Mourgues et al., 2012; Warsitzka et al., 2019). However, the 3D variability cannot be examined in quasi-2D (Abdelmalak et al., 2012). Experiments conducted in a wider, three-dimensional box enabled observation of surface deformation patterns (Mathieu et al., 2008; Gressier et al., 2010; Galland, 2012; Guldstrand et al., 2017; Poppe et al., 2019; Schmiedel et al., 2019), whereas the internal structural development in the brittle layers cannot be observed. In 3D experiments using transparent gelatine as host rock analog, the propagation of sills and tensile fractures can be monitored (e.g. Kavanagh et al., 2017; Williams et al., 2022). However, gelatine is an elastic material, which is not able to fail by plastic shear, and is generally too cohesive to represent shallow brittle rocks (Mathieu et al., 2008). Thus, we used a fine-grained silica powder as cover layer material, which is able to fail by shear and tensile fracturing, and combined a 2D and a 3D experimental setup in order to examine deformation structures from different perspectives and to evaluate methodological differences between the two approaches.
3D experiments consisting of multiple layers of various granulates with different grain size, density, permeability and shear strength showed that intrusion systems and fracture networks are more complex and involve the development of forced folds, dykes and sills of various shapes (Rodrigues et al., 2009; Mourgues et al., 2012; Bureau et al., 2014; Montanari et al., 2017). Therefore, we compare fracture patterns during forced folding depending on one single, mechanically isotropic cover and a mechanically layered cover.
Our experimental results reveal the principle evolution of fractures during forced folding and the dominating fracture mode during certain phases of this evolution. They can help to identify and interpret the geometries, patterns and opening modes of fractures observed in outcrops and in seismic data. Such evaluation is of major importance for geoengineering and energy industries, because fracture systems in a sealing overburden affect the integrity of underground fluid reservoirs and might increase their leakage potential depending on the connectivity and spatial distribution of the fractures (Hurst et al., 2003; Cartwright et al., 2007, 2008; Senger et al., 2017).
2 Methods
2.1 Experimental Setup and Scaling
The experimental device consists of an upper chamber bounded by plexiglass walls into which the analog materials are sieved, and a lower pressure chamber, which serves as a compressed air reservoir (Figure 2A). A fluid pressure gradient in porous material is built by streaming air according to Darcy’s law (Cobbold and Castro, 1999). The air flux is controlled by mass flow regulators supplying perforated tubes in the basal pressure chamber (QPC) as well as a needle valve piercing into the lowest material layer (QNV). This setup is designed to combine the presence of a regional-scale, “hydrostatic” fluid pressure and a local source of fluid overpressure affecting a layered porous medium. Pressure sensors record the air pressure in the pressure chamber (PPC). The apparatus can be modified to choose between a quasi-2D configuration (5 cm wide) and a 3D-configuration (40 cm wide) (Figures 2B,D,E).

FIGURE 2. (A) Sketch of the experimental setup illustrating the upper experimental box (dimensions: 80 × 5 × 60 cm) and the lower pressure chamber (modified from Warsitzka et al., 2019). A highly permeable foam layer and a fine metal gauze separates both parts of the box and lead to homogeneously distributed air flow at the base of the analog materials. Blue arrows demonstrate air flow. (B) Top view of the basal pressure chamber. The width of the experimental box and the basal pressure chamber can be changed from a 5 cm wide 2D configuration to a 40 cm wide 3D configuration. (C) Layering of analog materials in the experiments with a single-layer cover (experiments 1A and 1B) and with multi-layer cover (experiments 2A and 2B).
Layering consists of dry granular materials that deform according to the Mohr-Coulomb criterion (e.g. Lohrmann et al., 2003). Physical properties of the used materials, such as frictional shear strength and permeability, were measured and are further described in (Warsitzka et al., 2019). Silicate cenospheres are used to represent the reservoir layer, due to a high permeability (∼13 × 10–11 m2), a small grain density (∼750 kg m−3) and a small frictional strength (Warsitzka et al., 2019). The natural cover of the overpressured reservoir is assumed to be a fine-grained, relatively consolidated sedimentary rocks with a low permeability, a relatively high shear strength and the ability to fail in shear and in tension. In the experiments, we used a glass powder possessing a high cohesion (>100 Pa) and low permeability (4 × 10–11 m2). This material enables a sufficient air pressure build up within the pore space due to the streaming air. Furthermore, such a cohesive powder is the most suitable material to simulate elasto-plastic mechanical behaviour of most natural rocks (Galland et al., 2018b).
The experiments are geometrically and dynamically scaled so that governing parameters are proportional between model and nature (Merle, 2015). The scaling procedure of analog models using streaming air to produce a pore fluid overpressure are described in detail in Mourgues et al. (2012) and Warsitzka et al. (2019). We chose a geometric scaling ratio of γL = 10–4 so that 10 cm in the experiment corresponds to 1000 m in nature. To achieve dynamical scaling, material strengths and effective stresses can be related between model and nature. The effective stress is the total stress minus the pore fluid pressure (Mourgues et al., 2012), assuming that maximal normal stress σ1 is vertical. The relationship between the effective stress σe, the pore fluid pressure and the gravitational stress provides the dimensionless Ramberg number Cobbold et al. (2001); Rodrigues et al. (2009); Mourgues et al. (2012):
whereby γg is the ratio of the gravitational acceleration (γg = 1),
Driving forces in the porous media are governed by fluid pressure, buoyancy and drag at particles due to fluid flow (Mourgues and Cobbold, 2003). In experimental granular, permeable media, a fluid pressure gradient is built-up by streaming air, whereas buoyancy forces can be neglected (Cobbold and Castro, 1999; Mourgues and Cobbold, 2003; Rodrigues et al., 2009; Gressier et al., 2010). Assuming that fluid flow is only vertical, the vertical fluid pressure gradient can be determined from a conversion of Darcy’s law (Cobbold et al., 2001):
Here, η is the dynamic viscosity, κ the intrinsic permeability,
The internal friction coefficient μ is dimensionless and must be similar for nature and model. Cohesion (or alternatively the tensile strength) of natural, moderately compacted, fine-grained sedimentary rocks may be in the order 106 Pa (Abdelmalak et al., 2012). Using an estimated cohesion of the glass powder of 100–200 Pa (Warsitzka et al., 2019), the cohesion has a scaling factor of 1–2 × 10⁻⁴ Pa, which is in the same order of magnitude as the scaling factor of effective pressure.
Dynamic scaling can only be achieved, when inertia forces are negligible, i.e. when deformation processes in the analog experiment are relatively slow and the regime of the fluid flow is laminar (Rodrigues et al., 2009). However, these conditions are likely only fulfilled until the onset of fracture breakthrough. During rapid fracture propagation and fluidization of reservoir material, deformation velocities are too high and air flow pattern around moving particles is suggested to be turbulent (Rodrigues et al., 2009). Furthermore, it has to be stressed that experiments using flowing air to produce pore fluid pressure are not scaled for time, i.e. lack kinematic scaling (Rodrigues et al., 2009). However, the quasi-instantaneous diffusion of pore pressure in the model ensures that the pore pressure field can be assumed to be steady-state even during rapid propagation of fractures, a condition, which benefits dynamic scaling.
2.2 Experimental Procedure
After sieving layers of analog material into the upper experimental box, QPC was gradually increased until PPC equalled a 40% of the vertical normal stress (“lithostatic pressure,” σN) of the analog materials. Under this condition, the experimental ratio between PPC and σN roughly corresponds to the ratio between hydrostatic pressure and lithostatic pressure in nature at depths of ∼1000 m in normally pressurized porous sediments. Afterwards, QNV was increased in steps of ΔQNV = 3–5 L min−1 leading to a stepwise increase of the pressure around the tip of the needle valve and in the basal chamber PPC. After beginning of surficial extrusion of reservoir material, QNV and QPC were switched off.
Experiments were monitored with a digital camera (Nikon D7000; recording rate: 1 Hz) from the front in the 2D configuration and from above in the 3D configuration. The displacement patterns during deformation were analysed by digital image correlation (DIC; DaVis 10.0 by ⓒ LaVision; Adam et al., 2005; LaVision (2018)) using 2D-DIC multipass processing (interrogation window size was 48×48 pixels in the 2D experiments and 24×24 pixels in the 3D experiments with 50% overlap).
Here, we present four experiments, which differ in the layering of the cover layer and in their 2D or 3D configuration, respectively (Table 1). In experiments 1A (2D) and 1B (3D), the cover consisted of one homogeneous layer of glass powder (Figure 2C). In experiments 2A (2D) and 2B (3D), an additional layer of the high-permeable, low-cohesive reservoir material was intercalated in between two thinner cover layers (Figure 2C). The thicknesses of the multilayers were arranged such that the total vertical normal stress (’lithostatic pressure’) was similar to that in the experiments with the single-layer cover (Table 1).
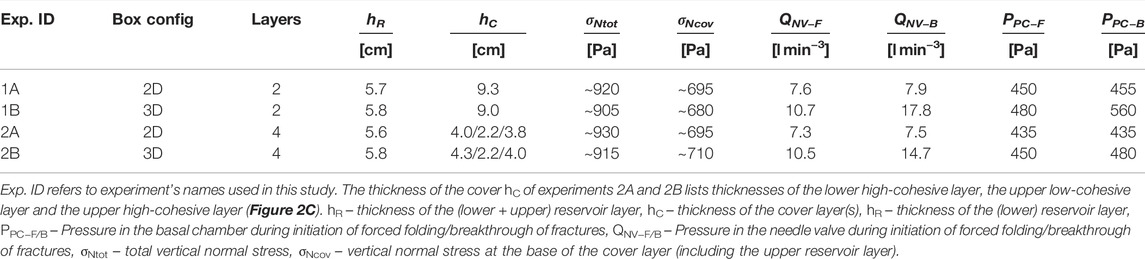
TABLE 1. List of Experiments.
2.3 Fracture and Failure Mode Analysis
Side and top view photos were used to interpret fracture patterns and analyse the opening mode of the fractures (“fracture mode”) in the cohesive cover layer. Generally, fractures originate either from tensile, shear or compaction failure as well as hybrid modes of tensile-shear and compactive-shear failure (Figure 3A) (Price and Cosgrove, 1990; Ferrill et al., 2020).
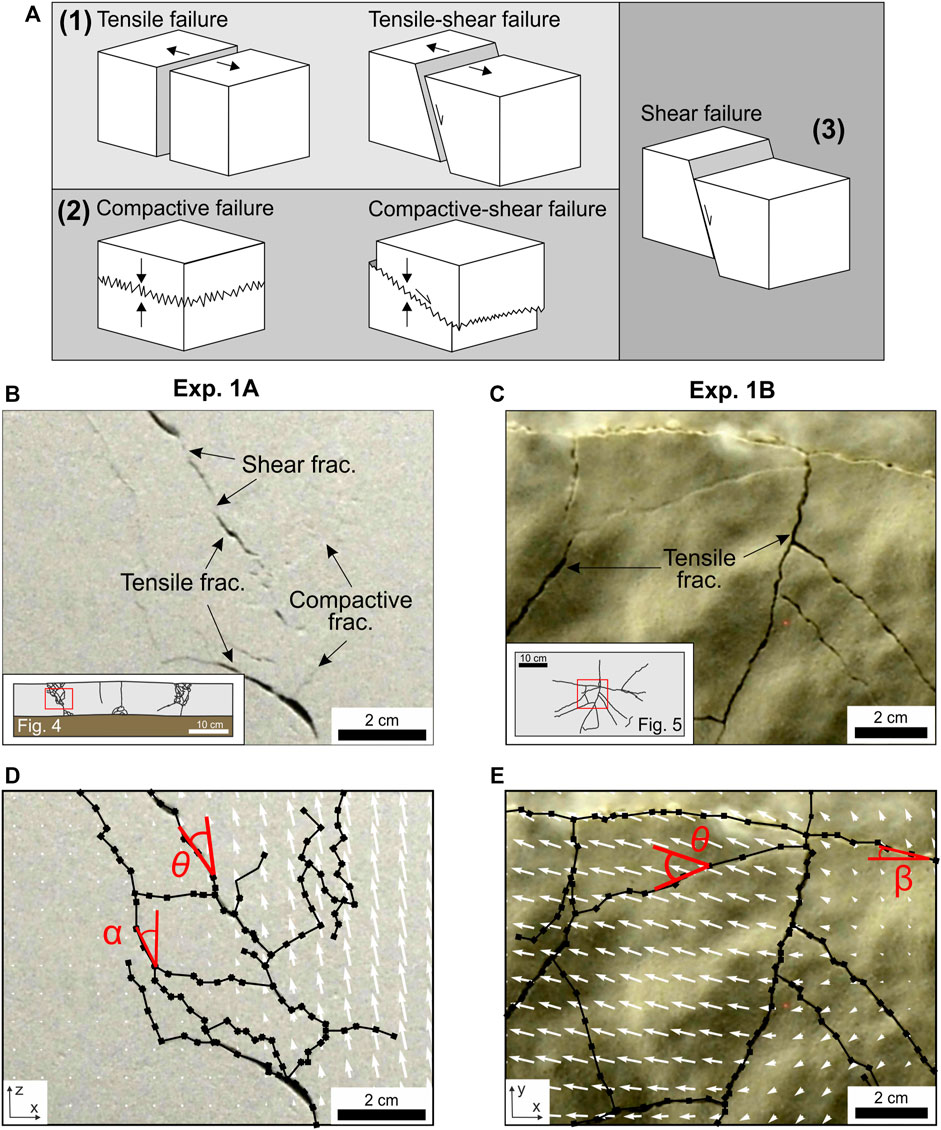
FIGURE 3. (A) Sketches of the failure modes of fractures (modified from Ferrill et al., 2020). (B) Side view photo of experiment 1A showing the fracture patterns in the cohesive cover layer (cf. Figure 4A). (C) Top view photo of the 3D experiment 1B displaying fractures on the surface of the cohesive cover layer (cf. Figure 5A). Tensile fractures are identifiable by open gaps, compaction fractures by white and grey shadows and shear fractures by lineaments connecting tensile or compactive fractures. Note that in the 3D experiment no compaction fractures are visible at the surface. (D,E) Interpretation of the fractures and division into individual fracture segments (black lines with nodes). The white arrows show the displacement vectors derived from the DIC analysis. α describes the dip and β the strike angle, respectively, of the fracture segment. Θ is used to determine the fracture mode and is defined by the angle between the fracture’s dip or strike and the nearest displacement vector.
In our study, the fracture analysis of the 2D experiments includes 1) the interpretation of fractures and differentiation of fractures dominated by tensile and compactive failure (Figure 3B). Tensile fractures are characterized by open gaps. Compactive fractures can be recognized by irregular, zigzag-shaped lineaments formed by compression and volume loss. In the surface views of the 3D experiments, compactive fractures could not be recognized so that only tensile fractures were interpreted (Figure 3C). 2) Interpreted fractures were dissected into discrete segments (Figures 3D,E) and length and dips (in 2D experiments) or strikes (in 3D experiments) of the segments were measured. 3) The angles of the fractures (α in the 2D experiments and β in the 3D-experiments, Figures 3D,E) were then subtracted from the angle of the closest vector of the displacement field derived from the DIC analysis. The resulting angle θ (Figures 3D,E) is here used to distinguish the opening mode of each segment. We define fractures with θ between 0 and 45° as dominated by shear failure, i.e. tensile-shear or compactive-shear, and fractures with θ between 45 and 90° as dominated by tension or compaction, respectively.
Dips and lengths of the fractures were also used for statistical analysis. Counts of strike and dip values of the fractures are weighted by the length of the related segment (weighted average) so that long fractures are statistically over- and short fractures are underrepresented. From a set of fractures, the distribution of dips or strikes, respectively, in intervals of 10° was determined.
3 Results
3.1 Homogeneous Cover
In the 2D experiment 1A, forced folding of the cover layer was induced above the needle valve accompanied by the formation of sub-vertical fractures at the crest of the fold (“crestal fracture”). Contemporaneously, Y-shaped fracture systems developed at both limbs of the forced fold (“wing fractures”) (Figures 4A,B, phase 1). This situation remained stable until the next step of increasing the air flux through the needle valve. With beginning of the next step (at ∼7.8 L min−1), the left flank of the fold was abruptly uplifted and the wing fractures propagated towards the model surface (Figures 4A,B, phase 2). The wing fractures branched off into a network of inclined fractures. The time series of the surface deformation (Figure 4C) shows that shortly before breakthrough of the wing fractures, the central fold and its left flank were rapidly uplifted by ∼5 mm (= 5% of total cover thickness). The air pressure in the basal pressure chamber suddenly decreased after the breakthrough of the wing fractures (Figure 4D). This implies that the breakthrough opened a continuous, high-permeable pathway so that the air flux was concentrated in the wing fractures. The concentrated air flux lead to the fluidization and extrusion of material of the reservoir layer at the experimental surface. Subsequent to the breakthrough, the central fold gradually subsided by about 2 mm, but not back to its original position (Figures 4A,B, phase 3).
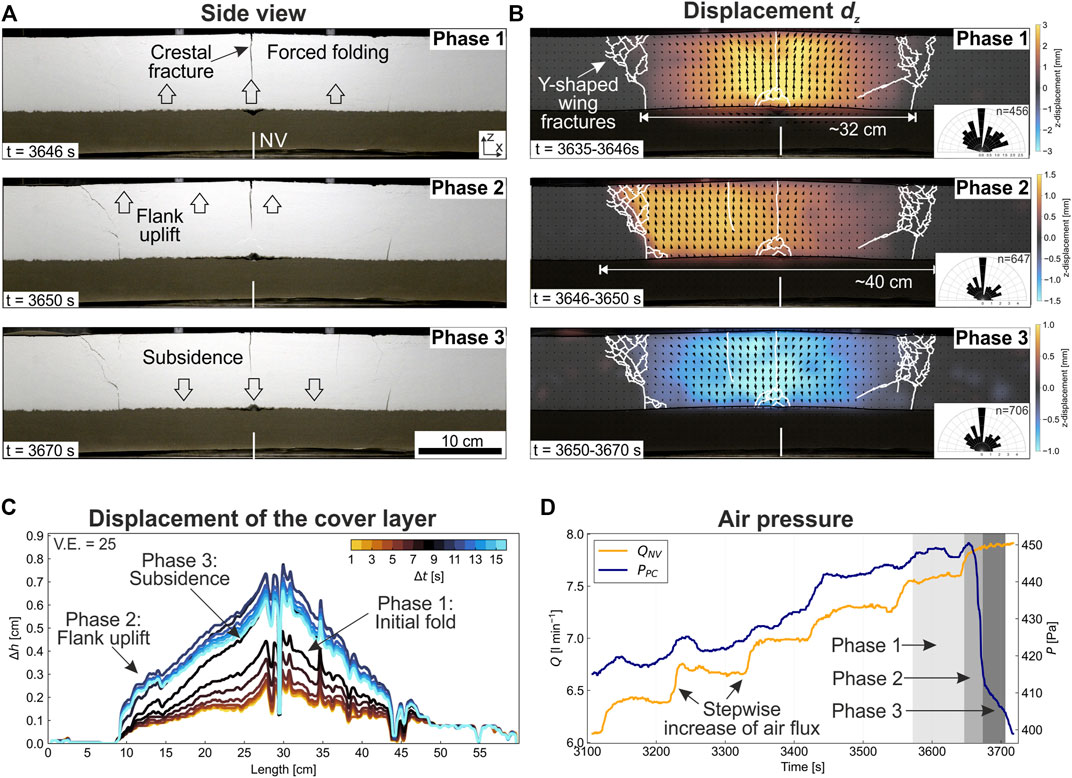
FIGURE 4. Results of exp. 1A, which consisted of a homogeneous cover layer and was performed in the 2D box configuration of the apparatus. (A) Side view photos showing the structural evolution. Phase 1: a central forced fold developed above the tip of the needle valve (NV). Phase 2: uplift of the left flank of the forced fold and breakthrough of the wing fractures. Phase 3: The central forced fold subsided. (B) Displacement vector field derived from the DIC analysis. The background color represents the amount of the vertical displacement dz (uplift = orange to brown, subsidence = brown to blue). Each image shows the cumulative displacement of the specified time interval. The fracture segments (white lines) were interpreted from high-resolution photos (see e.g. Figure 3). The rose diagrams show the dip directions normalized by the length of the individual fracture segments. (C) Time series of the surface height (top of the white layer) plotted against the x-position of the experiment. (D) Time series of the air flux through the needle valve (QNV) and the pressure in the pressure chamber (PPC). Air flux at the base of the pressure chamber (QPC) was constant so that PPC was approx. 40% of the total vertical normal stress at the beginning of the experiment (Table 1).
In the top view of the equivalent 3D experiment 1B, a tensile fracture opened roughly in the center of the box trending parallel to the x-axis (Figures 5A,B, phase 1a). During the next several steps of increased air flux through the needle valve, additional fractures branched off perpendicular of the initial fracture (Figure 5A, phase 1b). The displacement field shows that the movement was partitioned between various blocks and direct radially away from the central uplift (Figure 5B). This vector pattern indicates an outward tilting of the blocks and, therefore, a dome-shaped forced fold.
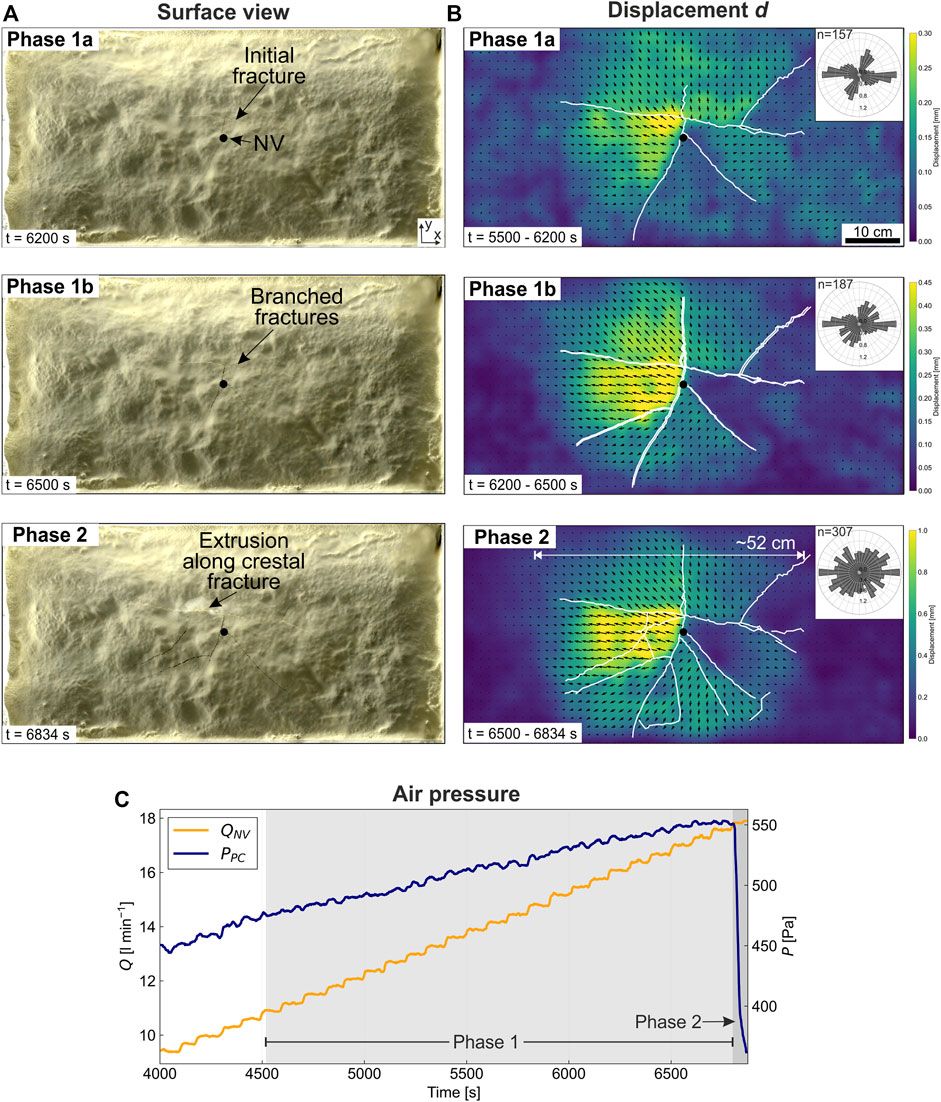
FIGURE 5. Results of exp. 1B, which consisted of a homogeneous cover layer and was performed in the 3D box configuration of the apparatus. (A) Top view of the experimental surface. Phase 1a: initial, central fractures formed above the tip of the needle valve (NV). Phase 1b: Further fracture branched off from the initial fractures. Phase 2: branched fractures developed and material extrusion occurred along the central fracture. (B) Displacement vector field derived from the DIC analysis. The background color displays the amount of the total displacement d. Each image shows the cumulative displacement for the specified time interval. The rose diagrams show the strike directions normalized by the lengths of individual fracture segments (white lines). (C) Time series of the air flux through the needle valve (QNV) and the pressure in the pressure chamber (PPC). Air flux at the base of the pressure chamber (QPC) was constant so that PPC was approx. 40% of the total vertical normal stress at the beginning of the experiment (Table 1).
At an air flux of roughly 17 L min−1, the uplift of the cover block left from the position of the needle valve was increased rapidly. This led to widening of the branched fractures in the centre and to a further lateral propagation of the fractures (Figure 5A, phase 2). At this time, extrusion of reservoir material began along the initial fracture directly at the edge of a strongly tilted block. Thus, fracture breakthrough occurred at the crest of the forced folds, which is different from the equivalent 2D experiment 1A.
In the 3D experiment 1B, surficial traces of these fractures show a more complex pattern compared to the single, straight crestal fracture developed in the 2D experiment (Figure 5A). Furthermore, the width of the region affected by block tilting and fracturing at the surface was larger in exp. 1B (∼52 cm; Figure 5B) than in exp. 1A (∼40 cm; Figure 4B) indicating that the 3D dome-shaped uplift was wider than the 2D forced fold. The air pressure to induce initial forced folding occurred at a significantly higher critical values (PPC−F) in the 3D experiments (Figure 5C) compared to the equivalent 2D experiment (Table 1). Also, the transition from the initial forced fold (phase 1) to breakthrough of the fractures (phase 2) required only one further step of increasing air flux through the needle valve in the 2D experiments. Compared to that, multiple steps of air flux increase were needed in the 3D experiments to induce breakthrough after the formation of the initial forced fold (Figure 5C).
3.2 Multi-Layer Cover
Experiment 2A consisted of a multi-layered cover and was performed in the 2D configuration of the apparatus. Similar to exp. 1A, the structural evolution started with the formation of a symmetrical forced fold and the formation of Y-shaped wing fractures, which simultaneously affected both cohesive cover layers (Figures 6A,B, phase 1). After one further step of increasing air flux through the needle valve (at ∼7.3 L min−1), the left flank of the lower cover layer was uplifted first so that wing fractures broke through. Subsequently, an additional forced fold developed in the upper cover layer above the outlets of these fractures and was accompanied by breakthrough of fractures to the experimental surface (Figures 6A,B, phase 2). The uplift of the flanks took place within a few seconds and is accompanied by rapid subsidence of the central forced fold. The width of the initial forced fold in the lower part of the cover succession was roughly 20 cm, whereas it increased to roughly 45 cm measured between the uppermost tips of the wing fractures (Figure 6B).
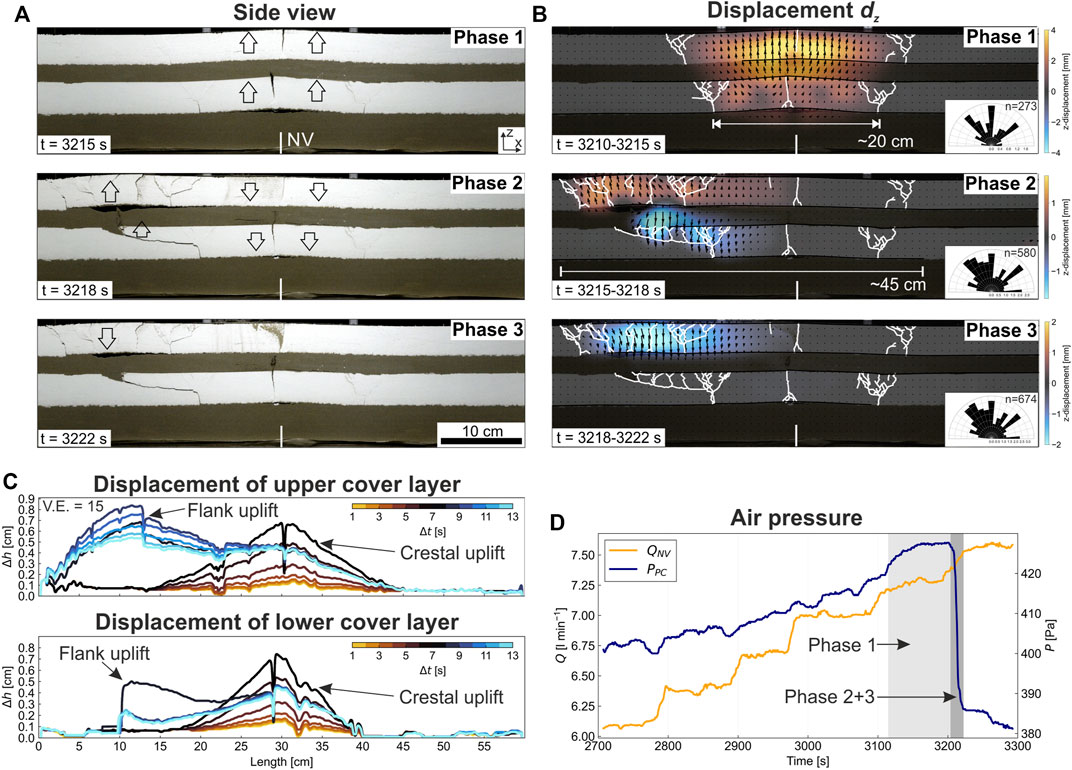
FIGURE 6. Results of exp. 2A, which consisted of a multi-layered cover and was performed in the 2D configuration of the apparatus. (A) Side view photos showing the structural evolution. Phase 1: a central forced fold developed in both cover layers above the tip of the needle valve (NV). Phase 2: forced folding and fracturing occurred at the left flank, whereas the central forced fold subsided. Phase 3: The uplifted parts at the left flank gradually subsided. (B) Displacement vector field derived from the DIC analysis. The background color displays the amount of the vertical displacement dz (uplift = orange to brown, subsidence = brown to blue). Each image shows the cumulative displacement for the specified time interval. The fracture segments (white lines) were interpreted from high-resolution photos (see e.g. Figure 3). The rose diagrams show the dip directions normalized by the lengths of individual fracture segments. (C) Time series of the elevation of the upper and the lower cover layer plotted against the x-position of the experiment. (D) Time series of the air flux through the needle valve (QNV) and the pressure in the pressure chamber (PPC). Air flux at the base of the pressure chamber (QPC) was constant so that PPC was approx. 40% of the total vertical normal stress at the beginning of the experiment (Table 1).
The development of the elevation of the upper and the lower cover layer are similar (Figure 6C). Nevertheless, the amplitude of the crestal uplift is slightly higher in the lower cover layer (∼6 mm) compared to the upper one (∼5 mm). In contrast, the uplift of the flank is less in the lower (∼4 mm) than in the upper cover layer (∼7 mm). Due to fluidization, grains of the upper reservoir layer are flushed towards the forced fold of the upper cover layer and extruded through the wing fractures.
In the equivalent 3D experiment 2B, an initial fracture opened in the center of the box striking parallel to the x-axis (Figures 7A,B, phase 1). Horizontal displacement vectors show movement away from this fracture indicating the uplift of an elongated forced fold. During increase of air flux through the needle valve, tensile fractures propagated towards the lower right part of the box (in top view), where a closely branched fracture network developed (Figures 7A,B, phase 2). At an air flux in the needle valve of approximately 15 L min−1, the surface in the lower right region was uplifted rapidly followed by extrusion of reservoir material and a rapid collapse of this uplift (Figure 7A, phase 3). Displacement vectors indicate again tilting away from a radial center in the right part of the box (Figure 7B, phase 2). Likewise, subsidence of the flank uplift is displayed by a more or less concentrical pattern of the displacement vectors (Figure 7B, phase 3). The entire region affected by uplift and fractures was c. 70 cm wide and, therefore, captured almost the entire area of the apparatus.
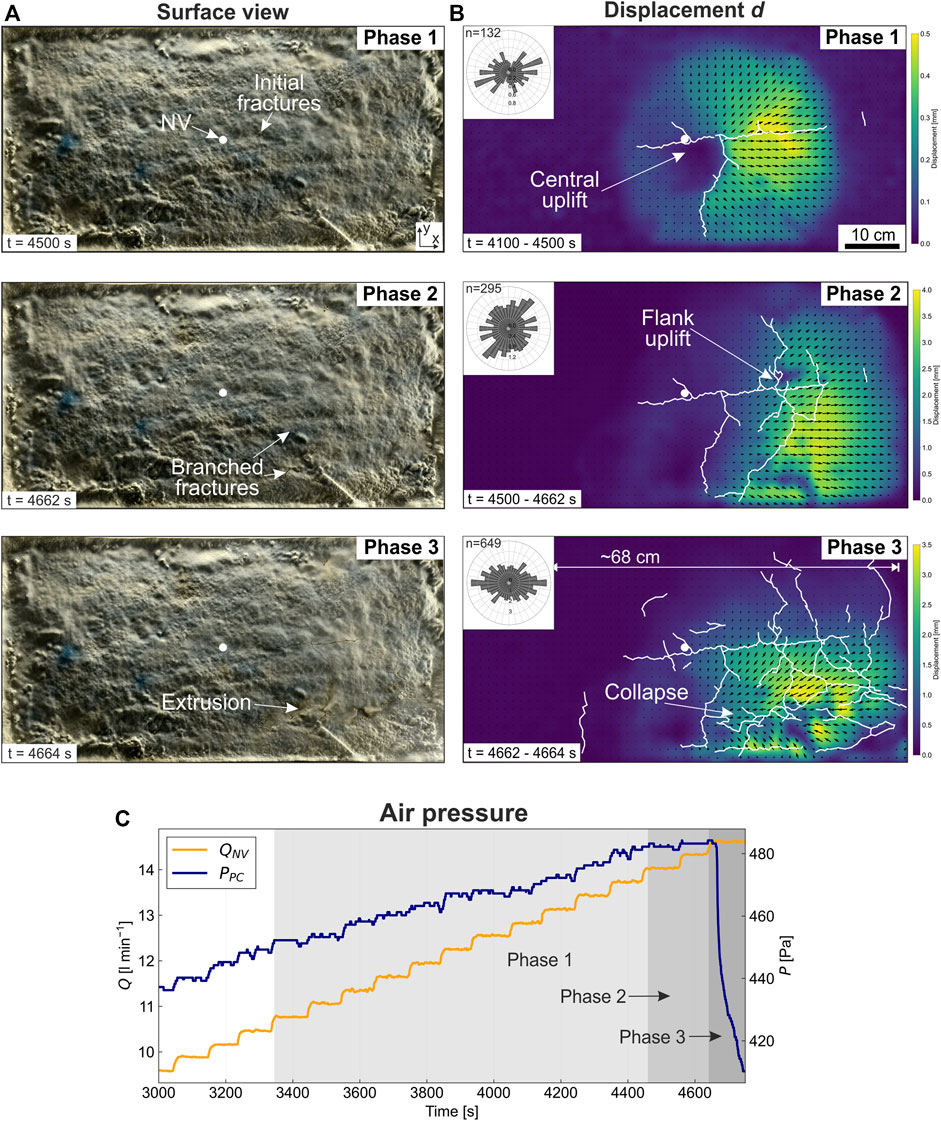
FIGURE 7. Results of exp. 2B, which consisted of a multi-layered cover and was performed in the 3D configuration of the apparatus. (A) Top view of the experimental surface. Phase 1: initial fractures and a forced fold formed in the centre of the box. Phase 2: branched fractures and uplift of the flank developed dominantly in the right half of the box. Phase 3: Rapid collapse of the force fold occurred and was associated with the formation of collapse fractures. (B) Displacement vector field derived from the DIC analysis. The background color displays the amount of the total displacement. Each image shows the cumulative displacement for the specified time interval. The rose diagrams show the strike directions normalized by the lengths of individual fracture segments (white lines). (C) Time series of the air flux through the needle valve (QNV) and the pressure in the pressure chamber (PPC). Air flux at the base of the pressure chamber (QPC) was constant so that PPC was approx. 40% of the total vertical normal stress at the beginning of the experiment (Table 1).
Similar as in experiments with a homogeneous cover, the critical pressure for forced folding and breakthrough was higher in the 3D experiment (Figure 7C) than in the 2D experiment (Figure 6D). Furthermore, critical pressures were slightly lower in experiments with multi-layered cover than those in experiments with homogeneous cover, although “lithostatic pressures” were similar (Table 1). A further main difference between homogeneous and multi-layered experiments is the spacing between fractures that is less dense in experiments 2A and 2B than in 1A and 1B.
3.3 Fracture Mode
In the 2D experiments 1A and 2A, the crest of the forced fold was dissected by one sub-vertical, tensile fracture during phase 1 (Figures 8A, 9A). In the lower part of the fold crest occurred a branched network of fractures that failed by compaction. The patterns of the wing fractures in both experiments start with a subvertical fracture at the base of the cover layer, which were dominated by tensile mode (Figures 8, 9). At the same time, branched fractures formed in the V-shaped region above these tensile fractures and along which deformation occurred in compactive mode. The number of compactive and compactive-shear fractures is much higher than that of tensile and tensile-shear fractures (Figures 8A, 9A). The dip angles of the tensile dominated fractures were either horizontal or vertical in both experiments. In contrast, the compaction-dominated fractures, frequent in the wing fracture system, are inclined between ±45°.
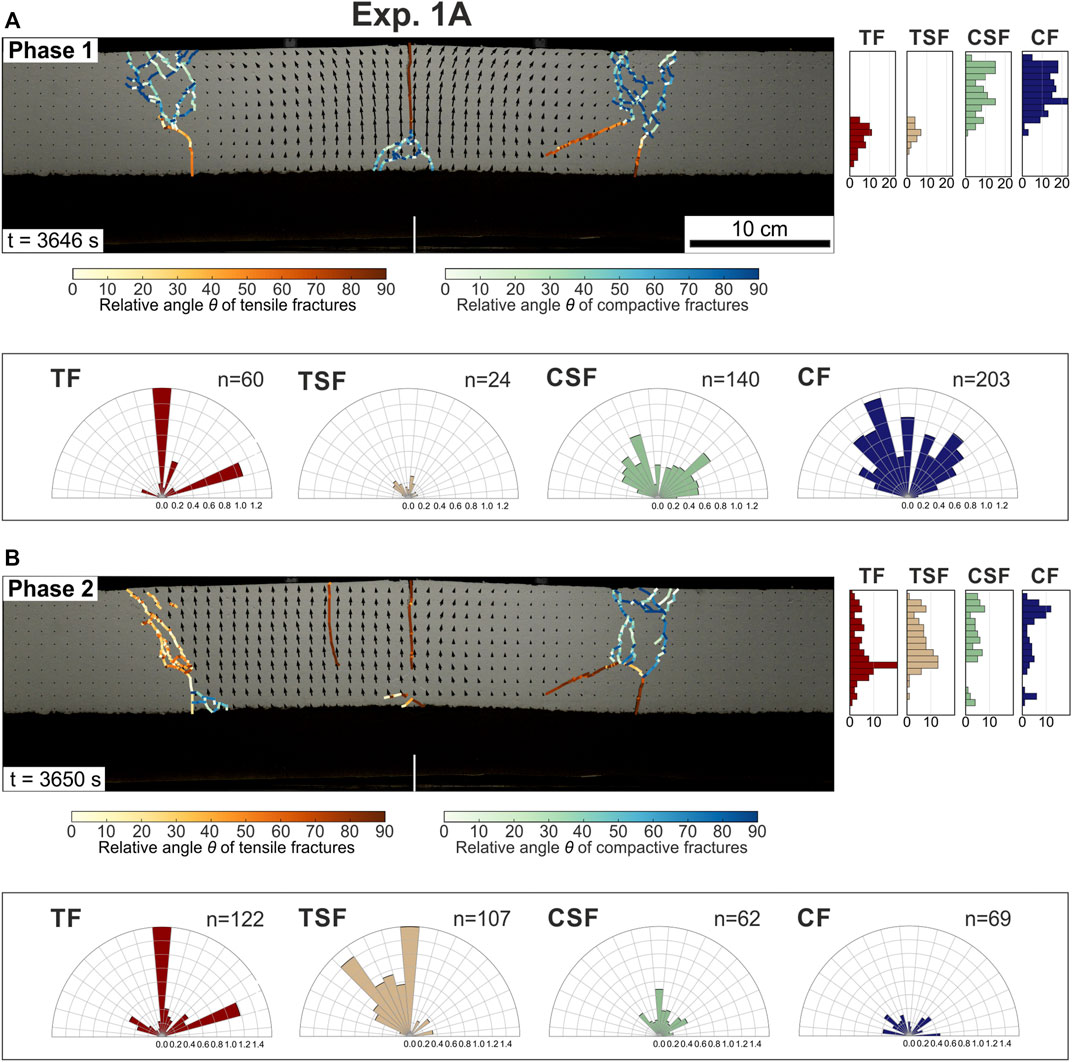
FIGURE 8. Results of the fracture mode analysis of the 2D experiment 1A for (A) phase 1 and (B) phase 2 showing the opening mode of the fractures color-coded. The opening mode is determined by the relative angle θ between the dip of the fracture and the displacement vectors (black arrows). If θ is larger than 45°, the fracture is dominated by tensile (red) or compactive (blue) movement, respectively. In case θ is smaller than 45°, the fracture is dominated by tensile-shear (orange) or compactive shear (green), respectively. The bar plots to the right display the amount of the specific fracture types for certain depth intervals (only wing fractures included). Rose diagrams display the dip angles α of the tensile (TF), tensile-shear (TSF), compactive (CF) and compactive-shear fractures (CSF) normalized by the length of each fracture segment.
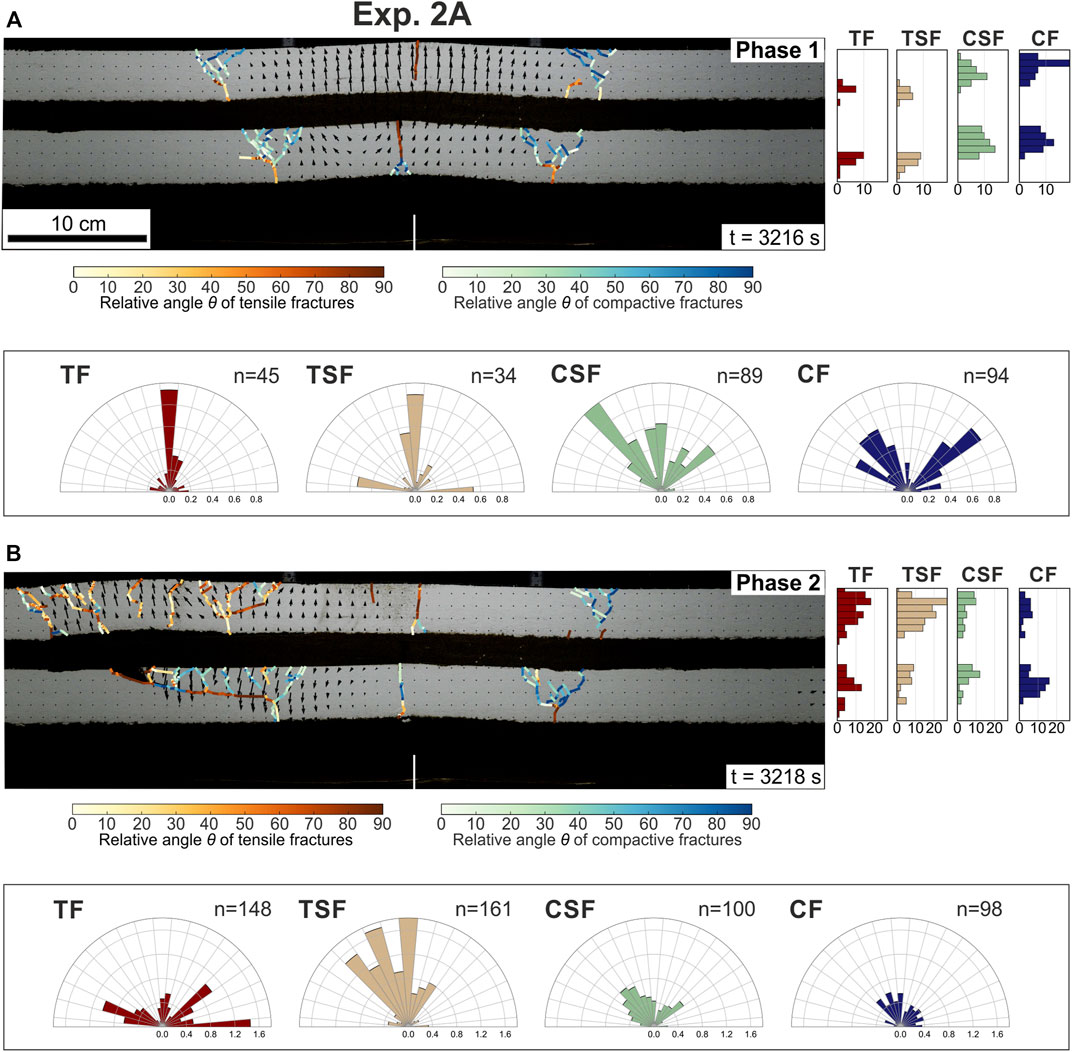
FIGURE 9. Results of the fracture mode analysis of the 2D experiment 2A for (A) phase 1 and (B) phase 2 showing the opening mode of the fractures color-coded. The opening mode is determined by the relative angle θ between the dip of the fracture and the displacement vectors (black arrows). If θ is larger than 45°, the fracture is dominated by tensile (red) or compactive (blue) movement, respectively. In case θ is smaller than 45°, the fracture is dominated by tensile-shear (orange) or compactive shear (green), respectively. The bar plots to the right display the amount of the specific fracture types for certain depth intervals (only wing fractures included). Rose diagrams display the dip angles α of the tensile (TF), tensile-shear (TSF), compactive (CF) and compactive-shear fractures (CSF) normalized by the length of each fracture segment.
During phase 2, i.e. the breakthrough of the wing fractures, the wing fractures at the flank of the breakthrough were dominated by tensile-shear fractures (Figures 8B, 9B), which were mainly inclined around 45°. This implies that the flank of the forced fold was sheared during the uplift. At the opposite flank of the breakthrough, additional compaction and tensile fractures were activated due to the increased tilting of the uplifted flank.
In the 3D experiments 1B and 2B, the fractures were characterized by a complex pattern of shear and tensile movements (Figures 10A, 11A). This might be a result of the outward tilting of individual blocks of the cover during the formation of the central hinge uplift (phase 1) and the various strike directions of the fractures. In general, more fractures were dominated by shearing than by tensile opening as shown in the rose diagrams (Figures 10, 11). During the breakthrough of the fractures (phase 2), the number of tensile fractures increased significantly in both experiments. Nevertheless, the fractures at which the breakthrough occurs are mainly affected by shear movement indicating that shear fractures between differentially uplifted blocks penetrate through the high-cohesive layer into the reservoir layer underneath.
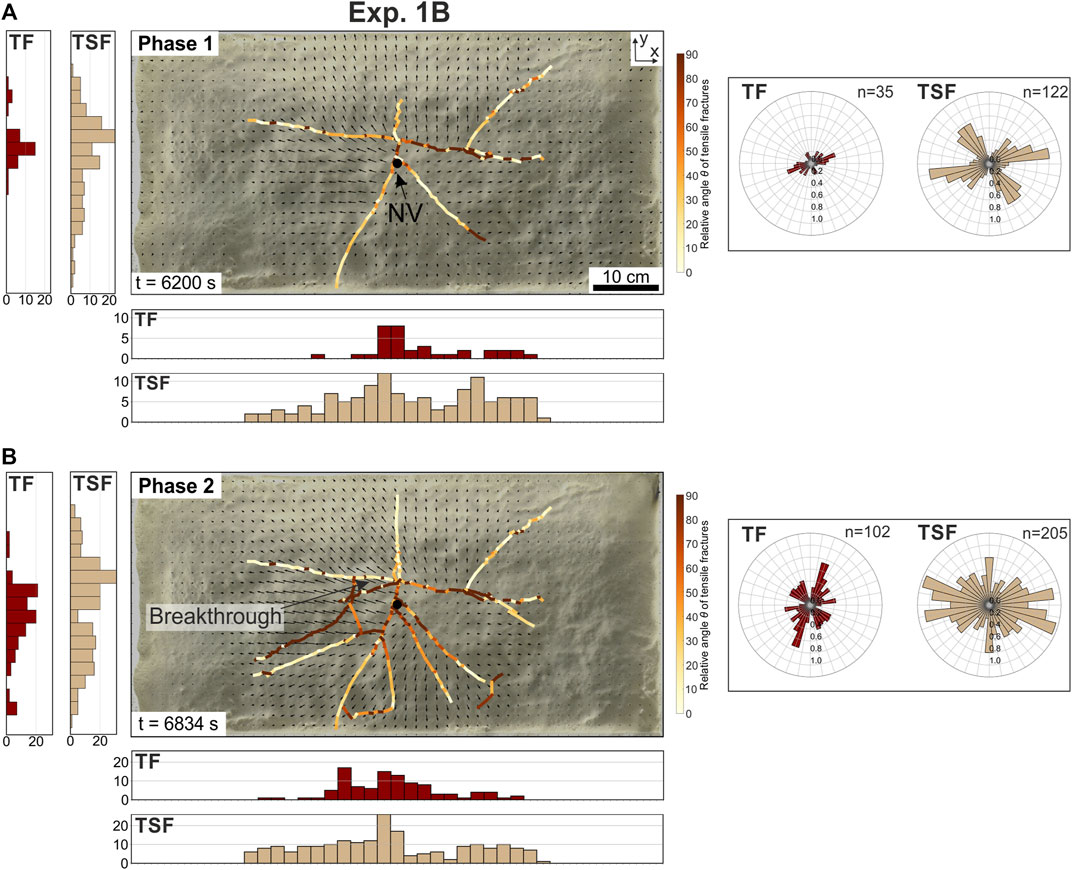
FIGURE 10. Results of the fracture mode analysis of the 3D experiment 1B for (A) phase 1 and (B) phase 2 showing the opening mode of the fractures color-coded. The fracture mode is determined by the relative angle θ between the strike of the fracture and the closest displacement vector (black arrows). If θ is larger than 45°, the fracture is dominated by tensile opening (red). In case θ is smaller than 45°, the fracture is dominated by tensile-shear movement (orange to beige). Note that traces of compactive fracture were invisible on the surface. The bar plots at the left and the bottom display the amount of the specific fracture types for certain intervals along the y- and x-axis, respectively. Rose diagrams display the strike angles β of the tensile (TF) and tensile-shear fractures (TSF).
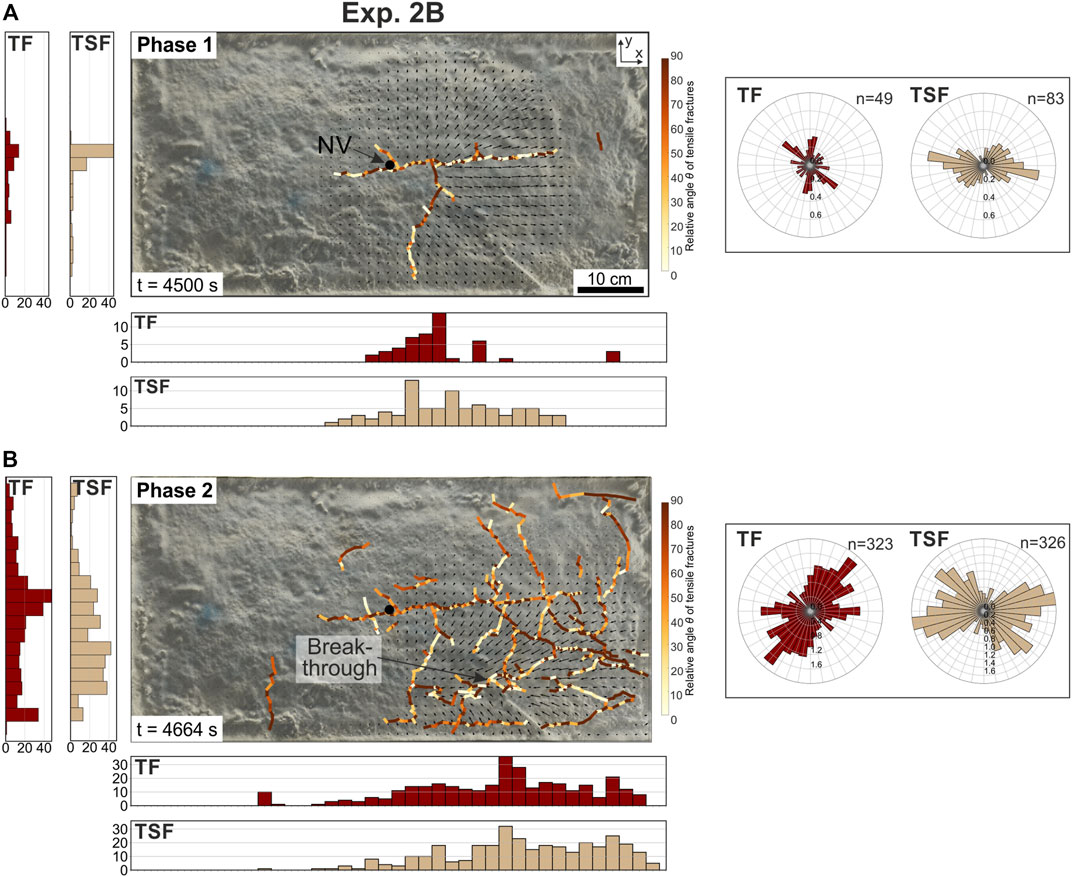
FIGURE 11. Results of the fracture mode analysis of the 3D experiment 2B for (A) phase 1 and (B) phase 2 showing the opening mode of the fractures color-coded. The fracture mode is determined by the relative angle θ between the strike of the fracture and the closest displacement vector (black arrows). If θ is larger than 45°, the fracture is dominated by tensile opening (red). In case θ is smaller than 45°, the fracture is dominated by tensile-shear movement (orange to beige). Note that traces of compactive fracture were invisible on the surface. The bar plots at the left and the bottom display the amount of the specific fracture types for certain intervals along the y- and x-axis, respectively. Rose diagrams display the strike angles β of the tensile (TF) and tensile-shear fractures (TSF).
The strike direction of the tensile-shear fractures is bimodal, whereas most of the fractures are parallel to the x-axis of the box and in an angle of 30–45° (Figures 10, 11). The tensile dominated fractures have no preferred strike directions. In fact, the dominant strike directions change from phase 1 to phase 2.
4 Discussion
4.1 Fracture Patterns in Homogeneous Cover Layers
By modeling experiments in a quasi-2D and in a 3D configuration, different perspectives on the processes of forced folding and associated fracturing can be gained. This allows to indirectly correlate deformation patterns between cross sections and the surface.
The side view in the 2D experiment 1A shows that first sub-vertical tensile fractures occurred at the crest and the lower parts of the limbs of the forced fold (Figures 12A,C). At the same time, a V-shaped system of compactive fractures developed in the upper parts of the limbs. These indicate that the cover layer was compressed in the upper parts and stretched in the lower parts due to the bending during forced folding (Figure 12C) (e.g. Pollard and Johnson, 1973). Reservoir material intruded into the opening tensile fractures at the base of the cover, but did not infiltrate the regions of the compactive fractures. Furthermore, no decrease in air pressure could be detected during phase 1 (e.g. Figure 4D). These observations imply that the initial fracture network related to forced folding did not increase the bulk permeability of the cover layer suggesting that the cover layer maintained its hydraulic properties.
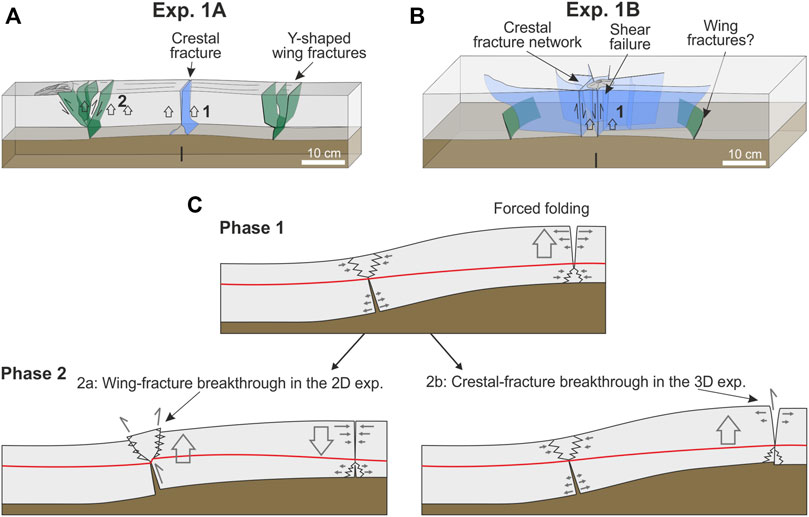
FIGURE 12. Interpretive sketches showing wing fractures (green) and crestal fractures (blue). For the 3D experiment 1B, the half-width of the box is shown. (A) Exp. 1A: Breakthrough occurred along wing fractures. (B) Exp. 1B: breakthrough of fractures occurred at the crest of the forced fold. Note that wing fractures did not penetrated to the surface so that their position and shape is speculative. (C) Two-stage evolution of principal fracture evolution shown for the left half of the model. Phase 1: Forced folding of the cohesive cover layer caused tensile fracturing at the crest and the lower flanks of the fold. Phase 2: shear failure lead to breakthrough of the fractures. 2a: Wing-fracture breakthrough, 2b: Crestal fracture breakthrough. The red line denotes the neutral plane, where normal strains are zero (Bureau et al., 2014).
In the equivalent 3D experiment 1B, fractures occurred in the region above the needle valve, which mainly opened in hybrid shear and tensile mode (Figure 10A). Referring to observations in the 2D experiment, these fractures represent the crestal network caused by updoming of the cover layer (Figure 12B). The hybrid mode of the fractures likely resulted from differentially uplifted and tilted blocks of the cover layer such that shear displacement took place along the bounding fractures. Furthermore, we suggest that tensile fractures also developed at the base of fold limbs based on the observations in the 2D experiment (Figures 12A,B). However, the wing fractures apparently did not penetrate to the experimental surface in the 3D exp. 1B, because no flank uplift took place.
During phase 2 in experiment 1A, one side of the forced fold was uplifted relative to the outer limb of the forced fold (Figure 12C, phase 2). The fracture analysis shows that tensile fractures formed during phase 1 were reactivated by shear displacement at the side of the breakthrough. This leads to a pattern of alternating steep and sub-horizontal fracture segments (Figure 3B). In contrast, previously formed compactive fractures in the V-shaped upper part of the fold limbs were breached by shear and tensile fractures (Figure 8) suggesting that these compactive fractures do not act as mechanical weak zones.
Different from 2D experiment 1A, the breakthrough of the fractures took place along the initial crestal fracture in 3D experiment 1B (Figure 5A, phase 2). It can be suggested that the crestal fracture penetrated by shear displacement along the edges of differentially uplifted blocks from the surface towards the base of the cover (Figure 12C). This is a significant difference to the 2D experiment and might result from the dome-shaped uplift. In the 2D experiment, flanks of the fold slide along glass planes. In the 3D experiment, the flanks of the dome were in contact with cohesive material on all sides, which might hamper flank uplift. Furthermore, the total size and mass of the fold limbs are larger in the 3D experiments. Hence, it is likely easier to shear and further uplift the crestal block instead of the flanks of the dome-shaped fold. These differences demonstrate that insights derived from 2D experiments should be supplemented by similar 3D experiments to test the influence of boundary effects on deformation processes.
In both experiments, the breakthrough of the fractures was associated with a significant drop in the air pressure in the basal pressure chamber. This implies that high-permeable pathways penetrated the cover layers focusing the air flux. The decreased air pressure in the reservoir layer was insufficient to support the uplifted forced fold so that the cover layer subsided during phase 3.
The higher critical pressures in the 3D experiment for triggering forced folding and fracture breakthrough can be also attributed to a larger strength of the cover layer. The strength of the overburden above a pressurized reservoir mainly depends on the flexural bending and tensile strength (Pollard and Johnson, 1973; Galland and Scheibert, 2013). In the 2D experiment, the forced fold affected only a narrow, 5 cm wide stripe of the cover layer so that bending stresses during initial forced folding can be assumed to be acting only in the x-direction. In contrast, a dome-shaped fold has to be uplifted in 3D experiments 1B so that bending stresses acted in the x- and y-direction.
4.2 Fracture Patterns in Multi-Layer Models
In the 2D multi-layer experiment 2A, the sequence of forced folding and wing fracture breakthrough first took place in both cover layers above the needle valve. During phase 2, this sequence repeated in the upper layer above the tip of the wing fractures in the lower cover layer (Figure 13A). In the multi-layered 3D experiment 2B, initial fracturing and forced folding (phase 1) also occurred in the region above the needle valve, whereas major fracturing and fracture breakthrough was localized in the outer parts of the box offset from the needle valve (Figure 13B). This observation suggests that the evolution in both the 2D and the 3D experiments was similar. Tips of the wing fractures in the lower cover layer served as a local source for overpressure from which air spread in the upper reservoir layer and again induced forced folding (Figure 13C). Since the upper cover layer was already fractured at the beginning of phase 2, the breakthrough likely occurred along both, crestal and wing fractures (Figures 13A,B). In summary, it can be suggested that the presence of a high-permeable weak interlayer in a stratified cover leads to a decoupling of deformation between individual layers and considerable lateral widening of the region affected by fracturing. The width of the initial forced fold was roughly 10 cm less during phase 1 in experiment 2A (Figure 6B) compared to that in exp. 1A (Figure 4B) with a homogeneous cover. Nevertheless, the fractured region widened significantly during phase 2 in the multi-layered experiments.
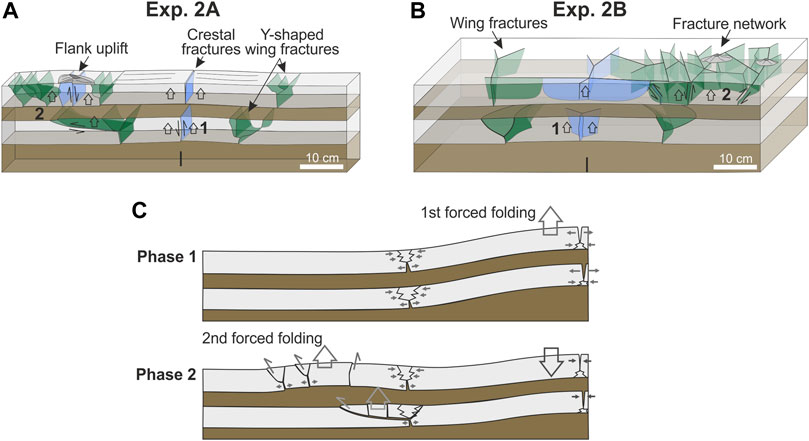
FIGURE 13. Interpretive sketches showing wing fractures (green) and crestal fractures (blue). For the 3D experiment 2B, the half-width of the box is shown. (A) Exp. 2A: an additional fracture network due to forced folding developed in the upper cover layer. (B) Exp. 2B: Breakthrough of fractures occurred at the flanks of the central forced fold in the lower cover layer. Note that positions and shape of fractures in the lower cover layer are speculative. They were sketched in analogy to results of the 2D experiment 2A. (C) Two-stage evolution of principal fracture evolution shown for the left half of the model. Phase 1: Tensile and compactive failure in the central forced above the needle valve. Phase 2: shear failure leads to breakthrough of the wing fractures and a second sequence of forced folding and fracture breakthrough occurs in the upper cover layer.
Lower critical pressures in the experiment 2A with a multilayered cover (Figure 6D) indicate that the force required to induce bending is lower than in case of a homogeneous cover in experiment 1A (Figure 4D). This is likely because bending of multiple thin cover layers benefits from mechanically weak interlayers accommodating flexural shear strain between the competent cover layers.
4.3 Experimental Limitations
Limitations of the experimental approach are described in detail in Warsitzka et al. (2019). In that study, various settings with different thicknesses of the cover layer and pore pressure conditions were tested in quasi-2D experiments. Furthermore, May et al., 2019 investigated different settings of the geometrical configuration and the material properties of the cover layer in 2D and 3D experiments. Overall, the reproducibility of our experimental results are verified by the structural similarities (also compared to other studies such as Rodrigues et al. (2009); Mourgues et al. (2012); Bureau et al. (2014)) as well as the systematic variation of the structures and the critical air pressures depending on the changed parameters.
In the following, we describe further limitation of the experimental approach:
(1) The approach to use 2D and 3D experiments allows us to investigate different aspects on the fracture formation. Nevertheless, differences in structural evolution between exp. 1A and 1B, in particular the process of the fracture breakthrough, imply that the influence of the experimental setup is not negligible. The reasons for that remain speculative (see above and May et al. (2019)) and have implications for the scaling of mechanical properties of the cover layer. Since the forced fold is a dome-shaped structure in the 3D experiments, the flexural rigidity of the upward bent cover is significantly larger than in the 2D experiments (Goulty and Schofield, 2008; Galland and Scheibert, 2013), whereas the lithostatic pressure is equal. Thus, the elastic properties of the cover actually have to be scaled differently between 2D and 3D experiments. However, it can also be argued that the 2D and 3D setups represent different geological situations. 3D experiments might simulate oblate structures, such as saucer-shaped intrusions (e.g. Polteau et al., 2008), whereas 2D experiments might represent profiles across plane-strain, laterally elongated structures, such as sand intrusions emerging from sub-marine, sandy channels (e.g. Jackson et al., 2011).
(2) Fracture patterns and opening modes are affected by the rheology of the cover layer and the viscosity of the injected or remobilized fluid (e.g. Montanari et al., 2017; Meng and Hodgetts, 2020), which can be highly variable in nature. Nevertheless, a systematic investigation of the effects of these parameters is beyond the scope of our study, but was qualitatively undertaken by a comparison with previous modelling studies (see below).
(3) The experimental setup assumes an ideal planar layering of the reservoir-cover system and homogeneous mechanical properties of each layer. Natural sedimentary strata, in contrast, can contain diverse tectonic and sedimentary structures, such as folds, polygonal fault system, deltaic systems, etc. (e.g. Shoulders et al., 2007; Magee et al., 2019; May et al., 2019). Such heterogeneities influence the accumulation of fluid overpressure as well as shapes and localization of forced folds and fractures. Furthermore, post-intrusion compaction of the cover layer can modify folds and fracture patterns (e.g. Jackson, 2007; Magee et al., 2019). Hence, it is crucial to identify structural patterns that existed prior to or developed after forced folding, when translating our experimental results to natural examples.
(4) Regional tectonic stresses were not included in the experimental procedure. Instead it was assumed that horizontal stress and fluid pressure are equal in all directions, which is likely not the case in most natural settings (Mourgues et al., 2011). Opening modes and directions are affected by tectonic stresses as it has been demonstrated by, for instance, numerical modelling studies on hydraulic fracturing (e.g. Smart et al., 2014). Thus, our models should be regarded as a first-order approach performed under idealized isotropic stress conditions.
(5) Thermo-mechanical effects were not considered. In the host rock surrounding of magmatic intrusions, temperature increase leads to thermal expansion and boiling of pore fluids (Schofield et al., 2010). This can result in pore fluid overpressure, host rock fluidization and hydrofracturing. Such processes cannot be simulated in the experimental approach shown here (Montanari et al., 2017).
4.4 Comparison of Structures with Previous Modelling Studies
Consistent with our observations, previous quasi-2D experiments using a water tank apparatus (5 cm wide) containing an overpressured reservoir under gelatine-saturated sand (Bureau et al., 2014) also reproduced the development of forced folds associated with wing fractures. Accordingly, wing fractures originate at positions of maximum extensional strain in the bending overburden. However, their observations imply that wing fractures only propagate due to tension and not in a combination of tensile and shear strain as in our experiments. This difference can be attributed to a higher strength (cohesion of up to 1500 Pa) and thickness (8–20 cm) of the overburden in the models of Bureau et al. (2014), which likely prevents flank uplift and shear failure.
Mourgues et al. (2012) used a 2D configuration and widely dispersed air stream in combination with a point-like air injection into fine grained powder to trigger the formation of conical fracture patterns originating from a sub-vertical hydro-fracture above the injection point. Similar dykes and conical fractures were observed in experiments simulating magmatic intrusions by injecting a viscous liquid (e.g. oil, syrup) into fine-grained powder (e.g. Mathieu et al., 2008; Abdelmalak et al., 2012; Galland, 2012; Poppe et al., 2019). The resulting Y-shaped network of fractures or intrusion, respectively, are similar to the Y-shaped wing fracture system in our experiments, although the initiation processes are different. In the studies mentioned above, the initial vertical fracture formed by hydro-fracturing emerged from the point source of the overpressure and translated to inclined fractures at a certain depth. In our experiments, the initial sub-vertical wing fracture resulted from bending at the base of the fold limbs. The surficial breakthrough of the fractures, in contrast, was similar in both experimental approaches. A triangular block of the cover was uplifted associated with shear and tensile fracturing (e.g. Abdelmalak et al., 2012; Mourgues et al., 2012; Poppe et al., 2019).
In 3D experiments using widely distributed streaming air through granular materials, Rodrigues et al. (2009) compared a homogeneous cover layer (their Experiment 4, silica powder, 10 cm thick, cohesion = ∼300 Pa) with a multi-layered cover (their Experiment 5, silica powder interlayered with quartz sand, 5 cm thick). Internal structures derived from cut cross sections revealed that dominantly horizontal fractures formed in different levels of the homogeneous cover layer, whereas no wing fractures could be observed. These structures are different from sub-vertical bending and shear fractures produced in our experiments, which might result from the higher density (1200 kg m−3) of the cover material used by Rodrigues et al. (2009). The multi-layered experiment of Rodrigues et al. (2009) shows folding of the uppermost low-permeable layer as well as dominantly vertical fractures in the high-cohesive interlayers, similar to the tensile crestal fractures in our experiments (e.g. Figure 6A). This similarity suggests that forced folding and initial tensile fracturing is the dominant deformation mechanism in overpressured layered sequences with high-cohesive interlayers.
Several analog and numerical models of magmatic and sand intrusion emphasize the effect of the cohesion of the cover layer on fracture modes and the geometry of the forced folds (May et al., 2019; Poppe et al., 2019; Schmiedel et al., 2019; Meng and Hodgetts, 2020). These studies revealed that the forced fold is wider and higher, if the cohesion is larger. Furthermore, the cover is bent upwards and tensile wing fractures open at the base of the cover similar as in our experiments. Numerical models by Meng and Hodgetts (2020) demonstrate the evolution of first tensile and subsequent shear failure dominated deformation of the wing fractures and are therefore in good agreement with our modelling results. If the cohesion is relatively low, in contrast, the cover is vertically displaced due to inflation of the underlying sand or magmatic intrusion. In such a scenario, the uplifted block is mainly bounded by sub-vertical shear zones and its crest is dissected by sets of normal and reverse faults (Meng and Hodgetts, 2020). Hence, the main difference is that initial fracture failure is dominated by shearing in case of a low cohesive cover and by dilatation in case of a high-cohesive cover layer.
Similar relationships are determined from analog models on magmatic sill intrusions using fluids with a higher viscosity than pressurized air (10–5 Pas), such as silicone, glycerine, honey, oil (101–104 Pas) (Acocella et al., 2001; Mathieu et al., 2008; Galland et al., 2018b). Independent of the used experimental fluid, a high-cohesive host rock material (e.g. powders of silica diatomite or ignimbrite) dominantly fails by tensions at the outer edges of the intruding sill or inclined dyke, whereas a low-cohesive material (e.g. quartz sand) fails by shear and reverse faults (Figure 14A) (Mathieu et al., 2008; Abdelmalak et al., 2012; Montanari et al., 2017; Galland et al., 2018b; Poppe et al., 2019). The viscosity of the fluid affects the width of the forced fold and the emplacement mode of the intrusion (Mathieu et al., 2008). If the injected fluid has a relatively low viscosity, saucer-shaped sills with rather wide forced folds form. If the injected fluid has a relatively high viscosity, resurgent blocks bounded by sub-vertical reverse faults develop (Acocella et al., 2001; Montanari et al., 2017; Galland et al., 2018b). This suggests that our experimental results are best applicable to structures formed by low-viscous intrusions (i.e. fluidized sand, low-viscous magma).
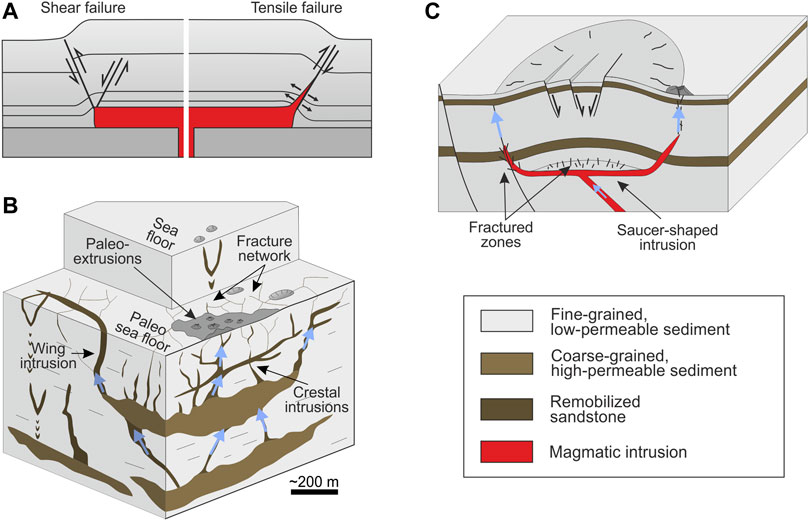
FIGURE 14. (A) Sketch illustrating the failure modes in host rocks at the tips of propagating magmatic sills (modified from Wilson et al., 2016; Haug et al., 2018). Plastic shear failure (left) dominantly occurs in low-cohesive host rocks. Elasto-plastic tensile-shear failure (right) mainly takes place in high-cohesive host rocks. (B) Schematic block diagram of a sand injection complex, which can generally be observed in outcrop and reflection seismic data (modified from Hurst et al., 2003). (C) Schematic diagram showing the influence of magmatic intrusion related forced folds on the fluid system (e.g. Magee et al., 2017b).
Using numerical models, Haug et al. (2018) revealed that the failure mode at the tip of propagating sills also depends on the ratio between sill radius (R) and intrusion depth (H) (equivalent to overburden thickness). Shear failure is favoured for small ratios (R/H < 1), whereas tensile failure occurs if the ratio is high (R/H > 5) and the host rock cohesion is relatively large. In experiments shown in the study presented here as well as in Warsitzka et al. (2019), the half-width of the forced fold might be used as equivalent to the sill radius. The width of the fold is generally larger, if the cover layer is thicker (Warsitzka et al., 2019). Taking into account the experiments in Warsitzka et al. (2019) and exp. 1A and 2A of this study, the ratio R/H varies between 1.3 and 2. Thus, initial tensile fracturing occurs at a lower R/H ratio in our models compared to the model of Haug et al. (2018). We speculate that this could be a result of the relatively high cohesion in relation to the viscosity of the fluid.
4.5 Implication for Natural Fracture Systems
Scale and complexity of fracture patterns induced by fluid overpressure are often not sufficiently resolved in seismic data or not accessible in surface outcrops. However, fracture patterns play a major role in localization of fluid flow in sedimentary basins (e.g. Walsh et al., 1998; Faulkner et al., 2010; Senger et al., 2017) and, thus, are important for hydrocarbon reservoirs, diagenetic ore deposits, and geotechnical fluid storage sites. Fluid injection into subsurface sedimentary formations for the production of geothermal energy or storage purposes, e.g. during CO2-storage, can lead to increased fluid pressure and changes in stress-strain-conditions resulting in uplift of the sealing formation and (re-)activation of fractures (e.g. Rutqvist, 2012; May et al., 2019). If unrecognized, such fractures can result in the widespread lateral migration of the leaked fluid in sediment layers of the overburden. Thus, detecting and monitoring such fractures during fluid injection are important for risk assessment of storage sites.
Our experimental study helps to assess the geometries, connectivities and locations of sub-seismic faults and fractures. It shows that fracture geometries and distribution are determined by the kinematics of larger forced folds, which governs the main displacement and strain components. Relatively large, widely opened fractures develop at the hinges of the folds. Emerging from these wing fractures, sets of small-to medium sized fractures develop in a V-shape region, which accommodate minor opening and shearing. Before fracture breakthrough, the region is dominated by compaction fractures. The compactive failure likely causes a reduction of the porosity, which potentially increases the sealing capacity of the region. Thus, the opening wing fractures at the base of the cover might represent potential targets for geothermal or hydrocarbon production wells. During fracture breakthrough and flank uplift, in contrast, opening and shearing along the fractures is largest. Collapse of the fold after pressure relief results in partial closure of the fractures. Nonetheless, these shear-dominated fractures are still permeable after breakthrough as suggested by the decreased air pressure in the basal chamber. Transferred to nature, such wing fractures and the surrounding damage zones in the V-shaped region might be below seismic resolution, but still permeable and potential leakage pathways for fluids from the underlying reservoir. Based on our experimental results, orientation and extent of networks of small-scale fractures can be predicted so that potential regions for further exploration and risk assessment can be defined. Spill-points of anticlinal structures thus might not only bear risks of unwanted lateral but also of vertical fluid migration out of a storage reservoir. In the following, we discuss some specific geological processes in the shallow crust (<∼1 km) leading to folding associated fracturing.
4.5.1 Fracture Patterns due to Sand Injections
Many examples of seismic and outcrop data of shallow sand remobilization (a few hundreds of meter depth) demonstrate that saucer-shaped intrusions emanate from buried sub-marine sand channels (e.g. Dixon et al., 1995; Lonergan et al., 2000; Duranti and Hurst, 2004; Huuse et al., 2004; Jackson, 2007; Szarawarska et al., 2010; Monnier et al., 2015). They are often associated with “jack-up” folds of the fine-grained overburden and wing fractures at the margins of the parent sand unit leading to saucer-shaped sand intrusion structures (Figure 14B). Localized fluid overpressure in the often isolated sand bodies can be caused by fluid influx from a lower reservoir at the top of faults or other fluid conduits (Huuse et al., 2005; Frey-Martnez et al., 2007). It is suggested that differential compaction and forced folding of the overburden strata lead to convex-up geometries above such channels (Cosgrove and Hillier, 2000; Jackson, 2007; Szarawarska et al., 2010). Our experiments suggest that pure tensile failure at the flanks of the forced fold can be the seed initiating sand intrusions. Fluid overpressure localizes in these initial wing fractures so that sand intrusions are able to propagate further.
In our experiments, wing fractures are symmetric on both sides of the initial forced fold (phase 1), whereas breakthrough to the surface always focuses on one side and leads to highly asymmetric structures, in particular in the experiments with a multilayered cover (Figures 4, 6). In contrast, wing intrusions of saucer-shaped intrusions mostly appear to be symmetrical in seismic data in terms of dip, shape and length (e.g. Duranti and Hurst, 2004; Huuse et al., 2007; Cartwright et al., 2008; Szarawarska et al., 2010). This might indicate that breakthrough and extrusion of reservoir material occurs on both sides of the forced fold. However, it is also possible that the side of breakthrough is not recognized, because small-offset, often steeply inclined shear fractures in the upper parts of the wing intrusions are below seismic resolution. This, in turn, has major implications for fluid flow, since the side of the breakthrough is permeable for fluid flow, whereas the opposite side might still be sealed. Another explanation for the structural differences between our models and natural sand injection could be the inadequate scaling of the viscosity of the mobilized and fluidized sand (see experimental limitations).
Besides saucer-shaped sand intrusions dominated by wing fractures, there are examples where sand intrusions are localized at the crest of the parent sand body (“crestal intrusion complex,” Figure 14B) (e.g Dixon et al., 1995; Briedis et al., 2007; Frey-Martnez et al., 2007; Surlyk et al., 2007). According to numerical models by Meng and Hodgetts (2020), these crestal intrusions dominantly develop, if the cover layer has a relatively low cohesion and thickness. However, crestal shear failure and extrusion of the reservoir materials also occurred in our 3D experiment 1B (Figure 5), which was preceded by radial doming of the cover layer. Thus, we suggest that crestal intrusion complexes can also evolve in high-cohesive cover layers, if the top of the sand body already forms a convex-up geometry, which can be due to, for instance, laterally differential compaction.
As described above, the sequence of forced folding and fracture breakthrough can repeat in multiple structural levels with the presence of a high-permeable interlayer in the cover. Such sequences of generations are also interpreted from outcrop studies on multilevel submarine channels embedded in mudstones (Hubbard et al., 2007; Monnier et al., 2015). Monnier et al. (2015) proposed that a sill-dyke network emerged from a lower channel body (300–400 m depth), penetrated into shallow channels (100–200 m depth) and led to sand remobilisation and hydrofracturing. During that upward propagation, the region affected by sand injections extended to as much as 1 km away from the lower sand channel. These similarities in the evolution compared to our multi-layer experiments emphasize the importance of a mechanically stratified overburden on the evolution of sand injection systems.
4.5.2 Fracture Patterns due to Magmatic Intrusions
Magma emplacement in the shallow layers of sedimentary basins takes place by the formation of a system of sheet-like, inclined and saucer-shaped sill intrusions (Figure 14C) as observed in many field studies (e.g Schofield et al., 2010; Wilson et al., 2016; Magee et al., 2017a) and in seismic data (e.g. Hansen and Cartwright, 2006; Thomson and Schofield, 2008; Jackson et al., 2013; Magee et al., 2013, 2017b; Omosanya et al., 2017; Schmiedel et al., 2017; Reeves et al., 2018; Reynolds et al., 2022). These studies show that magma inflation during sill emplacement often leads to forced folding of the overburden and extensional deformation in the stretched hinge zone. Magee et al. (2017a) present a field exposure of a shallow-level saucer-shaped intrusion, where an elliptical, dome-like uplift of the ground surface and related crestal extension prior to eruption were identified at the surface. It is suggested that growth of the dome already started centuries before present-day lava extrusion. InSAR measurements detected a few meters of ground surface uplift of the dome prior to as well as subsidence during and after a recent volcanic eruption (Magee et al., 2017a). This evolution is similar to that observed in our 3D experiments, where a long-lasting phase of fold growth associated with crestal fracturing is followed by relatively short phases of fracture breakthrough and subsidence of the fold (5C and 7C). Remarkably, volcanic eruptions took place along the margins of the dome (Magee et al., 2017a), which is different from our 3D exp. 1B but similar to exp. 2B. Likewise, other field and seismic based studies often suggest that fluid flow and magma transport mostly occurs at the marginal inclined dykes of a saucer-shaped intrusion (Figure 14C) (Thomson and Schofield, 2008; Muirhead et al., 2014; Agirrezabala, 2015; Omosanya et al., 2017; Galland et al., 2018b; Reeves et al., 2018), which then can serve as feeders for additional sills and forced folds in shallower levels (e.g. Reynolds et al., 2022). This implies that fracture breakthrough at the fold limb rather than crestal breakthrough is the dominant process for magma extrusion of saucer-shaped sills. Even though saucer-shaped magmatic intrusions and their flanking inclined dykes are rather symmetrical in profile view (similar as wing-like sand injections), seismic and analog modelling studies reveal that fracture breakthrough and vertical magma propagation is a rather asymmetric process and concentrates at one side of the saucer-shaped structure (e.g. Abdelmalak et al., 2012; Galland, 2012; Magee et al., 2013; Reynolds et al., 2022), which can cause uplift and reverse faulting at one flank of sheet intrusions, so called “trapdoor faulting” (e.g. Jónsson et al., 2005). This asymmetry of the breakthrough and extrusion process is in accordance with our experimental results.
As explained above, initial inclined dykes at the tips of propagating sills open either by shear failure or by tensile fracturing (Figure 14A) (e.g. Thomson and Schofield, 2008; Schofield et al., 2010; Magee et al., 2014; Wilson et al., 2016; Schmiedel et al., 2017; Galland et al., 2018a; Haug et al., 2018). Field examples, such as those described in detail by Muirhead et al. (2014), show that meter-scale geometries of inclined dykes are characterized by alternating segments of shear- and tensile-dominated fractures. Similar observations were made by Vétel and Cartwright, 2010 on clastic dykes from a partly exposed sand injection network. The measured opening direction was oblique to the dykes suggesting a mixed-mode shear and tensile failure of the intrusions. Our experimentally derived structures (cf. Figure 3B) indicate that such mixed-mode opening pattern can develop at the hinges of forced folds due to shear-induced propagation of fractures initially opened in tensile mode. Thus, our experimental results can help to interpret evolution of outcrop-scale fracture networks around saucer-shaped magmatic and wing-like sand intrusions, even though the air-grain mixture in our models is not scaled to magma or fluidized sand in terms of their viscosity.
The similarity of features resulting from the two processes described above suggest that our experimental results can be applied to various scales assuming that we do not rely too strictly on the defined geometrical scaling ratio of 10–4. The sequence of forced folding and fracture breakthrough can occur from shallow level sand mounds beneath cohesive fine-grained sediments (<100 m, Frey-Martnez et al., 2007) to large scale sand and magmatic intrusions (<1000 m, Jolly and Lonergan, 2002).
5 Conclusion
In this analog modeling study, we examined the influence of a homogeneous vs heterogeneous (multi-layered) cover as well as 2D vs 3D experimental configuration on the mechanisms of forced folding and associated fracturing driven by excessive fluid pressure.
(1) The structural evolution in the experiments undergoes a first phase characterized by symmetrical forced folding, the development of a network of inclined fractures at the hinges of the fold and sub-vertical crestal fractures. The initial wing fractures in the lower part of the cover layer mainly open in tensile mode, whereas the upper part of the wing fracture network is characterized by compactive failure.
(2) During the second phase, the fractures break through to the cover layer dissecting the overburden in separate blocks. These blocks are differentially uplifted, which induces dominantly shear and hybrid shear-tensile failure. The breakthrough is followed by the subsidence of the forced fold and a decrease of fluid pressure in the reservoir layer. Under most conditions, the breakthrough takes place along the wing fracture system at the hinges of the forced fold such that the previously formed tensile wing fractures are reactivated as shear fractures. Only in the 3D experiment with homogeneous cover, breakthrough occurred along the crestal fracture system. We related this behaviour to the dome-shaped forced fold under a relatively thick cover layer, whereas it is mechanically easier to fracture the crest than to uplift the fold limb.
(3) Comparison of the same layering in a quasi 2D and a 3D configuration revealed that the forced fold and region affected by fractures is wider and the critical pressure required for initiation of uplift and breakthrough are larger than in equivalent 2D experiments. This is because stresses required for bending of the cover layer are higher in the 3D experiment, because bending stresses act in all horizontal directions. Furthermore, the crestal fracture network is more complex in 3D experiments, where it is characterized by hybrid tensile-shear fractures striking in multiple directions.
(4) In experiments with a mechanically layered cover, the initial forced fold is narrower and critical pressures of folding and breakthrough are lower. This implies that resistance against bending is smaller if the cover succession contains weak interlayers. In the experiments with multilayered cover, wing fractures are more inclined and the system of wing fractures is more complex and asymmetric. Furthermore, the fractured region in the upper cover layer is significantly wider than at the top of a homogeneous cover layer. These differences between multi-layered and homogeneous cover mainly results from lateral spreading of the fluid overpressure in the intercalated high-permeable reservoir layer. Thus, it can be expected that fluid leakage can occur with considerably lateral offset away from the original overpressured fluid source.
(5) The recognition of 3D fracture patterns is crucial for understanding subsurface fluid migration in sedimentary basins. The process of forced folding, opening of tensile fractures and breakthrough by shear failure can be applied to structural evolution of different types of reservoir-overburden-systems, such as the formation of saucer-shaped sand intrusions, shallow magmatic sill to dyke transitions and underground fluid storage. Our experimentally derived observations help to interpret subsurface structures from surface fractures and vice versa. We emphasize that three-dimensional variations of the fracture patterns can be underestimated when considering only 2D cross sections.
Data Availability Statement
The datasets for this study can be found in the online repository PANGAEA Data Publisher for Earth & Environmental Science (Warsitzka et al., 2022).
Author Contributions
MW conducted and analysed the analog experiments and wrote most of this paper. NK and FM were responsible for the conception of this project and the supervision of the experiments. Furthermore, they contributed in writing the paper.
Conflict of Interest
The authors declare that the research was conducted in the absence of any commercial or financial relationships that could be construed as a potential conflict of interest.
Publisher’s Note
All claims expressed in this article are solely those of the authors and do not necessarily represent those of their affiliated organizations, or those of the publisher, the editors and the reviewers. Any product that may be evaluated in this article, or claim that may be made by its manufacturer, is not guaranteed or endorsed by the publisher.
Acknowledgments
Laboratory experiments were carried out and analysed at the University of Jena. Technical assistance in the laboratory came from S. Neugebauer-Semsch. We thank A. Goepel and D. Rebscher for discussion on the method. The DIC-analysis was done at the Institute of Geophysics of the Czech Academy of Sciences (Prague). We acknowledge the reviews by C. Magee, N. Schofield, an anonymous reviewer and the Editor J. Muirhead, whose constructive comments improved the manuscript.
References
Abdelmalak, M. M., Mourgues, R., Galland, O., and Bureau, D. (2012). Fracture Mode Analysis and Related Surface Deformation during Dyke Intrusion: Results from 2D Experimental Modelling. Earth Planet. Sci. Lett. 359-360, 93–105. doi:10.1016/j.epsl.2012.10.008
Acocella, V., Cifelli, F., and Funiciello, R. (2001). The Control of Overburden Thickness on Resurgent Domes: Insights from Analogue Models. J. Volcanol. Geotherm. Res. 111, 137–153. doi:10.1016/S0377-0273(01)00224-4
Adam, J., Urai, J. L., Wieneke, B., Oncken, O., Pfeiffer, K., Kukowski, N., et al. (2005). Shear Localisation and Strain Distribution during Tectonic Faulting – New Insights from Granular-Flow Experiments and High-Resolution Optical Image Correlation Techniques. J. Struct. Geol. 27, 283–301. doi:10.1016/j.jsg.2004.08.008
Agirrezabala, L. M. (2015). Syndepositional Forced Folding and Related Fluid Plumbing above a Magmatic Laccolith: Insights from Outcrop (Lower Cretaceous, Basque-Cantabrian Basin, Western Pyrenees). GSA Bull. 127, 982–1000. doi:10.1130/b31192.1
Briedis, N. A., Bergslien, D., Hjellbakk, A., Hill, R. E., and Moir, G. J. (2007). “Recognition Criteria, Significance to Field Performance, and Reservoir Modeling of Sand Injections in the Balder Field, North Sea,” in Sand Injectites: Implications for Hydrocarbon Exploration and Production. Editors A. Hurst, and J. A. Cartwright (Tulsa, OK: AAPG Mem.), 87, 91–102. doi:10.1306/1209853M873259
Brooke, C. M., Trimble, T. J., and Mackay, T. A. (1995). Mounded Shallow Gas Sands from the Quaternary of the North Sea: Analogues for the Formation of Sand Mounds in Deep Water Tertiary Sediments? Geol. Soc. Lond., Spec. Pub. 94, 95–101. doi:10.1144/gsl.sp.1995.094.01.08
Burchardt, S. (2008). New Insights into the Mechanics of Sill Emplacement provided by Field Observations of the Njardvik Sill, Northeast Iceland. J. Volcanol. Geotherm. Res. 173, 280–288. doi:10.1016/j.jvolgeores.2008.02.009
Bureau, D., Mourgues, R., and Cartwright, J. A. (2014). Use of a New Artificial Cohesive Material for Physical Modelling: Application to Sandstone Intrusions and Associated Fracture Networks. J. Struct. Geol. 66, 223–236. doi:10.1016/j.jsg.2014.05.024
Cartwright, J. A., Huuse, M., and Aplin, A. (2007). Seal Bypass Systems. AAPG Bull. 91, 1141–1166. doi:10.1306/04090705181
Cartwright, J. A., James, D., Huuse, M., Vetel, W., and Hurst, A. (2008). The Geometry and Emplacement of Conical Sandstone Intrusions. J. Struct. Geol. 30, 854–867. doi:10.1016/j.jsg.2008.03.012
Cobbold, P. R., and Castro, L. (1999). Fluid Pressure and Effective Stress in Sandbox Models. Tectonophysics 301, 1–19. doi:10.1016/S0040-1951(98)00215-7
Cobbold, P. R., Durand, S., and Mourgues, R. (2001). Sandbox Modelling of Thrust Wedges with Fluid-Assisted Detachments. Tectonophysics 334, 245–258. doi:10.1016/S0040-1951(01)00070-1
Cosgrove, J. W., and Hillier, R. D. (2000). Forced-fold Development within Tertiary Sediments of the Alba Field, UKCS: Evidence of Differential Compaction and Post-depositional Sandstone Remobilization. Geol. Soc. Lond., Spec. Pub. 169, 61–71.
Cruden, A. R., McCaffrey, K. J. W., and Bunger, A. P. (2017). “Geometric Scaling of Tabular Igneous Intrusions: Implications for Emplacement and Growth,” in Physical Geology of Shallow Magmatic Systems: Dykes, Sills and Laccoliths. Editors C. Breitkreuz, and S. Rocchi (Cham: Springer International Publishing), 11–38. 10.1007/11157_2017/1000. doi:10.1007/11157_2017_1000
Dixon, R. J., Schofield, K., Anderton, R., Reynolds, A. D., Alexander, R. W. S., Williams, M. C., et al. (1995). Sandstone Diapirism and Clastic Intrusion in the Tertiary Submarine Fans of the Bruce-Beryl Embayment, Quadrant 9, UKCS. Geol. Soc. Lond., Spec. Pub. 94, 77–94. doi:10.1144/GSL.SP.1995.094.01.07
Duranti, D., and Hurst, A. (2004). Fluidization and Injection in the Deep-Water Sandstones of the Eocene Alba Formation (UK North Sea). Sedimentology 51, 503–529. doi:10.1111/j.1365-3091.2004.00634.x
Faulkner, D. R., Jackson, C. A. L., Lunn, R. J., Schlische, R. W., Shipton, Z. K., Wibberley, C. A. J., et al. (2010). A Review of Recent Developments Concerning the Structure, Mechanics and Fluid Flow Properties of Fault Zones. J. Struct. Geol. 32, 1557–1575. doi:10.1016/j.jsg.2010.06.009
Ferrill, D. A., Smart, K. J., and Morris, A. P. (2020). Fault Failure Modes, Deformation Mechanisms, Dilation Tendency, Slip Tendency, and Conduits V. Seals. Geol. Soc. Lond. Spec. Publ. 496, 75–98. doi:10.1144/SP496-2019-7
Frey-Martnez, J., Cartwright, J., Hall, B., and Huuse, M. (2007). “Clastic Intrusion at the Base of Deep-Water Sands: A Trap-Forming Mechanism in the Eastern Mediterranean,” in Sand Injectites: Implications for Hydrocarbon Exploration and Production. Editors A. Hurst, and J. A. Cartwright (Tulsa, OK: AAPG Mem.), 87, 49–63. doi:10.1306/1209849M873255
Galland, O., Bertelsen, H. S., Eide, C. H., Guldstrand, F., Haug, Ø., Leanza, H. A., et al. (2018a). “Chapter 5 - Storage and Transport of Magma in the Layered Crust—Formation of Sills and Related Flat-Lying Intrusions,” in Volcanic and Igneous Plumbing Systems. Editor S. Burchardt (Elsevier), 113–138. doi:10.1016/B978-0-12-809749-6.00005-4
Galland, O., Burchardt, S., Hallot, E., Mourgues, R., and Bulois, C. (2014). Dynamics of Dikes versus Cone Sheets in Volcanic Systems. J. Geophys. Res. Solid Earth 119, 6178–6192. doi:10.1002/2014JB011059
Galland, O. (2012). Experimental Modelling of Ground Deformation Associated with Shallow Magma Intrusions. Earth Planet. Sci. Lett. 317, 145–156. doi:10.1016/j.epsl.2011.10.017
Galland, O., Holohan, E., van Wyk de Vries, B., and Burchardt, S. (2018b). “Laboratory Modelling of Volcano Plumbing Systems: A Review,” in Physical Geology of Shallow Magmatic Systems: Dykes, Sills and Laccoliths. Editors C. Breitkreuz, and S. Rocchi (Cham: Springer International Publishing), 147–214. doi:10.1007/11157_2015_9
Galland, O., and Scheibert, J. (2013). Analytical Model of Surface Uplift above Axisymmetric Flat-Lying Magma Intrusions: Implications for Sill Emplacement and Geodesy. J. Volcanol. Geotherm. Res. 253, 114–130. doi:10.1016/j.jvolgeores.2012.12.006
Galland, O., Schmiedel, T., Bertelsen, H., Guldstrand, F., Haug, Ø. T., and Souche, A. (2018c). “Geomechanical Modeling of Fracturing and Damage Induced by Igneous Intrusions: Implications for Fluid Flow in Volcanic Basins,” in Proceedings of the X Congreso de Exploración y Desarrollo de Hidrocarburos, Mendoza, Argentina, 5–9 November (Mendoza, Argentina: Instituto Argentino del Petróleo y el Gas), 1–16.
Goulty, N. R., and Schofield, N. (2008). Implications of Simple Flexure Theory for the Formation of Saucer-Shaped Sills. J. Struct. Geol. 30, 812–817. doi:10.1016/j.jsg.2008.04.002
Gressier, J.-B., Mourgues, R., Bodet, L., Matthieu, J.-Y., Galland, O., and Cobbold, P. (2010). Control of Pore Fluid Pressure on Depth of Emplacement of Magmatic Sills: An Experimental Approach. Tectonophysics 489, 1–13. doi:10.1016/j.tecto.2010.03.004
Guldstrand, F., Burchardt, S., Hallot, E., and Galland, O. (2017). Dynamics of Surface Deformation Induced by Dikes and Cone Sheets in a Cohesive Coulomb Brittle Crust. J. Geophys. Res. Solid Earth 122, 8511–8524. doi:10.1002/2017JB014346
Hansen, D. M., and Cartwright, J. A. (2006). The Three-Dimensional Geometry and Growth of Forced Folds above Saucer-Shaped Igneous Sills. J. Struct. Geol. 28, 1520–1535. doi:10.1016/j.jsg.2006.04.004
Haug, Ø., Galland, O., Souloumiac, P., Souche, A., Guldstrand, F., Schmiedel, T., et al. (2018). Shear versus Tensile Failure Mechanisms Induced by Sill Intrusions: Implications for Emplacement of Conical and Saucer-Shaped Intrusions. J. Geophys. Res. Solid Earth 123, 3430–3449. doi:10.1002/2017JB015196
Hubbard, S. M., Romans, B. W., and Graham, S. A. (2007). “An Outcrop Example of Large-Scale Conglomeratic Intrusions Sourced from Deep-Water Channel Deposits, Cerro Toro Formation, Magallanes Basin, Southern Chile,” in Sand Injectites: Implications for Hydrocarbon Exploration and Production. Editors A. Hurst, and J. A. Cartwright (Tulsa, OK: AAPG Mem.), 87, 199–207. doi:10.1306/1209863M873265
Hurst, A., Cartwright, J. A., Huuse, M., Jonk, R., Schwab, A., Duranti, D., et al. (2003). Significance of Large-Scale Sand Injectites as Long-Term Fluid Conduits: Evidence from Seismic Data. Geofluids 3, 263–274. doi:10.1046/j.1468-8123.2003.00066.x
Huuse, M., Cartwright, J. A., Gras, R., and Hurst, A. (2005). Kilometre-scale Sandstone Intrusions in the Eocene of the Outer Moray Firth (UK North Sea): Migration Paths, Reservoirs and Potential Drilling Hazards. Geol. Soc. Lond. Pet. Geol. Conf. Ser. 6, 1577–1594. doi:10.1144/0061577
Huuse, M., Cartwright, J. A., Hurst, A., and Steinsland, N. (2007). “Seismic Characterization of Large-Scale Sandstone Intrusions,” in Sand Injectites: Implications for Hydrocarbon Exploration and Production. Editors A. Hurst, and J. A. Cartwright (Tulsa, OK: AAPG Mem.), 87, 21–35. doi:10.1306/1209847M873253
Huuse, M., Duranti, D., Steinsland, N., Guargena, C. G., Prat, P., Holm, K., et al. (2004). Seismic Characteristics of Large-Scale Sandstone Intrusions in the Paleogene of the South Viking Graben, UK and Norwegian North Sea. Geol. Soc. Lond. Memoirs 29, 263–278. doi:10.1144/gsl.mem.2004.029.01.25
Jackson, C. A.-L., Huuse, M., and Barber, G. P. (2011). Geometry of Winglike Clastic Intrusions Adjacent to a Deep-Water Channel Complex: Implications for Hydrocarbon Exploration and Production. AAPG Bull. 95, 559–584. doi:10.1306/09131009157
Jackson, C. A.-L. (2007). “The Geometry, Distribution and Development of Clastic Injectites in Deep-Marine Depositional Systems: Examples from the Late Cretaceous Kyrre Formation, Måløy Slope, Norwegian Margin,” in Sand Injectites: Implications for Hydrocarbon Exploration and Production: AAPG Mem. Editors A. Hurst, and J. A. Cartwright (Tulsa, OK: AAPG Mem.), 87, 37–48. doi:10.1306/1209848M873254
Jackson, C. A. L., Schofield, N., and Golenkov, B. (2013). Geometry and Controls on the Development of Igneous Sill–Related Forced Folds: A 2-D Seismic Reflection Case Study from Offshore Southern Australia. GSA Bulletin 125, 1874–1890. doi:10.1130/B30833.1
Jolly, R. J. H., and Lonergan, L. (2002). Mechanisms and Controls on the Formation of Sand Intrusions. J. Geol. Soc. 159, 605–617. doi:10.1144/0016-764902-025
Jónsson, S., Zebker, H., and Amelung, F. (2005). On Trapdoor Faulting at Sierra Negra Volcano, Galápagos. J. Volcanol. Geotherm. Res. 144, 59–71. doi:10.1016/j.jvolgeores.2004.11.029
Kavanagh, J. L., Rogers, B. D., Boutelier, D., and Cruden, A. R. (2017). Controls on Sill and Dyke-Sill Hybrid Geometry and Propagation in the Crust: The Role of Fracture Toughness. Tectonophysics 698, 109–120. doi:10.1016/j.tecto.2016.12.027
Lohrmann, J., Kukowski, N., Adam, J., and Oncken, O. (2003). The Impact of Analogue Material Properties on the Geometry, Kinematics, and Dynamics of Convergent Sand Wedges. J. Struct. Geol. 25, 1691–1711. doi:10.1016/S0191-8141(03)00005-1
Lonergan, L., Lee, N., Johnson, H. D., Cartwright, J. A., and Jolly, R. J. H. (2000). “Remobilisation and Injection in Deepwater Depositional Systems: Implications for Reservoir Architecture and Prediction,” in GCSSEPM Foundation 20th Ammual Research Conference Deep-Water Reservoirs of the World, 516–532. doi:10.5724/gcs.00.15.0515
Magee, C., Bastow, I. D., van Wyk de Vries, B., Jackson, C. A.-L., Hetherington, R., Hagos, M., et al. (2017a). Structure and Dynamics of Surface Uplift Induced by Incremental Sill Emplacement. Geology 45, 431–434. doi:10.1130/G38839.1
Magee, C., Briggs, F., and Jackson, C. A. L. (2013). Lithological Controls on Igneous Intrusion-Induced Ground Deformation. J. Geol. Soc. 170, 853–856. doi:10.1144/jgs2013-029
Magee, C., Hoggett, M., Jackson, C. A.-L., and Jones, S. M. (2019). Burial-related Compaction Modifies Intrusion-Induced Forced Folds: Implications for Reconciling Roof Uplift Mechanisms Using Seismic Reflection Data. Front. Earth Sci. 7, 37. doi:10.3389/feart.2019.00037
Magee, C., Jackson, C. A.-L., Hardman, J. P., and Reeve, M. T. (2017b). Decoding Sill Emplacement and Forced Fold Growth in the Exmouth Sub-basin, Offshore Northwest Australia: Implications for Hydrocarbon Exploration. Interpretation 5, SK11–SK22. doi:10.1190/INT-2016-0133.1
Magee, C., Jackson, C. A.-L., and Schofield, N. (2014). Diachronous Sub-volcanic Intrusion along Deep-Water Margins: Insights from the Irish Rockall Basin. Basin Res. 26, 85–105. doi:10.1111/bre.12044
Mandl, G. (2000). Faulting in Brittle Rocks – an Introduction to the Mechanics of Tectonic Faults. Springer-Verlag Berlin Heidelberg.
Mathieu, L., De Vries, B. V. W., Holohan, E. P., and Troll, V. R. (2008). Dykes, Cups, Saucers and Sills: Analogue Experiments on Magma Intrusion into Brittle Rocks. Earth Planet. Sci. Lett. 271, 1–13. doi:10.1016/j.epsl.2008.02.020
May, F., Warsitzka, M., and Kukowski, N. (2019). Analogue Modelling of Leakage Processes in Unconsolidated Sediments. Int. J. Greenh. Gas Control 90, 102805. doi:10.1016/j.ijggc.2019.102805
Meng, Q., and Hodgetts, D. (2020). Forced Folding and Fracturing Induced by Differential Compaction during Post-depositional Inflation of Sandbodies: Insights from Numerical Modelling. Mar. Petroleum Geol. 112, 104052. doi:10.1016/j.marpetgeo.2019.104052
Merle, O. (2015). The Scaling of Experiments on Volcanic Systems. Front. Earth Sci. 3, 26. doi:10.3389/feart.2015.00026
Monnier, D., Gay, A., Imbert, P., Cavailhes, T., Soliva, R., and Lopez, M. (2015). Sand Injectites Network as a Marker of the Palaeo–Stress Field, the Structural Framework and the Distance to the Sand Source: Example in the Vocontian Basin, SE France. J. Struct. Geol. 79, 1–18. doi:10.1016/j.jsg.2015.07.001
Montanari, D., Bonini, M., Corti, G., Agostini, A., and Del Ventisette, C. (2017). Forced Folding above Shallow Magma Intrusions: Insights on Supercritical Fluid Flow from Analogue Modelling. J. Volcanol. Geotherm. Res. 345, 67–80. doi:10.1016/j.jvolgeores.2017.07.022
Mourgues, R., Bureau, D., Bodet, L., Gay, A., and Gressier, J. (2012). Formation of Conical Fractures in Sedimentary Basins: Experiments Involving Pore Fluids and Implications for Sandstone Intrusion Mechanisms. Earth Planet. Sci. Lett. 313, 67–78. doi:10.1016/j.epsl.2011.10.029
Mourgues, R., and Cobbold, P. R. (2003). Some Tectonic Consequences of Fluid Overpressures and Seepage Forces as Demonstrated by Sandbox Modelling. Tectonophysics 376, 75–97. doi:10.1016/S0040-1951(03)00348-2
Mourgues, R., Gressier, J. B., Bodet, L., Bureau, D., and Gay, A. (2011). Basin Scale” versus “Localized” Pore Pressure/stress Coupling – Implications for Trap Integrity Evaluation. Mar. Pet. Geol. 28, 1111–1121. doi:10.1016/j.marpetgeo.2010.08.007
Muirhead, J. D., Airoldi, G., White, J. D. L., and Rowland, J. V. (2014). Cracking the Lid: Sill-Fed Dikes Are the Likely Feeders of Flood Basalt Eruptions. Earth Planet. Sci. Lett. 406, 187–197. doi:10.1016/j.epsl.2014.08.036
Omosanya, K. O., Johansen, S. E., Eruteya, O. E., and Waldmann, N. (2017). Forced Folding and Complex Overburden Deformation Associated with Magmatic Intrusion in the Vøring Basin, Offshore Norway. Tectonophysics 706, 14–34. doi:10.1016/j.tecto.2017.03.026
Parize, O., Beaudoin, B., Champanhet, J.-M., Fris, G., Imbert, P., Labourdette, R., et al. (2007). “A Methodological Approach to Clastic Injectites: From Field Analysis to Seismic Modeling – Examples of the Vocontian Aptian and Albian Injectites (Southeast France),” in Sand Injectites: Implications for Hydrocarbon Exploration and Production. Editors A. Hurst, and J. A. Cartwright (Tulsa, OK: AAPG Mem.), 87, 173–183. doi:10.1306/1209858M871101
Pollard, D. D., and Johnson, A. M. (1973). Mechanics of Growth of Some Laccolithic Intrusions in the Henry Mountains, Utah, II: Bending and Failure of Overburden Layers and Sill Formation. Tectonophysics 18, 311–354. doi:10.1016/0040-1951(73)90051-6
Polteau, S., Mazzini, A., Galland, O., Planke, S., and Malthe-Sørenssen, A. (2008). Saucer-shaped Intrusions: Occurrences, Emplacement and Implications. Earth Planet. Sci. Lett. 266, 195–204. doi:10.1016/j.epsl.2007.11.015
Poppe, S., Holohan, E. P., Galland, O., Buls, N., Van Gompel, G., Keelson, B., et al. (2019). An inside Perspective on Magma Intrusion: Quantifying 3D Displacement and Strain in Laboratory Experiments by Dynamic X-Ray Computed Tomography. Front. Earth Sci. 7, 1–20. doi:10.3389/feart.2019.00062
Price, N. J., and Cosgrove, J. W. (1990). Analysis of Geological Structures. Cambridge University Press.
Reeves, J., Magee, C., and Jackson, C. A.-L. (2018). Unravelling Intrusion-Induced Forced Fold Kinematics and Ground Deformation Using 3D Seismic Reflection Data. Volcanica 1, 1–17. doi:10.30909/vol.01.01.0117
Reynolds, P., Holford, S., Schofield, N., and Ross, A. (2022). 3D Seismic Reflection Constraints on the Emplacement of Mafic Laccoliths and Their Role in Shallow Crustal Magma Transport: A Case Study from the Ceduna Sub-basin, Great Australian Bight. Mar. Petroleum Geol. 135, 105419. doi:10.1016/j.marpetgeo.2021.105419
Rodrigues, N., Cobbold, P. R., and Løseth, H. (2009). Physical Modelling of Sand Injectites. Tectonophysics 474, 610–632. doi:10.1016/j.tecto.2009.04.032
Rutqvist, J. (2012). The Geomechanics of Co2 Storage in Deep Sedimentary Formations. Geotechnical Geol. Eng. 30, 525–551. doi:10.1007/s10706-011-9491-0
Schmiedel, T., Galland, O., and Breitkreuz, C. (2017). Dynamics of Sill and Laccolith Emplacement in the Brittle Crust: Role of Host Rock Strength and Deformation Mode. J. Geophys. Res. Solid Earth 122, 8860–8871. doi:10.1002/2017jb014468
Schmiedel, T., Galland, O., Haug, Ø., Dumazer, G., and Breitkreuz, C. (2019). Coulomb Failure of Earth’s Brittle Crust Controls Growth, Emplacement and Shapes of Igneous Sills, Saucer-Shaped Sills and Laccoliths. Earth Planet. Sci. Lett. 510, 161–172. doi:10.1016/j.epsl.2019.01.011
Schofield, N., Stevenson, C., and Reston, T. (2010). Magma Fingers and Host Rock Fluidization in the Emplacement of Sills. Geology 38, 63–66. doi:10.1130/G30142.1
Senger, K., Millett, J., Planke, S., Ogata, K., Eide, C. H., Festøy, M., et al. (2017). Effects of Igneous Intrusions on the Petroleum System: a Review. First Break 35. doi:10.3997/1365-2397.2017011
Shoulders, S. J., and Cartwright, J. A. (2004). Constraining the Depth and Timing of Large-Scale Conical Sandstone Intrusions. Geology 32, 661–664. doi:10.1130/G20654.1
Shoulders, S. J., Cartwright, J. A., and Huuse, M. (2007). Large-scale Conical Sandstone Intrusions and Polygonal Fault Systems in Tranche 6, Faroe-Shetland Basin. Mar. Petroleum Geol. 24, 173–188. doi:10.1016/j.marpetgeo.2006.12.001
Smart, K. J., Ofoegbu, G. I., Morris, A. P., McGinnis, R. N., and Ferrill, D. A. (2014). Geomechanical Modeling of Hydraulic Fracturing: Why Mechanical Stratigraphy, Stress State, and Pre-existing Structure matterGeomechanical Modeling of Hydraulic Fracturing. AAPG Bull. 98, 2237–2261. doi:10.1306/07071413118
Surlyk, F., Gjelberg, J., and Noe-Nygaard, N. (2007). “The Upper Jurassic Hareelv Formation of East Greenland: A Giant Sedimentary Injection Complex,” in Sand Injectites: Implications for Hydrocarbon Exploration and Production. Editors A. Hurst, and J. A. Cartwright (Tulsa, OK: AAPG Mem.), 87, 141–149. doi:10.1306/1209858M871101
Szarawarska, E., Huuse, M., Hurst, A., De Boer, W., Lu, L., Molyneux, S., et al. (2010). Three-dimensional Seismic Characterisation of Large-Scale Sandstone Intrusions in the Lower Palaeogene of the North Sea: Completely Injected vs. In Situ Remobilised Sandbodies. Basin Res. 22, 517–532. doi:10.1111/j.1365-2117.2010.00469.x
Thomson, K., and Schofield, N. (2008). Lithological and Structural Controls on the Emplacement and Morphology of Sills in Sedimentary Basins. Geol. Soc. Lond. Spec. Publ. 302, 31–44. doi:10.1144/SP302.3
Vétel, W., and Cartwright, J. A. (2010). Emplacement Mechanics of Sandstone Intrusions: Insights from the Panoche Giant Injection Complex, California. Basin Res. 22, 783–807. doi:10.1111/j.1365-2117.2009.00439.x
Vigorito, M., and Hurst, A. (2010). Regional Sand Injectite Architecture as a Record of Pore-Pressure Evolution and Sand Redistribution in the Shallow Crust: Insights from the Panoche Giant Injection Complex, California. J. Geol. Soc. 167, 889–904. doi:10.1144/0016-76492010-004
Walsh, J. J., Watterson, J., Heath, A., Gillespie, P. A., and Childs, C. (1998). Assessment of the Effects of Sub-seismic Faults on Bulk Permeabilities of Reservoir Sequences. Geol. Soc. Lond. Spec. Publ. 127, 99–114. doi:10.1144/GSL.SP.1998.127.01.08
Warsitzka, M., Kukowski, N., and May, F. (2022). Analog Laboratory Experiments of Fracture Networks Formed Due to Forced Folding and Pore Fluid Overpressure. PANGAEA. doi:10.1594/PANGAEA.944712
Warsitzka, M., Kukowski, N., and May, F. (2019). The Formation of Forced Folds and Wing-Like Sand Intrusions Driven by Pore Fluid Overpressure: Implications from 2-D Experimental Modeling. J. Geophys. Res. Solid Earth 124, 12277–12303. doi:10.1029/2019JB018120
Williams, K. M., Kavanagh, J. L., and Dennis, D. J. C. (2022). Focused Flow during the Formation and Propagation of Sills: Insights from Analogue Experiments. Earth Planet. Sci. Lett. 584, 117492. doi:10.1016/j.epsl.2022.117492
Wilson, P. I. R., McCaffrey, K. J. W., Wilson, R. W., Jarvis, I., and Holdsworth, R. E. (2016). Deformation Structures Associated with the Trachyte Mesa Intrusion, Henry Mountains, Utah: Implications for Sill and Laccolith Emplacement Mechanisms. J. Struct. Geol. 87, 30–46. doi:10.1016/j.jsg.2016.04.001
Keywords: forced folding, shear failure, tensile failure, failure mode, fluid overpressure, analog modeling, digital image correlation, fracture analysis
Citation: Warsitzka M, Kukowski N and May F (2022) Patterns and Failure Modes of Fractures Resulting From Forced Folding of Cohesive Caprocks – Comparison of 2D vs. 3D and Single-vs. Multi-Layered Analog Experiments. Front. Earth Sci. 10:881134. doi: 10.3389/feart.2022.881134
Received: 22 February 2022; Accepted: 10 June 2022;
Published: 07 July 2022.
Edited by:
James D Muirhead, The University of Auckland, New ZealandReviewed by:
Craig Magee, University of Leeds, United KingdomBen Matthew Kennedy, University of Canterbury, New Zealand
Copyright © 2022 Warsitzka, Kukowski and May. This is an open-access article distributed under the terms of the Creative Commons Attribution License (CC BY). The use, distribution or reproduction in other forums is permitted, provided the original author(s) and the copyright owner(s) are credited and that the original publication in this journal is cited, in accordance with accepted academic practice. No use, distribution or reproduction is permitted which does not comply with these terms.
*Correspondence: Michael Warsitzka, warsitzka@ig.cas.cz